 Gokhan Kirkil
- Department of Civil Engineering, Kadir Has University, Istanbul, Türkiye
This study investigates the relationship between classroom thermal environment and student learning performance in a controlled university setting using Arduino-based temperature and humidity sensors. The experiment was conducted over 2 weeks with 53 undergraduate students at controlled temperatures of 20 °C and 27 °C. Results demonstrate significant correlations between student thermal satisfaction, GPA, and learning outcomes. Multiple regression analysis reveals that thermal environment satisfaction and student GPA together account for 23.15% of the variance in student grades (p < 0.001). Students reporting higher thermal satisfaction achieved better exam performance and maintained higher motivation levels. The study employed a 5-point Likert scale questionnaire to assess thermal perception and learning motivation. While limitations include the absence of mean radiant temperature measurements and short study duration, findings suggest that maintaining optimal classroom thermal conditions (20 °C–22 °C) is crucial for academic performance. The sensor-based monitoring system proved effective for real-time thermal environment assessment in educational settings.
1 Introduction
The thermal environment in educational facilities represents a critical intersection of energy efficiency, operational costs, and academic outcomes. With growing global emphasis on sustainable building practices and energy conservation, educational institutions face increasing pressure to optimize HVAC systems while maintaining conducive learning environments. The relationship between classroom thermal conditions and student performance has significant implications for both educational policy and building design standards.
Despite extensive research on thermal comfort in various settings, significant gaps remain in understanding the quantitative relationship between classroom thermal satisfaction and academic performance in university environments. Most existing studies rely on subjective assessments without real-time environmental monitoring or fail to establish clear correlations between thermal conditions and measurable learning outcomes. Furthermore, limited research has explored cost-effective monitoring solutions such as Arduino-based systems for continuous classroom environment assessment. This study addresses these gaps by providing quantitative analysis of the relationship between controlled thermal conditions and student academic performance using accessible monitoring technology.
The thermal environment of a classroom has a significant impact on the learning performance and overall well-being of students. Numerous studies have investigated the relationship between indoor air temperature, thermal comfort, and students’ academic achievement, highlighting the need for maintaining optimal classroom conditions to support effective learning (Jiang et al., 2021; González-Lezcano, 2023; Ma et al., 2023; Ma et al., 2025). Additional research from Taiwan, India, and other regions has demonstrated the importance of thermal comfort in diverse climatic contexts (Cao et al., 2011; Cheng et al., 2008; Hwang et al., 2006; Kumar et al. 2018).
Research has shown that a comfortable thermal environment is crucial for students’ cognitive function and academic performance. Experiments conducted in controlled settings have demonstrated that changes in indoor air temperature can directly affect students’ thermal perception, satisfaction, and ultimately, their ability to focus and learn effectively. Specifically, studies have found that students perform better on cognitive tasks and exhibit higher engagement levels when the classroom temperature is within the recommended range of 20 °C–22 °C (Wargocki and Wyon, 2013; Fang et al., 2018; Jung et al., 2011; Singh et al., 2018).
Conversely, when classroom temperatures stray from the optimal range, either due to inadequate heating or cooling, students’ learning performance can be significantly impacted. For instance, a study in South Africa found that learners in classrooms with poor temperature regulation felt tired, had low concentration, and experienced drowsiness during the school day (Pule et al., 2021).
Effect of temperature on learning in classroom environment is reported in several studies (Seppanen et al., 2006). One of the main conclusions from these studies is classroom temperature affects human psychology and perception. It has been shown that when the temperature rises above normal, the decision making process is affected and there is an uncomfortable environment in the classroom. Specifically, studies have shown that students perform better on cognitive tasks and exhibit higher engagement levels when the classroom temperature is within the recommended range of 20 °C–22 °C.
In schools with poor temperature regulation, such as those with natural ventilation and inadequate insulation, temperature fluctuations can lead to increased student absenteeism (Pule et al., 2021). Similar findings have been documented in naturally ventilated classrooms in Beijing, subtropical regions, Taiwan, and India (Cao et al., 2011; Zhang et al., 2007; Hu et al., 2006; Hwang et al., 2006). A Johannesburg study found that learners felt tired, had low concentration, and felt sleepy when temperatures were hot during the school day, demonstrating the negative impact of poor thermal conditions on learning performance (Pule et al., 2021).
Yang et al. (2013) found out that student perceptions of learning environments highly relied on spatial attributes (such as room layout and furniture) and ambient attributes (such as temperature and furniture) and ambient attributes (such as temperature and air quality). In general, research shows that students perform better and have higher attendance rates when classrooms have comfortable thermal conditions, indicating the need for maintaining optimal indoor temperatures to support effective learning (Pule et al., 2021; Wargocki and Wyon, 2013; Wang et al., 2018; Earthman, 2002). Fong et al. (2015) measured the thermal conditions and energy use at three ventilation levels and six exhaust conditions and concluded that the thermal comfort is not affected only by temperature and air flow supply but also ventilation strategies. Thermal comfort and academic performance are closely linked, and schools should strive to provide a learning environment that meets the thermal comfort needs of students.
Krüger and Zannin (2004) concluded that there is a strong dependence of comfort level on indoor environmental factors, such as acoustic, thermal and luminous levels. They also showed that outdoor environment has some effect on the built environment. Buratti and Ricciardi (2009) measured the correlation between operative temperature and uniform equivalent temperature in university classrooms and found good agreement between measurements and the models in the literature. Zaki et al. (2017) investigated the thermal comfort in university classrooms in Malaysia and Japan. Mean comfort temperatures are found which differed between two countries in air-conditioned and no air-conditioned modes. Mishra et al. (2017) investigated the thermal perception during transition to a new environment. They found out that besides thermal factors, non-thermal factors may also have an impact on how occupants evaluate indoors.
Overall, the research in this area (Kumar et al., 2018; Singh et al., 2018; Sudo et al., 2011; Buonocore et al., 2020) indicates that the thermal environment in classrooms is a critical factor affecting students’ cognitive performance, attendance, and overall academic achievement.
We have recently conducted an experimental study in Steelcase Classroom of Kadir Has University, where we measured the effects of cold and warm classroom environments on students’ learning. During the experiment, we measured the temperature and humidity of a classroom environment with high resolution temperature and humidity sensors based on Arduino. In addition to these measurements, we received some feedback from the student test group on their learning experience at low and high temperature and humidity levels using a questionnaire. In this questionnaire, we asked students several questions about their satisfaction about the classroom’s thermal environment and their in-class learning motivations. In addition, at the end of the lectures we measure their success in learning the material during the class and the thermal environment in the class, the motivation of the students and the weighted grade averages. We have investigated whether the student success in the classroom were affected by the environmental factors in the classroom, such as temperature and humidity.
This study aims to:
1. Investigate the relationship between controlled classroom temperatures (20 °C vs. 27 °C) and student thermal satisfaction and learning motivation.
2. Examine the correlation between thermal comfort perception and learning performance measured through written assessments.
3. Develop a predictive model relating thermal environment factors to academic outcomes.
4. Evaluate the effectiveness of basic sensors for classroom thermal environment monitoring.
2 Methods
2.1 Study setting and participants
The study was conducted in the Steelcase Smart Classroom at Kadir Has University over two consecutive weeks. The experimental group consisted of 53 undergraduate students (26 participants on Day 1, 27 on Day 2) aged 18–23 years with mixed gender distribution. Students were enrolled in the same course to ensure consistent academic background. No systematic screening for cultural background, physiological conditions, or clothing preferences was conducted, which may affect thermal perception variability.
Students were assigned to fixed seating positions within an 11-zone measurement grid (Figure 1). The classroom layout ensured consistent spatial positioning throughout the experiment to minimize location-based temperature variation effects.

Figure 1. Sketch of the Steelcase classroom.
2.2 Environmental monitoring system
Temperature and humidity measurements were conducted using an Arduino-based system comprising DHT11 sensor modules, ESP8266 WiFi modules, and Gobetwino software for data logging. Environmental Stability: The HVAC system was set to target temperatures 60 min prior to each session, with temperature stability confirmed within ±0.5 °C before data collection. External weather conditions were recorded to account for potential building thermal load variations. Measurement Limitations: Only temperature and humidity were measured; mean radiant temperature, air velocity, metabolic rate, and clothing insulation were not systematically assessed, representing a significant limitation in comprehensive thermal comfort evaluation.
2.3 Experimental procedure
The experiment followed a controlled temperature protocol: Week 1 maintained at 20 °C, Week 2 at 27 °C. Each session lasted 2 h with environmental measurements taken before and after lectures. At session conclusion, students completed written reflection essays and thermal comfort questionnaires while maintaining their assigned seating positions.
2.4 Data collection instruments
The impact of the thermal environment on learning and the state of the classroom’s thermal environment were investigated by asking survey questions to the participants of the experiment in the classroom. The first group of questions contain information about the rates of temperature and humidity, as well as their level of satisfaction with the current thermal conditions in the classroom.
The second group of questions examines their educational motivations before and after class.
We have asked six questions to students attending class under hot and cold days.
1. How would you rate the classroom temperature?
(a) Cold (b) Slightly cold (c) Normal (d) Slightly high (e) High.
2. How would you rate the classroom moisture?
(a) Cold (b) Slightly low (c) Normal (d) Slightly high (e) High.
3. Are you satisfied with the current thermal environment in the classroom?
(a) Dissatisfied (b) Slightly dissatisfied (c) Neutral (d) Slightly satisfied (e) Satisfied.
4. Before entering your classroom, how high was your motivation for learning?
(a) Very low (b) Below average (c) Average (d) Above average (e) Very high.
5. At the beginning of the lecture, did the classroom thermal condition affect your learning?
(a) Not at all (b) Slightly (c) Moderately (d) Very (e) Extremely.
6. At the end of the lecture, did the classroom thermal condition affect your learning?
(a) Not at all (b) Slightly (c) Moderately (d) Very (e) Extremely.
A 5-point Likert scale was based on established thermal comfort assessment protocols (Buratti and Ricciardi, 2009; Castilla et al., 2017; Corgnati et al., 2007; Mishra and Ramgopal, 2014a; Mishra and Ramgopal, 2014b; Nico et al., 2015). Questions were designed to assess: (1) thermal sensation, (2) humidity perception, (3) thermal satisfaction, (4) pre-class learning motivation, (5) thermal impact on learning during class, and (6) post-class thermal learning effects. These question types have been validated in prior research examining thermal comfort in educational laboratories and classrooms across multiple countries (Mishra and Ramgopal, 2014a; Mishra and Ramgopal, 2014b; Nico et al., 2015).
Formal reliability and validity testing of the questionnaire was not conducted. Cronbach’s alpha analysis and factor analysis should be performed in future studies to establish instrument reliability.
2.5 Statistical analysis methods
Correlation analyses employed Pearson’s correlation coefficient with significance threshold set at α = 0.05. Multiple regression analysis examined relationships between thermal variables, GPA, and student grades. Model assumptions including normality, homoscedasticity, and independence were evaluated through residual analysis. All statistical analyses were performed using Minitab software.
Figure 2 shows the colours of the heat indexes obtained from the gridded Arduino measurements. The classroom’s rectangular shape is shown by the plotted area, and the numbers on the x and y-axis indicate the classroom’s size in cm. The coldest regions in the classroom is shown as dark blue and are near the windows. The hottest regions, that are shown as red, are near the air conditioning and coldest regions are near the windows.

Figure 2. Heat Index measurements in the classroom; cold case on the left, hot case on the right.
2.6 Ethics statement
This study involved human participants who were undergraduate students enrolled at Kadir Has University. All participants provided written informed consent prior to the commencement of data collection. The study was conducted in accordance with the Declaration of Helsinki and local regulations concerning human subject research. Participant confidentiality and anonymity were maintained throughout the study.
3 Results
The correlation test in Minitab was employed to determine the strength and direction of the associations between the variables we believe are related (Table 1). The value in the first row denotes Pearson correlation coefficient and the second row is the P-value. All correlation and regression analyses were conducted with α = 0.05 significance threshold. P-values below 0.05 indicate statistical significance, while values between 0.05–0.10 suggest marginal significance.

Table 1. Correlations between Q1; Q2; Q3; Q4; Q5; Q6; GPA; Distance; heat index and grade.
It was observed that the student’s grade is closely correlated with student’s GPA (grade point average). Moreover, environmental variables such as classroom temperature (Q1) and whether the classroom temperature affect students’ learning (Q6) positively correlate with student’s grades.
The cross-tabulation of responses to questions 3 and 5 is given in Figure 3. Students’ learning was impacted by their satisfaction with the thermal environment.

Figure 3. Relationship between thermal environment satisfaction and student learning impact.
The students who said their learning level were highly affected by the thermal environment were dissatisfied with the thermal environment of the class. The effect of thermal environment on learning decreases when thermal environment satisfaction increases.
It has been observed that the temperature in the classroom has a positive impact on students’ motivation levels (Figure 4).
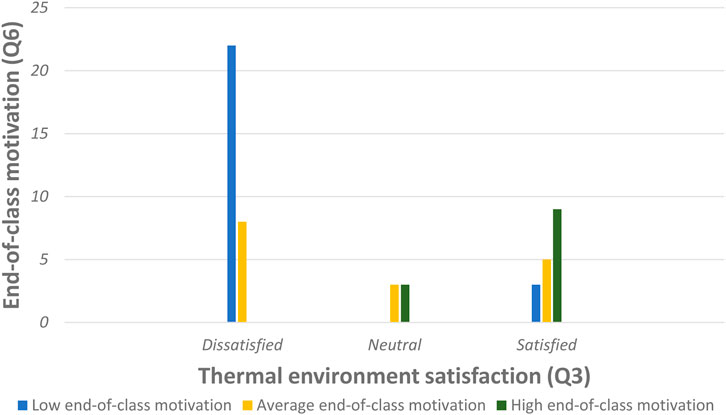
Figure 4. Thermal environment and end-of-class motivation relation.
Students who are dissatisfied with the thermal environment in the classroom are less motivated at the end of class. Students who are not affected by the thermal environment of the class have not seen any significant changes in their motivation. At the end of class, students who are content with the classroom’s thermal environment show a high level of motivation. Students who are satisfied with the thermal environment of the class can better focus on the topic and complete the lecture with high motivation.
Next, we investigated the correlation between the number of words in student’s essays and the student’s GPA (Figure 5). Students were graded on the number of words in their submitted essays.

Figure 5. Linear regression analysis for number of words (Refers to GRADE) – GPA relation.
We can see a slight upward trend, consistent with the moderate positive (but not statistically significant) correlation—students with higher GPAs generally tend to write somewhat longer essays, though the variation is considerable (Figure 5). The correlation coefficient (r ≈ 0.31) indicates a moderate positive relationship, however, the p-value (≈0.11) is greater than 0.05, meaning this correlation is not statistically significant at the 95% confidence level.
The correlation test we have performed above indicated that students’ grades closely correlated with their answers for questions 1 and 6. Therefore, we wanted to conduct a multiple regression analysis to lay out this relationship. We have chosen the grade as the dependent variable (Tables 2, 3).

Table 2. Model summary of grade–Q1.

Table 3. Analysis of variance of grade–Q1.
We have first performed a linear regression analysis between student’s grade and their answers to Question 1.
The regression equation is found as
As the p–value was found as 0.003 < 0.05, our result is significant.
The results indicate that students’ grades are positively related to their satisfaction with classroom temperature (Figure 6).

Figure 6. Regression analysis between thermal satisfaction and student grades.
We then performed a multiple regression analysis using Minitab. The data set we have is as follows.
• Input (Independent variables):
Q1(C1), Q2(C2), Q3(C3), Q4(C4), Q5(C5), Q6(C6), GPA (C7), Distance (C8), Heat Index (C9).
• Output (Dependent variables):
Grades (C10).
The result of the multiple regression analysis is given in Tables 4, 5.
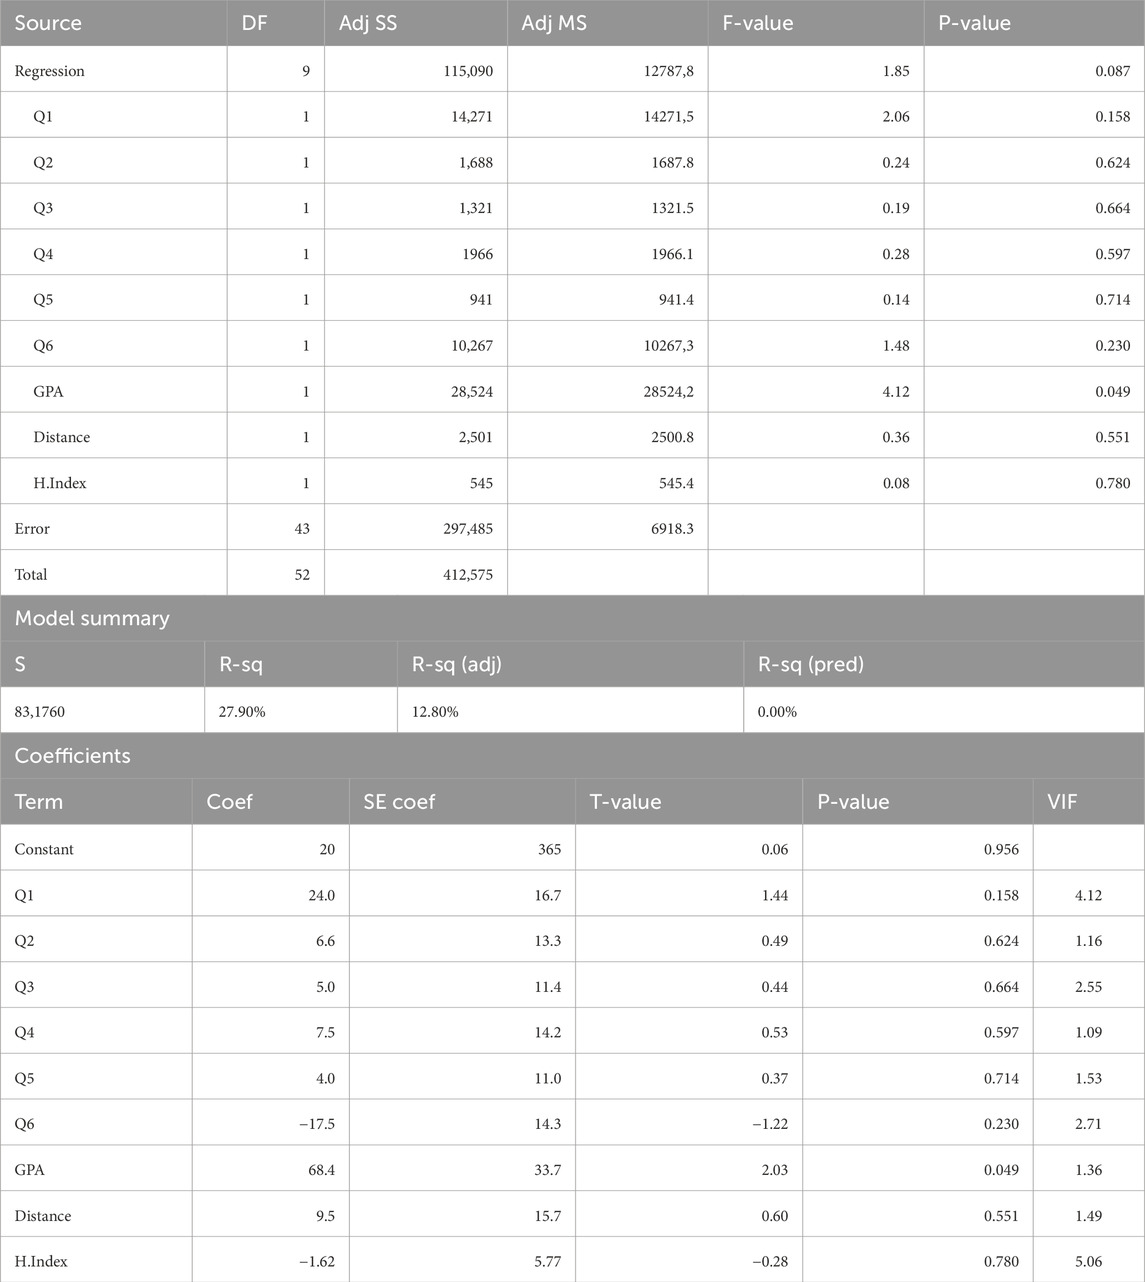
Table 4. Multiple regression analysis: Grade versus Q1; Q2; Q3; Q4; Q5; Q6; GPA; distance; heat index analysis of variance.

Table 5. Analysis variance of regression analysis: Grade versus Q1; Q2; Q3; Q4; Q5; Q6; GPA; distance; heat index.
Regression equation
With p-value is very close to 0.05. it can be said the relationship is close to being significant.
Since we have high p values for Q2, Q3, Q4, Q5, Distance and HI in our table, we can neglect them in our next regression test because they are not statistically significant.
Based on the R2-value criterion, the “best” model was found as the model with the four predictors Q1, Q4, Q6 and GPA. Based on the adjusted R2-value and the smallest MSE criteria, the model that includes Q1, Q6 and GPA was found as the best model (Table 6).
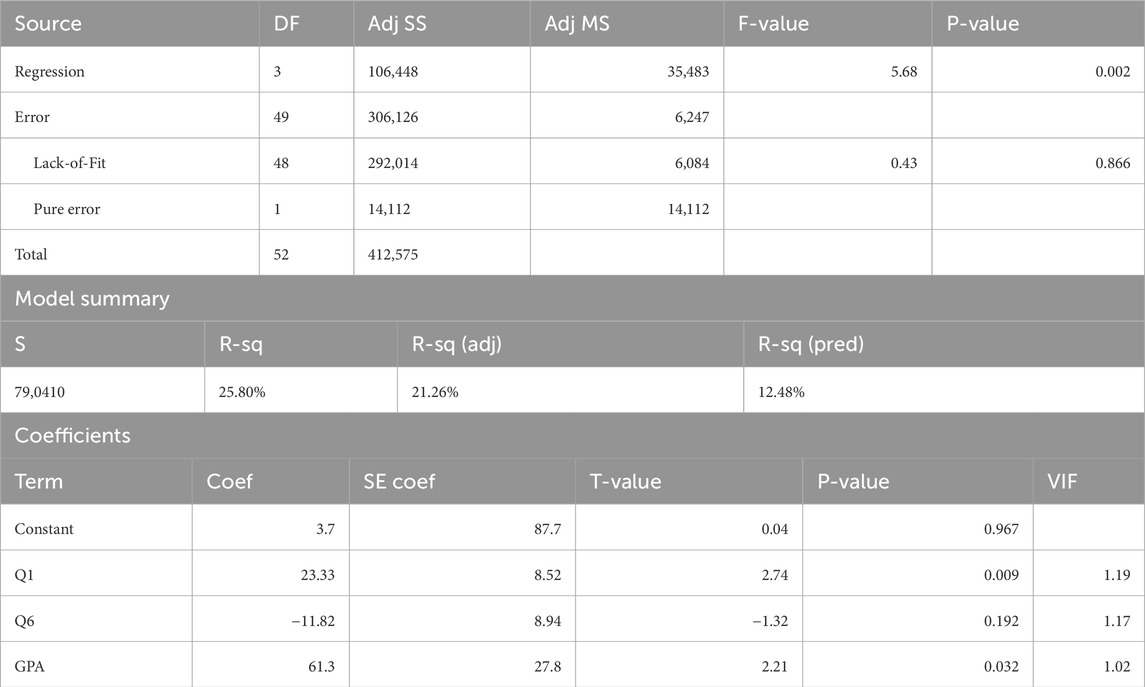
Table 6. Regression analysis: Grade versus Q1; Q6; GPA analysis of variance.
The P-value for the independent variables in this regression test is less than or equal to 0.05. Our test is now more reliable since the p value has dropped to 0.002 from 0.087 in this equation.
Regression equation
The general regression showed an R-squared value of 27.90% before. Now it is 25.8%. Here, 25.80% of the variance over Grades is actually GPA, Q1, and Q6 (Table 6).
In the coefficient section we see that Q6 is actually has negative coefficient and its p-values are higher than 0.05, indicating that the new regression will be much better for us if we discard Q6. In the survey, the Q6 variable concerns the motivation of students at the end of the course.
We removed the dependent variable Q6 from the list due to its high p-value and ran the test again (Table 7).

Table 7. Regression analysis: Grade versus Q1; GPA analysis of variance.
Regression equation
We see that the p-value of the regression equation drops to 0.001 from 0.002, indicating that our test is now more reliable.
Our initial regression showed a R-square value of 27.90%. When we looked at Q1, Q6, and GPA, it was 25.8%. Now the R-square value of the Q1 and GPA sets is 23.15%. The loss of 2% represents the effect of Q6 on Grade. We understand that 23.15% of the variance between grades is actually explained by GPA and Q1.
At this point, we can see that the p-values remain below 0.05. It can be concluded that the effects on the Grade are getting stronger.
We have discovered the best mathematical multiple regression equation. The students’s grades positively depend on student’s GPA and how they feel about classroom temperature (Q1). Model assumptions were tested through residual plots confirming normality and homoscedasticity. The final model (Grade = −43.7 + 27.57 Q1 + 62.2 GPA) demonstrates statistical significance (p = 0.001) with R2 = 23.15%, indicating that thermal satisfaction (Q1) and student GPA together explain 23.15% of grade variance.
4 Discussion and conclusions
Based on these findings, several spatial design strategies are recommended.
• HVAC Zoning: Implement uniform temperature distribution systems to minimize thermal gradients across classroom zones.
• Seating Arrangements: Consider thermal comfort zones when designing classroom layouts, avoiding placement of students in areas with poor air circulation.
• Smart Building Integration: Incorporate real-time thermal monitoring systems for dynamic climate control based on occupancy and external conditions.
• Window Management: Strategic window placement and automated shading systems can help maintain consistent thermal conditions.
Results should be interpreted as correlational rather than strictly causal. Multiple factors influence academic performance including student preparation, topic difficulty, time of day, and individual learning preferences. The thermal environment represents one contributing factor among many affecting student outcomes.
Several limitations of this study should be noted. First, the lack of a randomized control group and short duration of 2 weeks limit the ability to draw causal inferences from the observed associations between thermal environment satisfaction and academic performance. Second, the study was conducted in a single classroom setting, which restricts generalizability of the findings to other educational contexts or building types.
Importantly, the measurement of thermal environmental parameters was limited to temperature and relative humidity. Key thermal comfort factors such as mean radiant temperature, air velocity, occupants’ metabolic rate, and clothing insulation were not measured, constraining comprehensive assessment of the indoor thermal environment in accordance with ASHRAE Standard 55 (ASHRAE, 2020).
Furthermore, the thermal comfort questionnaire utilized in this study was not subjected to rigorous psychometric validation; reliability and validity analyses such as Cronbach’s alpha were not performed. This limitation restricts the interpretability of subjective thermal perception results and highlights the need for improved instrument development in future research.
Lastly, the potential confounding influence of other factors on student academic performance, such as study habits, prior knowledge, and psychological states, was not controlled for in this exploratory study. These elements should be integrated into more comprehensive future investigations.
This study explored the effects of classroom thermal environments on students’ learning performance, motivation, and comfort in a university setting. Using an Arduino-based sensor system, the thermal conditions in a Steelcase classroom were closely monitored, and students’ perceptions and learning outcomes under controlled cold (20 °C) and warm (27 °C) conditions were analyzed. The findings revealed key insights into the relationship between the thermal environment and academic performance.
Students’ satisfaction with the thermal environment was found to significantly impact their motivation and cognitive performance. Specifically, students who were satisfied with the classroom’s thermal conditions reported higher learning motivation and achieved better exam grades. This aligns with prior studies, such as those by Pule et al. (2021) and Wargocki and Wyon (2013), which have emphasized the importance of maintaining optimal thermal conditions for effective learning and engagement. The negative correlation between dissatisfaction with the thermal environment and end-of-class motivation further underscores the detrimental effects of suboptimal thermal conditions on student focus and energy levels.
Regression analysis indicated that students’ grades were most strongly influenced by their GPA and their perceptions of classroom temperature (Q1). The predictive model derived from the data demonstrated that thermal environment satisfaction and academic preparedness (as reflected by GPA) accounted for 23.15% of the variance in students’ grades. These findings support the argument that both environmental and personal factors are critical determinants of learning outcomes.
Interestingly, the results also highlighted the spatial variability of thermal conditions within the classroom. Students seated in regions with higher thermal comfort reported greater satisfaction and better learning outcomes, emphasizing the need for uniform thermal distribution. This echoes findings from studies (Zaki et al., 2017; Mishra et al., 2017; Vittal, 2016; Serghides et al., 2015), which highlighted the interplay between thermal comfort, spatial attributes, and learning.
This research underscores the critical role of the thermal environment in enhancing or impeding students’ academic performance. The findings highlight that maintaining optimal classroom temperatures can significantly boost students’ motivation, satisfaction, and cognitive performance. As the data show, thermal comfort is not merely a matter of physical wellbeing but also a crucial factor in fostering an environment conducive to learning.
4.1 Key findings
• Classroom temperature significantly affects student thermal satisfaction and learning motivation (p < 0.001).
• Students with higher thermal satisfaction achieved measurably better learning outcomes.
• GPA and thermal satisfaction together predict 23.15% of variance in student grades.
• Optimal temperature range appears to be 20 °C–22 °C for this student population.
• Arduino-based monitoring systems provide cost-effective solutions for classroom thermal assessment.
While our multiple regression model demonstrated significant predictive power (R2 = 23.15%, p < 0.001) for student grades based on thermal satisfaction and GPA, it is important to recognize the relatively modest proportion of explained variance. This indicates that while thermal comfort plays a meaningful role in academic performance, student achievement is inherently multifactorial. Other influential factors such as individual study behaviors, cognitive abilities, instructional quality, and psychological variables likely contribute substantially to learning outcomes.
Our findings support the value of maintaining classroom thermal conditions within an optimal range (approximately 20 °C–22 °C) to promote student comfort and motivation, which in turn may enhance performance. However, generalization should be cautious given the exploratory nature and design limitations of this study. Future research incorporating larger, diverse samples and broader environmental and psychological measures is warranted to elucidate the complex interactions influencing academic success, following models and frameworks established in international thermal comfort research (Wang et al., 2014; Wang et al., 2017; Yang et al., 2013; Yao et al., 2010).
In conclusion, by highlighting the interplay between thermal conditions and academic performance, this study calls for a more holistic approach to classroom design and operation, where environmental and pedagogical factors are harmonized to support students’ success.
The study’s implications extend beyond the classroom, offering valuable insights for the design and operation of educational facilities. Universities and schools should prioritize HVAC systems capable of maintaining stable and uniform thermal conditions while considering students’ spatial preferences and seating arrangements.
While this study provides valuable insights, it has certain limitations. The sample size was limited to a single classroom setting and a short duration, which may limit the generalizability of the findings. Future studies should explore a larger and more diverse sample, as well as other environmental factors such as lighting and noise, to develop a more comprehensive understanding of the optimal learning environment. Furthermore, incorporating advanced thermal comfort models and longitudinal data could yield deeper insights into the long-term effects of thermal environments on learning.
Data availability statement
The original contributions presented in the study are included in the article/supplementary material, further inquiries can be directed to the corresponding author.
Ethics statement
Ethical review and approval was not required for the study on human participants in accordance with the local legislation and institutional requirements. Written informed consent from the [patients/ participants OR patients/participants legal guardian/next of kin] was not required to participate in this study in accordance with the national legislation and the institutional requirements.
Author contributions
GK: Conceptualization, Data curation, Formal Analysis, Funding acquisition, Investigation, Methodology, Project administration, Resources, Software, Supervision, Validation, Visualization, Writing – original draft, Writing – review and editing.
Funding
The authors declare that no financial support was received for the research and/or publication of this article.
Acknowledgements
We would like to thank Dr. Orcun Kepez for his help in conducting this study.
Conflict of interest
The author declares that the research was conducted in the absence of any commercial or financial relationships that could be construed as a potential conflict of interest.
Generative AI statement
The authors declare that no Generative AI was used in the creation of this manuscript.
Any alternative text (alt text) provided alongside figures in this article has been generated by Frontiers with the support of artificial intelligence and reasonable efforts have been made to ensure accuracy, including review by the authors wherever possible. If you identify any issues, please contact us.
Publisher’s note
All claims expressed in this article are solely those of the authors and do not necessarily represent those of their affiliated organizations, or those of the publisher, the editors and the reviewers. Any product that may be evaluated in this article, or claim that may be made by its manufacturer, is not guaranteed or endorsed by the publisher.
References
ASHRAE (2020). ASHRAE standard 55-2020: thermal environmental conditions for human occupancy. Peachtree Corners, GA: American Society of Heating, Refrigerating and Air-Conditioning Engineers.
Buonocore, C., Vecchi, R. D., Scalco, V. A., and Lamberts, R. (2020). Thermal preference and comfort assessment in air-conditioned and naturally-ventilated university classrooms under hot and humid conditions in Brazil. Energy Build 211, 109783. doi:10.1016/j.enbuild.2020.109783
Buratti, C., and Ricciardi, P. (2009). Adaptive analysis of thermal comfort in university classrooms: correlation between experimental data and mathematical models. Build. Environ. 44 (4), 674–687. doi:10.1016/j.buildenv.2008.06.001
Cao, B., Zhu, Y., Ouyang, Q., Zhou, X., and Huang, L. (2011). Field study of human thermal comfort and thermal adaptability during the summer and winter in Beijing. Energy Build. 43 (5), 1051–1056. doi:10.1016/j.enbuild.2010.09.025
Castilla, N., Llinares, C., Bravo, J. M., and Blanca, V. (2017). Subjective assessment of university classroom environment. Build. Environ. 122, 72–81. doi:10.1016/j.buildenv.2017.06.004
Cheng, M.-J., Hwang, R.-L., and Lin, T.-P. (2008). Field experiments on thermal comfort requirements for campus dormitories in Taiwan. Indoor Built Environ. 17 (3), 191–202. doi:10.1177/1420326X08090571
Corgnati, S. P., Filippi, M., and Viazzo, S. (2007). Perception of the thermal environment in high school and university classrooms: subjective preferences and thermal comfort. Build. Environ. 42 (2), 951–959. doi:10.1016/j.buildenv.2005.10.027
Earthman, G. I. (2002). School facility conditions and student academic achievement. Los Angeles, CA: UCLA’s Institute for Democracy, Education, and Access. Available online at: https://escholarship.org/content/qt5sw56439/qt5sw56439.pdf?t=krnn37.
Fang, Z., Zhang, S., Cheng, Y., Fong, A. M. L., Oladokun, M. O., Lin, Z., et al. (2018). Field study on adaptive thermal comfort in typical air conditioned classrooms. Build. Environ. 133, 73–82. doi:10.1016/j.buildenv.2018.02.005
Fong, M. L., Hanby, V., Greenough, R., Lin, Z., and Cheng, Y. (2015). Acceptance of thermal conditions and energy use of three ventilation strategies with six exhaust configurations for the classroom. Build. Environ. 94, 606–619. doi:10.1016/j.buildenv.2015.10.024
González-Lezcano, R. A. (2023). Editorial: design of efficient and healthy buildings. Front. Built Environ. 9. doi:10.3389/fbuil.2023.1210956
Hu, P. F., Liu, W., and Jiang, Z. N. (2006). Study on indoor thermal sensation of young college students in the area which is hot in summer and cold in winter. Age 18 (24), 18–23.
Hwang, R.-L., Lin, T.-P., and Kuo, N.-J. (2006). Field experiments on thermal comfort in campus classrooms in Taiwan. Energy Build. 38 (1), 53–62. doi:10.1016/j.enbuild.2005.05.001
Jiang, J., Wang, D., Liu, Y., Di, Y., and Liu, J. (2021). A holistic approach to the evaluation of the indoor temperature based on thermal comfort and learning performance. Build. Environ. 196, 107803. doi:10.1016/j.buildenv.2021.107803
Jung, G. J., Song, S. K., Ahn, Y. C., Oh, G. S., and Im, Y. B. (2011). Experimental research on thermal comfort in the university classroom of regular semesters in Korea. J. Mech. Sci. Technol. 25 (2), 503–512. doi:10.1007/s12206-010-1219-1
Krüger, E. L., and Zannin, P. H. T. (2004). Acoustic, thermal and luminous comfort in classrooms. Build. Environ. 39 (9), 1055–1063. doi:10.1016/j.buildenv.2004.01.030
Kumar, S., Singh, M. K., Mathur, A., Mathur, J., and Mathur, S. (2018). Evaluation of comfort preferences and insights into behavioural adaptation of students in naturally ventilated classrooms in a tropical country, India. Build. Environ. 143, 532–547. doi:10.1016/j.buildenv.2018.07.035
Ma, X., Liu, H., Zhang, Z., and Li, Y. (2023). How does indoor physical environment differentially affect learning performance in various classroom types? Build. Environ. 234, 110189. doi:10.1016/j.buildenv.2023.110189
Ma, X., Zhang, Z., Chen, Y., and Zhang, W. (2025). How campus green space elements differently influence students' thermal perception during transition seasons? Int. J. Therm. Sci. 212, 109767. doi:10.1016/j.ijthermalsci.2025.109767
Mishra, A. K., and Ramgopal, M. (2014a). Thermal comfort field study in undergraduate laboratories – an analysis of occupant perceptions. Build. Environ. 76, 62–72. doi:10.1016/j.buildenv.2014.03.005
Mishra, A. K., and Ramgopal, M. (2014b). Thermal comfort in undergraduate laboratories—A field study in Kharagpur, India. Build. Environ. 71, 223–232. doi:10.1016/j.buildenv.2013.10.006
Mishra, A. K., Derks, M. T. H., Kooi, L., Loomans, M. G. L. C., and Kort, H. S. M. (2017). Analysing thermal comfort perception of students through the class hour, during heating season, in a university classroom. Build. Environ. 125, 464–474. doi:10.1016/j.buildenv.2017.09.016
Nico, M. A., Liuzzi, S., and Stefanizzi, P. (2015). Evaluation of thermal comfort in university classrooms through objective approach and subjective preference analysis. Appl. Ergon. 48, 111–120. doi:10.1016/j.apergo.2014.11.013
Pule, V., Mathee, A., Melariri, P., Kapwata, T., Abdelatif, N., Balakrishna, Y., et al. (2021). Classroom temperature and learner absenteeism in public primary schools in the Eastern Cape. Multidiscip. Digit. Publ. Inst. 18, 10700. doi:10.3390/ijerph182010700
Seppanen, O., Fisk, W. J., and Lei, Q. H. (2006). Effect of temperature on task performance in office environment Berkeley, CA: Lawrence Berkeley National Laboratory.
Serghides, D. K., Chatzinikola, C. K., and Katafygiotou, M. C. (2015). Comparative studies of the occupants’ behaviour in a university building during winter and summer time. Int. J. Sustain. Energy 34 (8), 528–551. doi:10.1080/14786451.2014.905578
Singh, M. K., Kumar, S., Ooka, R., Rijal, H. B., Gupta, G., and Kumar, A. (2018). Status of thermal comfort in naturally ventilated classrooms during the summer season in the composite climate of India. Build. Environ. 128, 287–304. doi:10.1016/j.buildenv.2017.11.031
Sudo, M., Ito, K., Sasaki, H., Iwashita, G., Ueno, K., Hiwatashi, K., et al. (2011). The effect of academic performance on classroom environment for junior high school students. J. Environ. Eng. 76 (660), 201–209. doi:10.3130/aije.76.201
Vittal, R. (2016). Perceived thermal environment of Naturally- ventilated classrooms in India. Creat. Space 3 (2), 149–166. doi:10.15415/cs.2016.32010
Wang, Z., Li, A., Ren, J., and He, Y. (2014). Thermal adaptation and thermal environment in university classrooms and offices in Harbin. Energy Build. 77, 192–196. doi:10.1016/j.enbuild.2014.03.054
Wang, Z., Ning, H., Zhang, X., and Ji, Y. (2017). Human thermal adaptation based on university students in China’s severe cold area. Sci. and Technol. Built Environ. 23 (3), 413–420. doi:10.1080/23744731.2016.1255495
Wang, D., Xu, Y., Liu, Y., Wang, Y., Jiang, J., Wang, X., et al. (2018). Experimental investigation of the effect of indoor air temperature on students' learning performance under the summer conditions in China. Elsevier BV 140, 140–152. doi:10.1016/j.buildenv.2018.05.022
Wargocki, P., and Wyon, D. P. (2013). Providing better thermal and air quality conditions in school classrooms would be cost-effective. Elsevier BV 59, 581–589. doi:10.1016/j.buildenv.2012.10.007
Yang, Z., Becerik-Gerber, B., and Mino, L. (2013). A study on student perceptions of higher education classrooms: impact of classroom attributes on student satisfaction and performance. Build. Environ. 70, 171–188. doi:10.1016/j.buildenv.2013.08.030
Yao, R., Liu, J., and Li, B. (2010). Occupants’ adaptive responses and perception of thermal environment in naturally conditioned university classrooms. Appl. Energy 87 (3), 1015–1022. doi:10.1016/j.apenergy.2009.09.028
Zaki, S. A., Damiati, S. A., Rijal, H. B., Hagishima, A., and Abd Razak, A. (2017). Adaptive thermal comfort in university classrooms in Malaysia and Japan. Build. Environ. 122, 294–306. doi:10.1016/j.buildenv.2017.06.016
Keywords: classroom environment, thermal conditions, learning performance, student comfort, sensor-based monitoring
Citation: Kirkil G (2025) Effects of classroom temperature and humidity on student learning performance: an experimental study using sensor-based monitoring. Front. Built Environ. 11:1678438. doi: 10.3389/fbuil.2025.1678438
Received: 02 August 2025; Accepted: 27 November 2025;
Published: 19 December 2025.
Edited by:
Giuseppina Emma Puglisi, Polytechnic University of Turin, ItalyReviewed by:
Giovanni Ciampi, Università degli Studi della Campania Luigi Vanvitelli, ItalyAbdulsalam AlShboul, The University of Jordan, Jordan
Copyright © 2025 Kirkil. This is an open-access article distributed under the terms of the Creative Commons Attribution License (CC BY). The use, distribution or reproduction in other forums is permitted, provided the original author(s) and the copyright owner(s) are credited and that the original publication in this journal is cited, in accordance with accepted academic practice. No use, distribution or reproduction is permitted which does not comply with these terms.
*Correspondence: Gokhan Kirkil, Z29raGFuLmtpcmtpbEBraGFzLmVkdS50cg==