 Rahubadda Vithanage Ashen Dilruksha Rahubadda
 Anupa Manewa
 Vaishali Anagal3
 Mohan Siriwardena
- 1Department of Building Economics, University of Moratuwa, Moratuwa, Sri Lanka
- 2Liverpool John Moores University School of Civil Engineering and Built Environment, Liverpool, United Kingdom
- 3Dr Bhanuben Nanavati College of Architecture for Women, Pune, India
As urbanization accelerates and climate targets become increasingly urgent, conventional centralized energy systems are proving insufficient to support the transition toward low-carbon, resilient cities. This study proposes a novel biomimetic framework for urban energy systems, inspired by the Wood Wide Web, the mycorrhizal networks in forest ecologies that enable mutualistic, decentralized resource exchange. Guided by the biomimicry spiral methodology, the ecological principles of cooperation, adaptability, and distributed resilience are abstracted into a three-layer urban energy model comprising on-site renewable generation, peer-to-peer (P2P) energy sharing, and grid integration for redundancy. The model was operationalized through Building Information Modeling (BIM) simulations comparing two urban building clusters: a conventional baseline and a biomimetic cluster anchored by a high-performance “mother tree” structure, modeled after London’s Gherkin. Autodesk Revit’s Energy Analysis, Solar Radiation Analysis, and Carbon Insights tools were used to evaluate each scenario’s energy performance, solar generation potential, and carbon emissions. Results reveal a transformative impact: cooperative energy redistribution enabled multiple buildings to reach net-zero emissions, while the mother tree intervention alone achieved a 46% reduction in annual cluster-wide carbon output. The results demonstrate how decentralized, cooperative energy systems, modeled on ecological intelligence, can enhance system-wide resilience and carbon neutrality. This research advances biomimicry from conceptual metaphor to actionable infrastructure design, offering a scalable blueprint for regenerative, climate-adaptive urban energy systems. By embedding ecological principles into the built environment, cities can evolve into cooperative, circular systems aligned with nature’s logic and sustainability goals.
1 Introduction
With urbanization projected to increase from 54% of the global population in 2018 to 66% by 2050 (United Nations Department of Economic and Social Affairs Population Division, 2018), the environmental impact of cities will continue to intensify. This accelerated urbanization, coupled with the growing impacts of climate change and other contributing factors, has led to a steady and substantial increase in global building energy consumption (Eom et al., 2012). Despite occupying just 3% of the Earth’s land surface, cities account for approximately 75% of global energy consumption and up to 80% of greenhouse gas (GHG) emissions (O’Dwyer et al., 2019). According to the International Energy Agency (2008), urban primary energy consumption totaled approximately 330 exajoules (EJ) of primary energy in 2006, equivalent to about 91,674 terawatt-hours (TWh). Within the European Union, urban areas account for nearly 69% of total primary energy use, while urban regions in China consume around 75% of the country’s energy (Meng et al., 2014). The IEA also forecasts that 90% of global energy demand growth will originate from cities, underscoring their pivotal role in shaping future energy trajectories. Kennedy et al. (2015) quantified the energy and material flows of 27 megacities, which collectively consumed 6.7% of global energy, 9.3% of global electricity, and 9.9% of global gasoline. With more than 80% of global energy still derived from fossil fuels, including oil, coal, and natural gas, this escalation in consumption heightens the economic risks associated with external supply dependencies and exacerbates the vulnerability of fossil fuel–importing nations (Kalair et al., 2021). These conditions highlight the urgent need to transform urban energy systems from centralized to decentralized models to achieve national and international climate neutrality targets (Marquez-Ballesteros et al., 2019; Armin Razmjoo et al., 2020). In response, international efforts have increasingly focused on diversifying energy sources, expanding renewable energy infrastructure, and implementing ambitious energy efficiency strategies (Yang et al., 2016). Amidst these efforts, biomimicry has emerged as a promising and transformative design approach (Pawlyn, 2019), drawing on nature’s time-tested principles to inspire innovative, efficient, and sustainable urban energy solutions. By emulating natural systems that are inherently resilient, adaptive, and resource-efficient, biomimicry offers new pathways to reimagine energy infrastructures and urban development in alignment with ecological integrity and long-term sustainability (Zari, 2018).
Biomimicry entails the utilization of nature’s functional principles as a source of inspiration in the design of objects or systems, closely aligning with the intricate mechanisms observed in organisms or ecosystems (Pawlyn, 2019). Defined by International Organization for Standardization (2021) as the interdisciplinary collaboration between biology and technological fields to solve practical problems through abstraction and application of biological models, biomimicry prioritizes function over form by seeking solutions embedded in the logic and resilience of natural systems. Its relevance has grown amid increasing environmental concerns, offering promising applications in the built environment to reduce embodied energy, optimize material usage, enhance energy efficiency, and inspire low-maintenance, resource-efficient structures (Gunasekaran et al., 2023). Rather than merely mimicking the appearance of nature, this approach is grounded in understanding and applying the deeper systemic efficiencies of ecosystems (Helmrich et al., 2020). Biomimicry has been effectively applied in a wide array of sectors, from textile innovation to the design of high-performance building systems and is increasingly recognized as a guiding philosophy for creating sustainable urban environments that respond to the mounting ecological pressures of climate change, biodiversity loss, and energy overconsumption (Rahubadda and Kulathunga, 2025).
A compelling model for biomimetic urban energy systems is the “Wood Wide Web,” a design metaphor that captures the intricate underground networks created through symbiotic relationships between mycorrhizal fungi and plant roots (Busato, 2020). These networks function as nature’s communication and resource-sharing infrastructure, enabling trees to exchange nutrients, water, and biochemical signals across vast distances (Field and Magkourilou, 2023; Richard, 2018). The fungi extend the reach of tree roots through thread-like hyphae, accessing hard-to-reach minerals and relaying them to the host tree in exchange for sugars produced via photosynthesis (Karimi-Jashni and Yazdanpanah, 2023). Remarkably, this decentralized system allows for resilience through mutual support, trees under stress from drought or pests may receive aid from healthier neighbors, while others send early warnings via chemical or electrical signals to activate preemptive defenses. With over 80% of land plants forming such associations, and meters of fungal hyphae found in just 1 G of soil, this natural network exemplifies a highly efficient, cooperative, and adaptive system (Reinhart et al., 2012). As a biomimetic framework, the Wood Wide Web offers a powerful analogy for redesigning urban energy infrastructure: envisioning cities as interconnected systems capable of dynamic resource distribution, resilience through decentralization, and adaptive response to environmental stressors. Applying these principles could revolutionize how urban energy networks are designed, contributing to a regenerative and sustainable built environment (Alizadeh, 2011).
Despite its promise, the application of biomimicry to urban energy infrastructure remains largely theoretical and underdeveloped (Jiang et al., 2024; Raman et al., 2024). Existing urban design and energy planning paradigms have yet to fully incorporate the systemic intelligence of natural ecosystems, particularly those exemplified by mycorrhizal networks. While biomimetic approaches have been successfully applied at the scale of materials and individual buildings (Rahubadda et al., 2025), a critical gap persists in translating these ecological principles into scalable, city-level models for urban energy systems. The central challenge is not only theoretical but methodological: translating evocative biological metaphors, such as the Wood Wide Web, into rigorous, actionable strategies capable of informing infrastructure design, energy governance, and policy frameworks. Addressing this gap, this study attempts to propose a biomimicry-based urban energy system explicitly modeled on the functional dynamics of forest ecologies, with the Wood Wide Web serving as a conceptual blueprint. In doing so, it advances an ecologically grounded framework for regenerative, adaptive, and resilient urban development. To achieve this, the study pursued the following objectives:
• To emulate the ecological principles of the WWW into a functional urban energy model.
• To evaluate the system’s impact on a cluster of urban buildings in terms of energy efficiency and carbon emissions.
To structure this inquiry, Section 2 synthesizes relevant literature to establish the conceptual context. Section 3 details the methodological framework and simulation tools employed. Section 4 presents the findings derived from scenario-based performance modeling, while Section 5 offers a critical discussion of the results in relation to current scholarships, emphasizing both theoretical and practical implications. Finally, Section 6 summarizes the study’s key contributions and outlines directions for future research.
2 Literature review
2.1 Urban energy systems and sustainability challenges
Urban areas currently depend heavily on fossil fuels, making it critical to adopt alternative energy production and consumption strategies (Kalair et al., 2021). On the production side, this involves shifting to decentralized, low-carbon energy systems. On the consumption side, demand-side management is essential for improving energy efficiency in the built environment (Aoun et al., 2021). Urban energy systems, which are complex infrastructures that enable the production, distribution, and consumption of energy, are central to this transformation (Armin Razmjoo et al., 2020). Advancements in renewable technologies offer a viable pathway, supporting a reimagining of electricity flow. Traditionally, electricity systems operated in a unidirectional model, where power flowed from centralized utilities to passive consumers (Rutter and Keirstead, 2012). However, this model is now evolving. In many regions, consumers now participate as “prosumers,” individuals who not only consume electricity but also generate and sell excess energy back to the grid (Kesting et al., 2013). This shift is evident in the rise of decentralized systems such as microgrids (localized energy systems that can operate independently or with the main grid) and nano-grids (smaller-scale versions for buildings or neighborhoods) (Warneryd et al., 2020). These systems reduce the need for long-distance transmission by placing energy production closer to consumption points, boosting efficiency and system resilience while minimizing transmission losses and outage risks (Cao et al., 2016). Consequently, the energy sector is transitioning away from centralized, fossil-fuel-dependent infrastructure toward smart, decentralized, renewable-based grids that offer greater flexibility, lower costs, and enhanced resilience (Mohammad et al., 2020).
Building on these trends, next-generation smart cities are redefining the role of urban energy systems. The historical shift toward centralized grids had cast cities as passive demand centers, eroding the local autonomy of urban energy systems (Rutter and Keirstead, 2012). Today, however, cities are increasingly becoming dynamic energy actors. Smart urban energy systems aim to be not only reliable and efficient but also carbon-neutral (Batty et al., 2012). This transformation is enabled by digital infrastructure, real-time analytics, and intelligent control systems powered by the Internet of Things (IoT). A key opportunity lies in the spatial integration of multiple energy vectors, electricity, heat, and gas, into multi-vector systems that optimize flows across sectors (Lund et al., 2014). These systems can respond flexibly to energy demand in real time, improving operational efficiency and resilience. As urban energy agendas expand, the goals now include not just reliability and efficiency but also reducing supply costs (Fuso Nerini et al., 2017), eliminating fossil fuel dependence (Marquez-Ballesteros et al., 2019), and enhancing regional value creation through local energy production and economic resilience (Emec et al., 2015).
One persistent challenge is the temporal and spatial mismatch between energy supply and demand, which often necessitates advanced storage technologies and more flexible distribution systems (Lund et al., 2015). In response, mixed-use urban districts are emerging as testbeds for innovative energy configurations. These districts integrate interconnected buildings that share energy via on-site renewables and distributed storage, enabling bidirectional energy flows not only in electricity but also in thermal networks (Allegrini et al., 2015). Low-temperature district heating systems offer a promising pathway to decarbonize heating by capturing waste heat and using ambient sources like geothermal energy, which improve the performance of heat pumps (Dalla Rosa and Christensen, 2011). The success of such systems depends not only on technical advances but also on institutional alignment, community participation, and supportive policy frameworks. As cities evolve into active energy managers, the integration of technological, spatial, and social dimensions will be essential for creating sustainable, resilient urban energy futures.
2.2 The importance of circular cities
The prevailing global economic model is still largely linear: raw materials are extracted from the environment, transformed into products, consumed, and ultimately discarded. In a world of finite resources, an issue underscored at the Paris (COP21) and Marrakech (COP22) climate conferences, such a system is inherently unsustainable and is showing signs of reaching its limits (Fusco Girard and Nocca, 2019). In contrast, the circular economy (CE) offers an alternative grounded in the logic of natural ecosystems, where nothing is wasted, and all outputs can become inputs elsewhere. The CE reimagines industrial systems to support ecological balance by promoting resource efficiency, reducing emissions, and minimizing waste through strategies such as recycling and reuse (Preston, 2012). This model has already demonstrated value in various contexts, such as industrial symbiosis, by lowering material and energy costs and reducing carbon footprints (Fujita et al., 2013). Extending these principles to the urban context, the circular city model envisions cities as regenerative systems that close resource loops, eliminate waste, and reduce reliance on non-renewable resources (Fusco Girard and Nocca, 2019). Some cities adopting this model have set ambitious goals: cutting CO2 emissions by 55% by 2020, phasing out natural gas by 2040, sourcing all energy from renewables, fully recycling waste, and salvaging materials from demolished buildings for reuse (Circle Economy, 2019). Circular cities are guided by the evolving and interdisciplinary framework of the CE (Vanhuyse et al., 2021), which, despite being a contested and fluid concept (Bîrgovan et al., 2022), continues to gain traction. Paiho et al. (2020) define circular cities as those that prioritize closing, slowing, and narrowing resource flows, only resorting to new inputs when all conservation, efficiency, and renewable options have been fully leveraged.
Currently, urban areas consume over 75% of the planet’s natural resources, generate more than 50% of global waste, and are responsible for 60%–80% of greenhouse gas emissions (Liu et al., 2018). According to Ellen MacArthur Foundation (2015), a circular city is one in which urban areas are designed to be modular and flexible; energy systems are resilient and powered by renewable sources, thereby reducing costs and generating positive environmental impacts; urban mobility is accessible, affordable, and efficient; and production systems foster the creation of “local value loops.” The transition to a circular city model presents significant opportunities for urban regeneration. These include carbon capture and storage, the reuse of construction materials such as concrete and steel, the expansion of community-based renewable energy systems, and the development of proximity services that support slow and sustainable mobility (Fusco Girard and Nocca, 2019). Crucially, a circular city is not simply the sum of its CE projects. Rather, it functions as an integrated, systemic urban model inspired by the organization of natural ecosystems, where waste does not exist, and all materials and energy are continually reused and repurposed (Ellen MacArthur Foundation, 2015; World Economic Forum, 2018). At its core is the transformation of linear urban processes into circular ones, embedding resource circularity, energy efficiency, and regeneration into the urban metabolism (Sukhdev et al., 2018). In this context, the Wood Wide Web, the underground mycorrhizal network that enables symbiotic energy and nutrient exchange in forest ecosystems, offers a powerful biomimetic metaphor. It illustrates how decentralized, cooperative, and adaptive networks can serve as a blueprint for designing resilient energy flows and fostering mutualistic resource sharing in circular urban systems.
2.3 The concept of wood wide web
Although trees in a forest may appear as isolated individuals, they are in fact intricately connected below ground by a vast and complex network of fungal filaments (Merckx et al., 2024). Occasionally manifesting above the surface as mushrooms, these fine threads, known as mycorrhizal hyphae, facilitate the exchange of resources such as water, nutrients, and even signaling compounds among trees (Alizadeh, 2011). This subterranean communication system has drawn parallels with the digital internet, earning it the nickname “the Wood Wide Web” (Field and Magkourilou, 2023). The Wood Wide Web operates through mycorrhizal networks; mutualistic associations formed between fungi and the roots of plants. The term “mycorrhiza,” derived from the Greek words mykós (fungus) and rhiza (root), refers to these symbiotic relationships wherein fungal hyphae either surround or penetrate plant roots, creating extended root systems that link multiple trees (Karimi-Jashni and Yazdanpanah, 2023). In this mutualism, the fungi receive carbohydrates generated by the trees through photosynthesis, while the trees benefit from the fungi’s superior ability to extract difficult-to-access soil nutrients, such as phosphorus and nitrogen (Richard, 2018). As the hyphae proliferates through the soil, they often connect neighboring plants, thereby forming a shared mycelial network. Within this communal system, trees can exchange not only nutrients but also chemical and electrical signals (Merckx et al., 2024). For instance, mature, well-lit trees can share surplus sugars with shaded saplings, thereby enhancing the survival prospects of younger individuals (Richard, 2018). Similarly, trees experiencing stress from drought or pest attacks may either receive support from healthier neighbors or transmit distress signals. These alerts can trigger preemptive defensive responses in adjacent trees, such as the activation of resistance genes or the production of protective compounds.
Central figures in these networks are the so-called “mother trees”, mature, dominant individuals that often serve as key resource hubs (Henriksson et al., 2023). During times of environmental stress, these trees play a crucial role in allocating resources to vulnerable offspring or neighboring plants, contributing to the resilience of the entire forest community (Bas et al., 2024). The mycorrhizal fungi involved in this process are primarily known through their fruiting bodies, mushrooms visible above ground, but the true extent of their presence lies in the microscopic hyphae that composes the mycelium (Alizadeh, 2011). This hidden biological infrastructure permeates terrestrial ecosystems on a massive scale: a single gram of soil can contain several meters of hyphal filaments, and a cubic centimeter may harbor over 5 km of fungal threads (Reinhart et al., 2012). These networks are not only ubiquitous but also fundamental to ecosystem functioning, facilitating the horizontal transfer of nutrients and playing a pivotal role in maintaining plant health and ecological balance (Alizadeh, 2011). Figure 1 shows an illustration of the Wood Wide Web, highlighting the interconnected roles of different tree types and the mycorrhizal network in facilitating the decentralized transfer of resources and signals within forest ecosystems.
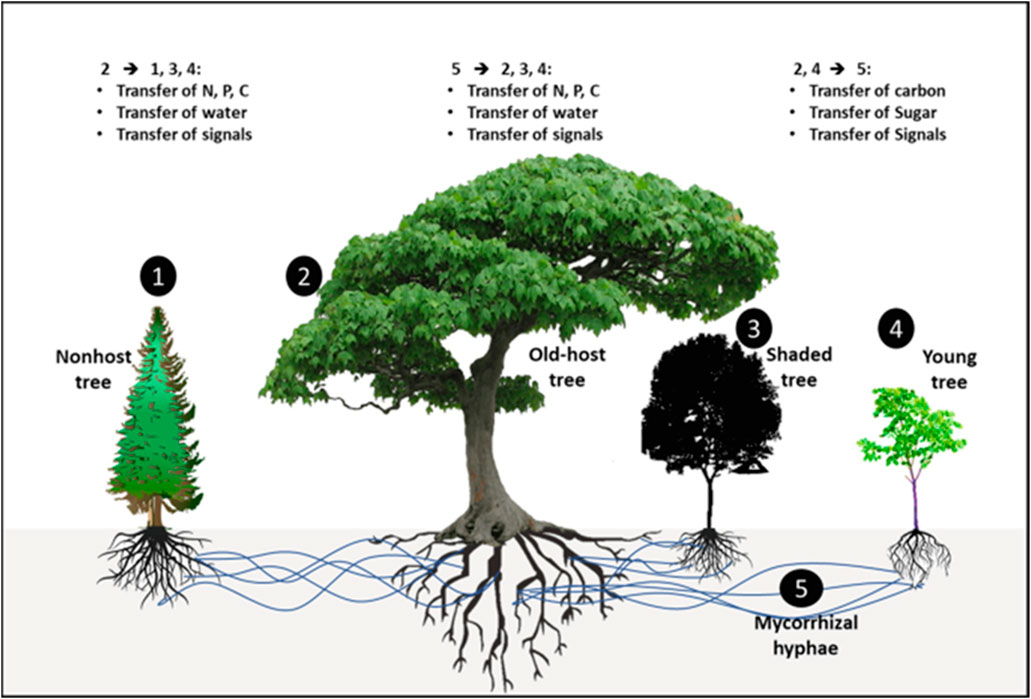
Figure 1. Illustration of the Wood Wide Web, depicting diverse tree species interconnected through mycorrhizal networks that facilitate decentralized resource and signal exchange in forests. Source: (Karimi-Jashni and Yazdanpanah, 2023).
The old-host tree (2) acts as a central hub, distributing nitrogen, phosphorus, carbon, water, and chemical signals to nonhost (1), shaded (3), and young trees (4), thereby enhancing their survival and resilience. In turn, shaded and old trees can transfer carbon and sugars to young trees, while signals also travel through the mycorrhizal network. This entire ecosystem is underpinned by mycorrhizal fungi (5), which connect tree roots and facilitate the exchange of essential resources and information. The resulting symbiotic system demonstrates how trees cooperate rather than compete, forming a dynamic, interdependent forest community that functions like a superorganism.
Recent scholarships have begun to explore how the analogy of mycorrhizal networks can inform energy-sharing systems. For instance, Gould et al. (2023) proposed a mycorrhizal-inspired model for transactive solar energy markets with battery storage, highlighting how decentralized peer-to-peer (P2P) exchanges can mimic the mutualistic balance found in fungal networks. Their work emphasized the role of storage and pricing mechanisms in ensuring fairness and resilience within distributed solar systems. Bilgen and Akan, (2024) pushed this idea further into a speculative domain by envisioning an “Internet of Plants,” where engineered devices interface with plant–fungus symbioses to harvest glucose-derived bioelectricity, illustrating the futuristic potential of bio-digital hybrids. Yet, these contributions remain primarily conceptual, market-driven, or speculative, with their focus on trading algorithms, pricing schemes, or bio-hybrid prototypes while neglecting the question of how such biomimetic principles could be systematically implemented in urban energy infrastructures. What is missing is an integrated, simulation-based investigation of how biomimetic principles can be operationalized within building clusters and city planning to achieve measurable reductions in carbon emissions. This study addresses that gap by applying the Wood Wide Web framework to design a decentralized urban energy system, evaluating its performance through advanced digital design tools, and demonstrating how principles of ecological cooperation can inform the development of resilient, carbon-neutral cities.
3 Materials and methods
This study employed a phased, experimental research approach to investigate the potential of the Wood Wide Web (WWW) as a biomimetic framework for reimagining urban energy systems. The approach began with Phase I, which utilized the Biomimicry Spiral to guide the translation of biological principles, namely, decentralization, cooperation, and adaptive energy exchange, into a model for urban energy systems. In Phase II, two hypothetical urban building clusters were developed using Building Information Modeling (BIM): a conventional baseline and a modified cluster incorporating a high-performance biomimetic hub. The use of hypothetical clusters enabled design flexibility and controlled comparisons, free from the constraints of real-world site conditions. This approach allowed for controlled testing of energy performance, solar radiation, and carbon emissions within a customizable urban layout. In Phase III, advanced digital tools, including Autodesk Revit Energy Analysis, Revit Solar Analysis, and Autodesk Carbon Insights, were employed to assess each scenario’s energy performance, solar generation potential, and carbon emissions. Together, these phases formed a coherent methodological structure aimed at exploring how nature-inspired strategies can inform more resilient, efficient, and low-carbon urban energy systems.
3.1 Phase I: inspiration for the bio inspired urban energy system
Biomimicry encompasses two principal methodologies: the problem-based approach (design-to-biology) and the solution-based approach (biology-to-design or bottom-up) (Pawlyn, 2019). In this study, a problem-based biomimicry approach, guided by the biomimicry spiral methodology, was employed to develop a decentralized urban energy system inspired by the Wood Wide Web (WWW). Figure 2 illustrates the step-by-step application of the biomimicry spiral, demonstrating how the ecological principles of the WWW were translated into a resilient, cooperative, and adaptive urban energy model.
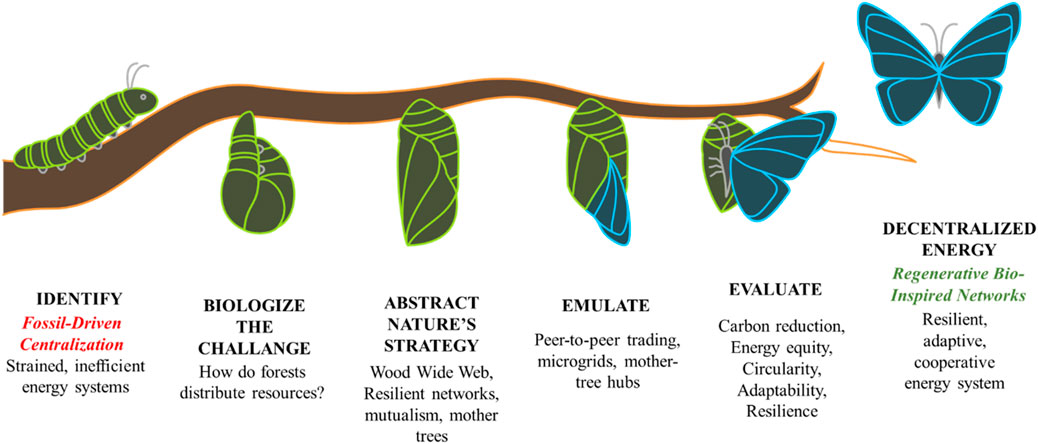
Figure 2. Application of the biomimicry spiral to develop the decentralized urban energy system inspired by the Wood Wide Web.
The process began with identifying the core design challenge: improving the resilience and efficiency of urban energy infrastructure while reducing carbon emissions. This challenge was reframed biologically to seek nature-based strategies that exhibit decentralization, cooperation, and adaptability. The Wood Wide Web, an underground mycorrhizal network that facilitates resource sharing and communication among trees, was identified as an ideal biological model. Its principles of mutual support, dynamic resource exchange, and system-wide resilience were translated into technological components such as peer-to-peer energy trading platforms and energy coordination systems capable of managing, balancing, and redirecting energy in real time based on demand. This bio-inspired urban energy concept was then assessed for performance in terms of energy efficiency, emissions reduction, and adaptability to fluctuating demand, demonstrating the potential of nature-derived strategies to inform innovative and sustainable urban energy solutions.
3.2 Phase II: simulation-based modelling with BIM
Figure 3 shows an overview of the developed building clusters.

Figure 3. Overview of the building cluster 01 and 02. (A) Building cluster 01. (B) Building cluster 02.
3.2.1 Baseline building cluster simulation
A baseline scenario was modelled comprising a cluster of six conventional buildings reflecting typical urban typologies and energy behaviors (See Figure 3A). Each building was modeled to include geometry, materials, HVAC specifications, and climatic data for accurate simulation of operational energy demands. Among different Building Information Modeling (BIM) software, Autodesk Revit was used to develop detailed digital representations of building models. Geographic and climatic settings were adjusted in each model to simulate accurate energy and carbon performance within a consistent environmental context.
3.2.2 Integration of biomimetic “mother tree” node
In the second building cluster, the initial configuration was enhanced through the introduction of a biomimetic building, the London Gherkin, modelled as a high-performance central hub analogous to a “mother tree.” Digitally embedded within the existing cluster, the Gherkin was equipped with advanced renewable energy systems, including photovoltaic (PV) modules with real-time generation monitoring (see Figure 3B). Beyond its distinctive architectural form, Gherkin’s geometry delivers measurable performance advantages that make it an optimal candidate for this role. Its curved, tapering profile minimizes self-shading and ensures more uniform solar exposure across the façade throughout the day and across seasons (Lawson, 2003). A parametric comparison, holding site, façade area, and PV efficiency constant while varying only the façade exposure factor to represent geometry-driven solar availability, indicates that a curved/tapered “Gherkin-like” envelope achieves approximately 8%–12% higher annual PV harvest than a conventional rectangular tower. This performance edge arises from its aerodynamic curvature and 360° exposure, which mitigate orientation-dependent losses and distribute solar gains more evenly (Compagnon, 2004). Unlike flat-sided high-rises, which exhibit significant variation in solar radiation across different orientations, the Gherkin’s geometry distributes gains more evenly, thereby maximizing total PV yield and reducing peak-load disparities. This balanced energy harvesting directly aligns with the “mother tree” function in the biomimetic model, enabling a consistent renewable energy surplus for redistribution to surround “sapling” buildings (Bas et al., 2024; Merckx et al., 2024). In addition, its streamlined form reduces wind-induced turbulence at street level, improving local microclimatic comfort and lowering cooling loads in adjacent buildings (Lawson, 2003). The simulation model was adapted to facilitate this redistribution, allowing surplus renewable energy generated by the Gherkin to be allocated to neighboring buildings with energy deficits. This configuration enabled a direct comparative analysis of system-wide performance before and after integrating the biomimetic component.
3.3 Phase III: simulation and analysis
The process of analyzing energy performance, solar energy generation, and carbon emissions of each building is detailed below. In each simulation, the geographic location was set to London, England, to enhance contextual accuracy, particularly because the Gherkin building, located in London, was integrated into the second cluster.
3.3.1 Assessment of energy analysis in the building models
Several software platforms are available for energy performance assessment, such as Autodesk Revit, IESVE, Design Builder, Energy Plus, and Sefaira (Asdrubali et al., 2021; Autodesk-Insight, 2024). Among these many options, Revit Energy Analysis was selected to estimate the energy consumption of each building in this study, due to its user-friendly interface and robust visualization and reporting capabilities (Ozcan-Deniz and Rodovalho, 2024). Figure 4 shows the steps that were followed to do the energy analysis in Autodesk Revit.
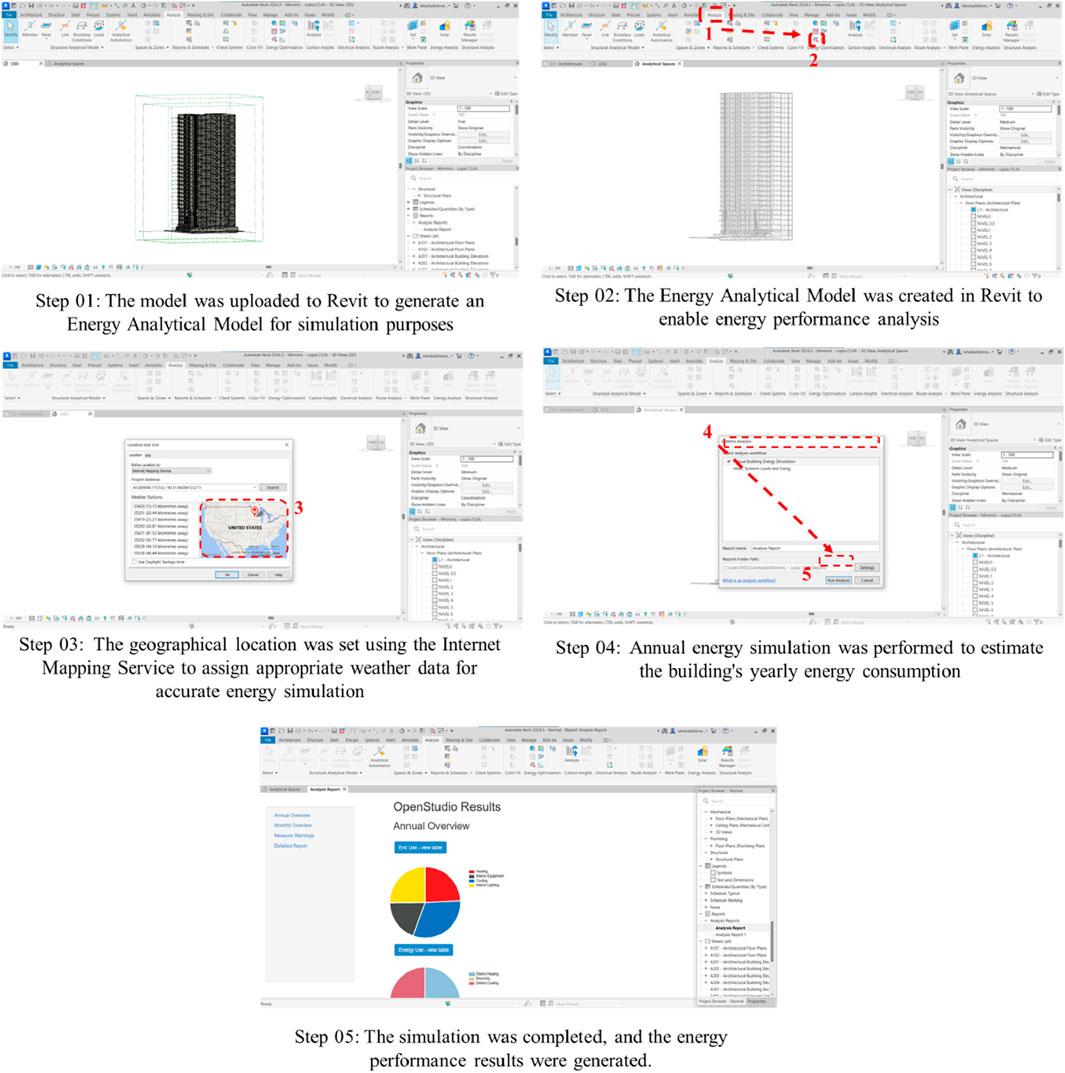
Figure 4. Steps followed to do the energy analysis in Autodesk Revit.
3.3.2 Assessment of solar generation analysis in the building models
The solar energy generation potential of each building within the cluster was evaluated using the Solar Radiation Analysis tool in Autodesk Revit. This tool quantifies and visualizes the amount of solar radiation received by surfaces over a specified period (Kumar et al., 2022). In this study, the analysis was applied to the designated photovoltaic (PV) panel areas on each building to estimate potential solar energy generation based on incident solar radiation. Figure 5 illustrates the step-by-step procedure followed to conduct solar radiation analysis in Autodesk Revit.
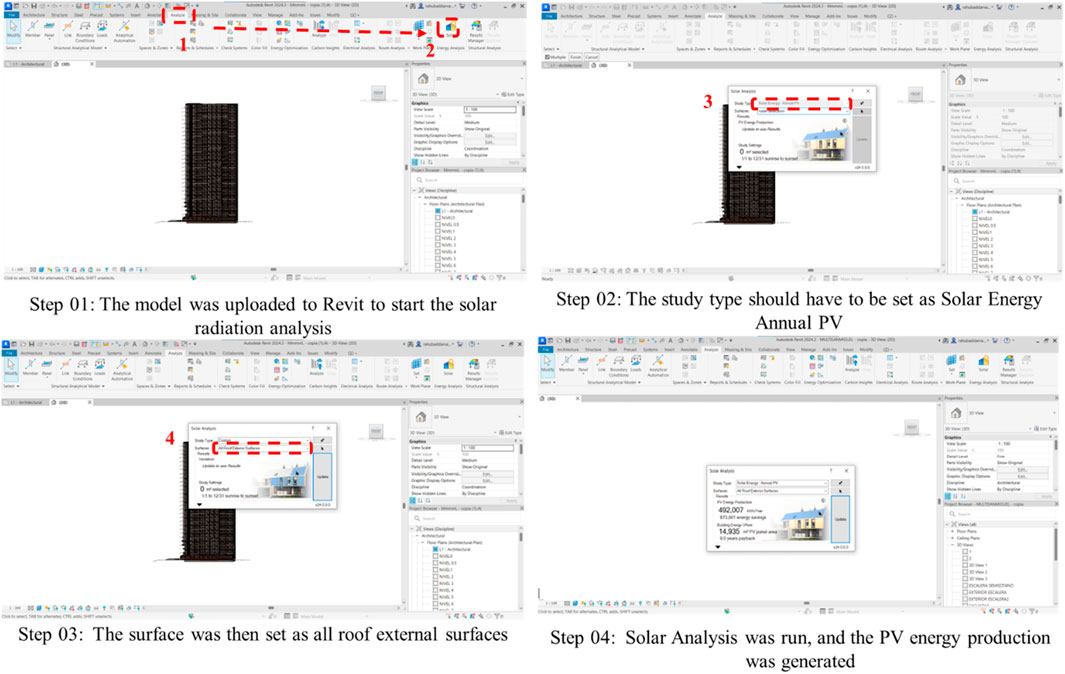
Figure 5. Steps followed to do the solar radiation analysis in Autodesk Revit.
3.3.3 Assessment of total carbon emissions in the building models
Autodesk Carbon Insights, launched in 2025, is an advanced building performance analysis tool that integrates seamlessly with Autodesk Revit, offering architects and design professionals the ability to evaluate both operational and embodied carbon emissions throughout the design process (Molly, 2023). In this study, Autodesk Carbon Insights was applied to calculate the total operational carbon emissions of the building clusters, following the methodological precedent established by Rahubadda et al. (2025), where the tool was comprehensively used to compare the carbon impacts of a bio-inspired building against a conventional counterpart.
For operational carbon, the tool builds upon Autodesk Insight’s Energy Analytical Model by translating simulated building energy use into greenhouse gas emissions. This calculation relies on energy demand outputs (e.g., heating, cooling, lighting, equipment loads) generated from Revit’s Energy Analysis, which are then converted into carbon emissions using regional grid emission factors for electricity and fuel-specific emission factors for natural gas and other energy carriers. In this study, grid-supplied electricity was modeled with an emission factor of 0.225 kgCO2e/kWh, while natural gas was modeled with a factor of 0.184 kgCO2e/kWh, based on data from the Department for Energy Security and Net Zero (2024). This enabled annual operational energy consumption values to be expressed directly as CO2-equivalent emissions. Annual operational carbon was calculated as:
Where Ee is annually delivered energy by carrier from Insight and EFe is the carrier-specific emission factor.
For embodied carbon, Carbon Insights leverages the EC3 (Embodied Carbon in Construction Calculator) dataset developed by Building Transparency, which includes extensive embodied carbon data sourced from third-party verified Environmental Product Declarations (EPDs). These EPDs, in conjunction with quantity takeoffs extracted from BIM models or construction estimates, enable detailed assessments of material-related carbon impacts across various design and procurement phases (Carbon Leadership Forum, 2023). Embodied carbon was calculated as
Where Qi is the model-derived quantity (mass or area mapped to mass) of material i and EFi is the corresponding EC3 EPD factor.
Figure 6 illustrates the workflow followed to conduct the carbon assessments within Autodesk Revit.
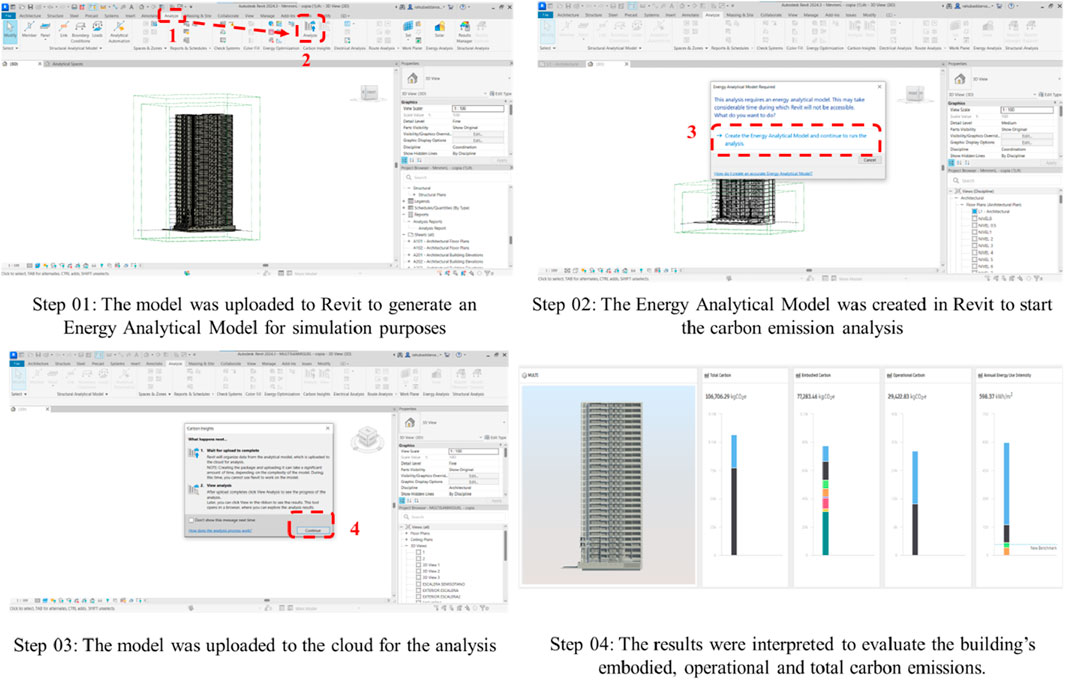
Figure 6. Steps followed to do the carbon emission analysis in Autodesk Revit.
In addition to its data depth, Autodesk Carbon Insights features interactive dashboards that allow for dynamic visualization and comparison of carbon metrics, empowering design teams to make more informed and environmentally responsible decisions.
3.4 Simulation assumptions
Table 1 shows the summary of simulation input parameters and data sources used in this study.
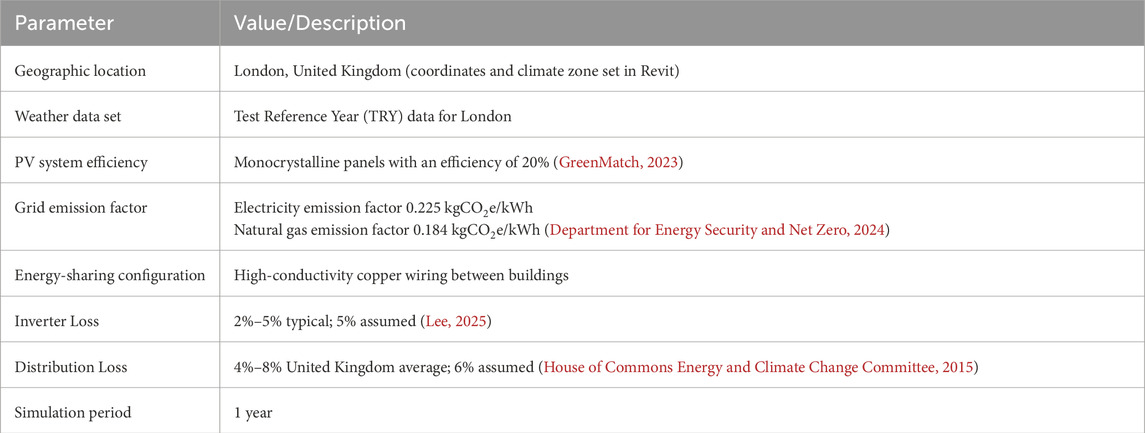
Table 1. Summary of simulation input parameters and data sources.
A photovoltaic (PV) glass panel family was created in Autodesk Revit and applied to the Gherkin’s façade geometry. Façade yields were bounded at 55%–75% of optimally tilted arrays (Kuhn et al., 2021). The modelling assumed a performance ratio of 0.75, a temperature coefficient of −0.0045/°C, and an inverter efficiency of 96% adhering with IEA PVPS, (2025). Shading was derived from BIM, geometry and urban context.
4 Results
This section presents the outcomes of implementing a Wood Wide Web-inspired urban energy-sharing model, highlighting its impact on energy performance, carbon emissions, and system resilience through simulation-based analysis.
4.1 Conceptualizing a wood wide web-inspired urban energy system
Figure 7A presents a schematic representation of the Wood Wide Web, illustrating the complex, bidirectional exchange of nutrients, signaling compounds, and information among diverse tree species through subterranean mycorrhizal networks.
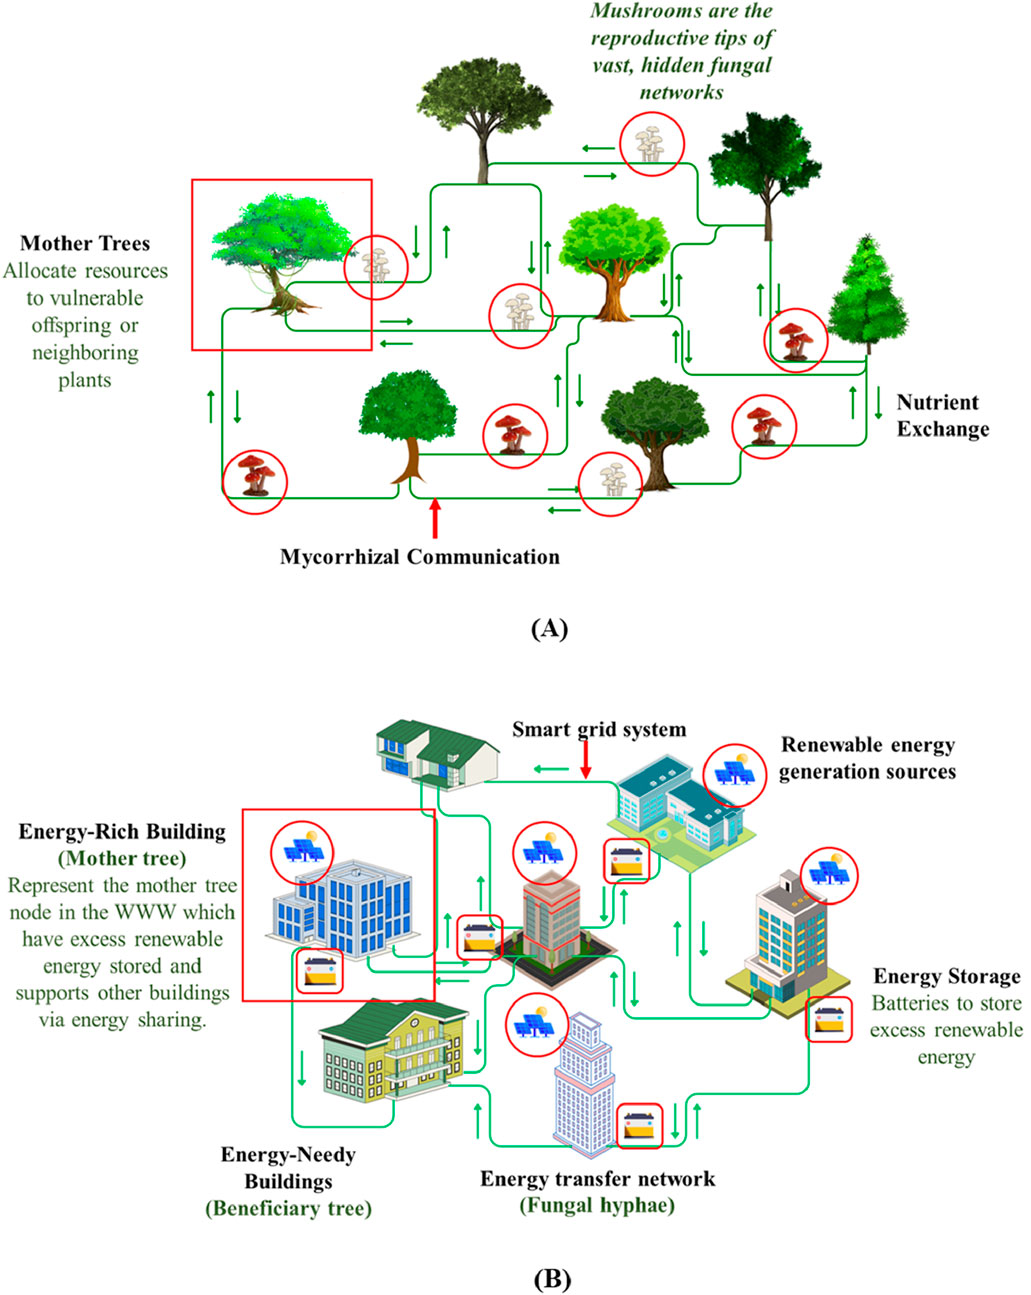
Figure 7. Schematic representation of (A) the Wood Wide Web and (B) the biomimetic urban energy system.
The Wood Wide Web exemplifies a decentralized, cooperative network in which trees and fungi engage in mutualistic exchanges of energy, nutrients, and information, ensuring resilience and resource efficiency within the forest ecosystem. This natural system operates without centralized control, instead relying on dynamic, responsive communication pathways to maintain ecological balance. Inspired by this model, Figure 7B illustrates the application of these biomimetic principles to an urban building energy system. Analogous to how trees support each other through shared mycorrhizal networks, buildings are conceptualized as active nodes within an interconnected energy-sharing ecosystem.
Within this model, buildings of varying typologies and functions are interconnected through energy-sharing pathways, that facilitate the distribution and exchange of energy across the network. Bidirectional energy flows, represented by arrows, facilitate the transfer of surplus renewable energy from buildings with excess generation to those experiencing an energy deficit. This arrangement forms the basis of a peer-to-peer (P2P) energy exchange network, wherein buildings operate not as isolated entities but as integrated components of a cooperative energy community.
Such a model enables the dynamic redistribution of locally generated renewable energy, promoting energy equity across the building cluster while enhancing the resilience of the urban energy infrastructure. Buildings equipped with on-site renewable technologies, such as photovoltaic panels or micro wind turbines, act as active energy “hubs” or “nodes,” supplying nearby structures in real time. This decentralized approach reduces reliance on centralized grid systems and aligns with the principles of circular construction and sustainability.
4.2 Importance of implementing the system as a hybrid energy network
However, on-site renewable generation may not consistently meet building energy demands. To ensure both resilience and operational efficiency, the urban energy system must be designed as a hybrid network that integrates diverse energy sources and supports multidirectional energy flows. This hybrid framework comprises three interdependent layers, on-site renewable generation, peer-to-peer energy exchange, and grid connectivity, each crucial for maintaining system stability and minimizing carbon emissions (see Figure 8). When local generation cannot meet the aggregate demand, the system provides redundancy and adaptability through strategic integration of supplemental sources and storage solutions, thereby ensuring continuous energy supply.
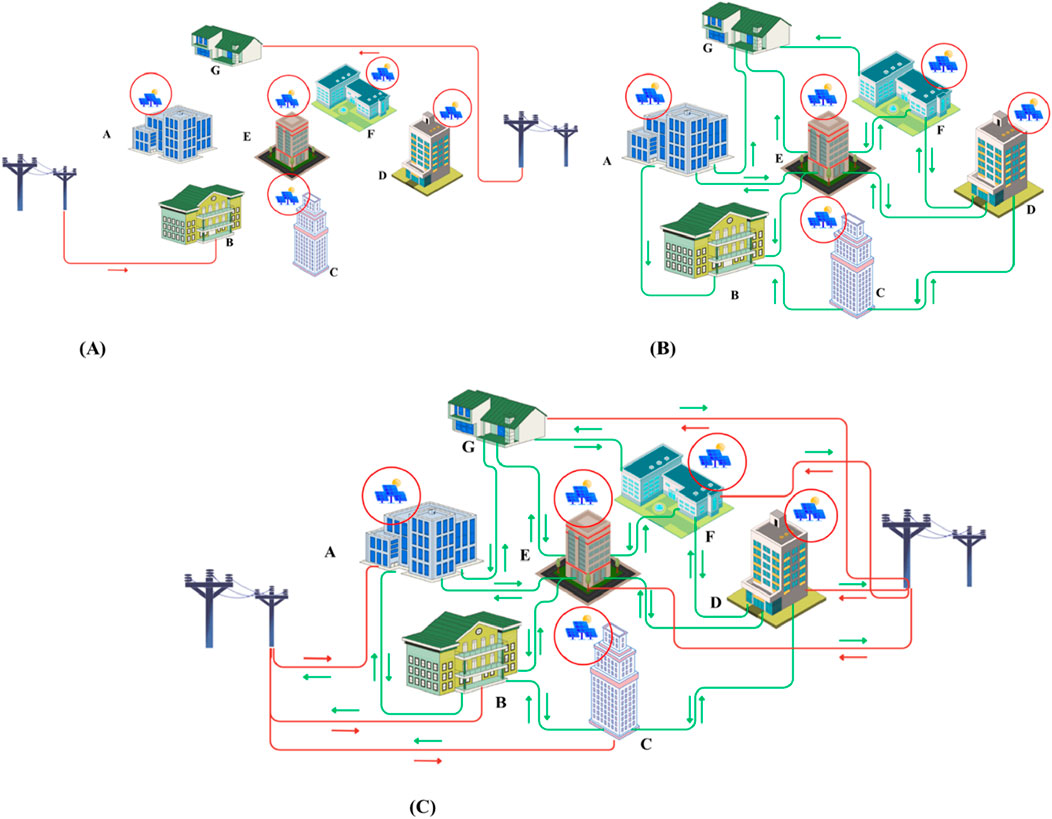
Figure 8. The Hybrid Network: (A) Layer I: On-site renewable energy generation, (B) Layer 2: Peer-to-Peer (P2P) energy sharing, (C) Layer 3: Grid integration for redundancy.
4.2.1 Layer 1: on-site renewable energy generation
This layer includes the building-level generation of renewable energy through technologies such as solar photovoltaic (PV) panels, micro wind turbines, and building-integrated renewable systems (see Figure 8A). Some buildings within the network function as micro power plants, generating clean energy to meet their own demands and potentially producing a surplus for distribution to others. This decentralized energy generation reduces the carbon footprint and mitigates pressure on the central grid.
In Figure 8A, buildings A, C, D, E, and F are equipped with solar panels (representing the mother trees within the cluster), enabling them to generate renewable energy onsite through solar photovoltaic systems. In contrast, buildings B and G lack the necessary solar potential or infrastructure for renewable energy generation and therefore rely entirely on the main electrical grid for their energy needs.
4.2.2 Layer 2: peer-to-peer (P2P) energy sharing
Inspired by the Wood Wide Web, this layer enables buildings to share surplus energy with each other through a cooperative energy network. Buildings with excess renewable energy (e.g., during peak solar hours) can directly supply neighboring structures that are experiencing energy deficits (see Figure 8B). This mimics the mutualistic resource exchange observed in natural ecosystems and supports a more equitable, efficient, and circular use of energy at the community level.
In this building cluster, buildings are interconnected in a local energy-sharing network that allows them to transfer surplus solar energy to buildings B and G, which lack the infrastructure or solar potential for onsite generation. This cooperative energy exchange enhances the overall efficiency and sustainability of the cluster by optimizing renewable energy utilization across all buildings.
4.2.3 Layer 3: grid integration for redundancy
The third layer is a connection to the main utility grid, which acts as a reliable backup. When neither self-generation nor peer-to-peer exchange is sufficient, due to high demand, poor weather conditions, or low storage availability, buildings can draw energy from the central grid. This ensures energy security and maintains uninterrupted operations, especially in critical or high-density areas. Conversely, in times of surplus, buildings may also feed clean energy back into the grid (see Figure 8C).
This symbolizes the transition from centralized, isolated infrastructure to a decentralized, biomimetic urban energy system. Inspired by the forest’s Wood Wide Web, buildings in an urban setting can be reimagined as living agents in a regenerative network, capable of sharing, supporting, and adapting. Just as trees communicate and exchange resources for mutual survival, urban buildings can form cooperative energy-sharing networks, where renewable energy surpluses are redistributed, and energy deficits are mitigated through smart, local transfers. This not only supports net-zero energy targets but also embodies the principles of circular construction by closing energy loops, minimizing waste, and enhancing resilience in the face of climate-related disruptions. The forest teaches us that sustainability is not about competition, but collaboration, and by mimicking this logic, cities can evolve into resilient, low-carbon ecosystems.
4.3 Assessing the impact of a wood wide web-inspired energy network in an urban building cluster
To assess the viability and impact of this biomimetic energy model, a baseline analysis was conducted on a conventional urban building cluster (see Figure 3A). For experimental purposes, the buildings within the cluster were interconnected using high-conductivity copper cables to enable intra-cluster energy transfer. This preliminary assessment aimed to understand existing energy consumption patterns, generation capacity, and inter-building energy dynamics. The findings provide a reference point for evaluating how a Wood Wide Web-inspired system could improve energy efficiency, resource distribution, and carbon reduction at the local scale.
4.3.1 Energy performance and renewable energy generation capacity
Figure 9 presents a comparative analysis of energy consumption and renewable energy generation for building cluster 01.
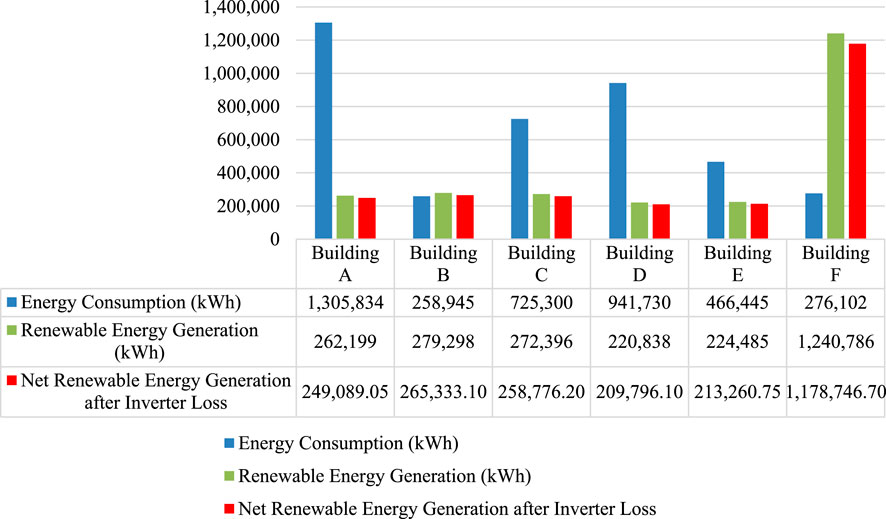
Figure 9. Comparison of energy consumption and renewable energy generation across building cluster 01.
The data reveals a significant imbalance between energy demand and on-site renewable production for buildings A through E. In each of these cases, energy consumption far exceeds the capacity for local renewable generation, highlighting a systemic dependency on external energy sources. In contrast, building F demonstrates a reverse trend, generating a substantial surplus of renewable energy, 1,178,746.7 kWh, compared to its relatively low consumption of 276,102 kWh. This makes Building F a potential energy “hub” within the network, capable of supplying adjacent buildings through peer-to-peer (P2P) energy transfer mechanisms. Despite this internal redistribution potential, the overall system still faces a collective shortfall.
After accounting for the renewable energy generated and consumed by each building, the cluster records a net energy deficit of 1,599,354.10 kWh. Buildings B and F contribute a combined surplus of 909,032.80 kWh, which, after adjusting for distribution losses, is reduced to 872,671.49 kWh. This surplus is insufficient to fully offset the overall deficit, particularly the substantial shortfalls of high-demand Buildings A and C. Nevertheless, it is adequate to cover the unmet energy needs of Building D and to reduce Building E’s net grid consumption to 112,446.66 kWh, once its self-generated renewable supply is exhausted.
This scenario underscores the necessity of a hybrid energy system, in which P2P sharing is complemented by supplemental input from the central grid. Such a design ensures operational continuity, enhances resilience, and reduces reliance on fossil-based power sources.
4.3.2 Carbon emission assessment–comparative scenarios
Figure 10 shows the results obtained from Autodesk Carbon Insights on the carbon emissions from the building cluster 01.
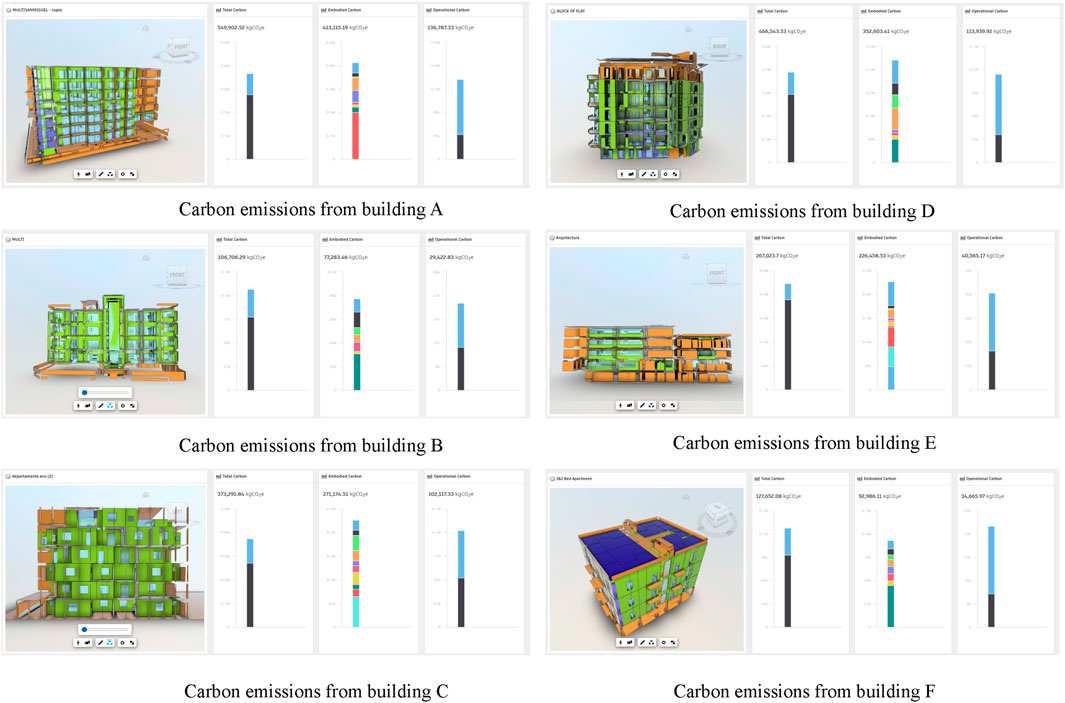
Figure 10. Autodesk Carbon Insights: analysis of carbon emissions for the buildings within the cluster buildings (A–F).
The impact on annual operational carbon emissions was assessed across three configurations (see Figure 11): 1) a conventional centralized energy system relying solely on grid electricity (see Figure 11A), 2) decentralized self-consumption of renewable energy generated by individual buildings (see Figure 11B), and 3) a renewable energy sharing system inspired by the Wood Wide Web (WWW) concept (see Figure 11C).
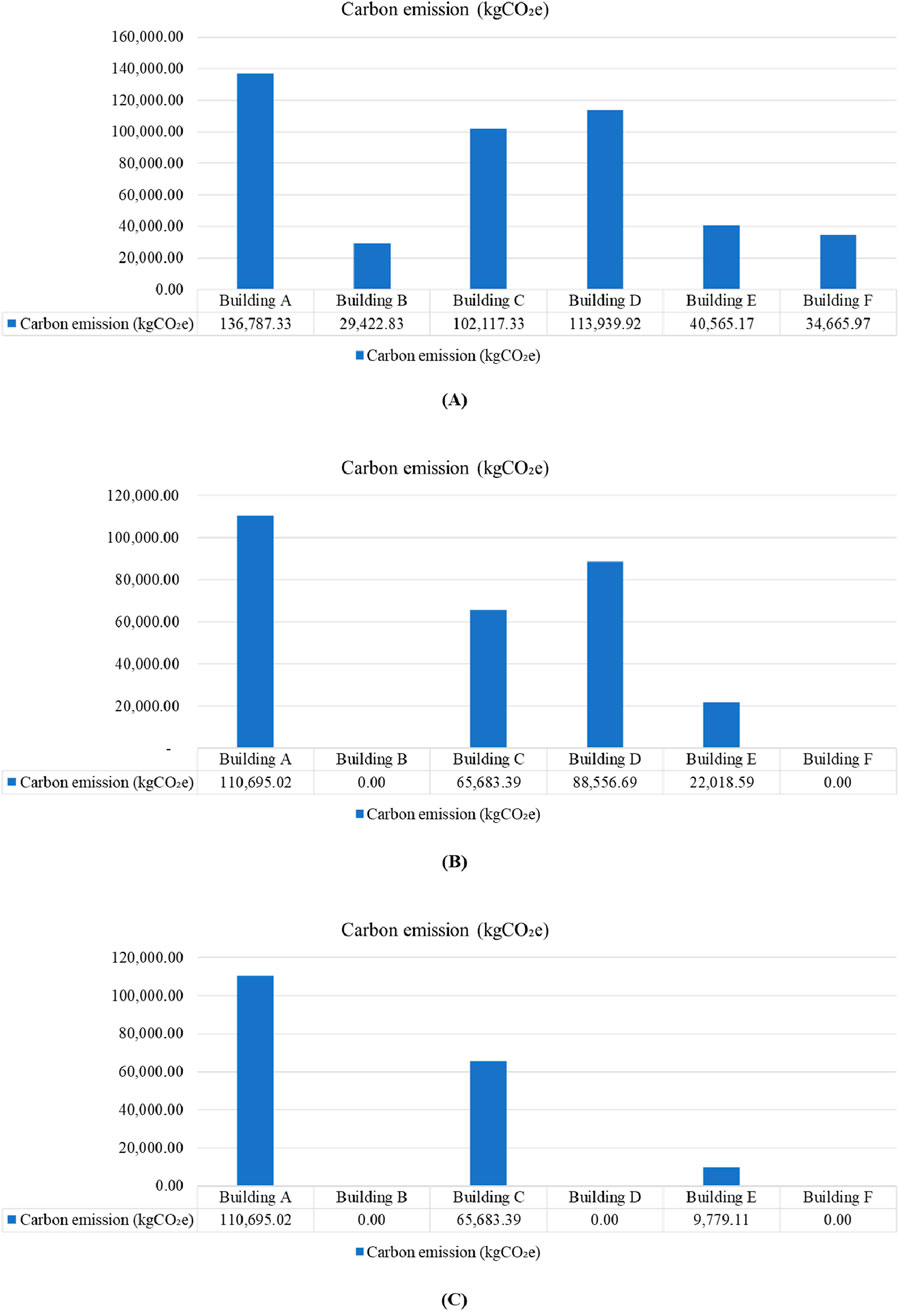
Figure 11. Annual operational carbon emissions associated with the buildings: (A) all energy demand is met exclusively through grid-supplied electricity, (B) self-generated renewable energy is prioritized, (C) operating under a fully integrated energy-sharing model inspired by the Wood Wide Web.
4.3.2.1 Scenario I: centralized grid reliance
Figure 11A presents the annual operational carbon emissions of the buildings under the scenario where all energy demand is met exclusively through grid-supplied electricity, totaling 457,498.55 kgCO2e across the cluster.
Building A exhibits the highest emissions at 136,787.33 kgCO2e, reflecting its substantial energy demand and limited capacity for on-site renewable energy generation. Buildings C and D also demonstrate elevated emissions levels, 102,117.33 kgCO2e and 113,939.92 kgCO2e, respectively, underscoring the carbon-intensive nature of their operational energy reliance. In contrast, Buildings B, E, and F register comparatively lower carbon footprints. Notably, Building F, which generates a large surplus of renewable energy, records emissions of only 34,665.97 kgCO2e, indicating its potential to significantly reduce dependence on grid electricity if properly integrated into a peer-to-peer energy sharing system. Similarly, Building B, despite limited generation, shows low emissions (29,422.83 kgCO2e) due to its modest energy consumption.
These findings underscore the critical importance of on-site renewable energy integration and intra-cluster energy redistribution in mitigating urban carbon emissions. They further reinforce the need for hybrid energy systems that combine localized generation with coordinated sharing mechanisms to reduce overall environmental impact and enhance sustainability across building networks.
4.3.2.2 Scenario II: self-consumption of renewable energy
Figure 11B presents the projected annual operational carbon emissions (kgCO2e) for each building in the cluster under a scenario where self-generated renewable energy is prioritized, and grid electricity is used only when on-site generation is insufficient. Under this configuration, total cluster-wide emissions are reduced to 286,953.69 kgCO2e, representing a 37% reduction compared to the grid-only scenario.
Buildings B and F exhibit zero emissions, indicating that their on-site renewable generation capacity is sufficient to fully meet their energy demands. This self-sufficiency eliminates the need for grid-supplied electricity, thereby avoiding any associated carbon emissions. Emissions in the other buildings, though still present, are significantly reduced relative to the grid-only baseline. For instance, Building A’s emissions decline from 136,787.33 kgCO2e (as seen in the previous scenario) to 110,695.02 kgCO2e, while Building D’s emissions decrease to 88,556.69 kgCO2e. Building C and E also show considerable reductions, with revised emissions of 65,683.39 kgCO2e and 22,018.59 kgCO2e, respectively.
These reductions underscore the positive impact of integrating local renewable energy systems, particularly when combined with energy autonomy and storage capabilities. Furthermore, the scenario highlights the strategic importance of leveraging surplus-producing buildings, such as F and B, in a peer-to-peer network, to offset emissions in more energy-intensive counterparts and move toward a low-carbon urban energy ecosystem.
4.3.2.3 Scenario III: peer-to-peer sharing via WWW model
Figure 11C illustrates the annual operational carbon emissions (kgCO2e) of each building within the urban cluster when operating under a fully integrated energy-sharing model inspired by the Wood Wide Web concept.
In this model, buildings with surplus renewable energy, such as Buildings B and F, distribute excess generation to others within the cluster, particularly those with insufficient self-generation capacity. As shown, Buildings B, D, and F achieve zero emissions, indicating that their energy demands are entirely met through renewable sources, either self-generated or received via the peer-to-peer network. This highlights the transformative potential of cooperative energy exchange in creating low-carbon urban environments.
Notably, Building E achieves a substantial emissions reduction of 9,779.11 kgCO2e, representing a 76% decrease. At the cluster scale, total annual operational carbon emissions are reduced to 186,157.52 kgCO2e, corresponding to a 59% improvement compared to the scenario I. These reductions are primarily attributed to the import of surplus renewable energy from other buildings, which offsets a significant portion of their grid-dependent demand.
The results underscore the effectiveness of the proposed energy-sharing system, where interconnected buildings dynamically redistribute renewable energy in real time. This approach not only improves carbon efficiency across the cluster but also enhances energy equity and resilience, aligning with regenerative urban design principles and circular energy systems. It reinforces the notion that, much like trees in a forest ecosystem, urban buildings can thrive through collaboration rather than competition.
4.4 Biomimetic cluster with “mother tree” (cluster 02)
This urban cluster was inspired by the ecological principle in which large, mature trees, often termed “mother trees”, support younger or stressed trees by redistributing surplus resources, particularly during periods of environmental stress (see Figure 3B). To translate this principle into the built environment, the Swiss Re Building, commonly known as “The Gherkin,” was selected as the architectural analogue of the mother tree. Renowned for its energy-efficient form and innovative natural ventilation system, the Gherkin-inspired structure functions as the central hub within the cluster. Acting as a dominant, energy-positive node, it is envisioned to support surrounding buildings by sharing surplus renewable energy, thereby enhancing the resilience, interconnectivity, and sustainability of the entire urban system. Figure 12 illustrates the annual solar energy generation potential of the Gherkin building model, based on the assumption of a photovoltaic glass façade.
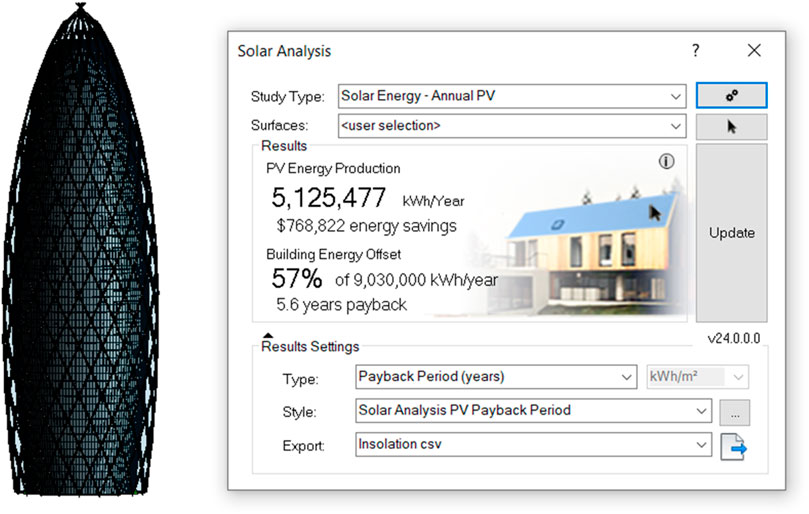
Figure 12. Annual solar energy generation potential of the Gherkin building model, based on the assumption of a photovoltaic glass façade.
The solar analysis shows that, under the assumption that the façade is made of photovoltaic glass, the building’s PV system can generate approximately 5.13 million kWh per year. This offsets 57% of the building’s total energy demand (9.03 million kWh/year). Figure 13 presents a comparative analysis of energy consumption and on-site renewable energy generation across the buildings within the second cluster.
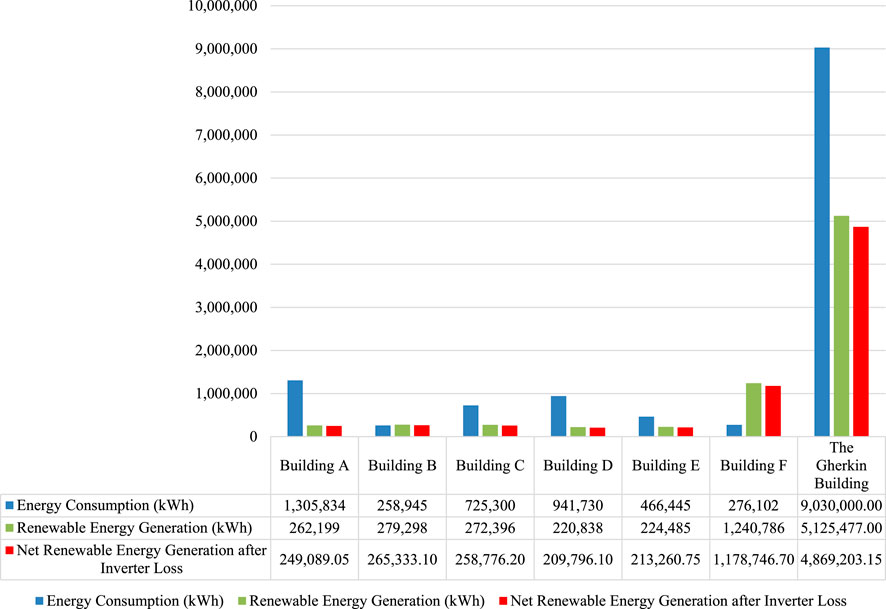
Figure 13. Comparison of energy consumption and renewable energy generation across building cluster 02.
The Gherkin building, conceptualized as the biomimetic “mother tree,” demonstrates an exceptional capacity for both renewable energy generation and redistribution within the cluster. It produces approximately 4,869,203.15 kWh of solar energy annually (after accounting for inverter losses), which exceeds the combined net demand of the surrounding Buildings A–F (1,635,715.41 kWh per year after their own renewable contributions). When distribution losses are considered, this demand rises slightly to 1,717,501.18 kWh. Consequently, after meeting the needs of the other buildings, Gherkin’s renewable generation results in a surplus of 3,151,701.97 kWh.
According to Lawson (2003), the project’s architect (Foster + Partners) estimated the Gherkin’s energy consumption at 140 kWh/m2 per year, approximately one-third less than a conventional building. With a total floor area of 64,500 m2, this equates to an annual energy demand of about 9,030,000 kWh. After offsetting this demand with the building’s renewable energy surplus of 3,151,701.97 kWh, the Gherkin would still require 5,878,298.03 kWh from the main grid.
Using this baseline, the total carbon emissions of the cluster, assuming complete dependence on grid-supplied electricity, are estimated at 2,732,082.80 kgCO2e. However, when the Gherkin functions as the central energy-sharing hub, redistributing its surplus renewable energy to Buildings A through F, their emissions effectively drop to zero. As a result, the cluster’s total carbon footprint decreases to 1,480,695.92 kgCO2e, representing a net reduction of 1,251,386.88 kgCO2e, or a 46% decrease in annual operational carbon output.
5 Discussion
This study advances the field of sustainable urban energy systems by proposing and validating a decentralized urban energy system inspired by the Wood Wide Web (WWW). By translating the functional principles of mycorrhizal networks into urban energy planning, this research contributes to both the theoretical understanding and practical modeling of regenerative infrastructure.
5.1 Biomimetic intelligence and the reimagination of urban energy systems
Contemporary urban energy systems are predominantly centralized, rigid, and vulnerable to shocks, a paradigm increasingly misaligned with the needs of rapidly urbanizing and climate-stressed cities (Rutter and Keirstead, 2012; Lund et al., 2014). The application of biomimicry, particularly the WWW, contests this outdated model by proposing distributed, resilient, and cooperative architecture. As Capra and Luisi (2014) argue, ecosystems thrive through relational intelligence and systemic interdependence, an insight directly mirrored in the WWW’s mutualistic exchanges of energy and nutrients (Field and Magkourilou, 2023).
This study reconceptualizes buildings as intelligent, communicative “nodes” within a responsive energy-sharing network, thus operationalizing the biomimicry ethos of “function over form” (Pawlyn, 2019). The proposed hybrid energy model fosters self-organization among buildings, allowing them to adapt to fluctuating conditions through embedded feedback loops, respond dynamically to each other’s energy needs, and function without reliance on centralized control. This approach mirrors the decentralized coordination observed in forest ecosystems, particularly through the Wood Wide Web, a mycorrhizal network that enables interspecies nutrient exchange and resilience (Alizadeh, 2011; Richard, 2018). Emulating such ecological intelligence, the model introduces a three-layer energy architecture comprising local generation, peer-to-peer (P2P) exchange, and grid integration. This design ensures systemic adaptability under stress, such as during peak demand or supply disruptions. Redundancy and distributed feedback, hallmarks of the Wood Wide Web, are built into the system, enabling continuous energy provision even during blackouts or grid failures via localized generation and cooperative redistribution. By shifting from extractive, siloed infrastructure paradigms to adaptive, circular, and regenerative urban metabolisms (Preston, 2012; Ellen MacArthur Foundation, 2015), this framework not only enhances energy efficiency but also fortifies socio-technical resilience. In alignment with resilience theory (Dalla Rosa and Christensen, 2011; Mohammad et al., 2020), the model affirms that decentralized urban systems are inherently more capable of absorbing and recovering from systemic shocks than their centralized counterparts. In doing so, it offers a nature-inspired blueprint for robust, adaptable, and sustainable urban energy futures (Bas et al., 2024).
5.2 Carbon efficiency and performance validation
The modeled scenarios underscore the quantitative benefits of bioinspired energy systems. As with mycorrhizal networks that redistribute nutrients to maintain forest health (Reinhart et al., 2012), the WWW-inspired energy system facilitates energy redistribution to enhance system-wide carbon efficiency. Most notably, Scenario III resulted in the complete elimination of operational carbon emissions in three out of six buildings within the modeled cluster, while reducing emissions in Building D by 76% compared to the grid-only baseline. These reductions not only validate the systemic efficiencies of cooperative energy exchange but also support Blok and Nieuwlaar (2016) assertion that integrated, decentralized infrastructures significantly outperform siloed systems in terms of emissions intensity and adaptive capacity.
A particularly salient innovation is the integration of a high-performance, energy-positive “mother tree” structure (modeled on the Gherkin) functioning as a keystone energy hub. In Cluster 2, this structure alone was responsible for an annual emissions reduction of 1,251,386.88 kgCO2e, offsetting the total demand of all six adjacent buildings and retaining a net surplus of 3.2 million kWh. Such a magnitude of savings confirms the potential of flagship regenerative buildings to function as energy resilience multipliers, aligning with Gunasekaran et al. (2023) and Buck (2017), who advocate for architectural forms that serve not only as symbols but as functional hubs in urban climate adaptation. Further, this outcome supports the emergent theory of “positive energy districts,” which emphasizes high-performing anchor structures that orchestrate local energy flows, reduce grid dependency, and catalyze neighborhood-wide decarbonization (Yoshino et al., 2017). The Gherkin’s role as a biomimetic analog to ecological keystone species is especially instructive: much like dominant trees redistribute carbon, nutrients, and water to support forest community stability, the “mother tree” typology demonstrates how urban infrastructure can foster collective ecological performance (Merckx et al., 2024). The substantial carbon reductions observed across Scenarios III in cluster 01 and cluster 02 meets the EU’s 2030 decarbonization target of a 55%–60% reduction in building-sector emissions (European Commission, 2020), while aligning with the energy Performance of Buildings Directive’s 2050 vision for zero-emission districts. The modeled peer-to-peer system and energy-positive hub deliver reductions that validate biomimetic infrastructures as frontrunners in operationalizing EU climate objectives.
5.3 Design and governance implications
The implications of this research extend beyond technical optimization, informing both architectural design thinking and policymaking. From a design perspective, the biomimetic cluster model exemplifies how ecological intelligence can be encoded into spatial and infrastructural form, fostering cooperation, resource-sharing, and regenerative performance at the neighborhood scale. This echoes regenerative design theory, which calls for built environments that actively participate in the health of their surrounding ecosystems (Sukhdev et al., 2018).
The use of tools such as Autodesk Revit and Carbon Insights proved instrumental in simulating energy flows and carbon dynamics, demonstrating the utility of performance-driven, data-integrated platforms in guiding real-time sustainability decision-making (Kamel and Memari, 2019; Ozcan-Deniz and Rodovalho, 2024). These digital environments facilitate scenario testing, foster design accountability, and support the convergence of aesthetic, ecological, and operational goals.
From a governance standpoint, enabling widespread P2P energy exchange necessitates progressive regulatory frameworks addressing net metering, microgrid operation, data interoperability, and decentralized market participation (Emec et al., 2015; Rambelli et al., 2017). In principle, such frameworks could support the creation of local energy markets with dynamic pricing mechanisms. However, the practical design of tariffs, settlement, and redistribution rules is highly jurisdiction-specific and remains constrained by existing metering and grid codes. For instance, the EU Electricity Market Directive (2019/944) formally recognizes Citizen Energy Communities but stipulates that participation must be open, non-discriminatory, and subject to proportionate regulation. In the UK, Ofgem’s regulatory sandbox has enabled small-scale trials of P2P energy trading, yet within strict boundaries to ensure consumer protection, market stability, and system balancing (Office of Gas and Electricity Markets, 2025).
These developments suggest that while biomimetic models highlight the potential for cooperative redistribution, real-world adoption depends on evolving policy, institutional innovation, and supportive governance mechanisms. The transition from centralized control to polycentric governance remains critical, aligning with the broader literature on urban energy transitions, which emphasizes stakeholder co-production and adaptive regulation as prerequisites for decarbonized, resilient urban futures (Caprotti et al., 2017; Fuso Nerini et al., 2017).
5.4 Beyond energy: extending the wood wide web concept to building systems
Apart from energy sharing, the Wood Wide Web concept can be further applied to the built environment to facilitate the decentralized exchange of other resources, such as thermal energy, wastewater heat recovery, greywater for irrigation, and even data or sensor signals. One such application is the development of an integrated urban water-sharing system, which could significantly reduce reliance on freshwater sources by enabling decentralized collection, storage, and redistribution of non-potable water across buildings within a cluster. Figure 14 illustrates a model of an integrated urban resource-sharing network, extending beyond energy exchange to encompass additional utilities such as water reuse. The diagram depicts multiple buildings connected through a web of bidirectional flows, representing the circulation of resources such as treated greywater, rainwater harvesting outputs, or wastewater suitable for non-potable applications.
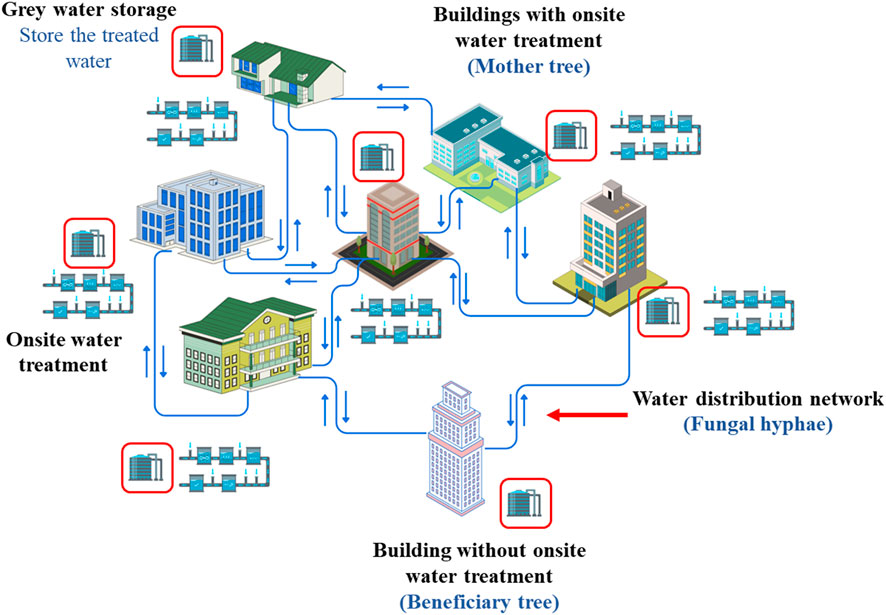
Figure 14. Wood Wide Web inspired water distribution system.
In this system, buildings function as both sources and recipients of shared resources. For instance, the used water discharged from residential or commercial buildings can be captured, treated on-site or centrally, and then redistributed for secondary uses in other buildings, such as irrigation, toilet flushing, cooling, or industrial processes. This closed-loop configuration echoes the principles of circular urban metabolism, where waste from one node becomes a resource for another.
By adopting such interbuilding synergies, urban developments can significantly reduce water consumption, minimize infrastructure loads, and enhance the overall sustainability and resilience of the built environment. This decentralized, biomimetic approach encourages collaboration across sectors, promotes resource equity, and exemplifies the potential of regenerative design thinking in shaping the cities of the future.
5.5 Enabling circular cities through biomimetic infrastructure
The Wood Wide Web-inspired approach directly supports the transition toward a circular city in the built environment (Vanhuyse et al., 2021). In contrast to the traditional linear “take-make-dispose” model, a circular city model aims to close energy and material loops, maximize local resource use, and eliminate waste (Preston, 2012; Fusco Girard and Nocca, 2019). Through the real-time redistribution of locally generated renewable energy, this model embodies urban symbiosis, an essential tenet of the circular economy (Chertow, 2000).
The peer-to-peer (P2P) energy architecture exemplifies circularity by closing energy loops, minimizing system-level waste, and decentralizing production (Fusco Girard and Nocca, 2019; Ellen MacArthur Foundation, 2015). In this networked configuration, buildings transition from isolated, self-contained units to interdependent nodes within a dynamic, adaptive energy-sharing ecosystem. This structural transformation mirrors nutrient cycles in ecological systems, where outputs are continuously reintegrated as inputs, fostering system resilience and resource circularity (Ellen MacArthur Foundation, 2015; Marin and De Meulder, 2018).
Extending this ecological logic to other areas within the built environment further amplifies circularity. As discussed in Section 5.4, the incorporation of decentralized water reuse infrastructure, such as greywater treatment for irrigation and passive cooling, emulates natural hydrological cycles and alleviates pressure on centralized water networks. This approach reinforces the principles of urban metabolism, positioning cities as regenerative ecosystems that recirculate resources rather than operate as linear, extractive machines (Sukhdev et al., 2018). In this respect, the application of the WWW analogy contributes not only to energy efficiency but also to the resilience and circularity goals articulated in the Paris Agreement (Delbeke et al., 2019) and the New Urban Agenda (Caprotti et al., 2017).
5.6 Limitations and research outlook
While the results are promising, several limitations must be acknowledged. Practical considerations such as economic feasibility, lifecycle costs, and payback period of the proposed PV and energy-sharing infrastructure, as well as the embodied carbon associated with manufacturing, transporting, and installing the additional PV systems, were beyond the scope of this study but remain essential for evaluating large-scale viability. Similarly, policy, regulatory, and grid interconnection constraints may limit or delay deployment, especially in jurisdictions with restrictive net-metering rules or complex permitting processes.
When developing the Gherkin-based “mother tree” model, it was assumed that the entire building façade was equipped with photovoltaic glass panels to maximize solar generation based on its distinctive geometry. This is an idealized scenario that may not fully align with real-world constraints related to material performance, façade orientation, shading, and structural load limits.
The selected building cluster was modeled as physically interconnected using high-conductivity copper wiring to enable basic energy exchange between buildings. However, to achieve optimal system performance and real-time balancing in practice, advanced digital tools such as Artificial Intelligence (AI) and machine learning algorithms should be integrated. These can forecast demand, identify surpluses and deficits, and coordinate efficient redistribution strategies, mirroring the adaptive, dynamic nutrient flows of mycorrhizal networks. Future research should therefore combine technical, economic, policy, and lifecycle carbon assessments to provide a more holistic evaluation of the proposed Wood Wide Web-inspired energy-sharing system.
6 Conclusion and way forward
This study was developed to evaluate the potential of biomimicry to transform urban energy systems and reduce carbon emissions in the built environment. Drawing inspiration from the Wood Wide Web (WWW), a decentralized, cooperative, and adaptive network found in forest ecosystems, a novel urban energy framework was conceptualized, modeled, and tested. The system was applied to urban building clusters, with simulations comparing baseline, peer-to-peer, and biomimicry-enhanced configurations. Results demonstrated a significant reduction in operational carbon, with some buildings achieving net-zero emissions and others benefiting from surplus energy redistributed through cooperative exchange. Notably, the inclusion of a high-performance “mother tree” building led to a cluster-wide emission reduction of over 1,251,386.88 kgCO2e, emphasizing the systemic advantages of regenerative, biomimetic hubs within urban networks. This confirms the substantial potential of biomimicry as a viable pathway to decarbonize the built environment, enhance system resilience, and support circular city models. By embedding ecological intelligence into urban infrastructure, the study provides a blueprint for future-ready cities that operate more like ecosystems, adaptive, resilient, and symbiotic.
This research addresses a critical gap in both literature and practice by advancing biomimicry beyond building-level aesthetics or materials into functional, scalable systems thinking for urban energy infrastructure. It provides a quantitative framework for assessing decentralized energy sharing, validated using advanced BIM and carbon analysis tools such as Autodesk Revit, Insight, and Carbon Insights. These findings offer design professionals, engineers, and policymakers’ practical insights into how natural systems can inform the planning of zero-carbon cities. Additionally, the study sets a foundation for future research and regulatory development in urban sustainability by demonstrating how real-time energy performance and resource flow can be modeled, optimized, and managed through nature-inspired logics.
Looking ahead, the WWW-inspired model opens transformative opportunities for urban energy design. While this study focused on the energy domain, future research should expand its application to multi-utility systems including water, material reuse, and thermal flows. Moreover, implementing real-world pilot projects, conducting life-cycle cost analyses, and exploring ecosystem-level biomimicry strategies will be vital to validate and scale this approach. As cities face increasing climate stress and resource constraints, biomimicry offers not just a sustainable design strategy, but a regenerative vision, enabling built environments that thrive through cooperation, resilience, and alignment with the living systems they inhabit.
Data availability statement
The raw data supporting the conclusions of this article will be made available by the authors, without undue reservation.
Author contributions
RR: Conceptualization, Data curation, Formal Analysis, Investigation, Methodology, Validation, Visualization, Writing – original draft. AM: Funding acquisition, Project administration, Supervision, Writing – review and editing, Conceptualization. VA: Project administration, Supervision, Writing – review and editing. MS: Project administration, Supervision, Writing – review and editing.
Funding
The author(s) declare that financial support was received for the research and/or publication of this article. We acknowledge the support received by CAPABLE (Capacity Building in Built Environment Sustainability Research) project funded by British Council’s UK India Education and Research Initiative (UKIERI4) under the grant number UKIERI-SPARC/03/06 dated 26 March 2024.
Acknowledgments
The authors gratefully acknowledge the use of the Library Revit platform for providing access to five building models, which were instrumental in this study. Special thanks are also extended to Foster + Partners for granting permission to use the Gherkin model developed as part of this research.
Conflict of interest
The authors declare that the research was conducted in the absence of any commercial or financial relationships that could be construed as a potential conflict of interest.
Generative AI statement
The author(s) declare that no Generative AI was used in the creation of this manuscript.
Any alternative text (alt text) provided alongside figures in this article has been generated by Frontiers with the support of artificial intelligence and reasonable efforts have been made to ensure accuracy, including review by the authors wherever possible. If you identify any issues, please contact us.
Publisher’s note
All claims expressed in this article are solely those of the authors and do not necessarily represent those of their affiliated organizations, or those of the publisher, the editors and the reviewers. Any product that may be evaluated in this article, or claim that may be made by its manufacturer, is not guaranteed or endorsed by the publisher.
References
Alizadeh, O. (2011). Mycorrhizal symbiosis. Adv. Stud. Biol. 3, 273–281. Available online at: https://www.researchgate.net/publication/216385436_Mycorrhizal_symbiosis
Allegrini, J., Orehounig, K., Mavromatidis, G., Ruesch, F., Dorer, V., and Evins, R. (2015). A review of modelling approaches and tools for the simulation of district-scale energy systems. Renew. Sustain. Energy Rev. 52, 1391–1404. doi:10.1016/j.rser.2015.07.123
Aoun, A., Ghandour, M., Ilinca, A., and Ibrahim, H. (2021). “Demand-side management,” in Hybrid renewable energy systems and microgrids (Elsevier), 463–490. doi:10.1016/B978-0-12-821724-5.00001-5
Armin Razmjoo, A., Sumper, A., and Davarpanah, A. (2020). Energy sustainability analysis based on SDGs for developing countries. Energy Sources, Part A Recovery, Util. Environ. Eff. 42, 1041–1056. doi:10.1080/15567036.2019.1602215
Asdrubali, F., Manzo, M., and Grazieschi, G. (2021). “Interoperability between BIM and building energy modelling– a case study,” in In Proceedings of building simulation 2021: 17th conference of IBPSA, (Bruges, Belgium), 2063–2069.
Autodesk-Insight (2024). Energy analysis with revit insight and green building studio 2024. Available online at: https://www.autodesk.com/products/insight/overview (Accessed March 20, 2025).
Bas, T. G., Sáez, M. L., and Sáez, N. (2024). Sustainable development versus extractivist deforestation in tropical, Subtropical, and Boreal forest ecosystems: Repercussions and Controversies about the mother tree and the mycorrhizal network hypothesis. Plants 13, 1231. doi:10.3390/plants13091231
Batty, M., Axhausen, K. W., Giannotti, F., Pozdnoukhov, A., Bazzani, A., Wachowicz, M., et al. (2012). Smart cities of the future. Eur. Phys. J. Spec. Top. 214, 481–518. doi:10.1140/epjst/e2012-01703-3
Bilgen, F. E., and Akan, O. B. (2024). “Mycorrhizal fungi and plant symbiosis for energy harvesting in the internet of plants,” in Proceedings of the 11th annual ACM international conference on Nanoscale Computing and communication (New York, NY, USA: ACM), 35–40. doi:10.1145/3686015.3689365
Bîrgovan, A. L., Lakatos, E. S., Szilagyi, A., Cioca, L. I., Pacurariu, R. L., Ciobanu, G., et al. (2022). How should We measure? A review of circular cities Indicators. Int. J. Environ. Res. Public Health 19, 5177. doi:10.3390/ijerph19095177
Blok, K., and Nieuwlaar, E. (2016). Introduction to energy analysis. 2nd Edn. Abingdon, Oxon ; New York, NY: Routledge. doi:10.4324/9781315617213
Buck, N. (2017). The art of imitating life: the potential contribution of biomimicry in shaping the future of our cities. Environ. Plan. B Urban Anal. City Sci. 44, 120–140. doi:10.1177/0265813515611417
Busato, M. (2020). The Fascinating social network of trees: the wood wide web. Lotus Fruit. Available online at: https://medium.com/lotus-fruit/the-fascinating-social-network-of-trees-the-wood-wide-web-875af1fe36d0
Cao, Y., Wang, X., Li, Y., Tan, Y., Xing, J., and Fan, R. (2016). A comprehensive study on low-carbon impact of distributed generations on regional power grids: a case of Jiangxi provincial power grid in China. Renew. Sustain. Energy Rev. 53, 766–778. doi:10.1016/j.rser.2015.09.008
Capra, F., and Luisi, P. L. (2014). The systems View of life. Cambridge University Press. doi:10.1017/CBO9780511895555
Caprotti, F., Cowley, R., Datta, A., Broto, V. C., Gao, E., Georgeson, L., et al. (2017). The New Urban Agenda: key opportunities and challenges for policy and practice. Urban Res. Pract. 10, 367–378. doi:10.1080/17535069.2016.1275618
Carbon Leadership Forum (2023). Embodied carbon in construction calculator (EC3). Available online at: https://carbonleadershipforum.org/ec3-tool/(Accessed January 17, 2025).
Chertow, M. R. (2000). Industrial symbiosis: literature and Taxonomy. Annu. Rev. Energy Environ. 25, 313–337. doi:10.1146/annurev.energy.25.1.313
Circle Economy (2019). Building Blocks for the new strategy Amsterdam circular 2020–2025. Netherlands.
Compagnon, R. (2004). Solar and daylight availability in the urban fabric. Energy Build. 36, 321–328. doi:10.1016/j.enbuild.2004.01.009
Dalla Rosa, A., and Christensen, J. E. (2011). Low-energy district heating in energy-efficient building areas. Energy 36, 6890–6899. doi:10.1016/j.energy.2011.10.001
Delbeke, J., Runge-Metzger, A., Slingenberg, Y., and Werksman, J. (2019). “The Paris Agreement,” in Towards a climate-neutral Europe (London: Routledge), 24–45. doi:10.4324/9789276082569-2
Department for Energy Security and Net Zero (2024). Greenhouse gas reporting: conversion factors 2024. London, United Kingdom: Department for Energy Security and Net Zero.
Ellen MacArthur Foundation (2015). Growth within: a circular economy vision for a competitive Europe. Available online at: https://www.ellenmacarthurfoundation.org/growth-within-a-circular-economy-vision-for-a-competitive-europe
Emec, S., Bilge, P., and Seliger, G. (2015). Design of production systems with hybrid energy and water generation for sustainable value creation. Clean. Technol. Environ. Policy 17, 1807–1829. doi:10.1007/s10098-015-0947-4
Eom, J., Clarke, L., Kim, S. H., Kyle, P., and Patel, P. (2012). China’s building energy demand: long-term implications from a detailed assessment. Energy 46, 405–419. doi:10.1016/j.energy.2012.08.009
European Commission (2020). A Renovation Wave for Europe – Greening our buildings, creating jobs. Brussels, Belgium: European Commission. Available online at: https://eur-lex.europa.eu/legal-content/EN/TXT/?uri=CELEX:52020DC0662 (Accessed August 7, 2025).
Field, K., and Magkourilou, E. (2023). Do trees really stay in touch via a “wood-wide web”? Here’s what the evidence says. Conversat. Available online at: https://theconversation.com/do-trees-really-stay-in-touch-via-a-wood-wide-web-heres-what-the-evidence-says-199806 (Accessed July 11, 2025).
Fujita, T., Ohnishi, S., Liang, D., and Fujii, M. (2013). Eco-industrial development as a circularization policy framework toward sustainable industrial cities. Lesson and suggestions from the eco town program in Japan. BDC Boll. del Cent. Calza Bini 13, 35–52. doi:10.6092/2284-4732/2449
Fusco Girard, L., and Nocca, F. (2019). Moving towards the circular economy/city model: which tools for operationalizing this model? Sustainability 11, 6253. doi:10.3390/su11226253
Fuso Nerini, F., Tomei, J., To, L. S., Bisaga, I., Parikh, P., Black, M., et al. (2017). Mapping synergies and trade-offs between energy and the sustainable development goals. Nat. Energy 3, 10–15. doi:10.1038/s41560-017-0036-5
Gould, Z. M. I., Mohanty, V., Reichard, G., Saad, W., Shealy, T., and Day, S. (2023). A mycorrhizal model for transactive solar energy markets with battery storage. Energies (Basel) 16, 4081. doi:10.3390/en16104081
GreenMatch (2023). How efficient are solar panels? GreenMatch UK. GreenMatch. Available online at: https://www.greenmatch.co.uk/blog/2014/11/how-efficient-are-solar-panels (Accessed August 22, 2025).
Gunasekaran, P., Nachiar, S. S., and Sekar, A. (2023). Optimizing mesh sizes of thin shells using biomimicry for a sustainable solution. J. Biomimetics, Biomaterials Biomed. Eng. 61, 1–14. doi:10.4028/p-XYcl3m
Helmrich, A. M., Chester, M. V., Hayes, S., Markolf, S. A., Desha, C., and Grimm, N. B. (2020). Using biomimicry to support resilient infrastructure design. Earths Future 8, e2020EF001653. doi:10.1029/2020EF001653
Henriksson, N., Marshall, J., Högberg, M. N., Högberg, P., Polle, A., Franklin, O., et al. (2023). Re-examining the evidence for the mother tree hypothesis – resource sharing among trees via ectomycorrhizal networks. New Phytol. 239, 19–28. doi:10.1111/nph.18935
House of Commons Energy and Climate Change Committee (2015). Energy network costs: transparent and fair? Sixth Report of Session 2014–15 (HC 386). London, United Kingdom: The Stationery Office. Available online at: https://publications.parliament.uk/pa/cm201415/cmselect/cmenergy/386/38607.html (Accessed August 22, 2025).
International Organization for Standardization (2021). Biomimetics — Terminology, concepts and methodology. Geneva, Switzerland. ISO 18458:2015.
Jiang, M., Deng, W., and Lin, H. (2024). Sustainability through biomimicry: a comprehensive review of Bionic design applications. Biomimetics 9, 507. doi:10.3390/biomimetics9090507
Kalair, A., Abas, N., Saleem, M. S., Kalair, A. R., and Khan, N. (2021). Role of energy storage systems in energy transition from fossil fuels to renewables. Energy Storage 3, e135. doi:10.1002/est2.135
Kamel, E., and Memari, A. M. (2019). Review of BIM’s application in energy simulation: tools, issues, and solutions. Autom. Constr. 97, 164–180. doi:10.1016/j.autcon.2018.11.008
Karimi-Jashni, M., and Yazdanpanah, F. (2023). “Mycorrhizal networks: a Secret Interplant communication system,” in Plant Mycobiome (Cham: Springer International Publishing), 447–467. doi:10.1007/978-3-031-28307-9_17
Kennedy, C. A., Stewart, I., Facchini, A., Cersosimo, I., Mele, R., Chen, B., et al. (2015). Energy and material flows of megacities. Proc. Natl. Acad. Sci. 112, 5985–5990. doi:10.1073/pnas.1504315112
Kesting, S., Bliek, F., and Sioshansi, F. (2013). “From consumer to prosumer: Netherland’s Power Matching city shows the way,” in Energy efficiency. Editor F. Sioshansi (Academic Press), 355–373.
Kuhn, T. E., Erban, C., Heinrich, M., Eisenlohr, J., Ensslen, F., and Neuhaus, D. H. (2021). Review of technological design options for building integrated photovoltaics (BIPV). Energy Build. 231, 110381. doi:10.1016/j.enbuild.2020.110381
Kumar, M., Rawat, P., Maurya, A., Kumar, R., Bharadwaj, U., and Duggal, P. (2022). Analysing the institutional building for solar radiation and photovoltaic energy using AutoDesk-revit. J. Phys. Conf. Ser. 2178, 012024. doi:10.1088/1742-6596/2178/1/012024
Lawson, D. (2003). Spirals of flat panes of glass have created the stunning and organic Gherkin, Swiss Re’s 30 St Mary Axe. But, as David Lawson explains, it is both functional and highly “green.”. Estates Gaz. Available online at: https://www.estatesgazette.co.uk/news/have-a-cigar/#:∼:text=The%20clear,less%20than%20a%20conventional%20building (Accessed July 18, 2025).
Lee, S. (2025). Maximizing energy efficiency with solar PV inverters. Available online at: https://www.numberanalytics.com/blog/maximizing-energy-efficiency-solar-pv-inverters (Accessed August 22, 2025).
Liu, H., Fang, C., Miao, Y., Ma, H., Zhang, Q., and Zhou, Q. (2018). Spatio-temporal evolution of population and urbanization in the countries along the Belt and Road 1950–2050. J. Geogr. Sci. 28, 919–936. doi:10.1007/s11442-018-1513-x
Lund, H., Werner, S., Wiltshire, R., Svendsen, S., Thorsen, J. E., Hvelplund, F., et al. (2014). 4th generation district heating (4GDH). Energy 68, 1–11. doi:10.1016/j.energy.2014.02.089
Lund, P. D., Mikkola, J., and Ypyä, J. (2015). Smart energy system design for large clean power schemes in urban areas. J. Clean. Prod. 103, 437–445. doi:10.1016/j.jclepro.2014.06.005
Marin, J., and De Meulder, B. (2018). Interpreting circularity. Circular city representations Concealing transition Drivers. Sustainability 10, 1310. doi:10.3390/su10051310
Meng, L., Graus, W., Worrell, E., and Huang, B. (2014). Estimating CO2 (carbon dioxide) emissions at urban scales by DMSP/OLS (Defense meteorological satellite program’s operational linescan system) nighttime light imagery: methodological challenges and a case study for China. Energy 71, 468–478. doi:10.1016/j.energy.2014.04.103
Marquez-Ballesteros, M.-J., Mora-López, L., Lloret-Gallego, P., Sumper, A., and Sidrach-de-Cardona, M. (2019). Measuring urban energy sustainability and its application to two Spanish cities: Malaga and Barcelona. Sustain Cities Soc. 45, 335–347. doi:10.1016/j.scs.2018.10.044
Merckx, V. S. F. T., Gomes, S. I. F., Wang, D., Verbeek, C., Jacquemyn, H., Zahn, F. E., et al. (2024). Mycoheterotrophy in the wood-wide web. Nat. Plants 10, 710–718. doi:10.1038/s41477-024-01677-0
Mohammad, H. H. A., Md Shihab, S. S., Zubair, K. M., and Rakib, H. R. (2020). Multi-agent AI system for coordinated Dispatch of renewable energy and storage in Islanded microgrids. J. Comput. Sci. Technol. Stud. 2, 53–77. doi:10.32996/jcsts.2020.2.2.6
Molly, I. (2023). Autodesk insight Tech Preview now available: carbon insights. Available online at: https://www.autodesk.com/blogs/aec/2023/02/15/autodesk-insight-tech-preview-now-available-carbon-insights/ (Accessed January 17, 2025).
Office of Gas and Electricity Markets (2025). Energy regulation sandbox. Ofgem. Available online at: https://www.ofgem.gov.uk/energy-regulation-sandbox (Accessed August 22, 2025).
Ozcan-Deniz, G., and Rodovalho, S. (2024). Towards carbon-neutral construction: integrating BIM and energy analysis for sustainable design decision-making. Int. J. Archit. Comput., 14780771241310213. doi:10.1177/14780771241310213
O’Dwyer, E., Pan, I., Acha, S., and Shah, N. (2019). Smart energy systems for sustainable smart cities: current developments, trends and future directions. Appl. Energy 237, 581–597. doi:10.1016/j.apenergy.2019.01.024
Paiho, S., Mäki, E., Wessberg, N., Paavola, M., Tuominen, P., Antikainen, M., et al. (2020). Towards circular cities—Conceptualizing core aspects. Sustain Cities Soc. 59, 102143. doi:10.1016/j.scs.2020.102143
Preston, F. A. (2012). A global redesign? Shaping the circular economy (EERG BP 2012/02). London, United Kingdom: Chatham House. Available online at: https://www.chathamhouse.org (Accessed July 14, 2025).
Rahubadda, R. V. A. D., and Kulathunga, U. (2025). “Evaluating the effectiveness of biomimetic approaches in urban building construction for climate change mitigation,” in Proceedings of the 15th international conference on sustainable built environment. Editors R. Dissanayake, P. Mendis, S. De Silva, S. Fernando, U. Attanayake, and P. Gajanayake (Singapore: Springer), 130–142. doi:10.1007/978-981-96-8301-7_11
Rahubadda, R. V. A. D., Kulatunga, U., and Rathnasinghe, A. (2025). “Learning from nature: biomimicry-inspired building design for carbon reduction in urban living,” in 13th world construction Symposium. Editors K. G. A. S. Waidyasekara, H. S. Jayasena, P. L. I. Wimalaratne, and G. A. Tennakoon, 1003–1015. Available online at: https://ciobwcs.com/papers/(Accessed August 22, 2025).
Raman, R., Sreenivasan, A., Suresh, M., and Nedungadi, P. (2024). Mapping biomimicry research to sustainable development goals. Sci. Rep. 14, 18613. doi:10.1038/s41598-024-69230-9
Rambelli, G., Donat, L., Ahamer, G., and Radunsky, K. (2017). An overview of regions and cities with-in the global climate change process - a perspective for the future.
Reinhart, K. O., Wilson, G. W. T., and Rinella, M. J. (2012). Predicting plant responses to mycorrhizae: integrating evolutionary history and plant traits. Ecol. Lett. 15, 689–695. doi:10.1111/j.1461-0248.2012.01786.x
Richard, G. (2018). Do trees Talk to each other? Smithson. Mag. Available online at: https://www.smithsonianmag.com/science-nature/the-whispering-trees-180968084/
Rutter, P., and Keirstead, J. (2012). A brief history and the possible future of urban energy systems. Energy Policy 50, 72–80. doi:10.1016/j.enpol.2012.03.072
Sukhdev, A., Vol, J., Brandt, K., and Yeoman, R. (2018). Cities in the circular economy: the role of digital Technology. Cowes, UK.
United Nations Department of Economic and Social Affairs Population Division (2018). World urbanization prospects the 2018 revision.
Vanhuyse, F., Haddaway, N. R., and Henrysson, M. (2021). Circular cities: an evidence map of research between 2010 and 2020. Discov. Sustain. 2, 50. doi:10.1007/s43621-021-00059-2
Warneryd, M., Håkansson, M., and Karltorp, K. (2020). Unpacking the complexity of community microgrids: a review of institutions’ roles for development of microgrids. Renew. Sustain. Energy Rev. 121, 109690. doi:10.1016/j.rser.2019.109690
World Economic Forum (2018). “White Paper. Circular economy in cities,” in Evolving the model for a sustainable urban future. Switzerland: Cologny. Available online at: https://www3.weforum.org/docs/White_paper_Circular_Economy_in_Cities_report_2018.pdf (Accessed July 14, 2025).
Yang, Z., Ghahramani, A., and Becerik-Gerber, B. (2016). Building occupancy diversity and HVAC (heating, ventilation, and air conditioning) system energy efficiency. Energy 109, 641–649. doi:10.1016/j.energy.2016.04.099
Yoshino, H., Hong, T., and Nord, N. (2017). IEA EBC annex 53: total energy use in buildings—analysis and evaluation methods. Energy Build. 152, 124–136. doi:10.1016/j.enbuild.2017.07.038
Keywords: biomimicry, building information modelling, carbon neutrality, energy efficiency, net zero construction, urban energy system, Wood Wide Web
Citation: Rahubadda RVAD, Manewa A, Anagal V and Siriwardena M (2025) The Wood Wide Web as a blueprint for carbon-neutral cities: a biomimetic model for adaptive energy sharing. Front. Built Environ. 11:1681714. doi: 10.3389/fbuil.2025.1681714
Received: 07 August 2025; Accepted: 27 August 2025;
Published: 15 September 2025.
Edited by:
Akila Pramodh Rathnasinghe, Northumbria University, United KingdomReviewed by:
Hector Martin, Queen’s University Belfast, United KingdomHajer Al-Dahash, University of Babylon, Iraq
Copyright © 2025 Rahubadda, Manewa, Anagal and Siriwardena. This is an open-access article distributed under the terms of the Creative Commons Attribution License (CC BY). The use, distribution or reproduction in other forums is permitted, provided the original author(s) and the copyright owner(s) are credited and that the original publication in this journal is cited, in accordance with accepted academic practice. No use, distribution or reproduction is permitted which does not comply with these terms.
*Correspondence: Rahubadda Vithanage Ashen Dilruksha Rahubadda, ZGlscnVrc2hhYXNoZW5AZ21haWwuY29t; Anupa Manewa, ci5tLm1hbmV3YUBsam11LmFjLnVr