 Shujian Li1,2Jianguang Yang1,2Menglai Wang1Jiantao Pang1,2Jun You3Yuanting Zhu3Chao Pan4
 Dongming Zhang5
 Mingli Yuan1,2,5*
- 1Yunnan Phosphate Group Co., Ltd, Kunming, China
- 2National Engineering Technology Research Center for Phosphorus Resources Development and Utilization, Kunming, China
- 3Guizhou Institute of Geo-Environment Monitoring, Guiyang, China
- 4School of Resources and Safety, Chongqing University, Guiyang, China
- 5College of Resources and Environmental Engineering, Guizhou University, Chongqing, China
Introduction: Paste backfilling serves as a key approach for goaf management and mine solid waste disposal. This study investigates the rheological properties of ultra-fine flotation phosphate tailings utilized as backfill aggregates.
Methods: To investigate the pipeline transport characteristics of high-concentration ultra-fine full phosphate tailings under both pumping and gravity flow conditions, this research employed a self-designed industrial-scale paste loop testing system. The pipeline resistance loss of the backfill slurry under various working conditions was systematically measured, and the influence degree of different factors on this resistance was quantified. Furthermore, the rheological parameters of the slurry under different conditions were calculated based on the Bingham fluid model. This allowed for the determination of the slurry's flow regime and critical velocity, and ultimately enabled the back-calculation of the feasible pipeline flow gradient for gravity flow under multiple factor conditions.
Results: 1) Flow velocity had the most significant impact on pipeline resistance loss, followed by flow rate, binder-to-tailings ratio, slurry concentration, and pipe diameter. 2) The flow regime of the backfill slurry was most stable when the flow velocity ranged between 1.4 m/s and 1.8 m/s. 3) Under pumping conditions, the Reynolds number of the backfill slurry was significantly less than 2100, indicating a laminar flow regime within the pipeline. 4) A slurry with a mass concentration of 68% achieved a gravity flow gradient between 7.5 and 9.5 in a pipeline with an internal diameter of 150 mm, confirming the feasibility of gravity flow transport.
Discussion: This study demonstrates that the full phosphate tailings from the Kunyang Phosphate Mine No. 2 are ideal for backfilling due to their favorable gradation. Systematic analysis identified an appropriate pipe diameter range corresponding to economical flow velocities and revealed the weighting of factors affecting pipeline resistance. Flow regime analysis based on the Bingham model confirmed laminar flow within the pipeline, with higher-concentration slurries exhibiting more pronounced structural flow characteristics and a higher critical velocity. Semi-industrial tests finally verified that the 68% concentration slurry can be transported via gravity flow within a pipeline gradient of 10. In conclusion, this research provides crucial theoretical foundation and practical guidance for optimizing pipe diameter, reducing the binder-to-tailings ratio, and controlling flow velocity to achieve economically efficient backfilling while ensuring transport stability.
1 Introduction
China is the world’s largest producer of phosphate rock, with a massive phosphate chemical industry. Its phosphate rock mining output has consistently ranked first globally for many years. However, the country’s phosphate resources are generally characterized by a higher proportion of low-grade and refractory ores than high-grade and easily beneficiated ores. Medium- and low-grade phosphate ores account for over 90% of the total. Approximately 10 million tons of phosphate tailings are generated annually in China. Statistics indicate that the utilization rate of solid waste from the phosphate chemical industry is 70%–80% in Japan and Brazil, whereas China’s comprehensive utilization rate of phosphate tailings is only approximately 7%—significantly lower than that of other countries. Most phosphate tailings are stored as waste in tailings ponds, which severely damages aquatic ecosystems and causes substantial land and resource waste (Chen et al., 2017). Paste backfilling is an effective method for addressing goaf areas and managing mine solid waste. It facilitates the construction of green mines while minimizing interference by backfilling operations with mining activities (Wang et al., 2023). Within the backfill process pipeline, transportation is the cornerstone of paste backfill technology, determining the success of slurry delivery. The efficiency of pipeline transport largely depends on the paste’s fluidity; better fluidity translates to more effective transport and higher overall backfilling efficiency (Shuai et al., 2022; Yao-hui and Chuan-ming, 2023; Dong et al., 2019).
Pipeline transportation is the primary means of transporting filling slurry from the surface to the mining area, and its safe, stable and efficient operation is the premise of normal production in a mine (Chen et al., 2016; Xu et al., 2024). For this reason, some scholars in China and elsewhere have focused on the mining pipeline transportation problem. Zhou et al. (2021; 2018) designed an L-type test to study the transportation characteristics of whole tailing paste in pipelines, deducing the calculation method of the rheological parameters of high-concentration whole tailing filling material. The results of their research provide a theoretical basis for determining the optimal transportation concentration, water-cement ratio, and limit of the concentration of pipeline autoconvection transportation. Lei et al. (2021) used a laboratory L-type pipe and pilot annulus test to study transportation. The results showed that the L-pipe and annulus tests had similar trends, but the L-pipe had higher pressure drop values at different solid and cement contents; Cheng et al. (2023) and Haiyong et al. (2023) systematically investigated the pipeline conveying flow and resistance characteristics of pastes under different pipeline arrangements and proposed quantitative characterization parameters for differences in flow regimes between different pipeline arrangements. They proposed a quantitative characterization parameters for flow patterns and determining optimal pipeline network arrangements. Li et al. (2024a) analyzed the rheological properties of slurry transportation in filling pipelines through rheological, L-pipe self-flow, and semi-industrial loop tests and investigated the relationship between pressure loss and slurry flow rate, C/T ratio, and mass concentration. Wang et al. (2023) employed a combined approach of orthogonal testing and numerical simulation to investigate the influence of five parameters—filling gradient, bend curvature radius, pipe inner diameter, paste flow rate, and paste concentration—on pipeline transportation characteristics. Zhou et al. (2013) conducted a simulation analysis of gravity flow transportation in filling slurry pipelines based on Fluent software. The results indicated that the flow velocity in the transportation system was relatively ideal, with significant variations in slurry velocity at the bends, while pressure remained uniform in other sections, enabling the realization of gravity flow transportation.
The rheological characteristics of whole tailings slurry are crucial parameters in the transportation and filling process, and many studies have experimentally investigated the rheological characteristics of the filling slurry based on rheological theory, especially the mass concentration of the slurry, the size distribution and characteristics of the tailings particles, the admixtures, the temperature and PH value, and the other external environments (Guo et al., 2024; Yang L. et al., 2024; Li X. et al., 2024; Yu et al., 2024; Cuiping et al., 2023; Sen et al., 2023). Hou et al. (2024) used an orthogonal test to analyze the influence of the sand–ash ratio, mass concentration, steel-slag dosing, and straw fiber on the rheological parameters. Wu and Fall, (2024) investigated the rheological properties of paste slurry, the combined effect of sulfate, temperature, and time through indoor tests. With the simultaneous increase of sulfate, time, and temperature, the viscosity of paste slurry increased significantly, but while the yield stress increased, the rate of increase was relatively limited. Xue et al. (2023) and Zhenlin et al. (2023) independently established an experimental platform for non-contact monitoring of the microscopic slip layer in paste slurry pipelines, analyzed the effect of slurry temperature, pipe diameter, solid phase concentration, and slurry flow rate on the paste slurry’s wall slip velocity, and refined the theory of the effect of the wall-slip characteristics of pipeline conveying. Sandeep et al. (2018) established a multivariate linear regression model based on hydration age, binder content, and superplasticizer dosage to predict the yield stress, plastic viscosity, and thixotropic properties of mine backfill slurry. Sada and Fall (2019) investigated the influence of high-range water-reducing admixtures on the rheological parameters of cemented paste backfill (CPB) under varying mixing and curing temperatures through laboratory experiments. Their results indicated that elevated ambient temperature leads to increased yield stress and viscosity in CPB treated with water-reducing agents. Carnogursky et al. (2023) systematically examined the effects of salinity and binder type on the rheological properties and setting time of paste backfill from the perspective of mixing water quality. Their findings provide a theoretical basis for designing cost-effective and operationally efficient backfill schemes in mining. Creber et al. (2017) conducted simultaneous sampling at surface preparation plants and underground discharge points in two Canadian mines, demonstrating that the yield stress and temperature of paste backfill are not constant throughout the distribution system; they identified temperature as a critical factor influencing variations in yield stress. Nima et al. (2017) conducted integrated experimental and numerical studies to thoroughly investigate the flow behavior and wear patterns of paste backfill in underground pipeline systems. Constructed a loop pipeline test system with diameters of 50, 100, 150, and 250 mm to systematically study the laminar transport characteristics of non-Newtonian slurries carrying coarse particles. Their results revealed that the ratio of mean wall shear stress to mean surficial particle stress serves as a more effective indicator of particle settling tendency in laminar flow than the conventionally used frictional pressure gradient. Yang et al. (2024b) used the stress relaxation method to conduct a thixotropy test to determine the rheological parameters of paste regarding shear time. They established a resistance model for pipeline transport that accounts for the time-varying rheological parameters of paste slurry and proposed a method for estimating the thixotropic equilibrium time of the yield stress. In order to accurately analyze and predict the yield stress of paste slurry, Niu et al. (2022) and Yonghui et al. (2022), based on 136 sets of rheological test data of copper ores, applied the sprawl search algorithm to the correlation vector machine. In order to accurately analyze and predict the yield stress of the paste slurry, based on 136 sets of copper ore rheological test data, they optimized the relevance vector machine (SSA-RVM) using the sprawl search algorithm and proposed the regression prediction model of the yield stress of the SSA-RVM CPB. Chen et al. (2016) conducted three-dimensional numerical simulations using FLUENT software to model the filling of slurry into coarse tailings sand with varying slurry mass fractions. Subsequently, they obtained the rheological parameters of the slurry and used MATLAB software to regress the relationship between the pipeline transportation process of the slurry, its rheological parameters, and the slurry mass fractions. The correlation between the slurry pipeline transportation process, rheological parameters, and slurry mass fraction was established through MATLAB mathematical software.
Thus, in analyzing the conveying performance of filling slurry pipelines and their rheological characteristics, researchers have generally employ numerical simulation and physical test methods. Numerical simulation primarily relies on hydrodynamics-related software for research and is heavily dependent on the fundamental parameters of the slurry. The physical test method is based on the L-pipe test, and the small-scale annulus test is mainly used, often yielding results that deviate somewhat from actual conditions and thus providing weaker reference values. Research has predominantly focused on whole tailings from metal ores, particularly graded tailings, where the particle size composition differs significantly from that of flotation phosphorus tailings. In this study, based on the filling ring pipe test system built independently in a mine industrial site, we study the conveying characteristics of high-concentration ultrafine whole phosphorus tailings under pumping and self-flowing conditions and analyze the influences of filling slurry concentration, ash–sand ratio, pipe diameter, flow rate, and flow velocity on pipeline resistance. We also analyze the slurry flow from the perspective of the paste critical flow rate, integrating rheological parameters into our analysis. The research results provide technical support for the cementation and filling of ultrafine phosphorus tailings in Kunyang Phosphorus Mine No. 2.
2 Rheological theory
Many studies have found that pastes formulated with different materials show typical non-Newtonian fluid properties; under the action of shear force, there is a certain relationship between shear force and shear rate, known as the “flow pattern”. If the shear stress is applied to the paste, the paste is strained at a certain rate—the “shear rate”. In the absolute value of the shear stress r and the resulting shear rate, there is a certain relationship with the typical non-Newtonian fluid rheological mathematical model of the general expression for (Kwak et al., 2005)
where: τ is the shear stress Pa; dv/dr is the shear rate s-1; τ0 is the yield stress Pa; μ is the plastic viscosity pa.s; v is the flow rate of the slurry m/s. The index of rheological propertiesτ0,μ, and n are collectively referred to as the “rheological parameters” of the slurry.
3 Physical and chemical property analysis of filling materials
The analysis of the backfill material’s properties includes both physical and chemical aspects. Physical characterization encompasses tests for the specific gravity, density, and particle size distribution of the tailings. The chemical analysis involves determining the chemical composition of the tailings via X-ray fluorescence (XRF) spectroscopy.
3.1 Whole tail sand particle size distribution
The particle size distribution of the filling aggregate, also known as the “gradation” of the material, refers to the percentage content of different particle sizes in the granular material. The particle size distribution of the filling material is pivotal in dictating the entire filling process and has a great influence on the preparation, transportation, and quality of the filling body. In this study, the particle size composition of all tailing sands of Kunyang Phosphate Mine II (Figure 1a) was analyzed by a Malvern 3,000 (as shown in Figure 1b) laser particle size tester (Figure 1c).

Figure 1. Particle size analysis” (a) phosphate tailings; (b) instrument appearance; (c) data combing.
The test results are presented in Table 1 and Figure 2. It is evident from Figure 2 that the particle size of all the tailing sand samples taken is within 163.2 μm, the proportion of particles with particle size less than 75 μm (−200 mesh) accounts for approximately 91.6%, the proportion of particles with particle size less than 37 μm (−400 mesh) accounts for approximately 71.7%, and the range of particles less than 16.1 μm accounts for 50% of the total particle size. Much of the literature shows that, to ensure that the filling material in the pipeline for a long-distance conveying process does not stratify and segregate, the proportion of tailing sand −20 μm particle size should be greater than 15% in the formation of so-called “structural flow” (Wu et al., 2022). It is evident from the figure that the tailing sand from Kunyang Phosphate Mine II contains approximately 57.22% of particles smaller than 20 μm, thereby ensuring the feasibility of the long-distance transportation of the filling slurry.

Table 1. Full sand-end particle size distribution.

Figure 2. Particle size distribution of total phosphorus tailings.
The grading of the tailings can have a significant effect on the conveying properties of the filling slurry, and it is standard practice in the mining industry to characterize the grading of the filling aggregate using the coefficient of inhomogeneity
The main particle size distributions of the whole tailing sand samples are as follows.
Diameter at 10% = 1.54 μm (10% of the sample is below 1.54 μm).
Diameter at 30% = 6.28 μm (30% of the sample is below 6.28 μm).
Diameter at 50% = 16.14 μm (50% of the sample is below 16.14 μm).
Diameter at 60% = 23.46 μm (60% of the sample is below 23.46 μm).
Diameter at 90% = 70.73 μm (90% of the sample is below 70.73 μm).
In the field of backfill engineering, industry practices commonly reference the gradation theory from soil mechanics and concrete science to evaluate the suitability of aggregate materials. An ideal backfill aggregate gradation generally needs to meet the following criteria: the coefficient of uniformity (Cu) should be not less than 5, and the coefficient of curvature (Cc) should fall within the range of 1–3. Substituting the main particle size distribution data of the whole tailing sand sample into Formulas 2 and 3, we can calculate that the unevenness and curvature coefficients of the tailing sand are 15.23 and 1.09, respectively. Engineering experience shows that a well-graded material has an unevenness coefficient greater than 10, but the Cc value is small, so it may be that all the tailing sand is fine in size, and the curvature coefficient should be between 1 and 3. It can be seen that the whole tailing sand of Kunyang Phosphate Mine No.2 is well-graded and suitable for filling material.
3.2 Chemical composition analysis
The chemical composition of the tailings was analyzed using spectroscopy, and the results of the chemical composition of +400 mesh tailing sand are presented in Table 2. The test results show that the tailings are mainly CaO, MgO, and P2O5, accounting for 31.39%, 18.95%, and 4.56%, respectively, and that the high calcium content is beneficial for the strength of the filling body, which makes it suitable for use as a filler aggregate. The tailings exhibit low concentrations of recoverable metals (e.g., Fe and Al), and the primary constituent minerals are physically and chemically stable.
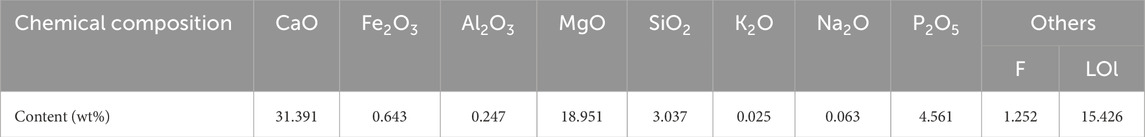
Table 2. Main chemical composition of tailings.
3.3 Test design
The semi-industrial conveying test of all the phosphorus tailing sand employs two methods: pumping and self-flowing. The tailing slurry conveyed from the processing plant is transported to the filling slurry preparation station through the pipeline, where the concentration of the slurry is increased from 20% to 35%, then to 65%, and finally to 71% by the thickening device. The thick slurry is transported to the mixing drum by pumping, and the gelling material is steadily fed to the mixing drum through the spiral feeder following the designed ratio. The prepared filling slurry is thence conveyed to the filling slurry conveying test area by tanker truck (self-flowing is possible if site conditions permit). Then, through the screw feeder, the gelling material is stably fed to the mixing drum according to the designated proportion, and the filling slurry is prepared by the mixing drum. Finally, the prepared filling slurry is transported to the filling slurry conveying test area via tanker truck to conduct the conveying test (the site conditions allow self-flow). The overall program design of the test is shown in Figure 3.
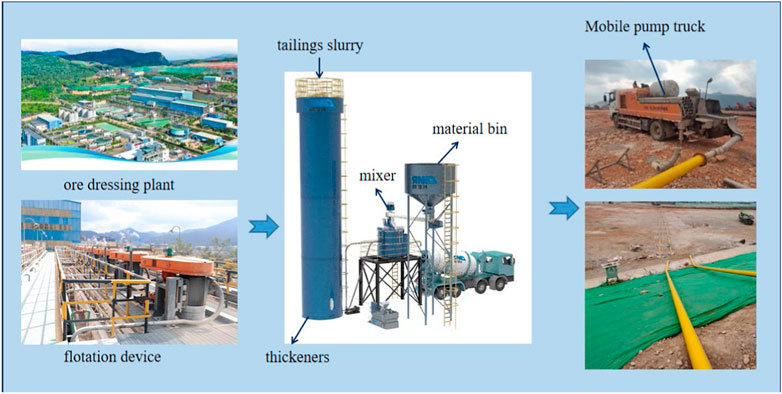
Figure 3. Experiment scheme design.
In the filling station, a high concentration tailing sand slurry is prepared into filling slurry according to a specific proportion. This slurry is then transported to the slurry conveying area by tanker truck. The pumping test is performed by the concrete pump truck from the pump hopper to form the loop pipe circulation pumping, which simulates long-distance pipeline transportation. For the self-flow conveying test, a commercial concrete tanker pours the filling slurry into a self-flow buffer hopper. Once the slurry reaches a certain liquid level, the self-flow manual valve is opened, allowing the slurry to flow down the pipeline on its own. The outlet of the pipeline is monitored determine whether the slurry is flowing out, and thus whether the self-flow timeline of the filling slurry can reach the target of 9. The pipeline system has a total length of approximately 250 m, with an adjustable total vertical head of 15–20 m. It is capable of simulating a pipeline gradient—a key parameter for paste backfill—of 3–9. The system is configured with pipes of nominal diameters (DN) of 125, 150, and 175 mm.
According to the actual production requirements of the mine, the design of the conveying end of the filling ring pipe involves test filling slurry with gray-to-sand ratios of 1:6, 1:8, 1:12, 1:18, and mass fractions of 68% and 71%. The filling pipes have inner diameters of 125 mm, 150 mm, 175 mm, with flow rates ranging from 50 m3/h ∼ 110 m3/h. Ring pipe testing also uses a standard conical collapsibility cylinder to carry out the collapse test to assist in judging the flow and fluidity of the filling slurry.
3.4 Test device
At the slurry transportation test site (as shown in Figure 4a), a flow meter is used to monitor the flow rate of the slurry system, and a pressure sensor monitors differential pressure measured at various points (designed to be installed at intervals of 20 m). Communication cables transmit the monitoring data to the system operator interface for unified collection. The filling slurry is transported either through self-flow or by pumping, with variations in concentration, ash–sand ratio, and flow rate. Stress sensors are employed to record the pressure values of the slurry at each monitoring point, and other relevant parameters are calculated and summarized accordingly.

Figure 4. Schematic diagram of pipe loop test system for paste slurry rheological parameters. (a) On-site piping arrangement. (b) Parameter acquisition system.
4 Analysis of factors influencing pressure drop
To study the relationship between pipeline conveying resistance and slurry concentration, industrial tests were carried out to collect the pipeline pressure and flow rate of filling different concentrations of slurry over time. The pipeline transport resistance (H, Pa/m), pipeline pressure, flow velocity (v, m/s), and flow rate (Q, m3/h) are calculated using Equation 4.
where: ΔP is the pressure difference between two pressure points, measured in MPa; L is the distance between the two pressure points, m; P1 and P2 represent the pressure values at pressure points 1 and 2, respectively, also measured in MPa; R is the diameter of the pipeline, measured in meters. Pipeline resistance is based on Formula 1 for the calculation to analyze the filling slurry mortar and sand ratio, the pipeline diameter, and the flow rate of the pipeline resistance to the impact.
4.1 Yield stress and rheological parameters
Much research from the perspective of rheology on the relationship between shear stress and shear rate has found that high concentration tailings or paste-filling slurry exhibits rheological characteristics consistent with those of a Bingham’s plastic body and a yield pseudo-plastic body (H-B). Its constitutive equation can be represented by Equation 5 (Wang et al., 2023):
where τw is the slurry in the pipe flow with the wall of the shear stress, Pa, and γ is the shear rate of the slurry, s. Due to their high concentration, significant yield stress, and viscosity, cemented backfill slurries are typically transported in a laminar flow regime. Under laminar flow conditions, the rheological relationship of a Bingham plastic fluid in a circular pipe is described by the Buckingham equation, where the shear rate γ is equal to the flow velocity v along the direction of the pipe diameter of the gradient dv/dy. The rheological equation is represented by Equation 6 (Wang et al., 2023):
where v is the flow rate of slurry, m/s, and D is the inner diameter of the filling pipe, m. The filling slurry can be filled into the pipe with friction equal to the resistance.
According to hydrostatic equilibrium theory, the friction between the filling slurry in the pipe and the wall is equal to resistance along the pipe; therefore, the wall shear stress,τw, can also be expressed by Equation 7.
Based on Equation 6, the rheological parameters of the filling slurry for different working conditions can be obtained using MATLAB custom function fitting (Figure 5). The rheological properties of the slurry exhibit a high sensitivity to variations in its compositional parameters. Both the yield stress and plastic viscosity demonstrate a significantly increasing trend with the rise of solid mass fraction and binder-to-sand ratio. The underlying micro-mechanism is an increase in solid mass fraction directly leading to a higher number of particles per unit volume. This not only intensifies the hydrodynamic interactions among particles, causing the slurry to experience greater viscous resistance during flow—macroscopically observed as an elevation in plastic viscosity—but, more importantly, the reduced inter-particle spacing markedly increases the probability of their collision and contact. This promotes the development of a more extensive three-dimensional network structure facilitated by inter-particle forces such as electrostatic attraction, van der Waals forces, and flocculation. This spatial network structure imparts a solid characteristic to the slurry, requiring the application of a critical stress sufficient to break this structure (i.e., the yield stress) to initiate flow. Consequently, the yield stress increases accordingly.

Figure 5. Variation curves of yield stress and viscosity coefficient of unclassified tailings slurry under different cement–sand ratios.
Combined with the results of the statistical analysis of the particle size distribution of all the phosphorus tailings, it was found that 50% of the particle size of the flotation phosphorus tailings is below 16.14 μm and, compared with the traditional low-concentration two-phase flow filling slurry, the paste contains a higher proportion of fine particles This is due to the strong surface physicochemical effect of the fine particles of phosphorus tailings in water and the addition of the gelling material to enhance the tailings of the “flocculation effect.” Due to the strong surface physicochemical effect of fine particles of phosphorus tailings in water, the addition of gelling material enhances the “self-flocculation” between the tailings, which leads to the generation of a stable network structure between the solid particles. The viscosity of the paste increases with the increase of the ratio of gray sand.
4.2 Influence of cement–sand ratio on pressure drop
An appropriate cement–sand ratio can ensure that the cementitious material is fully hydrated to form a strong filling body. According to the filling station slurry design ratio, we analyze the pipe resistance under pipe diameters of 125 mm/150 mm/175 mm and slurry concentrations of 68%/ 71% using a gray-to-sand ratio of 1:18; 1:12:1:8; 1:6. As shown in Figure 6, under the same slurry mass concentration, the flow resistance showed an increasing trend as the cement–sand ratio increased. Taking the example of a slurry concentration of 68% and pipe diameter D = 125 mm, when the cement–sand ratio increased from 1:18 to 1:6, the flow resistance increased from 2.087 Kpa/m to 2.67 Kpa/m. When comparing the slurry conveying pipeline with diameters of 125, 150, and 175 mm, it is evident that the larger the diameter, the slower the growth of pipe resistance under the influence of the cement–sand ratio.
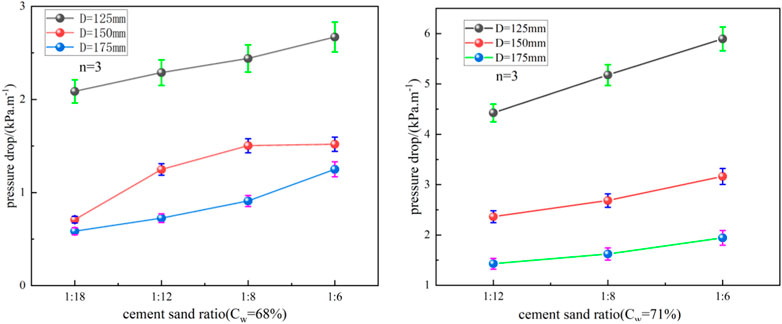
Figure 6. Influence of cement–sand ratio of slurry on pressure drop.
4.3 Influence of slurry concentration and flow velocity on pressure drop
The filling ring pipe test shows that the effect of flow velocity on pressure drop follows the same law. The flow resistance and flow velocity have a linearly positive correlation, indicating that the filling material is in a laminar conveying state within the scope of this research. The higher flow rate of the filling slurry indicates that its energy is also higher, which means that the friction and resistance in the pipeline will also increase. Taking the example of the filling slurry with concentrations of 68% and 71% used in this test, a linear correlation between flow rate and pressure drop was observed when the pipe diameter was 125 mm.
Due to the existence of “self-flocculation” between the particles of ultrafine phosphorus tailings, the higher the concentration of the filling slurry, the smaller the average distance of the particles, the higher the probability of collision, and the stronger the flocculation effect. The particles in the flocculation will be linked into flocs; when the number of flocs reaches a certain number, the flocs begin to be connected and eventually form a loose floc structure. In the process of slurry transportation, due to the existence of the floc structure, the friction resistance between the flow layer and the pipeline increases; the higher the concentration, the more obvious the increase in resistance. As shown in Figure 7, the experimental investigation was conducted under a constant flow rate, Q. Backfill slurries with concentrations of 68% and 71% were compared based on the fitted parameter curves. The pipeline resistance growth rate of the 71% concentration slurry was 2.66, while that of the 68% concentration slurry was 1.76, corresponding to a relative increase of 51.14%. This indicates that higher slurry concentrations result in a more significant increase in pipeline resistance.
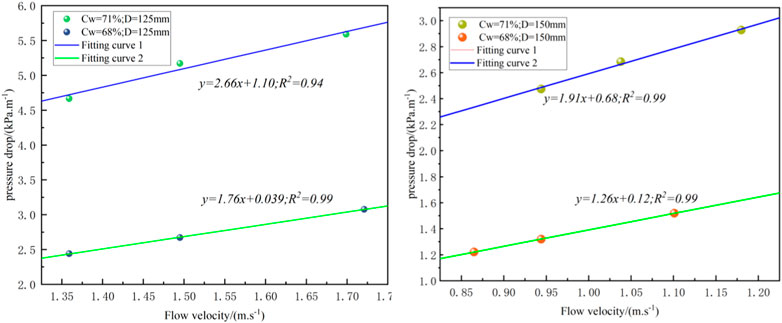
Figure 7. Influence of slurry velocity on pressure drop.
As shown in Figure 7, for backfill slurries with identical mass concentrations, a comparison was made between two operating conditions with pipeline diameters of 125 mm and 150 mm. The pipeline resistance growth rate for the 71% concentration slurry decreased from 2.66 to 1.91, and for the 68% concentration slurry it decreased from 1.76 to 1.26. The reduction magnitude was approximately 28.41%, with largely consistent decreases observed across both concentrations. In mining practice, selecting a larger-diameter filling pipeline is advantageous for reducing pipeline resistance.
4.4 Multi-factor sensitivity analysis
Gray relational analysis (GRA) (Muddineni et al., 2020) is an analytical method that assesses the degree of approximation between factors based on data. This method uses the relational grade to quantify the closeness of the relationship between two factors. It determines the strength of the connection by analyzing the geometric similarity between the curves of a reference sequence and comparative sequences within a system. A key advantage of GRA is its ability to overcome the limitation of traditional single-factor analysis, which cannot simultaneously consider the influence of all factors. This study employed GRA to investigate the primary and secondary order of influence of the following parameters on pipeline resistance: slurry concentration (X1), binder-to-sand ratio (X2), pipe diameter (X3), flow rate (X4), and flow velocity (X5). The pressure drop is designated as the reference sequence, while the factors influencing the pressure drop serve as the comparative sequences. The procedural steps are as follows.
Step 1: Based on the 63 sets of experimental data obtained, the data was nondimensionalized using Equation 8.
Step 2: Derive the difference series and calculate the maximum absolute difference M and minimum absolute difference m.
Difference series:
Maximum absolute difference:
Minimum absolute difference:
Step 3: Calculate the correlation coefficient: It was calculated based on Equation 9.
Where ρ is the resolution coefficient, the smaller ρ is, the larger the resolution. Generally, ρ takes the value range of (0,1); when ρ ≤ 0.5463, the discriminative power is the best, so take ρ = 0.5.
Step 4: Calculate the gray correlation and sorting. It is calculated based on Equation 10.
When the gray correlation is between 0 and 1, a higher value indicates a stronger the correlation with the reference sequence. The 63 sets of annular pipe test data were processed according to the above steps, and the results are shown in Table 1. According to Table 3, the average correlation of slurry concentration X1, ash-to-sand ratio X2, pipe diameter X3, flow rate X4, and flow rate X5 are 0.742, 0.747, 0.705, 0.749, and 0.779, respectively. Based on the calculation results, it is evident that for the ultrafine phosphorus tailings filling material, the flow rate has the most significant impact on pressure drop, followed by flow rate, ash-to-sand ratio, and slurry concentration, and the pipe diameter has the least influence on the pressure drop, which can be used as the mine filling material. The influence of pipe diameter on pressure drop is the smallest, which can be used as the basis of mine filling parameters. In light of the results from this semi-industrial test, to ensure the stable transportation of the phosphorus tailings slurry, it is advisable to select a larger diameter filling pipe and appropriately reduce the ash-to-sand ratio and flow rate.

Table 3. Calculation results of the correlation degree.
5 Filling slurry flow characteristics analysis
5.1 Analysis of the flow state of paste ring pipe test
Many studies have concluded that the paste used to fill the downhole airspace typically belongs to a non-Newtonian body. Under the condition of high speed, the slurry flow state is turbulent, and there is a resistance loss of the flow in the tube ΔP/L increases sharply with flow velocity v; when v decreases to a certain point, the flow transitions from turbulent to laminar, the flow velocity of the point, or “critical flow velocity.” When v decreases to a certain point, the flow rate at this point is the “critical flow rate,” which is recorded as VD; when v < VD, the increase of ΔP/L with v is relatively slow (Wu et al., 2013; Xibing et al., 2018). Therefore, in the process of conveying paste slurry through pipelines, it is important to determine the fluid flow state and critical flow rate in order to avoid resistance loss.
The analysis of the transition velocity generally begins with the Reynolds number of the fluid flow. For clear water pipe flow, the condition for its transition from turbulent to laminar flow is when the Reynolds number reaches a critical value of approximately 2,100 to 2,300. The corresponding velocity at this point is termed the transition velocity. However, for a paste backfill slurry, which behaves as a Bingham fluid, the calculation of the Reynolds number becomes more complex because the apparent viscosity μA in its expression varies with flow velocity. Typically, the plastic viscosity μB of the slurry is used to calculate the Reynolds number, which is then referred to as the Bingham Reynolds number ReB. The expression is given by Equation 11.
For Bingham fluid, according to the Buckingham flow equation, the relationship between the flow rate in the pipe and the resistance and fluid properties is:
Omitting the higher power terms in Equation 12, the transformation yields the following equation:
Carrying Equation 7 into Equation 13 gives
The above formula represents the resistance of the paste in tube flow when the wall slip effect is not considered. To calculate its Reynolds number, the above formula is transformed into the form of Fanning’s resistance formula:
In Equation 15, f is the Fanning drag coefficient:
Where Res is the effective Reynolds number, joining Equations 15 and 16 gives
We define the effective viscosity μe from Equation 14:
Joining Equations 17, 18 gives
Res is the Reynolds number of the paste in the tube flow. When the Reynolds coefficient reaches 2,100, the paste from the laminar to the turbulent flow is the paste slurry flow state of the discriminatory criteria.
By combining Equations 11, 18, Equation 20 can be transformed as
The formula for the critical flow rate is solved from Equation 21:
Samples of several representative paste slurries from the loop-pipe tests were collected and their fundamental parameters were characterized. Subsequently, based on the aforementioned research, the flow regime of the slurry within the pipeline was analyzed. The effective Reynolds number (Res) was calculated using Equation 19, and the critical velocity was determined with Equation 22. The corresponding results are summarized in Tables 4, 5.

Table 4. Slurry flow pattern analysis related parameters calculation results.
Based on the analysis of data presented in the table, the Reynolds number of the backfill slurry during the pumping process in this circulating pipeline test was significantly less than 2,100, indicating that the flow regime of the paste within the pipeline was laminar. A comprehensive comparison between the 68% and 71% concentration backfill slurries reveals that higher concentrations result in more pronounced structural flow characteristics and greater critical flow velocity. As the flow velocity increases, both the pipeline resistance and Reynolds number rise correspondingly, leading to a reduction in the flow stability of the backfill slurry. Further macroscopic observations from semi-industrial loop tests and comprehensive engineering evaluations demonstrate that within the flow velocity range of 1.4–1.8 m/s, the backfill slurry not only meets the operational requirements for mine backfilling capacity but also exhibits high flow stability and operational reliability.
5.2 Filling slurry collapse and coagulation properties
The fluidity of the filling slurry indicates how smoothly the slurry flows under the influence of its own weight or external forces, as well as the ease or difficulty of filling the quarry. As an ideal structural fluid, the fluidity of ultrafine phosphorus tailings filling slurry is an important characteristic index in the process of slurry conveyance. In the actual production process, the fluidity of the filling slurry is primarily characterized by its slump and diffusivity. The primary factors influencing these characteristics include the slurry’s mass concentration, ash–sand ratio, physical properties of the tailing sand, and other relevant factors. Combined with the field semi-industrial test to carry out the slump and setting time measurement test, the results of the tests are shown in Table 5.

Table 5. Test results of fluidity and setting time of filling slurry.
Analyzing the data in the table, it is observed that as the concentration of the filling slurry increases, its fluidity decreases, corresponding to lower values for collapse and diffusivity. For the filling slurry under the same concentration conditions, with the increase of the ash–sand ratio, the yield stress and viscosity of the slurry increase, and the fluidity of the filling slurry decreases. When comparing the setting time of filling slurries of two different mass concentrations, it is evident that high concentration and a high ash–sand ratio are conducive to reducing the setting time of the slurries.
5.3 Filling slurry self-flow times line
For mine backfill pipeline networks under gravity flow conditions, let the vertical pipe height be H and the horizontal pipe length be L. According to the principle of energy conservation, the following relationship can be established:
Considering the unevenness of pipeline layout and other unforeseen factors, if the sum of local resistance and exit loss is taken as 1.1 times the frictional resistance along the pipeline, then Equation 23 can be written as:
Equation 24 is transformed as follows:
The total pipeline length (H + L) divided by the vertical height (H) —(H + L)/H—represents the paste line (or flow gradient) in backfilling.
Based on the slump test results, gravity flow transportation becomes unachievable when the backfill concentration exceeds 70%. Therefore, the pipeline flow gradient for the 68% concentration backfill slurry in this gravity flow test was calculated using Equation 25. Figure 8 presents the allowable paste line values that enable smooth transportation under different slurry concentrations, flow rates, and pipe diameters. Values in the table less than 1 indicate that gravity flow is not feasible, while calculated paste line values greater than 10 is considered practically meaningless.
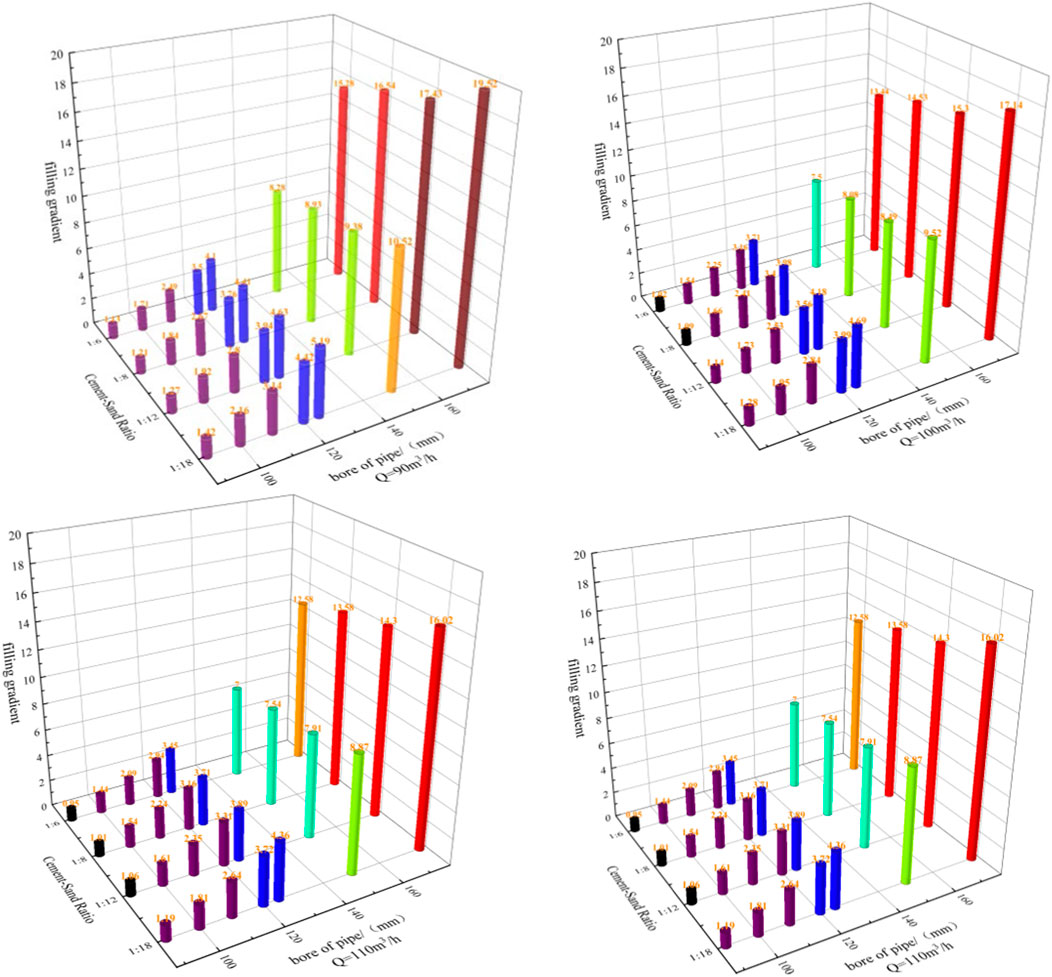
Figure 8. Self-flowing double line of filling slurry.
As can be seen from Figure 8, when the filling flow rate is 100 m3/h, the gravity flow paste line (self-flow gradient) for the 68% concentration backfill slurry in a pipeline with an inner diameter of 150 mm can reach 7.5–9.5. Combined with field observations from the self-flow transportation tests, slurries with different cement-to-sand ratios at 68% concentration all achieved smooth gravity flow within a paste line range of up to 10, which is generally consistent with theoretical calculations.
The total pipeline length for the field self-flow transportation test system was 125 m, with pipe inner diameters of 125 mm, 150 mm, and 175 mm, and a vertical height difference of approximately 15 m. A self-flow storage bin measuring 3.0 m (length)×2.0 m (width)×1.8 m (height) was installed at the test site. The tests were conducted outdoors at an average ambient temperature of approximately 22 °C. Calculations show that the static pressure head generated by the gravity of the 68% concentration backfill slurry in this system is approximately 268.569 kPa. Under these conditions, the measured slurry flow velocity range was 0.8–1.2 m/s.
Based on the semi-industrial test results, it can be concluded that under the conditions of this study, backfill slurry can be transported by gravity flow when the paste line is less than 10; when the paste line exceeds 10, pumping is required to overcome the increased pipeline resistance.
6 Conclusion
1. The content of −20 μm particles in the whole phosphorus tailing sand of Kunyang Phosphorus Mine No.2 is approximately 57.22%, and the coefficient of inhomogeneity and coefficient of curvature are 15.23 and 1.09, respectively; all the tailing sand has good gradation and is suitable for use as filling material.
2. When the filling flow rate is 90–120 m3/h, according to the economic flow rate, the inner diameter of the pipe is 125–175 mm; the flow rate of the slurry is then 1.04–2.72 m/s; 71% of the slurry pressure drop is 1.67–10 Kpa/m; 68% of the slurry pressure drop is 0.84–5.1 Kpa/m.
3. For ultrafine phosphorus tailings filling material, the flow rate has the greatest influence on pressure drop, followed by flow rate, ash–sand ratio, and slurry concentration; the pipe diameter has the least influence on pressure drop. Under the condition of ensuring stable transportation of whole phosphorus tailings slurry, a larger diameter filling pipe can be selected, and the ash–sand ratio and flow rate can be appropriately reduced.
4. Based on the Bingham fluid model to analyze and calculate the flow state and critical flow rate of the filling slurry, the Reynolds coefficient of the filling slurry ranges from 126.75 to 368.33 under the condition of pumping in the pipe, and the flow of the slurry in the pipe is a laminar flow state. When comparing the filling slurry with 68% and 71%, the higher the concentration, the more significant the structural flow state of the slurry, and the higher the critical flow rate.
5. The filling slurry of 68% concentration with different ash–sand ratios can flow through the multiplication line within 10, which is consistent with the theoretical calculation value; according to the filling semi-industrial test situation, the filling slurry can be transported by self-flow.
7 Discussion
This study investigates the flow characteristics of ultra-fine flotation phosphate tailings through loop-pipe experiments and theoretical analysis. The tailings contain a high proportion of fine particles, and the prepared slurry exhibits structural fluid behavior, maintaining a laminar flow state within the pipeline. As the mass fraction and binder-to-tailings ratio of the slurry increase, the yield shear stress and plastic viscosity rise correspondingly. Due to the pronounced surface physicochemical interactions of fine phosphate tailings particles in water, the incorporation of cementitious materials enhances “self-flocculation” among tailings particles, promoting the formation of a stable network structure between solid particles. The viscosity of this structure increases with a higher binder-to-tailings ratio. The pipeline resistance of the full phosphate tailings backfill slurry shows a positive correlation with flow velocity, concentration, binder-to-tailings ratio, and flow rate. Among these factors, flow velocity exerts the most significant influence on pipeline resistance, followed by flow rate, binder-to-tailings ratio, and slurry concentration. In practical mining operations, selecting larger-diameter pipelines and appropriately reducing flow velocity and binder-to-tailings ratio contributes to more stable transport of backfill slurry. Current research on the rheological properties of cemented phosphate tailings backfill primarily consists of theoretical analyses based on established assumptions. Future work should focus on elucidating the intrinsic evolution mechanisms of the rheological behavior of backfill slurries and advancing the application of rheological theory in engineering practice to address practical transport challenges.
Data availability statement
The original contributions presented in the study are included in the article/supplementary material, further inquiries can be directed to the corresponding author.
Author contributions
SL: Funding acquisition, Resources, Writing – review and editing. JY: Investigation, Software, Writing – review and editing. MW: Supervision, Writing – review and editing. JP: Supervision, Writing – review and editing. JY: Writing – review and editing. YZ: Writing – review and editing. CP: Writing – review and editing. DZ: Writing – review and editing. MY: Data curation, Project administration, Writing – original draft, Writing – review and editing.
Funding
The authors declare that financial support was received for the research and/or publication of this article. This research work was supported by the Phosphorus Resource Technology Innovation Center of Yunnan Province (Project No. 202305AK340002), the National Natural Science Foundation of China (Grant No. 52204160), and the Central Guided Local Science and Technology Development Funds (Project No. 202407AC110019).
Conflict of interest
Authors SL, JY, MW, JP, and MY were employed by Yunnan Phosphate Group Co., Ltd.
The remaining authors declare that the research was conducted in the absence of any commercial or financial relationships that could be construed as a potential conflict of interest.
Generative AI statement
The authors declare that no Generative AI was used in the creation of this manuscript.
Any alternative text (alt text) provided alongside figures in this article has been generated by Frontiers with the support of artificial intelligence and reasonable efforts have been made to ensure accuracy, including review by the authors wherever possible. If you identify any issues, please contact us.
Publisher’s note
All claims expressed in this article are solely those of the authors and do not necessarily represent those of their affiliated organizations, or those of the publisher, the editors and the reviewers. Any product that may be evaluated in this article, or claim that may be made by its manufacturer, is not guaranteed or endorsed by the publisher.
References
Carnogursky, E. A., Fall, M., and Haruna, S. (2023). Rheology and setting time of saline cemented paste backfill. Miner. Eng. 202 (000), 15. doi:10.1016/j.mineng.2023.108258
Chen, Q., Zhang, Q., Wang, X., Xiao, C., and Hu, Q. (2016). A hydraulic gradient model of paste-like crude tailings backfill slurry transported by a pipeline system. Environ. Earth Sci. 75 (14), 1099. doi:10.1007/s12665-016-5895-8
Chen, Q., Zhang, Q., Fourie, A., and Xin, C. (2017). Utilization of phosphogypsum and phosphate tailings for cemented paste backfill. J. Environ. Manag. 201, 19–27. doi:10.1016/j.jenvman.2017.06.027
Creber, K. J., Mcguinness, M., Kermani, M. F., and Hassani, F. P. (2017). Investigation into changes in pastefill properties during pipeline transport. Int. J. Mineral Process. 163, 35–44. doi:10.1016/j.minpro.2017.04.003
Cuiping, L., Zhenhua, H., and Xue, L. (2023). Temperature effect analysis of paste backfill rheological properties based on inter-particle potential and water evolution. Constr. Build. Mater. 404, 132045. doi:10.1016/j.conbuildmat.2023.132045
Dong, Q., Liang, B., Jia, L., and Jiang, L. (2019). Effect of sulfide on the long-term strength of lead-zinc tailings cemented paste backfill. Constr. Build. Mater. 200, 436–446. doi:10.1016/j.conbuildmat.2018.12.069
Gharib, N., Bharathan, B., Amiri, L., McGuinness, M., Hassani, F. P., and Sasmito, A. P. (2017). Flow characteristics and wear prediction of herschel-bulkley non-newtonian paste backfill in pipe elbows. Can. J. Chem. Eng. 95 (6), 1181–1191. doi:10.1002/cjce.22749
Guo, Q., Huo, B., Yu, K., Xiong, Y., and Li, B. (2024). Using acetic acid as a preconditioner to optimizethe rheology of alkali-activated coal gasification slag-based backfill pastes. Miner. Eng., 218, 109040–109040. doi:10.1016/j.mineng.2024.109040
Haiyong, C., Zemin, L., Shunchuan, W., Li, H., Zhu, J., Sun, W., et al. (2023). Resistance characteristics of paste pipeline flow in a pulse-pumping environment. Int. J. Minerals, Metallurgy Mater. 30 (8), 1596–1607. doi:10.1007/s12613-023-2644-3
Hou, Y., Kong, P., Yang, K., Yin, S., Yu, X., Wang, Y., et al. (2024). Enhancing performance and structural integrity of cemented paste backfill: rheological behavior, strength characteristics, and microstructural dynamics. Case Stud. Constr. Mater. 20, e03367. doi:10.1016/j.cscm.2024.e03367
Kwak, M., James, D. F., and Klein, K. A. (2005). Flow behaviour of tailings paste for surface disposal. Int. J. MineralProcessing 77 (3), 139–153. doi:10.1016/j.minpro.2005.06.001
Lei, H. L., Chen, H., Lei, L., Du, J. f., and Yan, B. x. (2021). Experimental investigation on flow properties of cemented paste backfill through L-pipe and loop-pipe tests. J. Central South Univ. 28 (9), 2830–2842. doi:10.1007/s11771-021-4810-y
Li, Y., Fu, J., Yang, J., and Wang, J. (2024a). Research on slurry flowability and mechanical properties of cemented paste backfill: effects of cement-to-tailings mass ratio and mass concentration. Mater. 17 (10), 2222. doi:10.3390/ma17102222
Li, X., Li, C., Ruan, Z., Wang, S., Chen, L., and Chen, G. (2024b). The mesostructure evolution of cemented paste backfill during mixing. Constr. Build. Mater. 443, 443 137726–137726. doi:10.1016/j.conbuildmat.2024.137726
Muddineni, V. P., Bonala, A. K., and Sandepudi, S. R. (2020). Grey relational analysis-based objective function optimization for predictive torque control of induction machine. IEEE Trans. Industry Appl. PP (99), 835–844. doi:10.1109/TIA.2020.3037875
Ogihara, Y., and Miyazawa, N. (2010). Laws of resistance of pipe flow of solid-liquid mixtures. J. Hydraulic Res. 29 (2), 189–205. doi:10.1080/00221689109499003
Sada, H., and Fall, M. (2019). Time- and temperature-dependent rheological properties of cemented paste backfill that contains superplasticizer. Powder Technol. 360. doi:10.1016/j.powtec.2019.09.025
Sandeep, P., Debasis, D., and Sreenivas, T. (2018). Variability in rheology of cemented paste backfill with hydration age, binder and superplasticizer dosages. Adv. Powder Technol. 29 (9), 2211–2220. doi:10.1016/j.apt.2018.06.005
Sen, C., Yin, L., Jiyan, M., Du, Y., and Sun, C. (2023). Study on properties of sewage sludge cemented paste backfill and leaching mechanism of heavy metals. Environ. Sci. Pollut. Res. Int. 30 (19), 56774–56785. doi:10.1007/s11356-023-26444-0
Shuai, X., Zhixiang, L., Chendi, M., Shi, Y., Zhang, S., and Liu, W. (2022). Compressive strength prediction of cemented backfill containing phosphate tailings using extreme gradient boosting optimized by whale optimization algorithm. Mater. 16 (1), 308. doi:10.3390/ma16010308
Wang, X., Wan, W., Liu, Y., Gao, R., Lu, Z., and Tang, X. (2023). Analysis of factors influencing the flow characteristics of paste backfill in pipeline transportation. Sustainability 15 (8), 6904. doi:10.3390/su15086904
Wu, F., and Fall, M. (2024). Sulphate-temperature-time interactions and their influence on rheological characteristics of cemented paste backfill. Powder Technol. 440, 119741. doi:10.1016/j.powtec.2024.119741
Wu, D., Fall, M., and Cai, S. J. (2013). Coupling temperature, cement hydration and rheological behaviour of fresh cemented paste backfill. Miner. Eng. 42 (2), 76–87. doi:10.1016/j.mineng.2012.11.011
Wu, A., Wang, Y., and Wang, H. (2022). Transition of slurry flow from turbulent to structural flow in pipe and its impact on pressure loss. Int. J. Minerals, Metallurgy Mater. 29 (5), 1083–1092. doi:10.1007/s12613-022-2444-1
Xibing, Li, Liu, B., and Yao, J. (2018). Theory and practice of green filling of total phosphorus waste. Chin. J. Nonferrous Metals 28 (9), 1845–1865.
Xu, J., Yao, Y., Yan, H., and Zhong, Y. (2024). Experiment and numerical simulation study of polycarboxylate superplasticizer modified cemented ultrafine tailings filling slurry: rheology, fluidity, and flow properties in pipeline. Constr. Build. Mater. 438, 137041. doi:10.1016/j.conbuildmat.2024.137041
Yang, L., Jia, H., Wu, A., Jiao, H., Chen, X., Kou, Y., et al. (2024a). Particle aggregation and breakage kinetics in cemented paste backfill. Int. J. Minerals, Metallurgy Mater. 31 (9), 1965–1974. doi:10.1007/s12613-023-2804-5
Yang, T., Wang, J., Qiao, D., Li, G., Cheng, H., Zhang, X., et al. (2024b). The thixotropic characteristics of rheological parameters of waste stone-tailings cemented paste backfill and the time effect of pipeline resistance. Constr. Build. Mater. 423, 135858. doi:10.1016/j.conbuildmat.2024.135858
Yao-hui, Y., and Chuan-ming, D. (2023). Leaching of phosphorus from phosphate tailings and extraction of calcium phosphates: toward comprehensive utilization of tailing resources. J. Environ. Manag. 347, 119159. doi:10.1016/j.jenvman.2023.119159
Yonghui, N., Haiyong, C., Shunchuan, W., Sun, J., and Wang, J. (2022). Rheological properties of cemented paste backfill and the construction of a prediction model. Case Stud. Constr. Mater. 16, e01140. doi:10.1016/j.cscm.2022.e01140
Yu, Z., Kong, W., Ji, Z., and Wang, Y. (2024). Impact of virgin and recycled polymer fibers on the rheological properties of cemented paste backfill. Sci. Rep. 14 (1), 17783. doi:10.1038/s41598-024-68622-1
Zhenlin, X., Haikuan, S., Deqing, G., Yan, Z., and Liu, Z. (2023). Wall slip behavior of cemented paste backfill slurry during pipeline based on noncontact experimental detection. Int. J. Minerals, Metallurgy Mater. 30 (8), 1515–1523. doi:10.1007/s12613-023-2610-0
Zhou, D., Qi, K., and Tan, Z. (2013). Study on pipeline self-flowing transportation of cemented tailing fill slurry based on fluent software. Adv. Mater. Res. 2482 (734-737), 833–837. doi:10.4028/www.scientific.net/AMR.734-737.833
Keywords: phosphorus tailings, ring pipe test, rheological properties, mechanical properties, pressure drop
Citation: Li S, Yang J, Wang M, Pang J, You J, Zhu Y, Pan C, Zhang D and Yuan M (2025) Experimental study on the cemented filled annular tube of ultrafine flotation phosphorus tailings from a phosphorus mine. Front. Built Environ. 11:1686421. doi: 10.3389/fbuil.2025.1686421
Received: 25 August 2025; Accepted: 13 October 2025;
Published: 02 December 2025.
Edited by:
Jaroslaw Rybak, Wrocław University of Science and Technology, PolandReviewed by:
Nikita Babyr, Saint-Petersburg Mining University, RussiaMaciej Kaźmierowski, Wrocław University of Environmental and Life Sciences, Poland
Copyright © 2025 Li, Yang, Wang, Pang, You, Zhu, Pan, Zhang and Yuan. This is an open-access article distributed under the terms of the Creative Commons Attribution License (CC BY). The use, distribution or reproduction in other forums is permitted, provided the original author(s) and the copyright owner(s) are credited and that the original publication in this journal is cited, in accordance with accepted academic practice. No use, distribution or reproduction is permitted which does not comply with these terms.
*Correspondence: Mingli Yuan, eXhtbGhqdDcxOEAxNjMuY29t