 Tania Rus
 Raluca Paula Moldovan
 Carmen Maria Mârza
 Dana-Adriana Iluţiu-Varvara
- Building Services Engineering Department, Faculty of Building Services Engineering, Technical University of Cluj-Napoca, Cluj-Napoca, Romania
Educational institutions face a growing challenge in creating indoor environments that support both student wellbeing and operational efficiency. This case study, conducted within two university classrooms at the Technical University of Cluj-Napoca, Romania, assesses the reliability of a smart building system deployed to monitor indoor parameters. The system, which features integrated wall-mounted Internet of Things (IoT) sensors communicating via the KNX protocol, is evaluated by benchmarking its performance to that of a professional monitor instrument (Testo 400). The methodology involved a mixed-methods approach, combining quantitative data from the KNX-based automation network and Testo 400 monitor with qualitative feedback from occupants on thermal comfort, humidity, and indoor air quality. While a systematic offset was observed, with the professional monitor yielding higher readings, the KNX system demonstrated notable consistency. The statistical analysis revealed a strong Pearson’s correlation (up to 0.98, p < 0.001) for CO2 and relative humidity, followed by temperature (up to 0.97). Despite successful thermal comfort maintenance, indoor air quality emerged as a significant concern due to CO2 levels frequently indicating severe ventilation deficiencies. Comparative analysis showed minimum CO2 concentrations fell into EN 16798–1:2019 Category II/III, while maximum concentrations exceeded both Category IV (Red rating) and the ASHRAE 62.1–2022 threshold. Beyond validating KNX’s reliability for indoor environmental quality monitoring in this specific context, this case study highlights the critical need for ventilation system upgrades in higher education to effectively control high CO2 concentrations and foster healthier learning environments.
1 Introduction
Educational institutions face a growing challenge in creating indoor environments that support both student wellbeing and operational efficiency. University buildings, particularly high-occupancy lecture halls and classrooms, present complex dynamic environments where indoor environmental quality (IEQ) variables—such as temperature, humidity, and carbon dioxide (CO2) levels—fluctuate rapidly due to teaching schedules, changing external conditions, and occupant density. Ensuring high-quality IEQ is critical, as it directly influences cognitive function, learning performance, and the overall health of students and faculty (Zhang et al., 2022). The rise of Building Automation Systems (BAS) and the Internet of Things (IoT) provides new opportunities to continuously monitor and manage these complex indoor conditions. Modern systems, such as those employing the KNX protocol, integrate sensors directly into the building infrastructure, offering the potential for real-time data collection and automated control. This move away from periodic spot checks towards continuous, integrated monitoring promises a paradigm shift in how IEQ is maintained in educational facilities.
However, the practical implementation and reliability of these wall-mounted, fixed BAS sensors—which are often selected for their integration capability rather than their laboratory-grade precision—remain a significant concern. Their placement, calibration stability, and ability to accurately capture conditions across an occupied zone need empirical validation, especially when the resulting data is used to make critical control decisions.
In response to these concerns, this case study, focusing on one of the buildings of the Technical University of Cluj-Napoca, Romania, is designed to address a critical gap in current research: the limited evaluation of integrated KNX BAS sensor accuracy in real-world, occupied educational settings. The primary aim of this study is to assess whether a commercially available KNX BAS can reliably and accurately monitor key IEQ parameters—specifically temperature, relative humidity, and CO2 concentration—in active university classrooms. The methodology employed involves a rigorous, mixed-methods comparison: KNX sensor data is benchmarked against readings from a professional, laboratory-grade monitor (Testo 400), and this quantitative analysis is supplemented with qualitative, subjective feedback from the classroom occupants. The contribution of this work is to provide essential, evidence-based data on the practical suitability and limitations of fixed, wall-mounted BAS sensors for continuous IEQ monitoring and automated control in high-density learning environments.
2 Literature review
2.1 Indoor environmental quality and measurement standards
The assessment of IEQ encompasses a broad spectrum of factors, including thermal comfort, indoor air quality (IAQ), lighting, and acoustics, rendering it a comprehensive and inherently complex endeavor (Zhang et al., 2022; Baba et al., 2022; ASHRAE ANSI/ASHRAE, 2023), all of which significantly impact human wellbeing and productivity. The increasing number of publications in recent years indicates a growing concern for IEQ monitoring in educational buildings, including universities, and reflects society’s rising interest in the physical, mental, and emotional health of younger generations. This trend is closely linked to broader economic, technological, and social progress. According to statistical analysis by (Jia et al., 2021), most of the research in this area has been carried out in China, the United Kingdom, Italy, Spain, India, South Korea, and Australia.
Thermal comfort, defined as “that condition of mind which expresses satisfaction with the thermal environment” (ANSI/AS HRAE Standard 55-2017, 2017), is typically measured through parameters like air temperature and relative humidity. This concept is formally codified in standards such as ASHRAE Standard 55 (ANSI/AS HRAE Standard 55-2017, 2017), which specifies the combinations of environmental and personal factors (air and radiant temperature, air velocity, humidity, metabolic rate, and clothing insulation) that produce acceptable thermal conditions for 80% or more of occupants.
As defined by standards (ASHRAE ANSI/ASHRAE, 2023), IAQ refers to the air quality inside and surrounding buildings, directly impacting occupant health and productivity. It is determined by factors such as pollutant concentrations, ventilation effectiveness, and the presence of various contaminants that can affect human wellbeing. Common indoor air pollutants found in educational institutions include carbon dioxide (CO2), particulate matter (PM), volatile organic compounds (VOCs), and biological pollutants (e.g., mold, bacteria). Poor IAQ in educational institutions has been associated with various adverse health effects among students, including an increased risk of respiratory diseases, allergies, asthma exacerbations, and cognitive difficulties, leading to increased absenteeism and reduced academic performance (Sadrizadeh et al., 2022; Pantelis Adamopoulos et al., 2025; Indoor Air Quality, 2016).
The European standard EN 16798–1:2019 classifies IAQ into four categories based on CO2 levels: Category I (High Quality) is typically defined by concentrations ≤550 ppm above outdoor levels; Category II (Moderate Quality) by ≤800 ppm; Category III (Low Quality) by ≤1,350 ppm; and Category IV is designated when other quality levels cannot be achieved. Similarly, the ANSI/ASHRAE Standard 62.1–2022 (ANSI/ASHRAE, 2015) sets the threshold for acceptable 1AQ at a concentration 700 ppm above the outdoor CO2 level during occupancy.
These standards underscore the necessity of reliable measurement to verify compliance and optimize the learning environment.
2.2 Challenges in monitoring IEQ in classrooms
Higher education institutions (HEIs) are pivotal in fostering healthy learning environments, advancing IEQ through research, educating future professionals, shaping policy, and engaging communities to raise awareness and promote best practices (Jia et al., 2021; Sadrizadeh et al., 2022; Andrade et al., 2025; Marzouk and Atef, 2022). By serving as both research hubs and living laboratories, HEIs also demonstrate and validate smart energy and environmental solutions, positioning them as advocates of indoor wellbeing and pioneers in advancing building performance (Cilibiu and Abrudan, 2024; Ciugudeanu et al., 2016). HEIs face unique IEQ challenges due to their significantly higher population densities compared to residential, administrative, or commercial buildings. This is compounded by frequent overcrowding, limited air exchange between classes, and often inadequate ventilation systems (Sánchez-Fernández et al., 2023) that rely heavily on natural airflow.
While significant research has explored IEQ within elementary, middle, and high schools, recognizing younger students as a vulnerable population, undergraduate students, a distinct demographic of young adults, and warrant equally careful consideration (Marzouk and Atef, 2022). They are experiencing significant hormonal changes that directly affect metabolism, while at the same time dealing with the intense intellectual demands and long-term indoor exposure associated with university life and independent study. In addition, the age-related changes in clothing habits of this group contribute to different personal thermal resistance values, further complicating the assessment of their thermal comfort. Since students are present in these spaces for a considerable part of their day, creating an environment that supports concentration, health, and academic performance is imperative (Brink et al., 2023). Therefore, accurate IEQ assessment is essential, as it informs evidence-based strategies for building design, operation, and maintenance.
Educational buildings have their own sources of pollutants which can originate within the building or from outside (Stihi and Bute, 2023; Cincinelli and Martellini, 2017; Burman et al., 2018). Among the various factors that contribute to this environment, thermal comfort and IAQ stand out as two key parameters. Research has consistently demonstrated a clear link between these parameters and several critical aspects of students’ academic experience, including cognitive performance and concentration levels (Pantelis Adamopoulos et al., 2025; Alonso et al., 2025; Branco et al., 2024; Choi et al., 2013; Brink et al., 2023). While high temperatures can hinder concentration and increase fatigue, and cold environments can cause discomfort and decrease motivation, maintaining proper thermal comfort improves students’ concentration and cognitive performance (Marzouk and Atef, 2022; Romero et al., 2024; Guevara et al., 2021; Riaz et al., 2025). These findings highlight the importance of maintaining thermal comfort within an acceptable range to facilitate effective learning.
Thermal comfort perception in universities varies significantly due to age, gender, habits, academic programs, and activities. In this context, the authors of the studies (Marzouk and Atef, 2022; Luo et al.) emphasize aligning indoor environment with occupants’ expectations and recommending physical measurements of comfort parameters alongside periodic revisions of thermal comfort standards.
Elevated CO2 concentrations in university classrooms have raised significant attention due to their potential impact on IAQ, occupant comfort, and cognitive performance. Recent studies have explored the spatial distribution of CO2 within classrooms, revealing that factors such as wind direction and speed can significantly influence indoor ventilation performance (Mahyuddin and Essah, 2024). Furthermore, the National Institute of Environmental Health Sciences has found that architectural flaws and insufficient ventilation in school buildings lead to poor air quality, which can have an adverse effect on students’ mental health, communication abilities, and academic performance (Indoor Air Quality, 2023). These findings underscore the importance of maintaining good indoor air quality in schools to safeguard students’ health and enhance their learning outcomes. For educational environments where students spend extended periods indoors and are more vulnerable to pollutants (EN 16798-1, 2019), monitoring CO2 levels is imperative for good IAQ. Elevated concentrations can signify inadequate airflow relative to the number of occupants. Insufficient ventilation leading to higher CO2 levels can impact both comfort and cognitive function (Fretes et al., 2024; Ragazzi et al., 2017). Beyond discomfort and potential respiratory problems, high CO2 concentrations can also contribute to heightened stress and emotional instability (Kapalo et al., 2018). The authors (Sh et al., 2004) conclude that the CO2 concentration in classrooms has a direct influence on student attendance, and an increase of 1,000 ppm CO2 leads to an increase of absenteeism by 10%–20%. According to another study (Gaihre et al., 2014), every 100-ppm increase of CO2 reduces the annual attendance of students by 0.2%. It has also been established that raising the ventilation rate can lower absenteeism due to illness by 10%–17% (Grün, 2015). A systematic review focusing on naturally ventilated primary schools highlighted that CO2 concentrations exceeding 1,000 ppm are indicative of insufficient ventilation and are associated with reduced odor removal. The study also emphasized the inverse correlation between perceived air quality and both operative temperature and CO2 concentration, suggesting that maintaining CO2 levels below 1,000 ppm and temperatures below 23 °C can significantly enhance occupants’ perception of air quality (Honan et al., 2024). According to the authors (Marzouk and Atef, 2022), the effects of poor IAQ include health issues, productivity loss, and occupant discomfort. So, maintaining appropriate CO2 levels in university classrooms is imperative for ensuring adequate ventilation, occupant comfort, and optimal cognitive performance. Monitoring CO2 concentrations in real time and designing flexible ventilation schemes that adapt to occupancy changes are crucial measures. Additionally, considering more stringent IAQ standards could significantly benefit learning environments, promoting better academic outcomes and overall wellbeing.
According to standards (ASHRAE ANSI/ASHRAE, 2023; ISO, 2012), the measurement sensors should be positioned at heights relevant to the occupants, typically within the breathing zone (around 1.1 m for seated adults and proportionally lower for children) to capture the conditions they directly experience. The research performed by (Frontczak and Wargocki, 2011), suggests that multiple sensors at different heights might be necessary in classrooms with varying age groups or where activities involve both seated and standing postures. Other studies have shown significant differences between conditions near windows, in the center of the room, and in occupied zones (Frontczak and Wargocki, 2011; Waeytens et al., 2019; Rackes et al., 2018). The authors (Sulistiyanti et al., 2024) discovered significant variations in CO2 levels based on student numbers and activities, underscoring the inadequacy of relying on a single sensor to capture the overall classroom environment. Similarly, (Honan et al., 2024), highlighted the spatial variability of CO2 concentrations in naturally ventilated classrooms, further emphasizing the complexity of accurately monitoring IAQ. Direct placement of sensors near heat sources (e.g., radiators, computers, projectors) or pollutant sources (e.g., whiteboards with dry-erase markers, areas with high foot traffic potentially responding dust) can lead to localized readings that do not represent the overall classroom environment (Guo et al., 2004; Park et al., 2014). Sensors should be positioned at a sufficient distance from such sources to measure the ambient conditions. Furthermore, occupant behavior, such as opening or closing windows, adjusting thermostats, or moving within the space, introduces unpredictable variability that continuous monitoring systems must be robust enough to track.
Sensor placement is thus critical but often dictated by architectural constraints or ease of installation rather than optimal sampling strategy. Studies have shown that even small differences in vertical or horizontal placement can yield significantly different readings, particularly for CO2, which accumulates rapidly in occupied zones.
2.3 Sensor technologies: portable vs. wall-mounted systems
IEQ monitoring can be broadly divided into two technological approaches: portable/reference systems and fixed/integrated BAS sensors. Therefore, an accurate assessment of the IEQ parameters relies heavily on the strategic placement of sensors within the classroom environment. Inadequate sensor positioning can lead to biased data, misinterpretation of conditions, and ultimately ineffective strategies for improving the learning environment. This literature review analyzes existing research investigating the strategic deployment of specific sensor technologies, with a particular focus on both portable, professional multi-parameter instruments exemplified by the Testo 400 or similar, and permanently integrated sensors within BAS, such as Internet of Things (IoT) sensors adhering to the KNX protocol (SREN, 2002).
The core challenge in environmental monitoring within dynamic spaces like classrooms lies in obtaining measurements that are truly representative of the conditions experienced by the occupants (ASHRAE ANSI/ASHRAE, 2023; ISO, 2012). Classrooms are not homogenous environments. Temperature, humidity, and pollutant concentrations can vary considerably depending on the location within the room. Classrooms are also characterized by fluctuating occupancy levels, diverse activities, varying heat and pollutant sources, and complex airflow patterns influenced by ventilation systems, window openings, and occupant behavior (Sulistiyanti et al., 2024; Allen and Macomber, 2020; Lala and Hagishima, 2007; Mendell and Heath, 2005; Rabani et al., 2025). Therefore, sensor placement must account for these spatial and temporal variations to provide meaningful data for analysis and intervention.
Different activities generate different levels of heat and pollutants. For example, sedentary activities like reading or writing result in lower metabolic rates and CO2 production than more active tasks like group work or physical exercise. The study conducted by (Sulistiyanti et al., 2024) examined how human behavior, classroom dynamics, and occupancy affect IAQ using an IoT based real-time monitoring system. Their findings revealed a clear correlation between student activity and CO2 concentrations. Real-time monitoring systems provide detailed information, appropriate averaging periods for data analysis, and are determinative for understanding the overall trends and for avoiding misinterpretations based on short-term fluctuations. Despite the detailed information and appropriate averaging periods offered by such advanced systems, their effectiveness is undermined without proper maintenance. Regardless of the rigor applied to sensor placement, the accuracy and reliability of the collected data are ultimately contingent upon regular calibration and consistent maintenance of the monitoring equipment (Martins et al., 2023). Factors such as dust accumulation on sensor elements, gradual sensors drift over time, and battery depletion in wireless units can all compromise the integrity of the measurements. Therefore, ease of access for routine maintenance and calibration procedures should be considered during the initial sensor placement planning.
Professional portable instruments designed for indoor thermal evaluation, such as the Testo 400, are versatile multi-function measuring devices often used for compliance testing, auditing, and research. They typically feature laboratory-calibrated, high-precision sensors (e.g., Non-Dispersive Infrared (NDIR) for CO2) and offer high temporal resolution. They are frequently used for localized investigations and short-term monitoring campaigns, typically relying on external probes to assess various environmental parameters. When using the portable instrument, the user has direct control over the sensor location at the time of measurement. Therefore, adherence to the general principles outlined in standards is paramount. Researchers and practitioners must consciously position the probes at representative occupant heights, away from direct sources, and in areas with adequate air mixing to obtain meaningful data. Studies utilizing portable instruments like Testo often involve systematic measurements at multiple points within a classroom to assess spatial variability (Vilcekova et al., 2017; Kapalo et al., 2019; Rus et al., 2023). The portability of the Testo instruments allows for flexibility in investigating specific microenvironments within the classroom; however, its use often requires manual data logging or short-term automated logging, which may limit its applicability for long-term continuous monitoring of overall classroom conditions from fixed locations.
Fixed, wall-mounted BAS sensors, often utilizing protocols like KNX, are designed for continuous operation and seamless integration into a building management system. These sensors provide the data foundation for automated ventilation, heating, and cooling control. KNX systems incorporate permanently installed IoT sensors and actuators for monitoring and controlling environmental parameters. Typically integrated into a building infrastructure, these IoT sensors continuously feed data to the BAS. Current trends favor integrating multiple sensors into single devices to reduce sensor and installation costs, as well as to minimize size and power consumption (Weyers et al., 2017; Roozeboom et al., 2015). As applications for occupancy and indoor environmental monitoring become more advanced, the utilization of multi-sensor devices has become standard practice in contemporary building studies (Saralegui et al., 2019; Pipattanasomporn et al., 2020; Pantelic et al., 2022).
IoT sensors are commonly wall mounted. This placement offers the advantage of continuous monitoring and feedback for HVAC control. However, research acknowledges the practical advantages of wall mounting but also highlights potential limitations in capturing spatial (Ekwevugbe et al., 2017; Azizi et al., 2021; Valks et al., 2020). The study performed by (Adelodun et al., 2024) revealed that wall-mounted sensors, compared to those placed closer to the pollution source and within the breathing zone, recorded lower pollutant levels and exhibited slower response times in detecting peak concentrations. The authors (Samman et al., 2022) examined sensor placement in an office environment, which shares similarities with classrooms in terms of occupancy and ventilation. The study discussed that while relative humidity and CO2 measurements showed marginal differences across different sensor locations, temperature measurements varied more significantly, particularly in proximity to heat sources. This suggests that wall-mounted sensors, while potentially adequate for well-mixed parameters like CO2, may not accurately capture localized temperature variations that affect thermal comfort.
2.4 Gaps in literature and study rationale
While extensive research exists on the relationship between IEQ and occupant performance, and on the technical capabilities of individual sensor types, there remains a distinct lack of empirical evidence comparing the real-world performance of integrated, wall-mounted BAS sensors (specifically KNX) against professional reference instruments (like the Testo 400) within occupied university classrooms. Research indicates that the typical wall mounting of IoT sensors, while practical for HVAC control, may not fully represent the spatial heterogeneity of indoor environmental conditions, potentially underestimating pollutant levels and failing to capture localized temperature variations (Sulistiyanti et al., 2024; Azizi et al., 2021; Adelodun et al., 2024). This raises a critical question: how do these potentially generalized wall-mounted measurements relate to the actual comfort experienced by students and teachers in different parts of the room? Furthermore, can a KNX system controlling the HVAC system truly ensure occupants’ comfort throughout these diverse areas? Therefore, future research should prioritize correlating sensor reading with subjective feedback on comfort and acceptability. Studies are needed to determine how varying sensor locations within space influence the relationship between objective measurements and subjective evaluations of comfort.
Many researchers evaluating IEQ employ a methodology that effectively combines quantitative measurements from portable instruments with qualitative data collected through questionnaires (Vilcekova et al., 2017; Kapalo et al., 2019; Rus et al., 2023; Grün and Urlaub, 2015), offering a multi-faceted perspective. Other studies have underscored the spatial variability of indoor parameters by comparing the quantitative data from various sensor locations within a room (Marzouk and Atef, 2022; Sulistiyanti et al., 2024; Adelodun et al., 2024). However, the potential of integrating these two powerful approaches remains largely unexplored. To the best of the authors’ knowledge, there is a scarcity of research that systematically combines the detailed spatial information obtained from multiple instruments (portable and wall mounted) with the nuanced subjective experiences captured through questionnaires, potentially offering a more comprehensive and insightful evaluation of indoor environments.
These gaps justify the current study, which directly evaluates the reliability of a KNX system setup under dynamic operating conditions. By comparing the fixed-sensor data with mobile, high-precision reference measurements and linking both to subjective occupant feedback, this research provides a holistic assessment of the practical suitability of widely deployed BAS technology for accurate IEQ monitoring and control in the educational sector.
3 Materials and methods
Understanding the spatial variability of environmental parameters is important for accurate evaluation and effective implementation of building management strategies aimed at optimizing occupant wellbeing and learning performance.
To gain a comprehensive overview of the indoor environmental conditions, this study integrates both objective measurements and the subjective experiences of the building occupants. Therefore, alongside the deployment of environmental sensors, we also incorporated methods for capturing occupants’ perceptions of the indoor thermal environment. The characteristics of the selected classrooms, the specific types of sensors utilized, their placement and the recordings timeframe, the design and administration of the occupant surveys, and the data processing techniques applied are comprehensively described in the following subsections. This detailed account ensures the transparency and replicability of our research approach, providing a solid foundation for the interpretation of the results presented later in this paper.
3.1 Site description
The building where the case study was conducted, namely, the Faculty of Building Services Engineering, is located in a semi-central area of Cluj-Napoca, Romania and it is one of the educational facilities of the Technical University of Cluj-Napoca. The city is located in the central-northwestern area of Transylvania, with 46°46′0″N 23°35′0″E and an average altitude of 400 m, surrounded by hills, which offers it a certain degree of shelter, but predisposes it to fog in cold periods. Although it has a population of around 300,000 inhabitants, which reaches approximately to 420,000 inhabitants together with the metropolitan area, the town is known primarily as a university city with tradition, so that, even if there is an industrialized sector located on the outskirts, it is not characterized by severe pollution.
The climate is temperate continental, with an average annual temperature of 8.2oC. But in the calculations regarding the heat requirement in the cold season, the conventional temperature of the outside air is −18 °C, and the cold requirement in the warm season is 26 °C, if solar radiation is not taken into account (ASRO SR, 1907-2, 2014; ASRO SR 6648-1, 2014).
Built in 1966, the educational building is a brick and concrete structure with a basement, a ground floor, and two upper floors. Between 2005 and 2008, the building underwent significant renovation and retrofitting. This major overhaul included improvements to the building envelope, which substantially boosted its energy performance. Additionally, a third level was added using a metal structure, and all existing building installations were replaced with modern systems (Ciugudeanu et al., 2016; Rus et al., 2023).
For this study, we selected two vertically aligned classrooms with identical surface area and a northwest orientation (Figure 1): classroom I03, a ground-floor laboratory, and classroom I302, a design laboratory on the third level. Although the laboratories can hold 20 to 24 students, they are used for activities by smaller groups of 13–15.
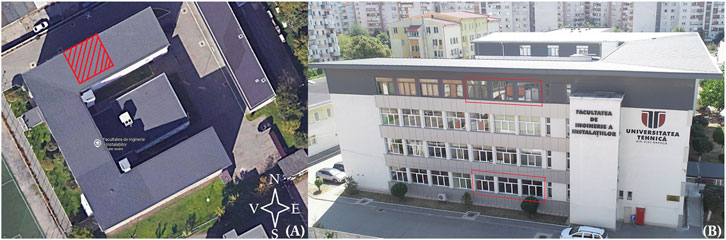
Figure 1. Faculty of Building Services Engineering: (A) View from Google maps of the building; (B) N-W façade of the building.
3.2 Objective measurements
The first approach in the research utilizes the professional Testo 400 universal IAQ instrument, a high-precision device capable of measuring a suite of relevant parameters, including air velocity, temperature, humidity, pressure, radiant heat, turbulence and CO2 (Professional Measuring Devices + Measuring). The Testo 400 also incorporates built-in measurement programs that facilitate standard-compliant assessments, such as the predicted mean vote (PMV) and the predicted percentage of dissatisfied (PPD) indices, as defined by (ASHRAE ANSI/ASHRAE, 2023). For the case study educational building, where students have a sited position during classes, the probes were placed in the center of the occupied area (Figure 2) at a height of 1.1 m (head level for seated occupants) and at a distance of at least 1 m from any source that could influence the probes (occupants, walls, windows). The standard recommends a measurement time step of no more than 5 minutes for air temperature, radiant temperature, and humidity. Consequently, a recording timeframe of 5 min was employed for all environmental variables. The standard also suggests that the total duration of the measurement period should be 2 hours, ideally spanning a period representative of typical occupancy and potential fluctuations in environmental conditions throughout the day. The specific environmental conditions prevailing during the measurement period, such as the season, time of day, and the operational status of the heating system, were documented. The Testo 400 can measure air temperature from −40 °C–150 °C, with an accuracy of ±0.2 °C in the −25 °C–74.9 °C range. For radiant temperature, the instrument’s range is 0 °C–120 °C, though its accuracy varies depending on the specific probe used. The device’s humidity measurement range is from 0% to 100% relative humidity (RH), with an accuracy of ±2% RH. For measuring air velocity, the Testo 400 has a range of 0–50 m/s and an accuracy of ±0.03 m/s. Finally, the instrument can also measure carbon dioxide (CO2) levels, with a range of 0–10,000 ppm and an accuracy of ±50 ppm for measurements between 0 and 5,000 ppm. All calibration data and traceability information of the Testo 400 are contained within the calibration protocol provided with the instrument, ensuring its reliability as a reference standard for the comparison.
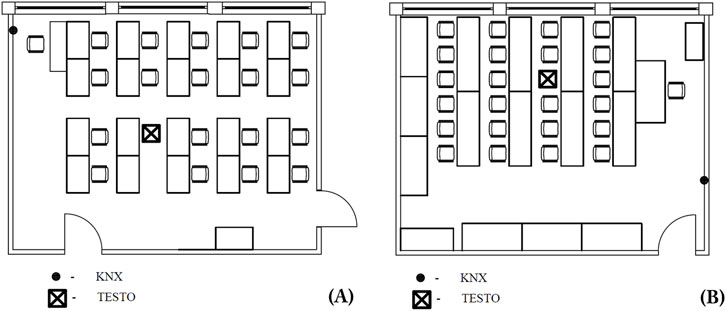
Figure 2. Plan of the two monitored classrooms: (A) Classroom I302; (B) Classroom I03.
The second measurement approach involves a KNX system. This system is composed of distributed IoT field devices (sensors and actuators), each running manufacturer-specific firmware that implements the standardized KNX protocol stack. This firmware ensures reliable communication on the KNX bus but is not user-accessible or modifiable. Device-specific calibration and parameterization, such as sensor offsets, actuator timing, and control curves, are configured through the Engineering Tool Software (ETS), which provides the project-level integration of all KNX devices. For system monitoring and interaction, the open-source XKNX middleware (version 3.6.0) was deployed.
KNX systems are widely employed for controlling various aspects of building operations, including environmental monitoring. These systems typically incorporate sensors capable of measuring key IAQ parameters such as CO2, humidity, and temperature. For practical reasons related to building management and control, these sensors are installed on interior walls (Figure 2), away from the sun’s ray, at a height of 1.5 m. The accuracy of these integrated sensors may differ from that of dedicated research-grade instruments like the Testo 400. However, long-term measurements in a crowded university classroom using a device like the Testo 400 presents significant drawbacks. The constant movement of students and staff, along with the presence of furniture and belongings, creates a high risk of accidental damage to the instrument. Bumping, knocking over, or even kicking the device could lead to physical harm, calibration issues, or complete failure. In contrast, wall-mounted sensors offer a much safer and more practical solution for continuous monitoring. Wall-mounted devices are far less likely to be accidently damaged as they are removed from the main flow of activity. They do not impede movement, are less prone to tampering, and generally offer easier access for necessary checks. Therefore, for long-term monitoring in a dynamic environment like a university classroom, wall-mounting is the preferred placement strategy over a central location within the occupied area.
This comparison aims to understand the practical implications of using readily available integrated building system sensors versus employing a dedicated research instrument with standardized placement. The IoT sensor for air temperature measures a range from −20 °C to +50 °C with an accuracy of ±0.5 °C to ±1 °C. The humidity sensor operates across a full range from 0% to 100% RH with an accuracy of ±2% RH. The CO2 sensor is designed to measure carbon dioxide concentrations from 0 to 5,000 ppm with an accuracy of ±50 ppm. The measurements took place in the spring of 2025, specifically in the beginning of April. This timing was important as it allowed us to conduct the study after the KNX-based automation network was operational and while the heating system was still actively in use, providing a representative snapshot of the building’s environmental performance under these conditions. To maximize energy efficiency and occupant comfort, the KNX system for classrooms operates on a time-based schedule with distinct temperature set-points for different operational modes. During off-use periods (e.g., nights, weekends, or scheduled breaks), the system is set to a reduced temperature set-point of 18 °C. This standby temperature prevents the building from getting too cold, minimizing the energy required to return to the desired temperature when the space is occupied again. When the classrooms are in use, the heating system is activated, and the maximum temperature set-point is raised to 21 °C. This ensures a comfortable learning environment. The KNX system can also be configured to allow individual room overrides within a predefined range to accommodate specific user preferences.
To identify any potential differences in the recordings and to strengthen the robustness of our results, we chose two consecutive weeks for data collection. During each of the 2 weeks, we conducted recording sessions in both laboratories. In laboratory I302, recordings ran continuously from 10:30 a.m. to 2:00 p.m., starting 30 min after classes began to allow students to settle and adjust their thermal comfort. Conversely, in laboratory I03, our recordings began earlier, from 8:30 a.m. to 12:00 p.m., also starting 30 min after class commenced. This scheduling enabled us to capture environmental data during distinct periods of activity and occupancy within each educational space.
3.3 Subjective assessment
For a precise understanding of occupants’ perceptions regarding the thermal environment and IAQ, we performed a thorough qualitative assessment. This involved using questionnaires designed to comply with (ISO, 2014). By collecting these responses simultaneously with the environmental measurements, we adopted a synchronized methodology. This approach allowed us to directly obtain occupants’ real-time perceptions of their classroom setting during a typical class.
The survey was designed in the students’ national language (Romanian) and was divided into two key sections. The first section aimed to elicit their perceptions, preferences and tolerance concerning various aspects of the indoor thermal environment and the quality of the air they were breathing. Table 1 outlines the evaluation scales for the perception of indoor parameters that we previously employed in our earlier research (Rus et al., 2023). The second section collected essential anthropometric data, including their weight, height, and age, which could potentially be relevant to their thermal comfort and IAQ perception.
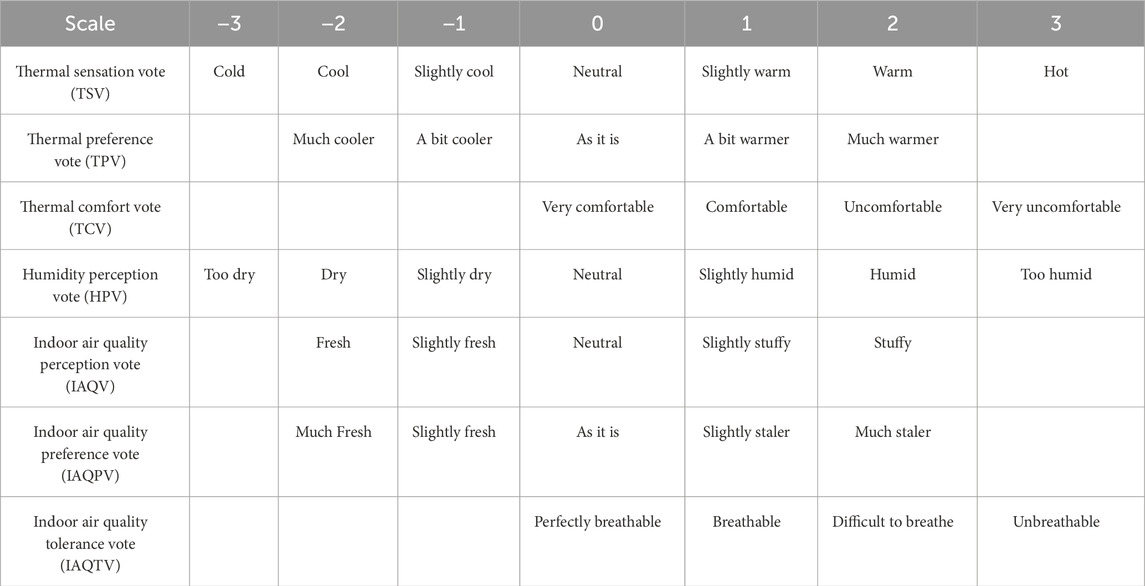
Table 1. Evaluation scales of the indoor parameters.
An anonymous online questionnaire, accessible via a QR code, was given to students 30 min into their classes. Although 124 students were present across the four recording sessions, only 50 completed the survey, resulting in a relatively low response rate. Specifically, 11 questionnaires were gathered on April 8th, followed by nine on April 9th. In the subsequent week, 15 questionnaires were completed on April 15th, with another 15 on April 16th. These responses provide insights into the occupants’ perceptions, directly complementing our objective environmental measurements. Participation in the survey was entirely voluntary for all respondents.
3.4 Data analysis
The data collected from the Testo 400, the KNX system, and the occupants’ subjective assessment were analyzed using a variety of statistical methods using OriginPro software 2025 (Origin, 2013). Given that the quantitative measurements were taken simultaneously at the same time, the data was treated as paired for the purpose of statistical comparison.
To characterize the collected dataset, descriptive statistics were calculated for each measured parameter. These included the minimum, maximum, mean, and standard deviation (SD) values, providing a fundamental summary of the data’s central tendency and variability.
To explore the relationships within the dataset, correlation analysis was employed. Specifically, the Pearson correlation coefficient was utilized to quantify the strength and direction of the linear relationship between objective environmental parameters. A Pearson coefficient close to +1 indicates a strong positive linear association (variables increase or decrease together), while a value near −1 suggests a strong negative linear association (one variable increases as the other decreases). A coefficient near 0 implies little to no linear relationship. Furthermore, to rigorously assess the performance and reliability of the KNX system against the professional Testo 400 monitor, several standard error metrics were employed. The Mean Bias Error (MBE) was calculated to identify systematic deviation (bias), indicating whether the sensor system consistently over- or underestimates the parameter values. The overall accuracy was quantified using the Mean Absolute Error (MAE), which provides the average magnitude of the errors, and the Root Mean Square Error (RMSE), which gives a measure of the error magnitude while giving greater weight to large individual errors.
For assessing relationships between quantitative environmental data and ordinal subjective perception variables, Spearman’s rank correlation coefficient was employed. As a non-parametric measure, Spearman’s rho evaluates the strength and direction of a monotonic relationship (where variables tend to change together, but not necessarily at a constant rate). A highly positive Spearman’s rho indicates that as the rank of one variable increases, the rank of the other variable also tends to increase consistently. Conversely, a highly negative rho signifies that as the rank of one variable increases, the rank of the other tends to decrease.
To determine the statistical significance of these correlations, a significance level of p = 0.05 was adopted. This threshold means that a correlation was considered statistically significant if there was less than a 5% probability that the observed relationship occurred by random chance alone, allowing for the rejection of the null hypothesis of no correlation.
4 Results
4.1 Quantitative measurements
Within Table 2, a detailed overview of the descriptive statistics is provided, encompassing the indoor environmental parameters observed during our study and the corresponding outdoor temperature data collected daily from 8:30 to 14:00. The indoor parameters include air temperature, humidity, and CO2 levels. Data for this analysis was collected from the Testo 400 instrument and the KNX-based automation system. It is important to note that while the Testo 400 instrument captured all necessary variables for the predicted mean vote assessment, the KNX system does not record air velocity. Consequently, the PMV could not be computed from the IoT sensors alone. Therefore, Table 2 exclusively reports the PMV values derived from the data collected by the Testo 400 instrument. Also, the student count presented in Table 2 denotes the cumulative total of subjects observed within each room per day, encompassing two distinct study groups that participated consecutively, rather than simultaneously, in 2-h classroom modules.
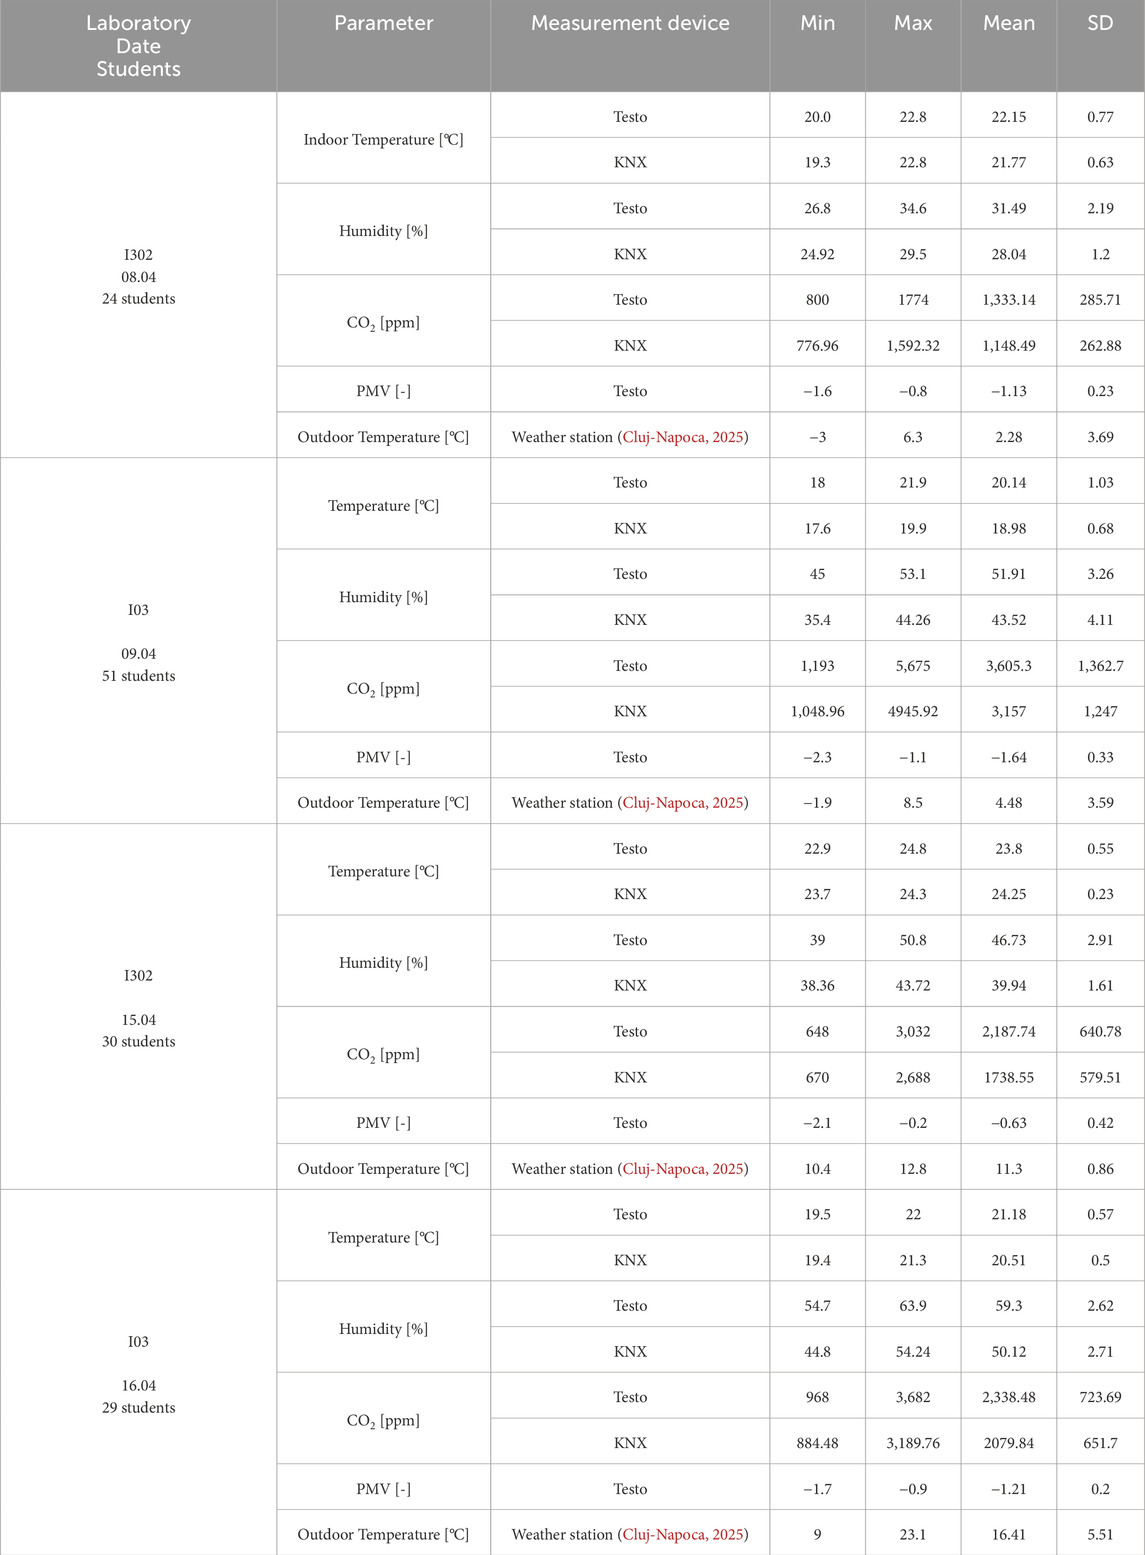
Table 2. Descriptive statistics of the measured parameters.
Across all measured parameters and locations, the Testo 400 instrument generally reports slightly higher mean values for temperature, humidity, and CO2 compared to the KNX system.
In terms of temperature, the Testo 400 shows a slightly higher mean temperature in both Laboratory I302 and Laboratory I03. While the standard deviations are relatively similar, indicating comparable variability in temperature readings from both instruments, the IoT sensors communicating via KNX protocol often shows a slightly tighter range, indicated by a smaller standard deviation in some instances. Looking at the outdoor temperature data, we see a clear warming trend as the days pass. When comparing these outdoor conditions to the indoor temperatures, we observe a few key patterns. There’s a notable stable indoor environment despite the cold outdoors. This suggests the buildings’ heating systems, regulated by the KNX system, are effectively maintaining a comfortable internal climate regardless of the cold external conditions. As the outdoor temperature increases on April 15th and 16th, the indoor temperatures also show an upward trend, though less intensity than the outdoor fluctuations.
The most notable and consistent discrepancy lies in humidity measurements. The Testo 400 reports significantly higher mean and SD humidity levels than the KNX system across all data and laboratories. For instance, in I302 on April 8th, the Testo 400 mean humidity is 12.3% higher compared to KNX’s. This difference is even more pronounced in I03, where on April 9th, the Testo 400 shows a higher mean by 19.28% than KNX reports.
For CO2 concentrations, Testo 400 records higher mean values than the KNX system. In laboratory I302 on April 8th, the Testo 400 reports a 16.07% higher mean than KNX. This pattern holds true for all other measurement periods. Despite the difference in absolute values, the standard deviations for CO2 are generally comparable between the two instruments, indicating that the relative spread of data points is similar.
The PMV values, exclusively available from the Testo 400 instrument, consistently indicate a tendency towards a cooler thermal environment, with all mean PMV values being negative. This suggests that occupants might perceive the environment as slightly cool, particularly in Laboratory I03 where temperatures were generally lower than in I302. The relatively small standard deviations for PMV suggest that the thermal comfort remained consistent within each measurement period.
The data indicates a systematic offset between the Testo 400 and KNX measurements, with the Testo 400 generally yielding higher readings. These differences likely stem from variations in sensor placement within the room. While both systems provide valuable insights, understanding these differences is crucial for accurate interpretation and for integrating data into building performance control strategies.
Figures 3, 4 provide a comprehensive visualization of the indoor temperature fluctuations in classrooms I03 and I302 respectively, capturing their dynamic thermal profiles over defined measurement durations.
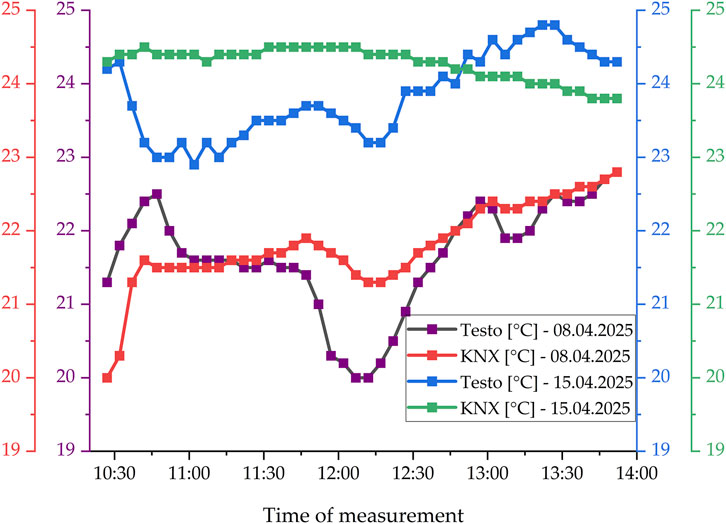
Figure 3. Indoor temperature fluctuations in Laboratory I302 over specific measurement periods.
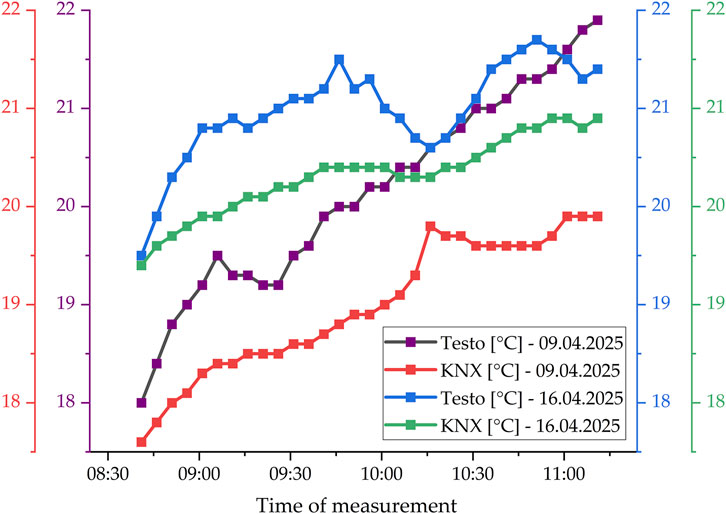
Figure 4. Indoor temperature fluctuations in Laboratory I03 over specific measurement periods.
When comparing the indoor temperature fluctuations in laboratory I302 (Figure 3) and laboratory I03 (Figure 4) over their respective measurement periods, several distinctions emerge, revealing different thermal behaviors in these two educational spaces.
Firstly, the overall temperature ranges observed are different. Classroom I302 typically experiences temperatures between approximately 19.5 °C and 25 °C, as seen in Figure 3. In contrast, classroom I03, as depicted in Figure 4, showed temperatures generally confined to a narrower and slightly cooler range of 17.6 °C–22 °C. T The low recorded temperature of 17.6 °C was likely caused by the KNX system’s failure to activate the heating system, resulting in inadequate thermal comfort. This could have been due to a system malfunction or an error in the heating schedule.
Secondly, the nature of temperature fluctuations varies between the two rooms. In laboratory I302, particularly on 8 April 2025, a notable decrease in temperature was observed by the Testo sensors around 12:00, which then increased. This rapid fluctuation can be attributed to a combination of factors. Primarily, the end of classes likely led to changes in occupancy, such as students leaving, which can significantly alter the room’s thermal load. Furthermore, the Testo instrument’s central placement within the occupied area makes it highly sensitive to immediate environmental shifts like air currents from the hallway when the doors are opened. In contrast, the KNX sensor positioned on the wall near the window is inherently less sensitive to these rapid, localized changes. Its location on a structural element might lead to a damp or delayed response compared to a sensor freely exposed to the room’s core airflow and activity. This difference in sensor placement explains why Testo sensors, being more directly immersed in the active thermal environment, capture these acute fluctuations more prominently than the wall-mounted IoT sensors. On 15 April 2025, the design room showed higher overall temperatures and significant variability, with the Testo sensors reaching close to 25 °C. Conversely, in laboratory I03, while temperatures consistently increased, the fluctuations tended to be more gradual, particularly on 16 April 2025, where both sensors generally tracked a steady rise. The initial increase in laboratory I03 on both measured days also appears more consistent and less erratic than some of the changes seen in the design room.
Finally, the consistency between the two sensors (Testo and IoT) also presents subtle differences. In classroom I302, the two sensors generally followed similar trends but often with noticeable absolute differences, especially on April 15 when Testo was consistently higher. In classroom I03, particularly on April 16, the sensors showed a strong convergence around 10:30, indicating a period where their readings were almost identical before diverging again. This suggests varying degrees of microclimatic conditions or sensor placement differences impacting localized readings within each space. These comparisons highlight that each classroom likely possesses unique thermal characteristics influenced by its structure, design, occupancy patterns, and the operation of its environmental control systems.
Figures 5, 6 illustrate the dynamic changes in CO2 emissions and IAQ within classrooms I03 and I302, respectively, throughout the specified measurement periods.
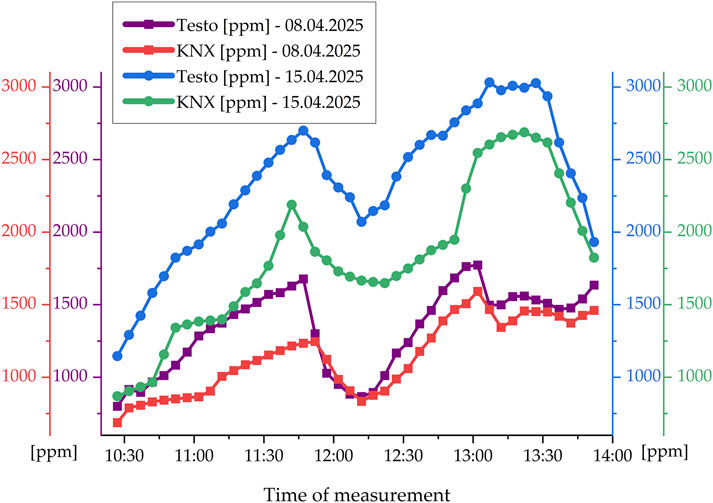
Figure 5. CO2 emissions fluctuations in Laboratory I302 over specific measurement periods.
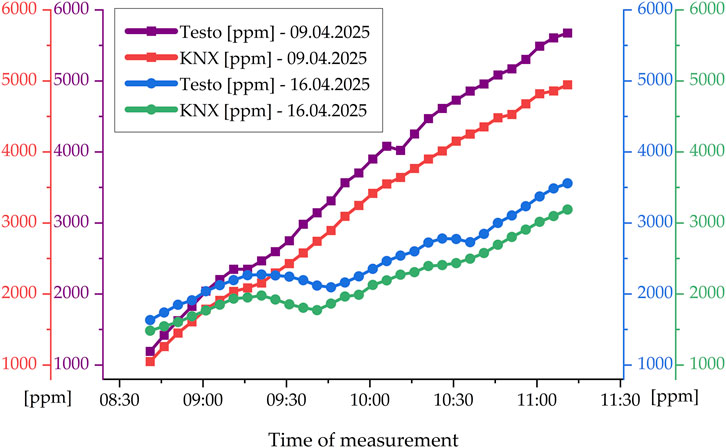
Figure 6. CO2 emissions fluctuations in Laboratory I03 over specific measurement periods.
A comparative analysis of the CO2 emission figures for laboratories I03 and I302 reveals distinct patterns in air quality dynamics and significant implications for occupant wellbeing. Both figures consistently show that the Testo measurement device records higher CO2 concentrations than the KNX system, suggesting a systematic difference in the placement within classroom of the sensors, though both effectively capture the overall trends.
Classroom I302, as depicted in Figure 5, demonstrates a more cyclical fluctuation in CO2 levels over its measurement duration. Starting relatively moderate, CO2 concentrations generally rise, peak, and then experience a noticeable decrease, before rising to a second, sometimes higher, peak. This pattern, particularly the midday decrease, is correlated with fluctuations in indoor temperature, which align with the end of classes or breaks and allow for some natural CO2 dissipation. While levels often exceed the generally recommended 1,000 ppm threshold for good IAQ, the maximum values observed, around 2,700–3,000 ppm on April 15th, indicate significant ventilation issues. These levels are associated with symptoms like drowsiness, fatigue, and poor concentration, impacting learning.
Figure 6 presents a far more alarming scenario. On both measured days, CO2 levels exhibit a continuous and dramatic upward trajectory, showing little to no significant decline or plateau within the measurement window. On April 9th, concentrations reached nearly 5,700 ppm, a level considered hygienically unacceptable and indicative of critically poor ventilation. This specific situation, which occurred only once, was a result of students needing to make up for missed classes. During this catch-up session, the presence of 51 students—a number well above the room’s capacity—combined with the closed windows led to elevated CO2 levels. This extreme, one-time scenario allowed for the collection of data that vividly illustrates the link between high occupancy, poor ventilation, and compromised indoor environmental conditions. On April 16th, when the increase is slightly less steep, CO2 levels still reach over 3,000 ppm. This sustained and extreme build-up of CO2 strongly implies a severe lack of adequate ventilation, without sufficient fresh air exchange to mitigate the CO2 produced by occupants. Such consistently high concentrations can lead to severe cognitive impairment, headaches, nausea, and general malaise, profoundly affecting the health and academic performance of students and staff.
While both classrooms exhibit issues with elevated CO2, the severity and nature of the problem differ considerably. Laboratory I302, despite reaching high CO2 levels, shows evidence of fluctuating occupancy patterns and some intermittent ventilation, though still inadequate. Laboratory I03, however, appears to suffer from a pervasive and critical lack of ventilation, leading to dangerously high and continuously rising CO2 concentrations that demand immediate and substantial intervention to ensure a healthy and conducive learning environment. The implications for classroom I03 are far more urgent and concerning due to the sheer magnitude and persistence of the elevated CO2 levels.
4.2 Qualitative assessment
The participants in our study had a mean age of 19.52 ± 0.93 years. In Figure 7, 8 the frequency of subjective votes, expressed as percentages, for various indoor environmental parameters within laboratories I302 and I03, are presented, offering a comparative insight into the occupants’ thermal, humidity, and air quality perceptions, preferences, comfort and tolerance.
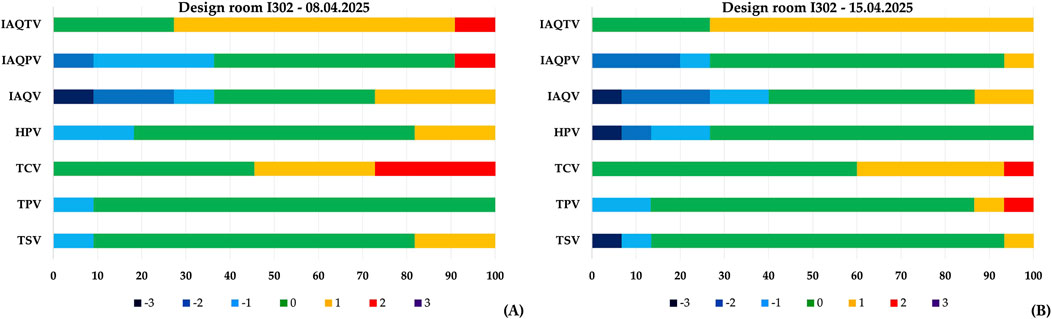
Figure 7. Frequency of subjective votes of the indoor environment parameters in Laboratory I302: (A) in 08.04.2025; (B) in 15.04.2025.
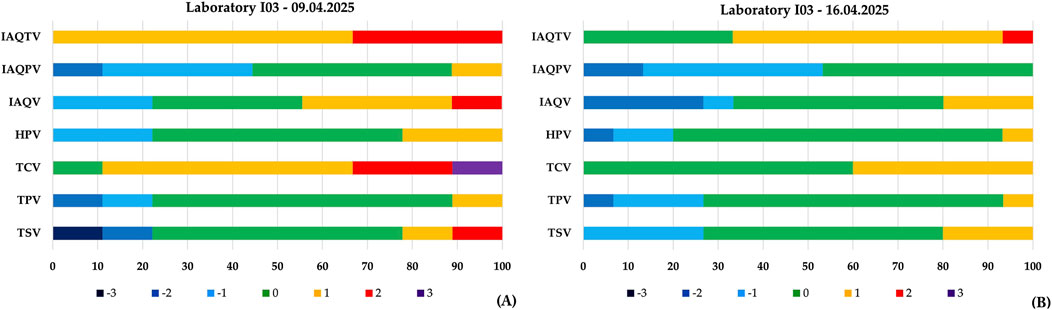
Figure 8. Frequency of subjective votes of the indoor environment parameters in Laboratory I03: (A) in 09.04.2025; (B) in 16.04.2025.
On April 8th (Figure 7A), the subjective responses reveal mixed perceptions of the indoor environment. For TSV, 72.7% of occupants found the temperature neutral while TPV showed a high 90.9% preference for “as it is”. Thermal Comfort Vote was less uniform, with 45.5% finding it comfortable. The Humidity Perception Vote registered 63.6% neutral, with 18.2% finding it slightly humid and 18.2% finding it slightly dry. Indoor Air Quality Vote scored “neutral” for 36.4% of the votes, while Indoor Air Quality Preference Vote showed 54.5% for “as it is”. The indoor Air Quality Tolerance Vote had only 27.3% in the category “perfectly breathable”, with a large 63.6% finding it “breathable”.
The data from April 15th (Figure 7B) clearly indicates a generally improved perception of IEQ in laboratory I302 compared to April 8th, particularly concerning thermal comfort. Regarding thermal sensations, a high 80% of occupants voted “neutral” for TSV, signifying a comfortable perceived temperature. Similarly, for TPV, 73.3% of votes indicated “as it is” showing a strong desire for no change. TCV also improved significantly, with 60% of the occupants finding the environment “comfortable”. HPV registered a substantial 73.3% in the “neutral” category. IAQV showed a more varied perception, with 46.7% “neutral,” but 13.3% feeling “slightly stuffy” and another 13.3% feeling “slightly fresh”. This distribution suggests a more mixed perception of air quality, with a stronger presence of “fresh” votes compared to the earlier date of April 8th. IAQPV maintained a high 66.7% “as it is” response. IAQTV presented a significant shift: a substantial 73.3% found the air “breathable”, while only 26.7% found it “perfectly breathable”.
On April 9th (Figure 8A), the TSV indicated that 55.6% of respondents felt neutral towards the thermal environment. Concurrently, the TPV showed that 66.7% of occupants preferred the environment to remain “as it is”. Regarding TCV, only 11.1% of students reported it was “very comfortable”, while a significant 55.6% felt “comfortable”. For IAQV, 33.3% of the subjects perceived the air quality as “neutral”, with 33.3% voting for “slightly stuffy” and 11.1% for “stuffy”. IAQTV showed that 66.7% of respondents found the air quality to be “ breathable” and 33.3% found it “difficult to breathe”.
Conversely, the data from April 16th (Figure 8B) demonstrates a significant shift towards more comfortable conditions. For TCV, a substantial 60% of occupants felt “very comfortable”, and the remaining 40% felt “comfortable”. For TSV, 53.3% felt neutral, 26.7% felt “slightly cool”, and 20% felt “slightly warm”, with no extreme cold or hot sensations reported. The IAQTV showed that 33.3% found the air “perfectly breathable” and 60% as “ breathable”, indicating that the tolerance of the indoor air quality was considerably closer to an ideal state compared to the previous week.
HPV showed a clear improvement in perceived neutrality, moving from 55.6% neutral on April 9 (with 22.2% preferring slightly less humid and 22.2% preferring slightly more humid) to 73.3% neutral on April 16 (with 13.3% preferring slightly less humid and 6.7% preferring slightly more humid).
Both laboratories demonstrated a marked improvement in perceived indoor environmental quality, particularly thermal comfort, from the earlier dates (April 8th/ninth) to the later dates (April 15th/16th). While the initial assessments showed mixed perceptions and some discomfort, especially concerning warmth and air stuffiness, the subsequent data indicated a significant shift towards more neutral, comfortable, and acceptable conditions across most subjective metrics. This suggests that either environmental conditions naturally improved, or effective adjustments were made to enhance occupant satisfaction in both spaces.
4.3 Correlation analysis of the indoor environmental parameters
Pearson’s correlation analysis performed on the quantitative data from laboratory I302 reveals insights into how well the IoT sensors communicate via the KNX protocol environmental measurements align with those from the professional Testo 400 monitor. The temperature readings from Testo and KNX system for 8 April 2025, show a moderately strong positive correlation of 0.539, which is highly statistically significant (p < 0.001). However, this improves markedly when considering the data from 15 April 2025, with the correlation jumping to a robust 0.741. For relative humidity, the correlation for 8 April 2025, is already strong at 0.759, becoming stronger at 0.895 for 15 April 2025, data. This indicates an excellent level of agreement between the two systems for humidity measurements across these distinct timeframes. Finally, CO2 readings demonstrate the most impressive agreement. The correlation for 8 April 2025, between Testo and KNX is very strong at 0.860 with a p-value <0.001, and this strengthens even further to 0.931 (p < 0.001) when using the 15 April 2025, data. This suggests near-perfect alignment between the two systems for CO2 measurements. The KNX system generally shows the strongest agreement with the Testo system for CO2, followed closely by relative humidity, and then temperature, especially when comparing the data from 15 April 2025. These findings are vital for understanding the KNX system’s capability as a reliable environmental monitoring tool.
Building on previous analysis, Pearson correlation was employed to the quantitative data from laboratory I03 to derive insight into the consistency between the KNX system’s environmental measurements and those from the professional Testo 400 monitor. On 9 April 2025, the agreement between the Testo and KNX systems is high across all parameters. For temperature, Pearson’s coefficient exhibits an exceptionally strong positive correlation of 0.972 (p < 0.001). Similarly, relative humidity measurements show a very strong positive correlation of 0.987. CO2 readings also demonstrate an outstanding, near-perfect positive correlation of 0.989, which is highly significant (p < 0.001). These consistently very high correlations, all significant at the p < 0.001 level, indicate that the IoT sensors integrated via KNX protocol provided measurements that aligned almost perfectly with those from the Testo 400 on this date. Moving to 16 April 2025, the strong agreement between the two systems largely persists. The correlation between temperatures is very strong, 0.891. For relative humidity, Pearson’s coefficient shows a strong positive correlation of 0.984. CO2 measurements exhibit an exceptionally strong correlation of 0.994. All these correlations are also highly statistically significant (p < 0.001), reinforcing the consistent performance of the KNX system in mirroring the Testo 400 readings on this subsequent date.
4.4 Analysis of the systematic offset
A systematic offset was observed between the KNX system and the professional Testo 400 monitor, with the Testo 400 consistently recording slightly higher values for temperature and CO2. To quantify this difference and assess the reliability of the KNX system, a comparative analysis of the error metrics was performed for laboratory I302 on April 8th and April 15th, and for laboratory I03 on April 9th and April 16th. The Mean Bias Error (MBE), Mean Absolute Error (MAE), and Root Mean Square Error (RMSE) provide a quantitative assessment of the offset and the overall accuracy of the KNX system relative to the professional instrument.
Temperature Metrics: The consistently negative MBE values indicate a systematic offset where the KNX system reported slightly lower temperatures than the Testo 400.
• I302, April 8th: MBE was −0.15 °C; MAE was 0.46 °C; RMSE was 0.66 °C.
• I302, April 15th: MBE was −0.43 °C; MAE was 0.77 °C; RMSE was 0.87 °C.
• I03, April 9th: MBE was 1.16 °C; MAE was 1.16 °C; RMSE was 1.23 °C. For this specific date, the positive MBE indicates the KNX system recorded higher temperatures.
• I03, April 16th: MBE was 0.67 °C; MAE was 0.67 °C; RMSE was 0.71 °C.
CO2 Metrics: The positive MBE values indicate that, for CO2, the Testo 400 consistently recorded higher values than the KNX system.
• I302, April 8th: MBE was 189.04 ppm; MAE was 196.32 ppm; RMSE was 237.72 ppm.
• I302, April 15th: MBE was 520.70 ppm; MAE was 520.70 ppm; RMSE was 552.25 ppm.
• I03, April 9th: MBE was 440.50 ppm; MAE was 440.50 ppm; RMSE was 473.84 ppm.
• I03, April 16th: MBE was 291.83 ppm; MAE was 291.83 ppm; RMSE was 298.32 ppm.
This offset is likely attributable to the different sensor placements: the KNX sensors are wall-mounted at a height of 1.5m, while the Testo 400 probe was placed on a tripod in the occupied area at 1.1m.
Despite the observed systematic offset, a strong positive Pearson’s correlation was found between the two systems’ measurements (e.g., up to 0.97 for temperature and 0.93 for CO2). This indicates that although the absolute values differ, the KNX system is highly reliable as a trend-monitoring tool, consistently mirroring the thermal and air quality fluctuations captured by the professional Testo 400.
4.5 Comparative analysis between quantitative and qualitative data
The Spearman’s rho correlation coefficient was employed to analyze quantitative environmental data – temperature, relative humidity and CO2 – from both the Testo 400 monitor and the KNX system, alongside subjective occupant perception data, including Thermal Sensation, Thermal Comfort Vote, Humidity Perception vote, IAQ Vote, and IAQ Tolerance. The data spans for laboratory I302, for two specific dates, 8 April 2025, and 15 April 2025.
The relationships between the objective environmental parameters and subjective occupant perceptions make the picture more nuanced. On 8 April 2025, the quantitative temperature shows a moderately negative, significant correlation with TCV (Spearman’s rho = −0.558 with p-value = 0.037) and IAQ tolerance (Spearman’s rho = −0.655 with p-value = 0.014), indicating that higher temperatures from the Testo device were associated with decreased comfort and lower IAQ tolerance among occupants. The IAQ votes and IAQ tolerance demonstrate a positive, significant correlation between them (Spearman’s rho = 0.618, p = 0.021), suggesting that occupants with a higher tolerance for poorer IAQ also tend to give more favorable IAQ votes. For humidity, neither Testo nor KNX system shows a statistically significant correlation with HPV, despite their strong objective agreement. Similar trends emerge on 15 April 2025, where most direct correlations between objective parameters and subjective votes remain weak or non-significant. IAQ vote and IAQ tolerance again exhibit a positive correlation (Spearman’s rho = 0.463, p = 0.041). However, a deeper investigation into CO2 data revealed that the specific time points when CO2 concentration exceeded the 1,200 ppm threshold for more than 5 minutes showed a near-perfect temporal alignment with the reporting of negative IAQ votes. This correspondence confirms the utility of CO2 as a predictive indicator of IAQ dissatisfaction, even where direct linear correlation with the general population of votes is weak. While the KNX system demonstrates its capability to accurately measure quantitative data, aligning well with a professional reference monitor, the direct relationship between these precise physical measurements and human subjective comfort and perception is less straightforward. The general absence of strong, consistent, and statistically significant correlations between objective environmental data and occupant votes, suggests that human comfort is a multifaceted experience influenced by more than just isolated environmental parameters.
Going further with the analysis, for laboratory I03, the correlation analysis for the quantitative and qualitative data is less direct, often lacking strong statistical significance. Regarding thermal comfort and sensation, on April 9, there are no statistically significant correlations between measured temperatures and thermal qualitative votes. However, TCV from April 9 exhibits a very strong and highly significant positive correlation with TCV from April 16 (Spearman’s rho = 0.763, p = 0.008), indicating consistent individual comfort voting across the two measurement days. HPV on April 9 shows a moderately negative, significant correlation with the humidity quantitative data from the IoT sensors communicating via KNX protocol (Spearman’s rho = −0.586, p = 0.049), implying that higher measured humidity from the KNX system was associated with lower (e.g., drier or less humid) votes on the perception scale. For IAQ vote and tolerance, on April 9, no significant correlations were found between objective parameters and subjective ones. Same as laboratory I302, IAQ votes from April 16 are strongly and significantly correlated with IAQ tolerance (Spearman’s rho = 0.593, p = 0.01). Shifting focus to CO2, the time-series comparative analysis shows a clear correspondence: timeframes marked by rapid CO2 concentration increases and sustained high levels (above 1,500 ppm) consistently coincided with the highest frequencies of negative IAQ reports. This suggests that while a fixed correlation may be weak, the dynamic quantitative fluctuation, particularly in CO2, serves as a strong temporal predictor for compromised occupant perception, validating the use of the sensor’s CO2 data as a critical, actionable indicator for dynamic IAQ control. The same conclusion as for laboratory I302 can be drawn; the KNX system consistently demonstrates excellent reliability in mirroring the objective environmental measurements of a professional monitor. However, the direct and strong links between these precise physical measurements and subjective human comfort and perception remain largely elusive in this dataset. The limited and sporadic and statistically significant correlations highlight the inherent complexity of human comfort, which is influenced by a multitude of factors beyond isolated environmental parameters, and underscore the need for larger and more comprehensive studies to fully elucidate these intricate relationships.
5 Discussion
The critical importance of adequate IEQ in university buildings stems from the considerable time students spend in classrooms, where environmental conditions profoundly impact their wellbeing, affecting cognitive performance, physical health, comfort, satisfaction, and mental health (Pantelis Adamopoulos et al., 2025; Mendell and Heath, 2005; Makaremi et al., 2024). Furthermore, the high occupant density in these spaces significantly drives fluctuations in temperature, relative humidity, and especially CO2 levels (Pulimeno et al., 2020; Catalina et al., 2024).
5.1 Benchmarking of the indoor environmental parameters versus standards
Tables 3–5 summarize the acceptable levels of carbon dioxide, temperature and humidity according to different international standards and national regulations versus our results.
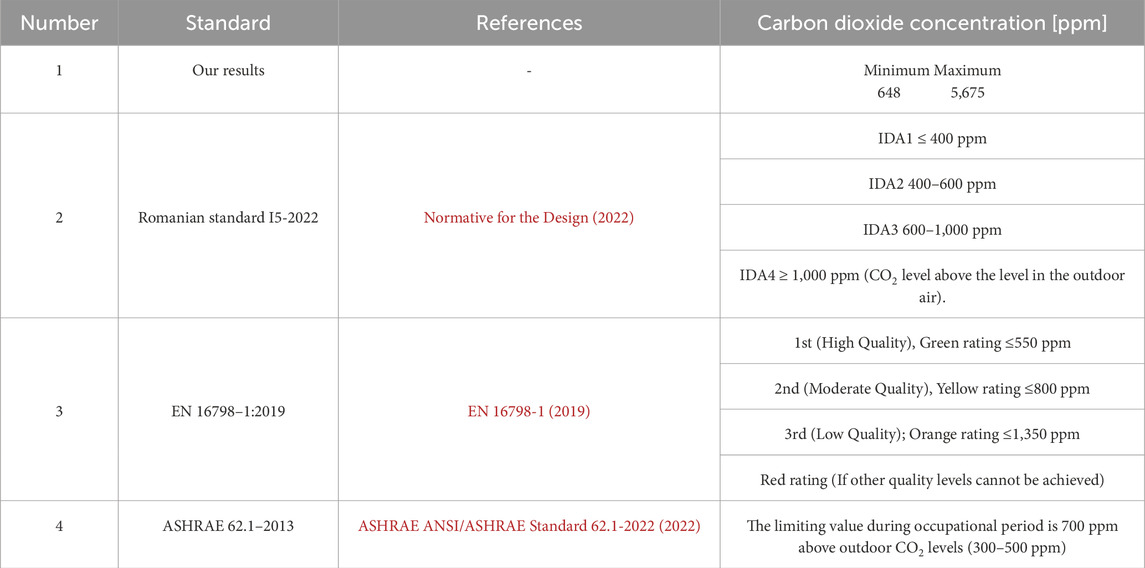
Table 3. Benchmarking of the international and Romanian standard for carbon dioxide concentrations versus our results.
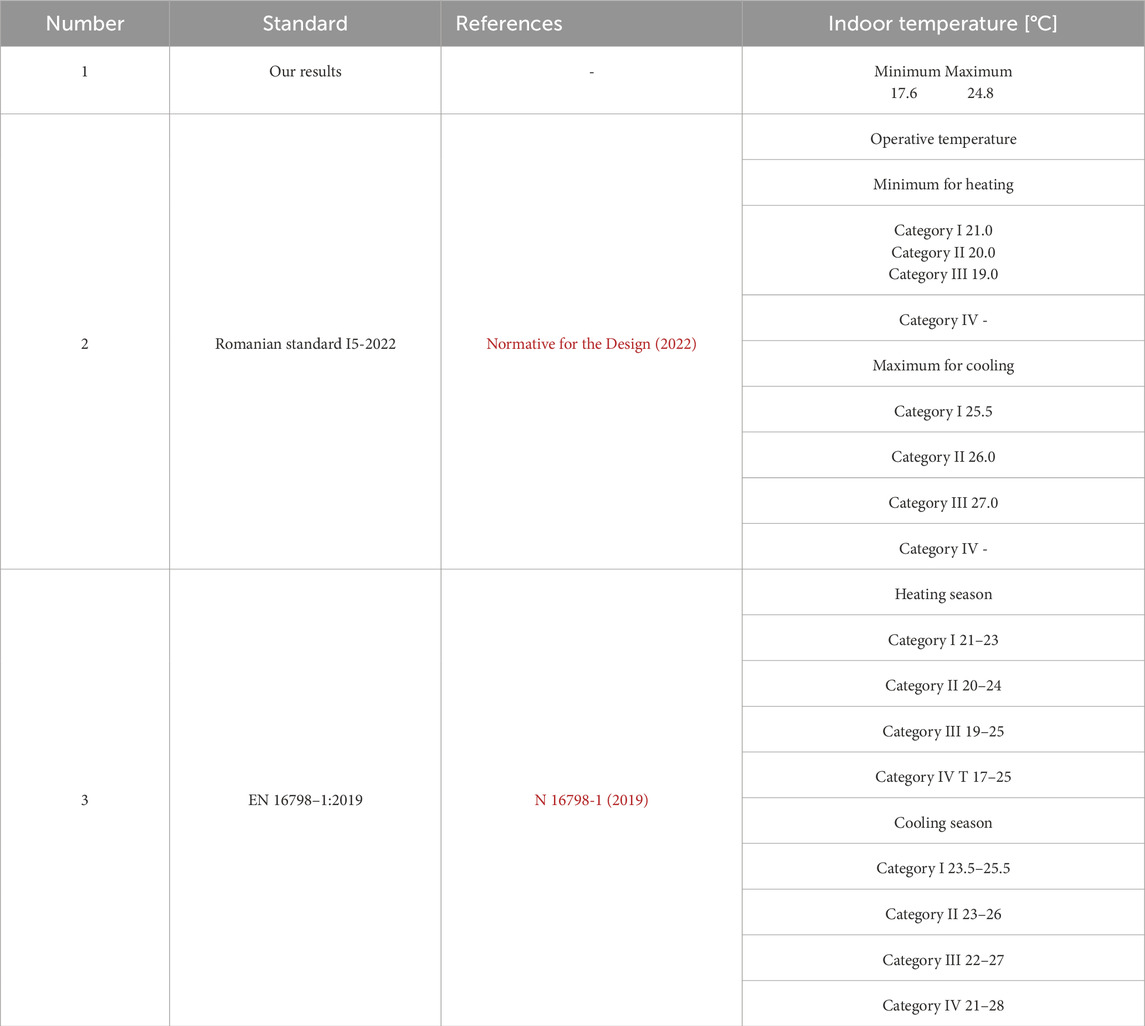
Table 4. Benchmarking of the international standards and Romanian standard for indoor temperature versus our results.
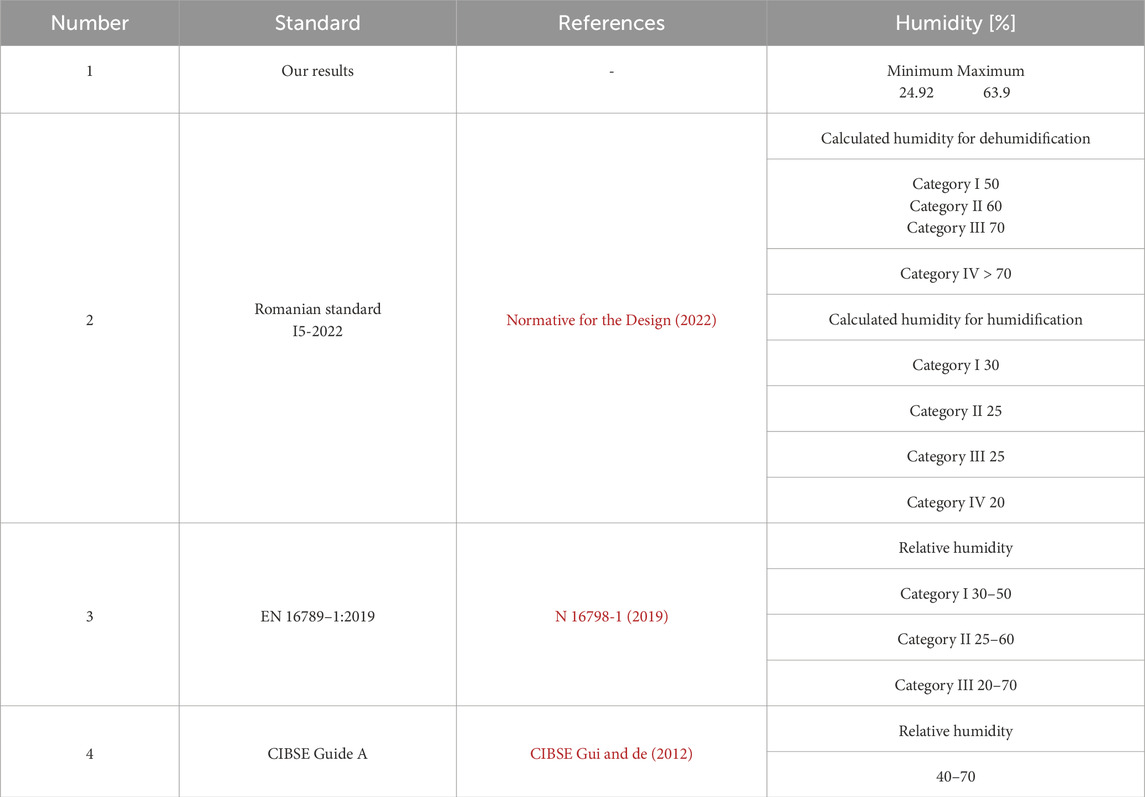
Table 5. Benchmarking of the international standards and Romanian standard for humidity values versus our results.
The results from Table 3 indicate that the carbon dioxide concentration level peaked at 5,675 ppm, exceeding the 1,000 ppm threshold by 5.6 times. According to Romanian, European, and ASHRAE standards, the evaluated classrooms should meet IDA2 or Category II performance (CO2 < 800 ppm). However, measured concentrations placed them in the IDA4 or Red zone, signaling an urgent need for improved ventilation and air quality control. These elevated CO2 levels resulted from overcrowding (51 students during a catch-up session exceeding room capacity) and closed windows during the monitoring period – clearly illustrating the impact of high occupancy and insufficient ventilation on indoor environmental conditions.
According to Table 4, indoor temperatures varied from 17.6 °C to 24.8 °C. The minimum value corresponds only to Category IV, suggesting inadequate thermal comfort during the heating season, while the maximum aligns with Category II to IV standards. For educational settings, temperatures should ideally comply with Category II to ensure acceptable comfort conditions.
Relative humidity (Table 5) ranged from 24.92% to 63.9%. The minimum and maximum values of the relative humidity fall into category III, according to the standards.
5.2 Benchmarking of the indoor environmental parameters versus results reported for higher education buildings
The establishment of an optimal microclimate required for effective learning is a central imperative across educational institutions, encompassing both foundational primary/secondary schooling and advanced higher education. This objective is shaped by a complex interplay of ambient environmental parameters, prevailing societal habits, and the distinct economic capacities inherent to individual nations.
Table 6 presents comparative analyses of indoor environmental parameters versus results reported for higher education buildings. According to the benchmarking presented in Table 6 regarding the indoor environment parameters, the values of our study for carbon dioxide, indoor temperature and relative humidity are close to the values of other studies reported for higher education buildings. Our study highlights substantial CO2 accumulation in classrooms, suggesting that natural ventilation alone is insufficient. The significant variability in ventilation performance among universities indicates it is highly context-dependent, influenced by building design, occupancy density, local climate, and occupant behavior. Comparative data, particularly from institutions with lower CO2 levels, reinforces the need for enhanced ventilation strategies, such as scheduled window opening, mechanical assistance, or demand-controlled systems.
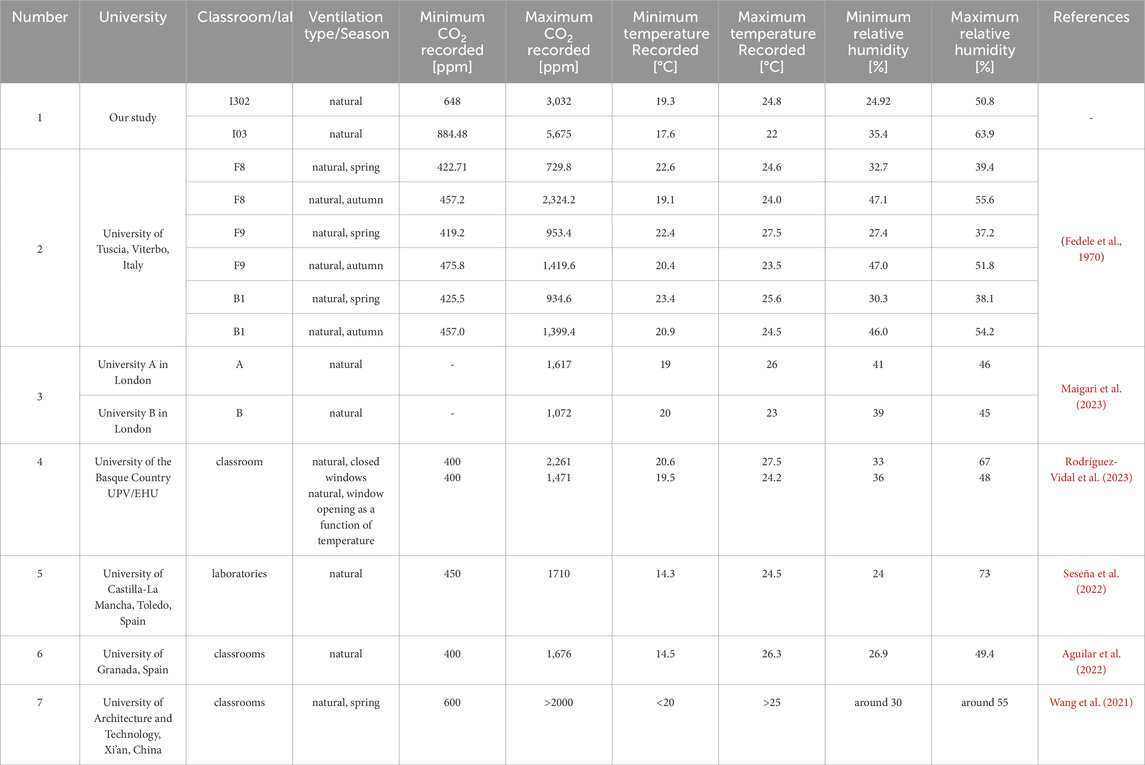
Table 6. Benchmarking of results regarding the indoor parameters reported for higher education buildings, from different international studies versus our results.
The laboratories from our study (I302 and I03) demonstrated a narrower and more stable temperature range (17.6 °C–24.8 °C) compared to the literature (Table 6), with temperatures largely confined within the recommended thermal comfort zone. While these findings suggest superior thermal stability, periods of cooler temperatures may still present comfort challenges, particularly during winter.
Relative humidity in naturally ventilated classrooms tends to fluctuate more due to external weather, window use, and occupancy patterns. According to Table 6, our study’s results show a wide range of relative humidity (24.9%–63.9%), comparable to findings in other studies, highlighting the need for improved humidity management in naturally ventilated university spaces.
While international studies on IEQ highlight a broad spectrum of conditions, a particularly insightful analysis was undertaken to compare the findings of the present study with those from other national investigations. This was prompted by the recognition that even within a single country, the application of IEQ regulatory frameworks is often inconsistent, leading to considerable variability.
A recent study by (Rus et al., 2025) investigated IEQ across various classrooms within the same educational facility, over a full academic year, before the installation of IoT sensors and KNX protocol. The study provided detailed mean values as empirical evidence of conditions in these higher education learning spaces. Findings revealed indoor air temperatures from 22.6 °C to 33 °C, relative humidity from 27.5% to 49.2%, and CO2 levels from 409 ppm to 1,372 ppm. Significant variations between classrooms underscored the necessity of tailored, evidence-based IEQ assessments for each space to accurately identify specific challenges and implement targeted strategies for creating truly optimal and conducive learning environments in educational settings.
Measurements conducted by (Stihi and Bute, 2023) in April 2022 within two distinct educational spaces – a laboratory and a seminar classroom–in a university campus building in Dambovita County, Romania, revealed that relative humidity levels ranged from 35% to 63%. This is similar to our findings, with a minimum of 24.92% and a maximum of 63.9%. Of note, CO2 concentrations varied considerably in April, ranging from a minimum of 402 ppm to a maximum of 1,233 ppm. This fluctuation in CO2 levels was directly correlated with student occupancy and the activities taking place in the classrooms, as observed in our study.
A study by (Vasile et al., 2024) in Bucharest, Romania, during October 2022, examined IAQ across various educational settings, including gymnasiums and kindergartens, under both natural and mechanical ventilation. Their findings for naturally ventilated classrooms, which align with this study’s conditions, showed CO2 concentrations ranging from 899 ppm to a peak of 2,783 ppm. All these classrooms exceeded the recommended 1,000 ppm limit, with some even surpassing 1,500 ppm, indicating insufficient ventilation and a potential health risk to occupants. The study also revealed that a heat recovery ventilation system significantly improved CO2 levels in one classroom, reducing the average from 848 ppm (peak 1,581 ppm) to 564 ppm (peak 790 ppm) after installation. These findings, corroborated by (Catalina et al., 2024), underscore the critical role of mechanical ventilation systems, particularly decentralized ones, in mitigating high CO2 concentrations driven by student occupancy and enhancing indoor air quality. This aligns with Romanian standards that mandate mechanical ventilation with heat recovery and CO2 monitoring (Normative for the Design, 2022; NP, 2022).
The findings of this study demonstrate that the designated observation classrooms (I302 and I03) effectively maintained thermal comfort within the established parameters, particularly regarding interior temperature, relative humidity, and the PMV index. Conversely, the issue of IAQ, particularly about CO2 concentration, presented a significant challenge. CO2 levels frequently surpassed the recommended threshold of 1,000 ppm, a problem that was exacerbated when student occupancy exceeded the designed capacity of 15 individuals. High occupancy directly leads to significantly elevated CO2 levels (up to +25%) (Pulimeno et al., 2020), frequently surpassing air quality guidelines. These elevated levels can negatively affect students’ concentration, cognitive performance, and overall wellbeing. This highlights the urgent need for effective ventilation systems in HEIs, particularly in crowded spaces, to create healthy and productive learning environments. The observed fluctuations in CO2 levels further emphasize the importance of continuous, and ideally multi-point, CO2 monitoring to accurately assess and manage IAQ in these ever-changing educational settings (Ge et al., 2025).
5.3 Reliability of KNX system for environmental parameter acquisition and HVAC control
For reliability in environmental parameter acquisition, the IoT sensors operating on a KNX-based automation network prove to be accurate and consistent. Pearson’s correlation analysis consistently reveals a strong alignment between KNX system and professional Testo devices. Across all measured parameters—temperature, relative humidity, and CO2—and on all observed dates (April 8th, 15th, ninth, and 16th), the correlations between Testo and KNX readings were consistently high and positive, with many reaching very strong levels. For instance, while temperature correlations were moderately strong initially on April 8th, they consistently demonstrated robust to very strong agreement on subsequent dates. Relative humidity readings showed excellent agreement throughout, with very strong correlations across all periods. CO2 measurements consistently exhibited near-perfect positive correlations, highlighting exceptional alignment between the two systems. These consistently high and statistically significant correlations (all typically at p < 0.001) underscore the KNX system’s capability as a reliable environmental monitoring tool, consistently mirroring the Testo 400 readings.
Regarding reliability in HVAC control, in the case of the educational facility the KNX integrates only actuators for heating. The subjective feedback from the participants of this study indicated that the KNX system maintained a desirable thermal environment. Despite the positive subjective feedback, the low recorded temperature on ninth of April suggests an instance where the KNX system failed to maintain the desired thermal comfort. This specific event could be attributed to several factors, such as a temporary system malfunction, a programming error in the heating schedule, or an issue with the actuators to turn on the heating system. This isolated data point highlights a potential reliability gap that warrants further investigation to ensure consistent performance.
Across the various observation dates, a significant majority of occupants consistently reported neutral thermal sensations and a strong preference for the temperature to remain “as is.” Thermal comfort votes also showed a positive trend, with a high percentage of occupants consistently feeling “comfortable” or “very comfortable” and a notable improvement in these perceptions from earlier to later dates, suggesting the system’s success in providing perceived comfortable conditions. This level of granular control contributes substantially to both occupant comfort and energy efficiency.
A key strength of KNX-based automation network for HVAC applications lies in its ability to achieve significant energy reductions. A study by Bremen University of Applied Sciences empirically demonstrated the energy-saving potential of KNX control systems in educational buildings. By comparing two identical classrooms, the KNX-equipped room achieved a 50% reduction in energy consumption for heating and lighting compared to a conventionally controlled room, providing clear evidence of its real-world efficacy (Energy Efficiency with KNX, 2006). By interconnecting HVAC with other building systems such as lighting and shading, KNX can implement sophisticated energy-saving strategies, adjusting heating or cooling based on factors like occupancy, available daylight, and external weather conditions. KNX’s flexibility allows HVAC control solutions to be custom-tailored to specific requirements and enables easy expansion or modification in the future without necessitating major overhauls, thereby safeguarding initial investments.
KNX systems go beyond cost savings, significantly improving IEQ through real-time monitoring and automated adjustments of parameters like temperature, humidity, and CO2. This directly enhances student health, cognitive function, and academic performance, mitigating “sick building syndrome” common in educational environments.
5.4 Limitation and future research
While this case study offers valuable insights into the direct relationship between sensors monitoring capacity, temperature, humidity and CO2 levels in higher education classrooms, it is essential to acknowledge several inherent limitations. These limitations not only circumscribe the generalizability of our findings but also critically inform the directions for future research.
A primary limitation of this study is the restricted dataset, which comprises observations from only two rooms, each over 2 days. This constitutes a very small sample size, making it challenging to draw broad conclusions about IEQ across diverse HEIs. Given the substantial spatial variability of CO2 concentrations both within and between classrooms, such limited data may not accurately represent overall conditions or chronic exposure levels (Ge et al., 2025). Long-term monitoring campaigns are essential for understanding chronic exposure and trends, and thus, future research should prioritize more extensive data collection.
Furthermore, the study’s findings are context-dependent and geographically specific to the Technical University of Cluj-Napoca, Romania. Institutional culture, building characteristics, local climate, and operational practices have all influenced the outcomes. As such, the results should be interpreted as valuable within this context but not directly generalizable to other universities, regions, or departments without further targeted investigation. The strength of this study lies in its exploratory nature and its detailed identification of context-specific phenomena, providing a foundation for future research rather than a generalized conclusion. Another significant limitation lies in the relatively small sample of subjective responses which significantly constrains the generalizability and statistical power of findings related to thermal sensation, comfort, humidity perception, and indoor air quality votes. This limited pool of subjective feedback means that observed correlations between environmental parameters and human comfort, or the lack thereof, may not fully represent broader occupant preferences or sensitivities. A more extensive collection of subjective responses would be necessary to draw definitive conclusions about the system’s impact on perceived occupant comfort and to establish more statistically robust links between objective environmental conditions and human experience.
Finally, a notable limitation arises from its exclusive consideration of naturally ventilated classroom environments, which restricts the generalizability of findings to HEIs utilizing mechanical ventilation systems. The observed high CO2 levels, particularly in heavily occupied rooms with 51 students, are typical of poorly ventilated spaces where natural air exchange is insufficient for the number of occupants (Pulimeno et al., 2020). Future research should broaden its scope to include comparative studies of various mechanical and hybrid ventilation systems in HEIs. This will provide a more comprehensive understanding of their effectiveness in maintaining optimal indoor air quality under diverse occupancy conditions, ultimately leading to more robust ventilation strategies.
Future research should develop a comprehensive roadmap to broaden the scope and generalizability of IEQ studies in higher education institutions. Extended and longitudinal monitoring campaigns, spanning seasons or entire academic years, are needed to capture environmental variability, chronic exposures, and robust trends for improved building system optimization. Equally important is the expansion of spatial coverage and building typologies–beyond classrooms to include libraries, lecture halls, and administrative offices, both within the Technical University of Cluj-Napoca and across other HEIs–to account for diverse operational and functional contexts. Strengthening the human-centric dimension through large-scale surveys and real-time feedback will enable statistically robust associations between objective conditions and perceived comfort or productivity. Finally, comparative studies of mechanical, natural, and hybrid ventilation systems will provide critical insights into their relative effectiveness under different climates and occupancy patterns, supporting the development of energy-efficient, health-promoting strategies applicable to a wide range of educational settings. Together, these directions aim to transform the foundational insights from this case study into a broader, more generalizable understanding of IEQ in higher education, fostering healthier and more productive learning environments.
6 Conclusion
This study aimed to evaluate the capability of wall-mounted IoT sensors integrated via KNX protocol, in monitoring indoor environmental parameters, specifically thermal comfort and IAQ, in educational facilities. A comparative approach was employed, analyzing quantitative data from the KNX system to that of a professional Testo 400 monitor, complemented by a qualitative assessment of occupant perceptions. This investigation was conducted as a case study involving two specific laboratories at the Technical University of Cluj-Napoca, Romania, and its findings are thus inherently contextual to this unique setting. The findings demonstrate that while both the Testo 400 and KNX systems generally tracked similar trends for temperature, humidity, and CO2, the Testo 400 consistently reported slightly higher mean values across all parameters. Despite these differences, Pearson’s correlation analysis consistently revealed a strong alignment between the KNX and Testo readings for all parameters, underscoring the KNX system’s reliability as an environmental monitoring tool.
The thermal subjective feedback from occupants indicated neutral sensations and a preference for the temperature to remain “as is,” with a positive trend in comfort perceptions over time, suggesting the KNX system’s effectiveness in providing perceived comfortable conditions. For IAQ, the subjective assessment revealed mixed perceptions. While some occupants reported a “neutral” air quality, a significant portion perceived the air as “slightly stuffy” or even “stuffy,” particularly in Laboratory I03 where a substantial percentage found the air “difficult to breathe”. This qualitative data aligns with the quantitative findings of frequently elevated CO2 levels.
The study also highlighted that the direct relationship between precise physical measurements and subjective human comfort is complex and less straightforward, with limited statistically significant correlations observed, suggesting that comfort is influenced by multifaceted factors beyond isolated environmental parameters.
To broaden the scope and generalizability of IEQ studies in higher education, future research must implement a comprehensive roadmap. This roadmap should encompass.
• Longitudinal monitoring: Extended campaigns across seasons/academic years to capture variability, chronic exposures, and trends for building optimization.
• Spatial and typological expansion: Broadening coverage beyond classrooms to diverse building types (libraries, lecture halls, administrative offices) within and across HEIs, addressing varied operational contexts.
• Enhanced human-centric data: Large-scale surveys and real-time feedback to establish robust associations between objective conditions and perceived comfort/productivity.
• Ventilation system comparison: Comparative studies of mechanical, natural, and hybrid systems for insights into effectiveness across climates and occupancy.
By pursuing this roadmap, future research can extend beyond the present case study to generate broadly applicable knowledge and actionable recommendations for enhancing indoor environmental quality and occupant wellbeing in educational facilities worldwide.
Data availability statement
The original contributions presented in the study are included in the article/supplementary material, further inquiries can be directed to the corresponding authors.
Author contributions
TR: Conceptualization, Funding acquisition, Investigation, Methodology, Project administration, Resources, Software, Supervision, Writing – original draft, Writing – review and editing. RM: Formal Analysis, Methodology, Resources, Validation, Writing – original draft, Writing – review and editing. CM: Conceptualization, Formal Analysis, Validation, Writing – original draft, Writing – review and editing. GC: Data curation, Formal Analysis, Investigation, Visualization, Writing – review and editing. DI-V: Conceptualization, Data curation, Investigation, Resources, Writing – original draft, Writing – review and editing.
Funding
The author(s) declare that financial support was received for the research and/or publication of this article. This research was funded by Technical University of Cluj-Napoca, through the GNaC ARUT 2023 program, grant number 22/01.07.2024 of the project “Clădiri pOzitiv eNergetic în EduCaTie – CONECT”.
Conflict of interest
The authors declare that the research was conducted in the absence of any commercial or financial relationships that could be construed as a potential conflict of interest.
Generative AI statement
The author(s) declare that Generative AI was used in the creation of this manuscript. The entire content is developed solely by the authors. Generative AI is used to improve the language and readability of the manuscript.
Any alternative text (alt text) provided alongside figures in this article has been generated by Frontiers with the support of artificial intelligence and reasonable efforts have been made to ensure accuracy, including review by the authors wherever possible. If you identify any issues, please contact us.
Publisher’s note
All claims expressed in this article are solely those of the authors and do not necessarily represent those of their affiliated organizations, or those of the publisher, the editors and the reviewers. Any product that may be evaluated in this article, or claim that may be made by its manufacturer, is not guaranteed or endorsed by the publisher.
References
Adelodun, A. A., Rezaei, M., Ardkapan, S., Jakobsen, N. N., and Johnson, M. (2024). Impact of sensor placement on indoor air quality monitoring: a comparative analysis. doi:10.26434/CHEMRXIV-2024-3D1RJ
Aguilar, A. J., de la Hoz-Torres, M. L., Ruiz, D. P., and Martínez-Aires, M. D. (2022). Monitoring and assessment of indoor environmental conditions in educational building using building information modelling methodology. Int. J. Environ. Res. Public Health 19, 13756. doi:10.3390/IJERPH192113756
Allen, J. G., and Macomber, J. D. (2020). Healthy buildings: how indoor spaces can make you Sick—Or keep you well. Harvard University Press.
Alonso, A., Suárez, R., Llanos-Jiménez, J., and Muñoz-González, C. M. (2025). Students’ thermal and indoor air quality perception in secondary schools in a mediterranean climate. Energy Build. 333, 115479. doi:10.1016/J.ENBUILD.2025.115479
Andrade, C., Stathopoulos, S., Mourato, S., Yamasaki, E. N., Paschalidou, A., Bernardo, H., et al. (2025). The role of interventions in enhancing indoor environmental quality in higher education institutions for student well-being and academic performance. Curr. Opin. Environ. Sci. Health 45, 100611. doi:10.1016/J.COESH.2025.100611
ASHRAE ANSI/ASHRAE (2023). Atlanta, United States: Thermal Environmental Conditions for Human Occupancy.
ASHRAE ANSI/ASHRAE Standard 62.1-2022 (2022). Atlanta, United States: Ventilation and acceptable indoor air quality.
ASRO SR 1907-2 (2014). “Heating systems. Calculated heat demand,” in Conventional indoor design temperatures.
ASRO SR 6648-1 (2014). “Ventilation and air conditioning systems. Calculation of external heat gains and cooling load (Sensible) for air-conditioned rooms in a building,” in Fundamental requirements.
Azizi, S., Rabiee, R., Nair, G., and Olofsson, T. (2021). Effects of positioning of multi-sensor devices on occupancy and indoor environmental monitoring in single-occupant offices. Energies 14, 6296. doi:10.3390/EN14196296
Baba, A., Shahrour, I., and Baba, M. (2022). Indoor environmental quality for comfort learning environments: case Study of Palestinian school buildings. Buildings 14, 1296. doi:10.3390/BUILDINGS14051296
Branco, P. T. B. S., Sousa, S. I. V., Dudzińska, M. R., Ruzgar, D. G., Mutlu, M., Panaras, G., et al. (2024). A review of relevant parameters for assessing indoor air quality in educational facilities. Environ. Res. 261, 119713. doi:10.1016/J.ENVRES.2024.119713
Brink, H. W., Krijnen, W. P., Loomans, M. G. L. C., Mobach, M. P., and Kort, H. S. M. (2023). Positive effects of indoor environmental conditions on students and their performance in higher education classrooms: a between-groups experiment. Sci. Total Environ. 869, 161813. doi:10.1016/J.SCITOTENV.2023.161813
Burman, E., Kimpian, J., and Mumovic, D. (2018). Building schools for the future: lessons learned from performance evaluations of five secondary schools and academies in England. Front. Built Environ. 4, 22. doi:10.3389/fbuil.2018.00022
Catalina, T., Damian, A., and Vartires, A. (2024). Study of the impact of indoor environmental quality in Romanian schools through an extensive experimental campaign. Appl. Sci. 14, 234. doi:10.3390/APP14010234
Choi, S., Guerin, D. A., Kim, H.-Y., Brigham, J. K., and Bauer, T. (2013). Indoor environmental quality of classrooms and student outcomes: a path analysis approach. J. Learn. Spaces 2 (2), 2013–2014.
Cilibiu, C., and Abrudan, A. C. (2024). Smart solutions for building energy performance: the role of artificial intelligence. Revista Romana de Inginerie Civila/Romanian J. Civ. Eng. 15, 1–6. doi:10.37789/RJCE.2024.15.1.1
Cincinelli, A., and Martellini, T. (2017). Indoor air quality and health. Int. J. Environ. Res. Public Health 14, 1286. doi:10.3390/IJERPH14111286
Ciugudeanu, C., Beu, D., and Rastei, E. (2016). Living building laboratory – educational building project in cluj-napoca. Energy Procedia 85, 125–131. doi:10.1016/J.EGYPRO.2015.12.282
Cluj-Napoca (2025). Weather History and Climate | Meteostat. Available online at: https://meteostat.net/en/place/ro/cluj-napoca?s=15120&t=2025.
Ekwevugbe, T., Brown, N., Pakka, V., and Fan, D. (2017). Improved occupancy monitoring in non-domestic buildings. Sustain Cities Soc. 30, 97–107. doi:10.1016/J.SCS.2017.01.003
EN 16798-1 (2019). “Energy performance of buildings - ventilation for buildings - part 1: indoor environmental input parameters for design and assessment of energy performance of buildings addressing indoor air quality,” in Thermal environment, lighting and acoustics (Brussels, Belgium: CEN).
Energy Efficiency with KNX (2006). Available online at: http://knxconsultants.com/wp-content/uploads/2021/02/KNXEnergyEfficiency.pdf (Accessed on July 28, 2025).
Fedele, A., Colantoni, A., Calabrò, G., Scungio, M., Rossi, S., and Taborri, J. (1970). Measuring CO2 concentration and thermal comfort in Italian university classrooms: a seasonal analysis. Sensors 25, 1970. doi:10.3390/S25071970
Fretes, G., Llurba, C., Palau, R., and Rosell-Llompart, J. (2024). Influence of particulate matter and carbon dioxide on students’ emotions in a smart classroom. Appl. Sci. 14, 11109. doi:10.3390/APP142311109
Frontczak, M., and Wargocki, P. (2011). Literature Survey on how different factors influence human comfort in indoor environments. Build. Environ. 46, 922–937. doi:10.1016/J.BUILDENV.2010.10.021
Gaihre, S., Semple, S., Miller, J., Fielding, S., and Turner, S. (2014). Classroom carbon dioxide concentration, school attendance, and educational attainment. J. Sch. Health 84, 569–574. doi:10.1111/JOSH.12183
Ge, B., Tieskens, K., Vyas, P., Botana Martinez, M. P., Yuan, Y., Walsh, K. H., et al. (2025). Decision tools for schools using continuous indoor air quality monitors: a case Study of CO2 in Boston public schools. Lancet Reg. Health - Am. 48, 101148. doi:10.1016/J.LANA.2025.101148
Grün, G. (2015). Susanne Urlaub Study report: impact of the indoor environment on learning in schools in Europe . Stuttgart.
Grün, G., and Urlaub, S. (2015). Study report_impact of the indoor environment on learning in schools in Europe.
Guevara, G., Soriano, G., and Mino-Rodriguez, I. (2021). Thermal comfort in university classrooms: an experimental Study in the tropics. Build. Environ. 187, 107430. doi:10.1016/J.BUILDENV.2020.107430
Guo, H., Lee, S. C., Chan, L. Y., and Li, W. M. (2004). Risk assessment of exposure to volatile organic compounds in different indoor environments. Environ. Res. 94, 57–66. doi:10.1016/S0013-9351(03)00035-5
Honan, D., Gallagher, J., Garvey, J., and Littlewood, J. (2024). Indoor air quality in naturally ventilated primary schools: a systematic review of the assessment and impacts of CO2 levels. Buildings 14, 4003. doi:10.3390/BUILDINGS14124003/S1
Indoor Air Quality (2016). Indoor air quality in schools. Available online at: https://www.epa.gov/iaq-schools/reference-guide-indoor-air-quality-schools (Accessed on April 2, 2025).
Indoor Air Quality (2023). National Institute of Environmental Health Sciences. Available online at: https://www.niehs.nih.gov/health/topics/agents/indoor-air (Accessed on April 2, 2025).
ISO (2012). Ergonomics of the thermal environment — instruments for measuring physical quantities. Available online at: https://www.iso.org/obp/ui/en/#iso:std:14562:en.
ISO (2014). Ergonomics of the physical environment — subjective judgement scales for assessing physical environments.
Jia, L. R., Han, J., Chen, X., Li, Q. Y., Lee, C. C., and Fung, Y. H. (2021). Interaction between thermal comfort, indoor air quality and ventilation energy consumption of educational buildings: a comprehensive review. Buildings 11, 591. doi:10.3390/buildings11120591
Kapalo, P., Domniţa, F., Bacoţiu, C., and Spodyniuk, N. (2018). The impact of carbon dioxide concentration on the human health - case Study. J. Appl. Eng. Sci. 8, 61–66. doi:10.2478/jaes-2018-0008
Kapalo, P., Mečiarová, Ľ., Vilčeková, S., Krídlová Burdová, E., Domnita, F., Bacotiu, C., et al. (2019). Investigation of CO2 production depending on physical activity of students. Int. J. Environ. Health Res. 29, 31–44. doi:10.1080/09603123.2018.1506570
Lala, B., and Hagishima, A. (2007). A review of thermal comfort in primary schools and future challenges in machine learning based prediction for children. Buildings 12, 2007. doi:10.3390/BUILDINGS12112007
Luo, M., Wang, Z., Brager, G., Cao, B., and Zhu, Y. (2018). Indoor climate experience, migration, and thermal comfort expectation in buildings. Build. Environ. 141, 262–272. doi:10.1016/J.BUILDENV.2018.05.047
Mahyuddin, N., and Essah, E. A. (2024). Spatial distribution of CO2 impact on the indoor air quality of classrooms within a university. J. Build. Eng. 89, 109246. doi:10.1016/J.JOBE.2024.109246
Maigari, M., Fu, C., Maigari, M., Fu, C., Deng, J., and Bahadori-Jahromi, A. (2023). “Indoor environmental quality Study for higher education buildings,” in Advancements in indoor environmental quality and health. University of West London Repository.
Makaremi, N., Yildirim, S., Morgan, G. T., Touchie, M. F., Jakubiec, J. A., and Robinson, J. B. (2024). Impact of classroom environment on student wellbeing in higher education: review and future directions. Build. Environ. 265, 111958. doi:10.1016/J.BUILDENV.2024.111958
Martins, A., Martins, A., Fonseca, I., Farinha, J. T., Reis, J., and Cardoso, A. J. M. (2023). Online monitoring of sensor calibration status to support condition-based maintenance. Sensors 2023, 2402. doi:10.3390/S23052402
Marzouk, M., and Atef, M. (2022). Assessment of indoor air quality in academic buildings using IoT and deep learning. Sustainability 14, 7015. doi:10.3390/SU14127015
Mendell, M. J., and Heath, G. A. (2005). Do indoor pollutants and thermal conditions in schools influence student performance? A critical review of the literature. Indoor Air J. 15, 27–52. doi:10.1111/j.1600-0668.2004.00320.x
Normative for the Design (2022). Execution and operation of ventilation and air-conditioning systems.
NP (2022). Regulations on the design, construction, and operation of buildings for schools and high schools.
Origin (2013). Data analysis and graphing. Software. Available online at: https://www.originlab.com/index.aspx?go=Products/Origin.
Pantelic, J., Nazarian, N., Miller, C., Meggers, F., Lee, J. K. W., and Licina, D. (2022). Transformational IoT sensing for air pollution and thermal exposures. Front. Built Environ. 8, 971523. doi:10.3389/fbuil.2022.971523
Pantelis Adamopoulos, I., Syrou, N. F., Mijwil, M., Thapa, P., Ali, G., and Dávid, D. (2025). Quality of indoor air in educational institutions and adverse public health in Europe: a scoping review. Electron. J. General Med. 2025, em632–3507. doi:10.29333/ejgm/15962
Park, J. S., Jee, N. Y., and Jeong, J. W. (2014). Effects of types of ventilation System on indoor particle concentrations in residential buildings. Indoor Air 24, 629–638. doi:10.1111/INA.12117
Pipattanasomporn, M., Chitalia, G., Songsiri, J., Aswakul, C., Pora, W., Suwankawin, S., et al. (2020). Smart building electricity consumption and indoor environmental sensor datasets. Sci. Data 7, 1–14. doi:10.1038/S41597-020-00582-3
Systems from the World (2023).Professional Measuring Devices + measuring Systems from the World Market Leader Testo SE and Co Available online at: https://www.testo.com/en (Accessed on 2 April 2025).
Pulimeno, M., Piscitelli, P., Colazzo, S., Colao, A., and Miani, A. (2020). Indoor air quality at school and students’ performance: recommendations of the UNESCO chair on health education and sustainable development and the Italian Society of Environmental Medicine (SIMA). Health Promot Perspect. 10, 169–174. doi:10.34172/HPP.2020.29
Rabani, M., Sønderland, S., and Rabani, M. (2025). Exploring hybrid ventilation in cold climates: energy efficiency, thermal comfort, and future climate adaptation in a NZEB case Study in Norway. Front. Built Environ. 11, 1606399. doi:10.3389/fbuil.2025.1606399
Rackes, A., Ben-David, T., and Waring, M. S. (2018). Sensor networks for routine indoor air quality monitoring in buildings: impacts of placement, accuracy, and number of sensors. Sci. Technol. Built Environ. 24, 188–197. doi:10.1080/23744731.2017.1406274
Ragazzi, M., Rada, E. C., Zanoni, S., Passamani, G., and Dalla Valle, L. (2017). Particulate matter and carbon dioxide monitoring in indoor places. Int. J. Sustain. Dev. Plan. 12, 1032–1042. doi:10.2495/SDP-V12-N6-1032-1042
Riaz, H., Riaz, A., Iqbal, A., Amina, N., and Imtiaz, S. (2025). A review on significance of thermal comfort in educational facilities. Build. Eng. 3, 2100. doi:10.59400/BE2100
Rodríguez-Vidal, I., Otaegi, J., and Armengod, U. (2023). Evaluating the feasibility of hybrid ventilation in educational spaces: a simulation Study in the Basque Country climate. Environ. Clim. Technol. 27, 532–544. doi:10.2478/RTUECT-2023-0039
Romero, P., Valero-Amaro, V., Rubio, S., and Miranda, M. T. (2024). An analysis of thermal comfort as an influencing factor on the academic performance of university students. Educ. Sci. 14, 1340. doi:10.3390/EDUCSCI14121340
Roozeboom, C. L., Hill, B. E., Hong, V. A., Ahn, C. H., Ng, E. J., Yang, Y., et al. (2015). Multifunctional integrated sensors for multiparameter monitoring applications. J. Microelectromechanical Syst. 24, 810–821. doi:10.1109/JMEMS.2014.2349894
Rus, T., Moldovan, R., Albu, H., and Beu, D. (2023). Impact of pandemic safety measures on students’ Thermal Comfort—Case Study: romania. Buildings 13, 794. doi:10.3390/BUILDINGS13030794
Rus, T., Moldovan, R.-P., Pop, M. I., and Moldovan, A.-M. (2025). Assessing the interplay of indoor environmental quality, energy use, and environmental impacts in educational buildings. Appl. Sci. 15, 3591. doi:10.3390/app15073591
Sadrizadeh, S., Yao, R., Yuan, F., Awbi, H., Bahnfleth, W., Bi, Y., et al. (2022). Indoor air quality and health in schools: a critical review for developing the roadmap for the future school environment. J. Build. Eng. 57, 104908. doi:10.1016/J.JOBE.2022.104908
Samman, S.Al, Eftekhari, M., Coakley, D., Angelopoulos, C., and Dimitriou, V. (2022).Sensor location methodology for improved IEQ monitoring in working environments.
Sánchez-Fernández, A., Coll-Aliaga, E., Lerma-Arce, V., and Lorenzo-Sáez, E. (2023). Evaluation of different natural ventilation strategies by monitoring the indoor air quality using CO2 sensors. Int. J. Environ. Res. Public Health 20, 6757. doi:10.3390/ijerph20186757
Saralegui, U., Antón, M. Á., Arbelaitz, O., and Muguerza, J. (2019). Smart meeting room usage information and prediction by modelling occupancy profiles. Sensors 19, 353. doi:10.3390/S19020353
Seseña, S., Rodríguez, A. M., and Palop, M. L. (2022). Indoor air quality analysis in naturally ventilated university training laboratories: a health risk assessment. Air Qual. Atmos. Health 15, 1817–1837. doi:10.1007/s11869-022-01220-0
Shendell, D. G., Prill, R., Fisk, W. J., Apte, M. G., Blake, D., and Faulkner, D. (2004). Associations between classroom CO2 concentrations and student attendance in Washington and Idaho. Indoor Air 14, 333–341. doi:10.1111/J.1600-0668.2004.00251.X
SREN (2002). Sisteme electronice pentru Locuințe Și clădiri (HBES). Available online at: https://magazin.asro.ro/ro/standard/274431 (accessed on July 17, 2025).
Stihi, C., and Bute, O. C. (2023). Indoor air quality monitoring in educational environments: a case Study. Rom. Rep. Phys. 75, 706. doi:10.59277/RomRepPhys.2023.75.706
Sulistiyanti, S. R., Komarudin, M., Arinto Setyawan, F. X., Septama, H. D., Yulianti, T., and Farid Ammar, M. (2024). Analyzing the impact of occupancy patterns on indoor air quality in university classrooms using a real-time monitoring System. Int. J. Adv. Comput. Sci. Appl. 15. doi:10.14569/ijacsa.2024.0151051
Valks, B., Arkesteijn, M. H., Koutamanis, A., and den Heijer, A. C. (2020). Towards a smart campus: supporting campus decisions with internet of things applications. Build. Res. Inf. 49, 1–20. doi:10.1080/09613218.2020.1784702
Vasile, V., Catalina, T., Dima, A., and Ion, M. (2024). Pollution levels in indoor school Environment—Case studies. Atmosphere 15, 399. doi:10.3390/ATMOS15040399
Vilcekova, S., Meciarova, L., Burdova, E. K., Katunska, J., Kosicanova, D., and Doroudiani, S. (2017). Indoor environmental quality of classrooms and occupants’ comfort in a special education school in Slovak Republic. Build. Environ. 120, 29–40. doi:10.1016/J.BUILDENV.2017.05.001
Waeytens, J., Durand, S., and Sadr, S. (2019). Experimental validation of a CFD-Based air quality sensor placement strategy for the localization of indoor source emissions. Build. Simul. Conf. Proc. 16, 2420–2425. doi:10.26868/25222708.2019.210177
Wang, X., Yang, L., Gao, S., Zhao, S., and Zhai, Y. (2021). Thermal comfort in naturally ventilated university classrooms: a seasonal field Study in Xi’an, China. Energy Build. 247, 111126. doi:10.1016/J.ENBUILD.2021.111126
Weyers, R., Jang-Jaccard, J., Moses, A., Wang, Y., Boulic, M., Chitty, C., et al. (2017). “Low-Cost Indoor Air Quality (IAQ) platform for healthier classrooms in New Zealand: engineering issues,” in Proceedings - 2017 4th Asia-Pacific world Congress on computer science and engineering, APWC on CSE 2017, 208–215. doi:10.1109/APWCONCSE.2017.00045
Zhang, F., Liu, S., Hu, W., and Yadav, M. (2022). Editorial: effects of indoor environmental quality on human performance and productivity. Front. Built Environ. 8, 1095443. doi:10.3389/fbuil.2022.1095443
Nomenclature
IEQ Indoor environmental quality
HEIs Higher education institutions
IAQ Indoor air quality
CO 2 Carbon dioxide
BAS Building Automation Systems
KNX Open protocol for BAS
IoT Internet of Things
HVAC Heating, ventilation and air-conditioning
PMV Predicted Mean Vote
PPD Predicted Percentage of Dissatisfied
TSV Thermal sensation vote
TPV Thermal preference vote
TCV Thermal comfort vote
HPV Humidity perception vote
IAQV Indoor air quality perception vote
IAQPV Indoor air quality preference vote
IAQTV Indoor air quality tolerance vote
SD Standard deviation
MBE Mean Bias Error
MAE Mean Absolute Error
RMSE Root Mean Square Error
Keywords: thermal comfort, indoor air quality, IoT sensors, KNX protocol, Testo 400, carbon dioxide, educational facilities, indoor environmental monitoring
Citation: Rus T, Moldovan RP, Mârza CM, Corsiuc G and Iluţiu-Varvara D-A (2025) Data-driven environments: Evaluating IoT sensors and KNX protocol for monitoring indoor conditions in educational facilities. Front. Built Environ. 11:1688582. doi: 10.3389/fbuil.2025.1688582
Received: 19 August 2025; Accepted: 22 October 2025;
Published: 12 November 2025.
Edited by:
Giuseppina Emma Puglisi, Polytechnic University of Turin, ItalyReviewed by:
Sahar Zahiri, Oxford Brookes University, United KingdomFilippos Anagnostopoulos, Institute for European Energy and Climate Policy (IEECP), Netherlands
Copyright © 2025 Rus, Moldovan, Mârza, Corsiuc and Iluţiu-Varvara. This is an open-access article distributed under the terms of the Creative Commons Attribution License (CC BY). The use, distribution or reproduction in other forums is permitted, provided the original author(s) and the copyright owner(s) are credited and that the original publication in this journal is cited, in accordance with accepted academic practice. No use, distribution or reproduction is permitted which does not comply with these terms.
*Correspondence: Raluca Paula Moldovan, cmFsdWNhLm1vbGRvdmFuQGluc3RhLnV0Y2x1ai5ybw==; Dana-Adriana Iluţiu-Varvara, ZGFuYS5hZHJpYW5hLnZhcnZhcmFAaW5zdGEudXRjbHVqLnJv