 Qing Wan
 Mengyu Guo
 Fangjie Pan
- School of Management, Wuhan Institute of Technology, Wuhan, China
Urban ecological resilience plays an important role in enhancing the ability of urban areas to cope with environmental change and promote sustainable development. On the basis of the panel data of 277 prefecture-level cities in China from 2009 to 2023, a comprehensive evaluation index system of the development level of urban ecological resilience is constructed in this paper. This index system uses three dimensions: resistance, resilience, and adaptability. The criteria importance through intercriteria correlation (CRITIC) weighting method is employed to measure the development level of urban ecological resilience in China, and the Gini coefficient two-dimensional decomposition method is used to analyse the spatial gap and source structure of the development level of urban ecological resilience in China. The study finds that: (1) The overall gap in the development level of urban ecological resilience in China is generally decreasing, with resistance making the greatest contribution to this decrease. (2) The disparity in the development level of urban ecological resilience across China generally tends to decrease; with the exception of the northeastern region, the development level gap of ecological resilience in the eastern, central and western regions has narrowed. (3) From a regional perspective, the interregional gap is the main source of the overall gap. In terms of indicator composition, the resistance gap is the primary contributor to the overall disparity. Considering both regional and indicator compositions, the main source of the overall gap has shifted from the resistance gap between the eastern and western regions to the adaptability gap between the central and western regions.
1 Introduction
Global urbanisation is advancing at an unprecedented rate. As the main centre of human economic and social activities, cities drive prosperity but also profoundly reshape and are highly dependent on the natural ecosystems upon which they survive. The agglomeration of population and industry occupies more natural ecological space, inevitably leading to increased resource consumption and a series of ecological pressures, such as environmental pollution, causing serious disturbances to the local ecosystem (Wang S. J. et al., 2023). Simultaneously, global climate change has led to a surge in the frequency and intensity of extreme weather events, posing a severe threat to urban safety, and urban vulnerability is becoming increasingly prominent under multiple shocks. Under the dual pressure of the accelerating evolution of global climate change and the continued deepening of the “dual carbon” strategy, Chinese urban ecosystems are facing severe challenges because of increasingly strained resources and a diminished environmental carrying capacity. The Central Urban Work Conference held in July 2025 saw the first proposal for building a “Modernized People-Centred City”, clarifying six major directions, “innovation, liveability, beauty, resilience, civilisation, and intelligence” and emphasising that urban development should shift from “Incremental Expansion” to “Stock Quality Enhancement and Efficiency Improvement”. Urban ecological resilience refers to the comprehensive ability of an urban ecosystem to maintain the stability of its core functions through self-regulation, adaptation, and resilience when facing natural disasters, climate change, environmental pollution, and other external disturbances and to promote its own transformation towards a more sustainable state. As a key support for cities in coping with environmental risks and promoting green transformation, the construction of urban ecological resilience has become an important component of urban planning and governance and a powerful complement to sustainable urbanisation (Chen J. H. et al., 2023). However, in reality, significant differences exist across different regions of China in terms of ecological background conditions, environmental governance capacity, and green technology innovation. Consequently, this directly results in an uneven spatial distribution of urban ecological resilience, resulting in spatial differentiation characteristics. Therefore, scientifically assessing the evolutionary trend and spatial characteristics of urban ecological resilience is urgently needed to provide a reference for identifying shortcomings in resilience construction and promoting balanced resilience development.
This study quantitatively evaluates the urban ecological resilience in China by constructing a comprehensive indicator system and applying the criteria importance through intercriteria correlation (CRITIC) weighting method. We further investigate spatial disparities in urban ecological resilience using the Gini coefficient two-dimensional decomposition method, which separates overall inequality into regional distribution dimension and indicator composition dimension. The analysis reveals both the overall level and heterogeneity of urban ecological resilience, offering deeper insights into the spatial and structural sources in shaping these differences. Ultimately, this research provides a solid scientific foundation for promoting balanced urban ecological development in China and guiding differentiated policy interventions.
2 Literature review
In the compound scenario of global environmental change intertwined with rapid urbanisation, urban ecological resilience, as a core capability for urban sustainable development, is undergoing a process of dynamic deepening and continuous construction in its theoretical understanding. Academic research into the spatial distribution of urban ecological resilience mainly covers the following aspects:
First, the conceptual definition of resilience. “Resilience” was initially a concept in physics, describing the ability of a system to return to its original state after disturbance. With continued urbanisation, Holling introduced this concept to the field of ecology, which refers to the ability of an ecosystem to maintain a stable state and adapt quickly when subjected to external shocks or disturbances (Holling, 1973). A clear evolutionary context exists within the connotation of resilience theory: it developed from “engineering resilience” to “ecological resilience” and finally evolved into “evolutionary resilience”. Its theoretical basis has also shifted from static equilibrium theory to dynamic evolutionary theory. According to equilibrium theory, urban ecological resilience is the characteristic of an ecosystem that allows it to maintain its shock resistance before a perturbation and to restore its original steady state when a perturbation occurs (Yi and Jackson, 2021). The evolutionary theory perspective, however, emphasises that urban ecological resilience is an inherent attribute of an ecosystem, incorporating the prevention mechanism before a perturbation, the rapid response mechanism after a perturbation, and continuous innovation adaptability (Balland and Rigby, 2017; Boschma, 2014).
Second, the measurement and analysis of resilience are considered. Comprehensive evaluation methods are often employed by scholars to conduct multifaceted quantitative assessments of urban ecological resilience. Economic resilience and ecological resilience have been measured by scholars such as Hu et al. (2025) in three dimensions: “resistance–absorption–renewal capacity”. To examine the complex interactions between social, ecological and technological systems in urban environments, Cheng (2025) constructed the “social–ecological–technological” (S–E–T) framework. An ecological resilience assessment system was constructed by Li et al. (2023) from three dimensions: environmental pollution generation, environmental pollution control, and ecological security. The “pressure–state–response” (PSR) model, recognised by the academic community and usable as an assessment framework, was constructed as an evaluation system by Chao et al. (Chao et al., 2024; Wang et al., 2023; Wang Y. X. et al., 2022). With respect to the use of quantitative models, the entropy weight method was employed by Lee et al. (2024) to evaluate the ecological resilience of the urban agglomeration in the middle reaches of the Yangtze River, thereby analysing its temporal and spatial evolutionary pattern. Jiao et al. (2023) used a GA-BP neural network to measure pressure resilience, state resilience and response resilience and determined the comprehensive development level of urban resilience. Ramadan et al. (2025) systematically assessed the impact of physical and social factors on urban flood vulnerability through an analytic hierarchy process. In addition, the entropy weight TOPSIS method (Lan et al., 2025), principal component analysis (Gilgur and Marquez, 2025), and other methods have been employed to comprehensively evaluate the overall development level of resilience. However, these conventional weighting methods have notable limitations. The entropy weight method, for instance, relies solely on the dispersion degree of indicators, ignoring any potential correlation among them. This could lead to the under-estimate of weights for highly correlated yet practically important indicators and thus distorte the comprehensive evaluation results. Conversely, subjective weighting methods, such as the Analytic Hierarchy Process (AHP), incorporate expert experience but inevitably remain constrained by the experience and preferences of the decision-makers. This raises concerns regarding the universality and objectivity of their results. Therefore, existing research requires refinement to more comprehensively and objectively capturing the informational content of indicators.
Third, spatial differences exist. The traditional Gini coefficient and Dagum Gini coefficient have mostly been used in existing studies to analyse regional inequality and the sources of differences in resilience. Jia et al. (2025) examined regional differences in the resilience of China’s manufacturing industry chain and reported that the resilience of the industrial chain decreased in the following order: the eastern region, the central region, the western region, and the northeastern region. Cheng (2025) reported that intraregional disparity is the main source of inequality in urban ecological resilience, with the eastern region exhibiting the most significant differences. Yang et al. (2024) reported that spatial inequality in urban green resilience in China has decreased, with green resilience in the eastern, central, and western regions showing a converging trend. Despite the success of these methodologies in elucidating the sources of variation across geographical latitudes, they share a fundamental limitation: the inability to identify the structural causes of these disparities. While interregional disparities are a well-documented phenomenon, the specific constituent indicators that drive such imbalances remain insufficiently identified. This methodological constraint hinders deeper insights into the intrinsic composition of resilience gaps, thereby compromising the precision of policy formulation.
In summary, there is a critical methodological gap in the measurement of ecological resilience: the lack of an objective weighting approach that can capture the volatility of indicator data and the intrinsic correlations among indicators simultaneously. Addressing this gap would facilitate the development of a more robust and rational comprehensive evaluation system. Furthermore, within the field of differential analysis, there exists an urgent need for a framework that is capable of decomposing overall disparities in both spatial and indicator-structural dimensions. Implementing such a framework would enable variations to be identified at specific spatial scales while simultaneously allowing the key indicator-level factors underpinning these variations to be analysed. In view of the identified methodological deficiencies identified, the study’s contributions can be categorised into two distinct aspects. Firstly, in terms of data objectivity, the CRITIC weighting method is applied to evaluate the development level of urban ecological resilience, considering both the contrast intensity and correlation of the indicators, thereby providing a more comprehensive reflection of the independent information content of the indicators. Secondly, in contrast to the traditional Gini coefficient method and the Dagum Gini coefficient method, the Gini coefficient two-dimensional decomposition method is employed in this paper to simultaneously capture the sources of differences in both regional and indicator composition dimensions. The contributions of the interactions between regional and indicator compositions to these differences are precisely identified, and the spatial gap and source structure of China’s urban ecological resilience development level are explored. This provides theoretical support and practical guidance for the construction and development of resilient cities. Figure 1 illustrates the research approach of this paper.
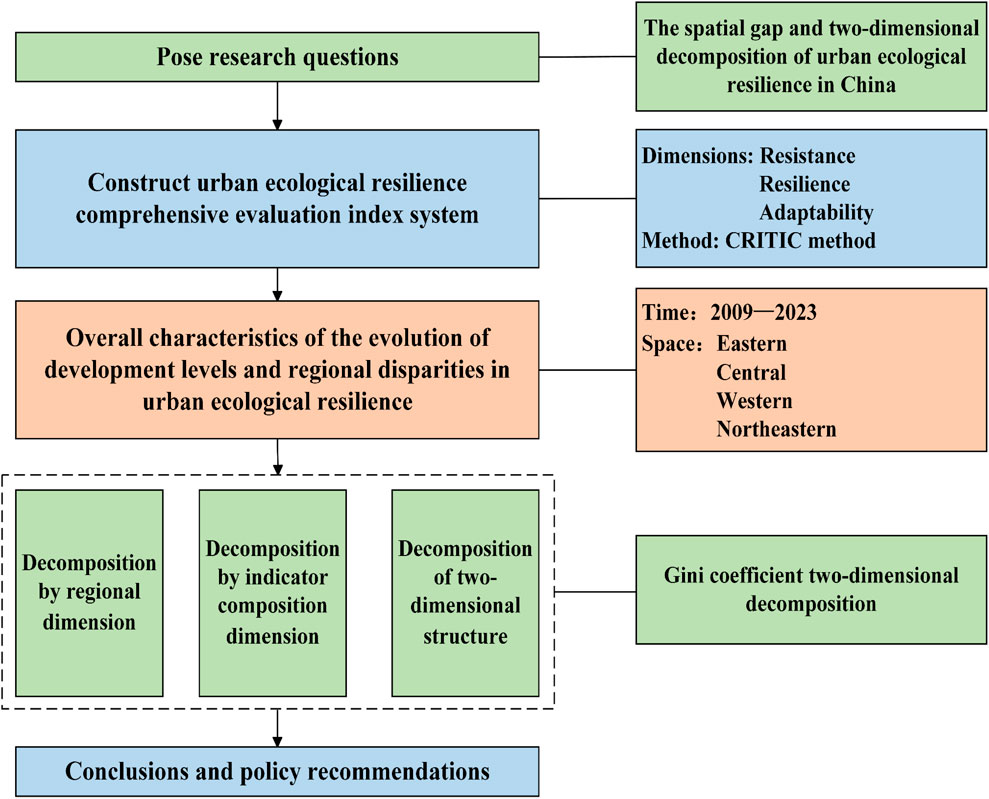
Figure 1. Research framework.
3 Research design
3.1 Research methods
3.1.1 CRITIC method
The CRITIC method is an objective weighting method that determines weights by comprehensively considering the contrast intensity between indicator categories and the conflict between indicators (Diakoulaki et al., 1995). Contrast intensity reflects the degree of dispersion of values of different categories under the same indicator and is usually represented by the standard deviation. The larger the standard deviation is, the more significant the difference between categories, and the richer the information content carried by the indicator. Conflict is measured on the basis of the correlation between indicators. The stronger the negative correlation between two indicators is, the greater the conflict, which means the greater the differentiation of information provided in the evaluation results, and the greater the weight assigned. This method can reflect not only the degree of dispersion of the indicator data but also the correlation between indicators and is suitable for complex weight allocation problems in comprehensive multi-indicator evaluation of urban ecological resilience. The CRITIC method weight calculation steps are as follows:
Firstly, carry out data standardisation.
For positive indicators:
For negative indicators:
Then, calculate the standard deviation
Next, calculate the correlation coefficient matrix
Computational conflict
Calculate information content
Finally, CRITIC weights obtained by normalisation:
3.1.2 Gini coefficient two-dimensional decomposition method
As a key indicator for measuring economic inequality, the Gini coefficient has been widely used in related studies. The Dagum Gini coefficient decomposition method analyses the sources of regional disparities in depth by decomposing the overall difference into intraregional disparity, interregional disparity, and hypervariable density. The Gini coefficient two-dimensional decomposition method outperforms the traditional Dagum Gini coefficient decomposition method by not only subdividing the interregional gap between two regions but also deconstructing the analysis on the basis of structural sources. The former is called spatial source decomposition, and the latter is called structural source decomposition. These two interconnected decomposition dimensions are integrated to more accurately identify the root causes of overall inequality and its subcomponents and to quantify the contributions of various sources to intraregional and interregional inequality components. This paper explores the spatial gap in urban ecological resilience from the dual dimensions of region and index composition. The formula for China’s urban ecological resilience Gini coefficient is as follows:
Given a sample population
Given that China’s urban ecological resilience is divided into
The following is a breakdown of
Let
Equation 11 shows that the Gini coefficient is decomposed into
where
Combining Equations 11, 12, the Gini coefficient’s two-dimensional decomposition can be expressed as follows:
3.2 Research data
3.2.1 Indicator system construction
The concept of resilience encompasses three core dimensions: first, the ability of a system to absorb and buffer external disturbance before structural change occurs; second, the ability of a system to self-reorganise and achieve transformation during perturbation; and, finally, the ability of a system to maintain its own survival in the face of sustained external pressure (Zhang et al., 2016). The construction of ecological resilience is a dynamic evolutionary process involving evolutionary stages such as shock resistance, system matching, and adaptive regulation. To comprehensively evaluate the construction level of urban ecological resilience, in this study, with reference to the research of relevant scholars (Liang and Xue, 2025; Zhao and Sun, 2023; Peng and Cao, 2023; Chen N. et al., 2023), an overall evaluation framework of urban ecological resilience is constructed from the perspective of the basic characteristics of ecological resilience (resistance, resilience, and adaptability). Specific proxy variable selections are shown in Table 1.
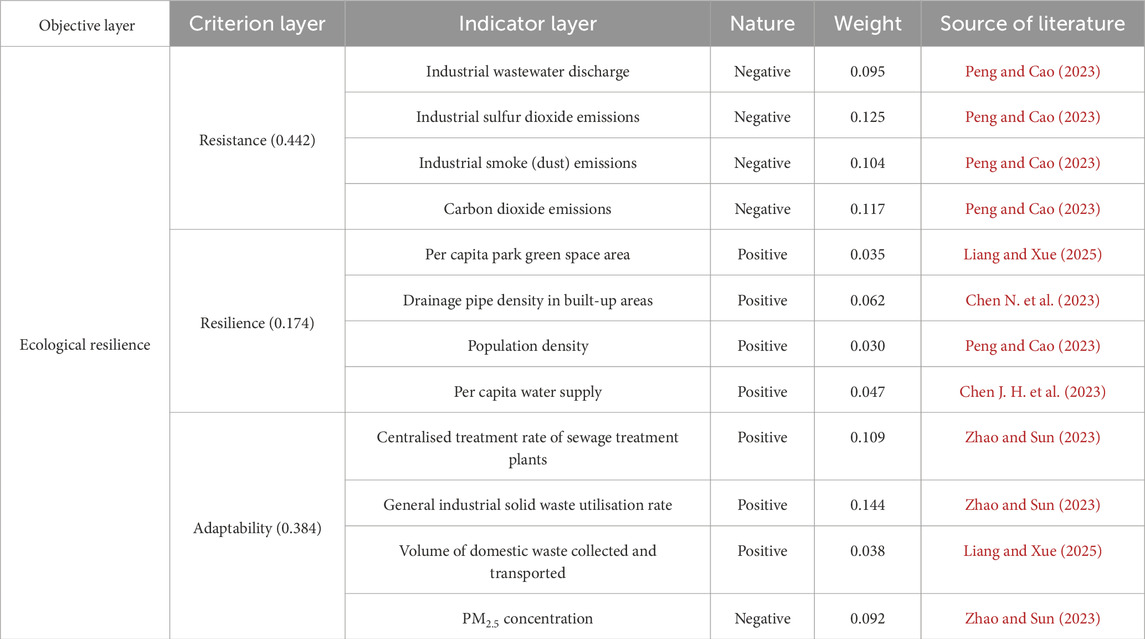
Table 1. Ecological resilience comprehensive evaluation index system.
The resistance dimension index primarily reflects the environmental pressure load borne by the urban ecosystem. The greater the load is, the more difficult it becomes for the system to maintain its original state, indicating a weaker resistance. Industrial wastewater discharge, industrial sulfur dioxide emissions, industrial smoke (dust) emissions, and carbon dioxide emissions are all negative indicators within the resistance dimension. High emissions are correlated with weak resistance, thereby increasing a city’s vulnerability when it is confronted with a disturbance.
The resilience dimension indicators primarily reflect a city’s infrastructure, natural resource buffer, and basic service guarantee capacity. Green space serves as a vital component of a city’s ecological infrastructure and “lungs”. Sufficient green space aids the ecosystem in recovering and stabilising more rapidly, thereby enhancing the natural basis for ecological recovery. Drainage systems are key engineering facilities that enable cities to cope with urban flood disasters; a high-density drainage network signifies an enhanced capacity for rainwater collection, transportation, and discharge. This, in turn, can effectively reduce the scope, depth, and duration of urban waterlogging and accelerate postdisaster drainage and urban function recovery. A higher population density implies more efficient infrastructure utilisation and a closer social network; as Zhang et al. reported (Zhang et al., 2016), urban resilience levels remain stable at a high level of resilience when the urban population maintains moderate growth. The per capita water supply reflects the capacity of the urban water supply system and the level of water resource security and is the most basic need for postdisaster recovery. It follows that cities with a high per capita water supply exhibit better social and ecological system resilience.
The adaptability dimension indicators primarily reflect a city’s capabilities in environmental governance, resource recycling, and addressing emerging environmental issues. The centralised treatment rate of sewage treatment plants, along with the comprehensive utilisation rate of general industrial solid waste, directly reflects a city’s proactive management capabilities and the level of technological application when confronting ecosystem problems. The higher these values are, the more effectively the city’s environmental problems are alleviated, and the stronger its adaptability. The volume of domestic waste collected and transported reflects the coverage of the urban waste collection system and its basic service capacity. A high collection and transportation volume indicates that the city has established a standardised waste collection network, thereby strengthening its ability to block pollution diffusion and respond to sudden environmental pressures. The concentration of PM2.5 is a complex type of air pollutant, and its level comprehensively reflects urban atmospheric environmental quality and the effectiveness of long-term governance. It serves as a key indicator for measuring a city’s ability to cope with complex air pollution problems, adjust strategies, and achieve positive outcomes. The lower the concentration is, the stronger the city’s adaptability.
3.2.2 Research area
To ensure that the analysis results are more universal and representative and to avoid skewing the overall conclusions because of the special administrative status and economic scale of municipalities directly under the central government, the data used in this paper exclude four such municipalities: Beijing, Tianjin, Shanghai and Chongqing. Furthermore, Tibet is excluded because of severely incomplete data. This paper focuses on panel data from 2009 to 2023 for 277 prefecture-level cities in China. These cities are divided into four major sections—eastern, central, western and northeastern—according to the regional division standards of the National Bureau of Statistics to explore the evolutionary trend and spatial differentiation characteristics of urban ecological resilience in different regions. The samples cover the main cities in each section, thus laying a foundation for regional comparative analysis. The specific regional division is shown in Table 2. To illustrate the spatial distribution of the samples covered by this study clearly, a map of the sample cities has been produced (Figure 2). The four major regions are distinguished using a colour-coded legend.
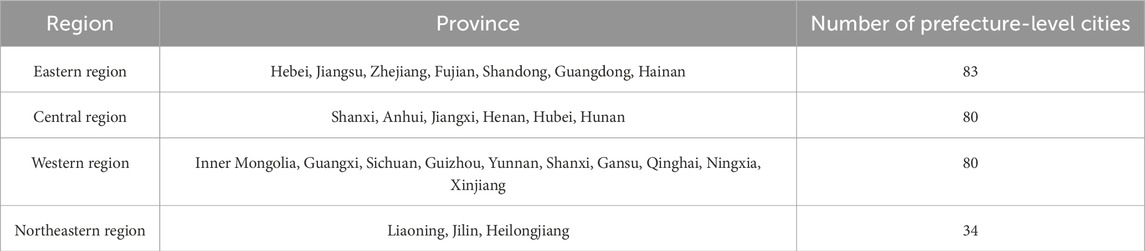
Table 2. Regionalisation.
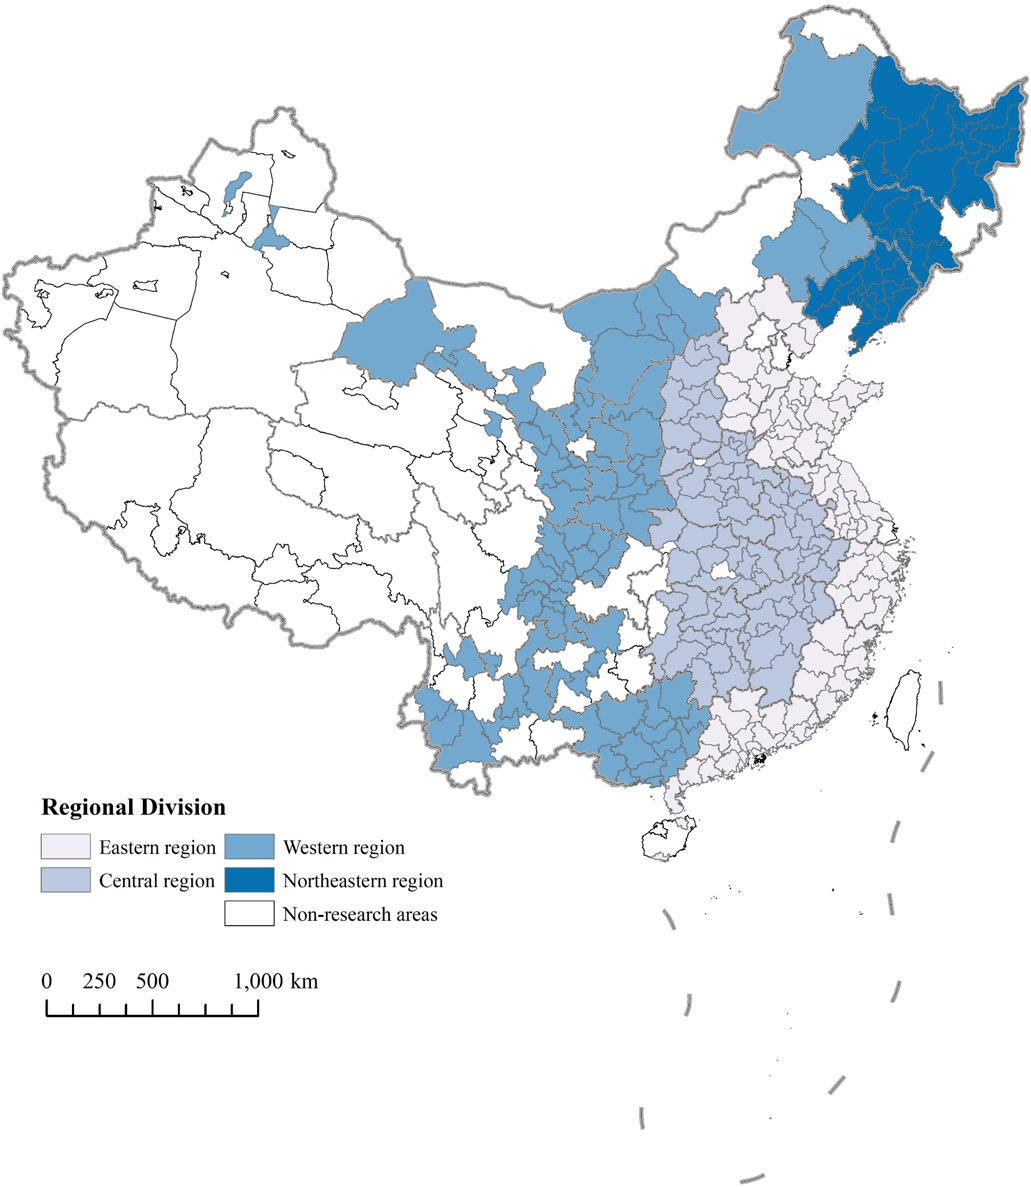
Figure 2. Spatial distribution map of sample cities.
3.2.3 Data source
The data for this study are primarily derived from the “China City Statistical Yearbook” and the “China Urban Construction Statistical Yearbook”, supplemented by the annual statistical yearbooks and government statistical bulletins of relevant cities. During data collation, we employed linear interpolation to address missing values for specific years.
4 Results
4.1 Overall characteristics of urban ecological resilience evolution
The measurement results of urban ecological resilience are shown in Table 3 and Figure 3A. Overall, from 2009 to 2023, the national ecological resilience index fluctuated from 0.566 to 0.658, demonstrating an overall upwards trend. This fully reflects the effective improvement in China’s urban ecological resilience under a mechanism of systematic attention, comprehensive management and long-term maintenance. In terms of the growth rate, the development level of China’s urban ecological resilience mostly maintained a positive growth rate during the sample period, with an average annual growth rate of 1.10%, indicating a steady and positive trend for China’s urban ecological resilience. As shown in Figure 3B, when viewed from the perspective of the four major regions, the level of urban ecological resilience clearly has tended to increase across different regions, although disparities exist in the level of urban ecological resilience across these regions. The urban ecological resilience in the eastern region increased by 14.8% from 2009 to 2023 and significantly fluctuated before 2017 but has stabilised thereafter. The central and western regions experienced the greatest and second-largest increases, respectively, with urban ecological resilience remaining at a high level during the later period. The northeastern region’s urban ecological resilience consistently ranked lowest overall, with its growth rate slowing markedly after 2017.
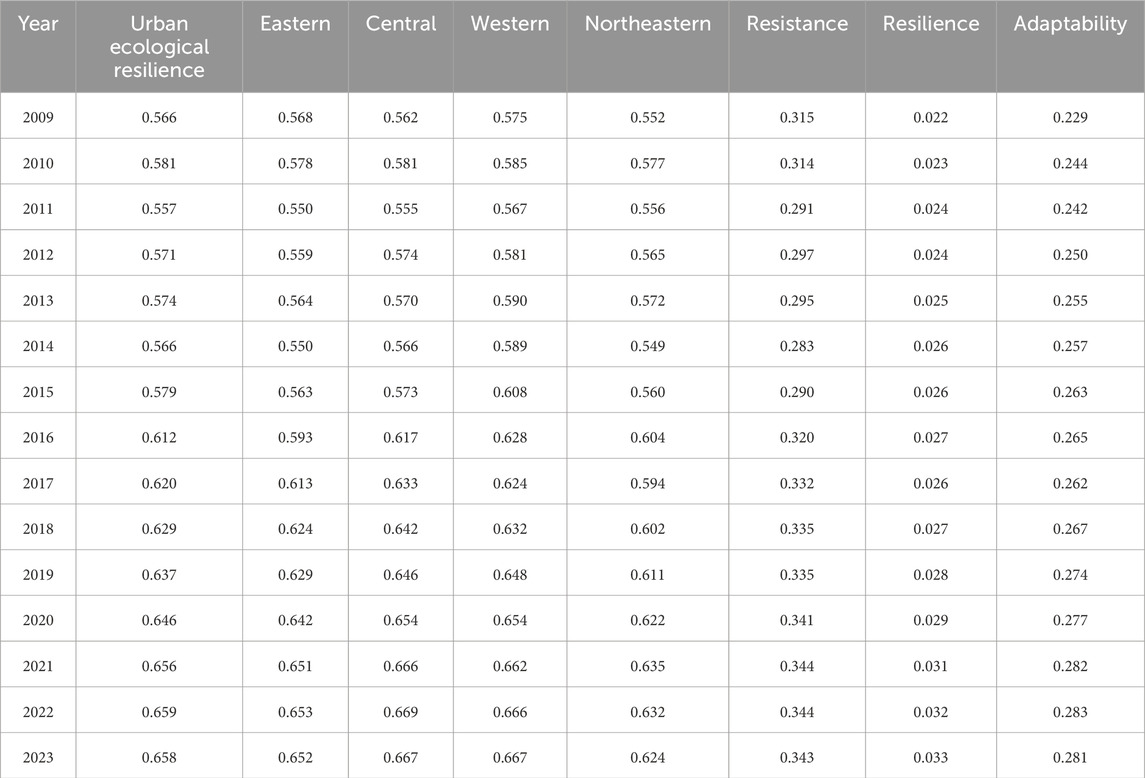
Table 3. Mean urban ecological resilience.
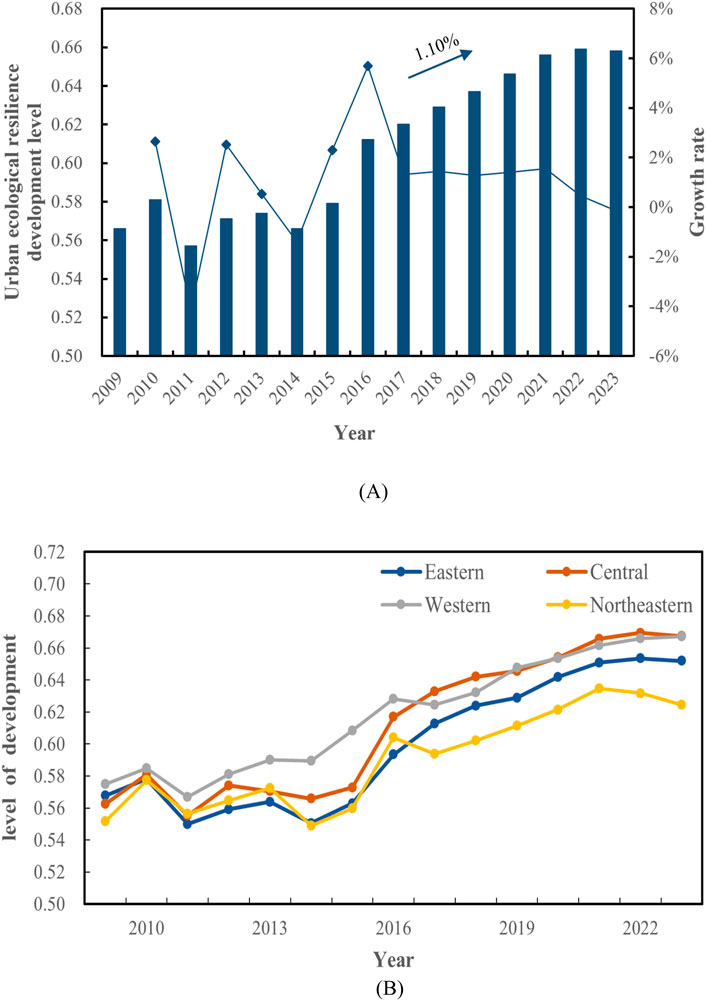
Figure 3. Development level of urban ecological resilience in China. (A) Illustrates the overall evolution trend of urban ecological resilience; (B) depicts the development levels of urban ecological resilience across the four major regions.
Furthermore, the ecological resilience of cities in eastern China is found to be significantly lower than that of cities in the central and western regions. The following three points provide a concise overview of the underlying reasons underlying this phenomenon. Firstly, disparities in the intensity of pressure sources. The eastern region of China is characterised by its status. As the most densely populated, urbanized and economically developed area in the country, the eastern region experiences greater ecological and environmental pressures due to intensive land use, traffic congestion, pollutant emissions, and high energy consumption. Ecological resilience is not a static attribute, but rather a relative capacity to withstand disturbances. Despite increased investment in environmental governance, systemic pressures in the east exceed those in other regions, weakening resistance, resilience and adaptability across the entire urban system. Secondly, systemic vulnerability is more pronounced in the eastern regions. Intensive development in the eastern region has led to significant encroachment upon and fragmentation of natural ecological elements, including farmland, green spaces, and water bodies, posing a detrimental effect on ecosystem integrity and connectivity. The process of “ecological fragmentation” has been demonstrated to increase the vulnerability and sensitivity of urban systems, rendering them more susceptible to imbalances when exposed to disturbance. By contrast, many cities in the central and western regions, though less economically developed, often have more continuous and intact natural landscapes, such as forests, mountains and rivers. These provide greater inherent stability and buffering capacity, thus forming a stronger basis for ecological resilience. Thirdly, the relative nature of the assessment framework shall be acknowledged. It is argued that the evaluation system tends to emphasize the relationship between ecological load and carrying capacity in “per capita”. On this basis, eastern cities demonstrate substandard performance with regard to a number of key indicators, such as “per capita green space” and “per capita water resources”. This is primarily due to the high population density and intensive resource utilisation that characterise these cities. Conversely, although central and western regions exhibit lower absolute levels of economic output and infrastructure, they experience reduced environmental pressure per unit of development. Within a standardised evaluation framework, this results in a relative resilience advantage due to lower developmental intensity.
As shown in Figure 4, this study examines urban ecological resilience levels in China across four time periods: 2009, 2014, 2019 and 2023. It reveals a significant improvement in the quality of urban ecological resilience development between 2009 and 2023. The proportion of areas with high resilience has gradually increased, while the proportion of areas with low resilience has decreased, narrowing the overall spatial disparity. Specifically, in 2009, overall ecological resilience was generally low, with most cities exhibiting moderate to low resilience. High-resilience areas were scattered and exhibited “clustering characteristics”. By 2014, most cities had improved upon their 2009 ecological resilience levels. Shanwei, Luoyang, Laibin and Daqing were the cities that had increased their ecological resilience the most across the four major regions. Meanwhile, declines in cities such as Baotou, Hohhot and Yulin contributed to an increase in the number of low-resilience cities. By 2019, overall ecological resilience had significantly improved, resulting in an optimised resilience structure. Medium-to-high resilience areas expanded markedly, broadly covering all four regions. A preliminary network of resilient urban clusters has emerged. In 2023, the number of highly resilient regions continued to grow and consolidate, expanding their spatial distribution across multiple areas. Notably, a belt-like distribution pattern is gradually forming in the central and western regions.
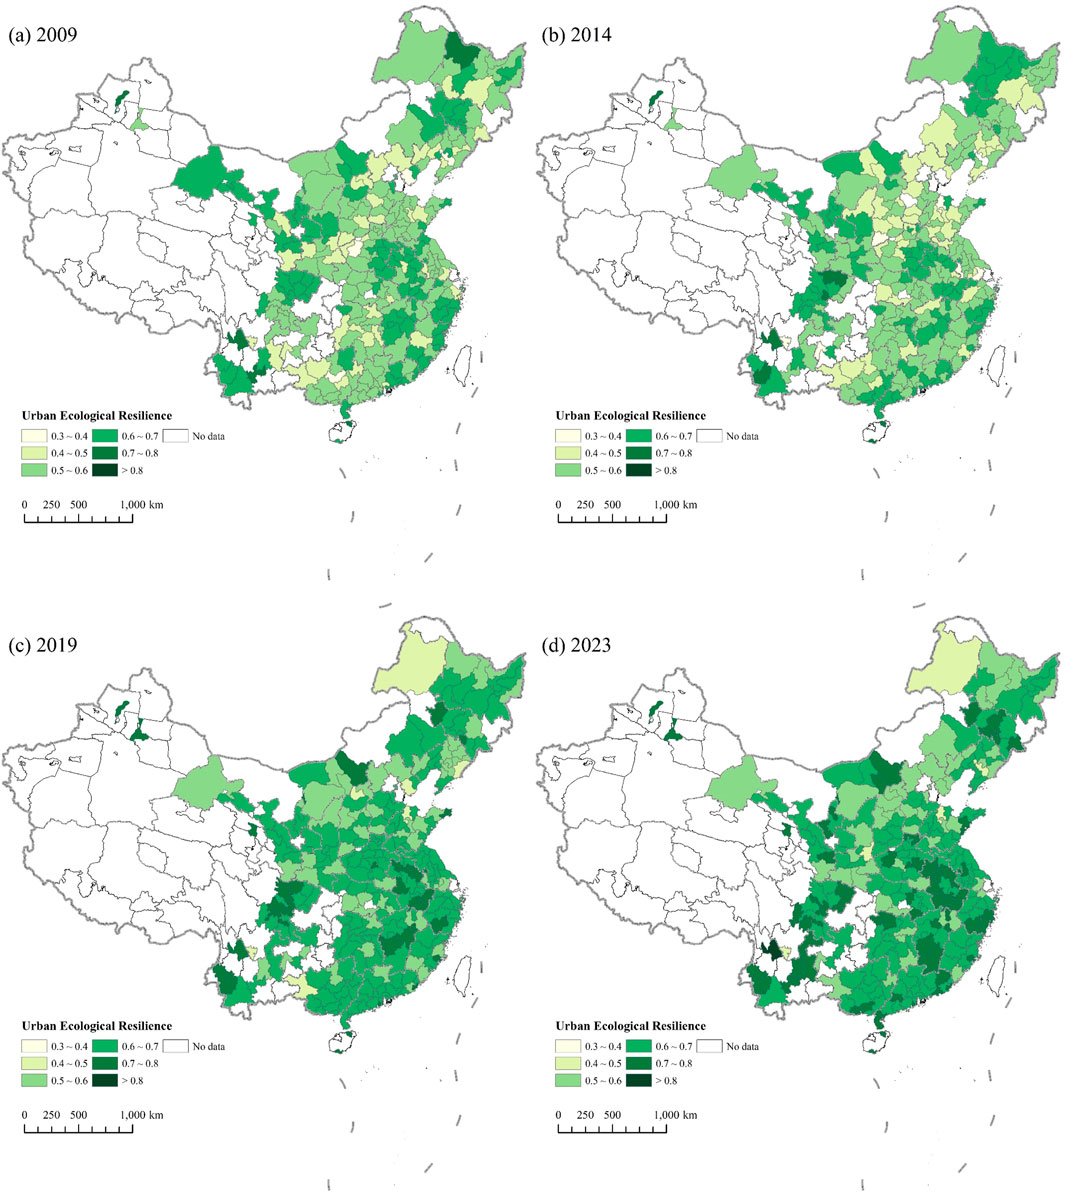
Figure 4. Spatial patterns of urban ecological resilience in China. (a) 2009, (b) 2014, (c) 2019 and (d) 2023.
To explore the key driving forces behind the improvement in urban ecological resilience in China, this paper decomposes ecological resilience into three aspects: resistance, resilience, and adaptability. The resistance contributes the most, followed by adaptability, with the resilience force having the least effect. Ecological resistance is defined as the ability of a city to maintain the basic functions of its system without collapsing when facing pollution, ecological pressure or sudden environmental events. Its continuous increase after 2014 indicates that the policy-driven effect in China has been significant in recent years, with the proposal of “dual carbon” goals and the implementation of strict environmental protection regulations having a marked effect on the treatment of “explicit” problems such as pollutant emissions. Resilience is defined as the ability of a city to recover to its original state, or a new equilibrium, through its own regulation after suffering ecological damage or disasters. It has steadily increased from 0.022 to 0.033, showing a gentle upwards trend; however, its index is the lowest, indicating an imbalance between rapid urbanisation and ecological carrying capacity. This suggests that urbanisation has squeezed ecological space and that the balance between infrastructure investment and ecological space protection urgently needs to be addressed. Adaptability refers to a city’s ability to adapt to new environments through structural adjustments and functional optimisation under long-term or repeated stress. It fluctuated from 0.229 to 0.281, showing a slow rate of growth. This reflects both the effectiveness of engineering governance and the shortcomings of energy transformation. The slow improvement in urban ecological resilience, influenced by factors such as a coal-dependent energy structure and transportation emissions, partially weakened the overall level of adaptability.
4.2 Overall characteristics of the urban ecological resilience spatial gap
Figure 5 illustrates the overall gap and decline in China’s urban ecological resilience from 2009 to 2023. Throughout the sample period, the Gini coefficient for China’s urban ecological resilience was generally high, averaging 0.0637, which indicates a significant regional disparity. On the whole, the overall gap showed a decreasing trend amid fluctuations; the Gini coefficient decreased from 0.0708 in 2009 to 0.0556 in 2023, a reduction of 21.47%, representing an average annual decrease of 1.36%.
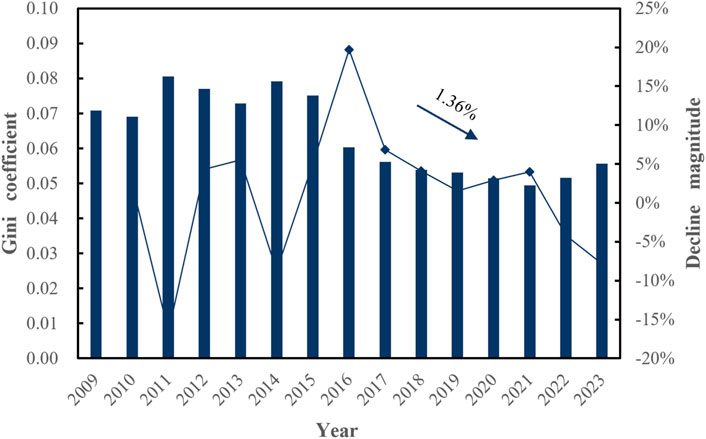
Figure 5. Overall gap in the development level of urban ecological resilience in China.
Figure 6 illustrates the changes in the urban ecological resilience Gini coefficient of the four major regions from 2009 to 2023. Overall, with the exception of the northeastern region, the urban ecological resilience Gini coefficient of the other three major regions exhibited the same trend as the overall urban ecological resilience Gini coefficient for China, showing a relatively significant decrease. The main years of decline were concentrated in 2015–2017, possibly because (1) the Central Environmental Protection Inspection System, which began its pilot phase in 2015 and was fully implemented in 2016, exerted a strong constraint on local governments, compelling them to accelerate pollution control and ecological restoration; and (2) the Air Pollution Prevention and Control Action Plan (2013–2017) and the Water Pollution Prevention and Control Action Plan (2015) entered a critical period of implementation, prompting cities, especially those in the central and western regions and small to medium-sized cities, to accelerate improvements to environmental infrastructure weaknesses and enhance overall ecological carrying capacity. (3) The long-term reliance on coal and oil in Northeast China, coupled with the slow development of green industries such as new energy and the digital economy and the delayed transformation of resource-based cities, which are forced to maintain traditional production capacity, has caused the northeastern region’s urban ecological resilience and Gini coefficient to stagnate, with no significant decline observed.
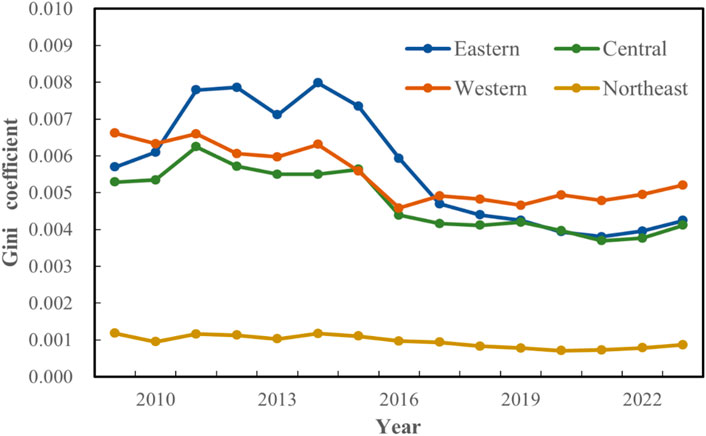
Figure 6. Overall disparity in the development level of the four major urban ecological resilience sectors.
4.3 Regional dimension decomposition of the urban ecological resilience spatial gap
As Table 4 illustrates, from 2009 to 2023, the interregional gap of the four major regions contributed significantly more to the overall gap than did the intraregional gaps. These intraregional gaps mainly stemmed from the eastern, central, and western regions. Specifically, the contribution rate of these three major regions to the overall gap remained almost constant at 7%–9%, while the contribution rate of the northeastern region to the overall gap increased by approximately 1%. This is primarily attributable to the marked heterogeneity of cities in the eastern, central, and western regions, whereas urban development in the northeastern region is highly homogeneous. First, the level of urban development in the eastern region varies considerably. Significant disparities exist in the economic development level, financial strength, technical capabilities and governance level of megacities, second-tier cities, and ordinary prefecture-level cities. Furthermore, some cities have entered the post-industrialisation stage, prioritising green innovation and the service industry, whereas others remain in the mid-industrialisation stage and face greater environmental pressure, resulting in diverse stages of development. Second, differences exist in the underlying ecological environment of the western region. The varied ecological baselines and environmental challenges faced by different regions, such as plains, mountains, plateaus and deserts, coupled with the diversity of ecosystem types, result in disparate levels of urban ecological resilience across the region. In the northeastern region, heavy industries, including steel and energy, are concentrated. The development models and industrial structures of its major cities are strikingly similar, and they commonly face issues of resource depletion, industrial decline, and significant pressure for ecological environmental restoration. Although absolute differences between cities persist, in comparison with the eastern, central and western regions, this intraregional disparity contributes only slightly to the overall difference.
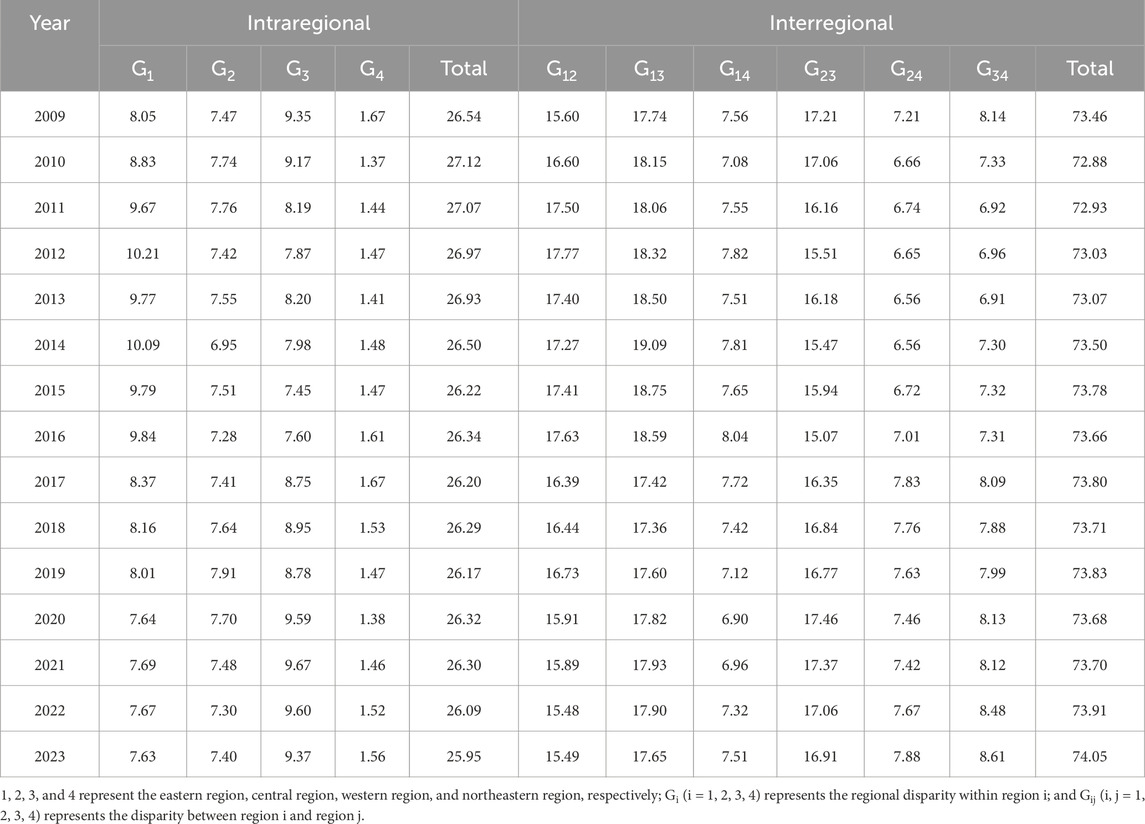
Table 4. Regional disparities in China’s urban ecological resilience development level and contribution rate.
Figure 7 illustrates the sources of the development gap in China’s urban ecological resilience at the regional level. During the sample period, both the intraregional disparities and the interregional gap generally tended to converge. Intraregional disparities decreased from 0.0188 in 2009 to 0.0144 in 2023, a decrease of 23.40%, and the interregional gap decreased from 0.0520 in 2009 to 0.0412 in 2023, a decrease of 20.77%. The interregional gap is the primary source of the overall gap in China’s urban ecological resilience. Therefore, narrowing the interregional gap is important for improving urban ecological resilience and preventing the continued expansion of the development gap in China’s urban ecological resilience.
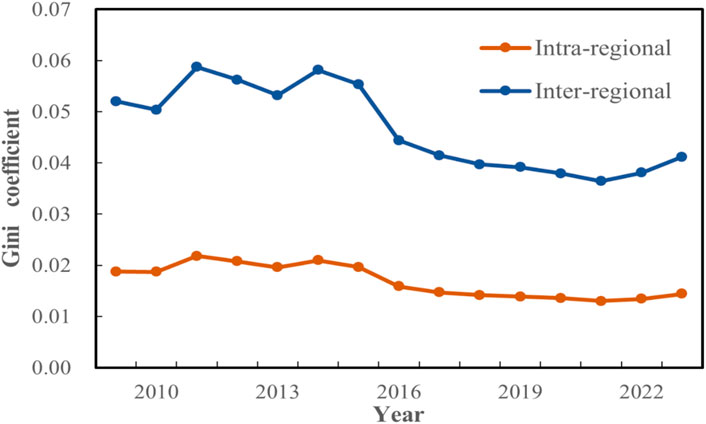
Figure 7. Decomposition of the development level gap in China’s urban ecological resilience from a regional perspective.
4.4 Decomposition of the index composition dimensions for urban ecological resilience development in relation to the spatial gap
As shown in Table 5, the gap in resistance contributes the most to the overall gap in China’s urban ecological resilience development level, followed by adaptability, with resilience being the lowest. The average annual contribution rates are 55.17%, 42.91%, and 1.93%, respectively. In terms of changing trends, the contribution rate of resistance to the overall gap tends to fluctuate downwards, whereas the contribution rates of resilience and adaptability to the overall gap tend to fluctuate upwards. This finding indicates that for future urban ecological resilience construction in China, particularly in narrowing the gap in ecological resilience development levels between cities, the focus needs to shift from passive defence to active adaptation and resilient recovery. Models that rely solely on resistance input should transition to proactive learning and rapid recovery.
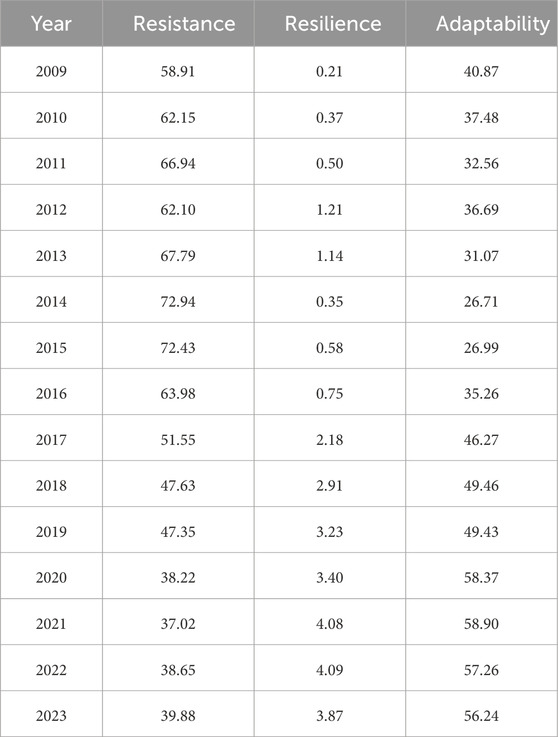
Table 5. Contribution rate to the development level gap of China’s urban ecological resilience under the dimension of index composition.
Figure 8 illustrates the origins of the development gap in urban ecological resilience across China, broken down by indicator composition. It is evident that the gap in resistance tends to decrease, whereas the gaps in resilience and adaptability tend to increase. Specifically, the resistance gap decreased from 0.417 in 2009 to 0.222 in 2023, a reduction of 46.83%; the resilience gap increased from 0.0002 in 2009 to 0.0022 in 2023; and the adaptability gap increased from 0.289 in 2009 to 0.313 in 2023, an increase of 8.07%. Notably, prior to 2014, the resistance gap fluctuated, subsequently decreasing until 2018, at which point the adaptability gap surpassed the resistance gap.
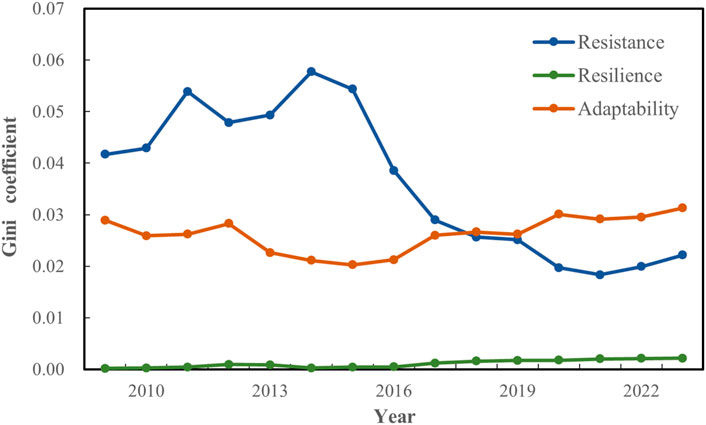
Figure 8. Decomposition of the development level gap in China’s urban ecological resilience as determined by indicator composition.
4.5 Two-dimensional structural decomposition of urban ecological resilience development gaps
Owing to space limitations, Table 6 reports only the Gini coefficient two-dimensional decomposition results for China’s urban ecological resilience in 2009 and 2023. From an intraregional perspective, the intraregional gap in 2009 primarily arose from the resistance gap in the eastern region, whereas in 2023, it mainly stemmed from the adaptability gap in the central region. From an interregional perspective, the primary source of the interregional gap shifted during the sample period from the resistance gap between the eastern and western regions to the adaptability gap between the central and western regions. These findings indicate that the eastern region has achieved significant progress through improvements to the basic urban ecological barrier and infrastructure investment. However, the marginal benefits of further large-scale infrastructure investment have diminished. Consequently, the difference in the ability of the central and western regions to actively learn, adjust to transformation, and cope with long-term risks is becoming increasingly important. Therefore, improving adaptability is the long-term core of urban ecological resilience construction and the dominant factor in future disparities. From the perspective of indicator composition, the disparity in resistance is primarily attributable to the difference between the eastern and western regions, whereas the main source of the disparity in resilience shifted from the eastern–central regions in 2009 to the central–western regions in 2023. The difference in adaptability mainly arises from the central–western regions. Compared with 2009, the gap in resistance between the eastern–western regions and the gap in adaptability between the central–western regions decreased by 2023. These findings indicate that the development gap in China’s urban ecological resilience is gradually narrowing and that regions are moving towards coordinated development transformation. The disparity in resilience has increased, highlighting the importance of the western region in terms of constructing efficient early warning systems and enhancing postdisaster reconstruction capabilities to reduce the resilience gap between the central and western regions.
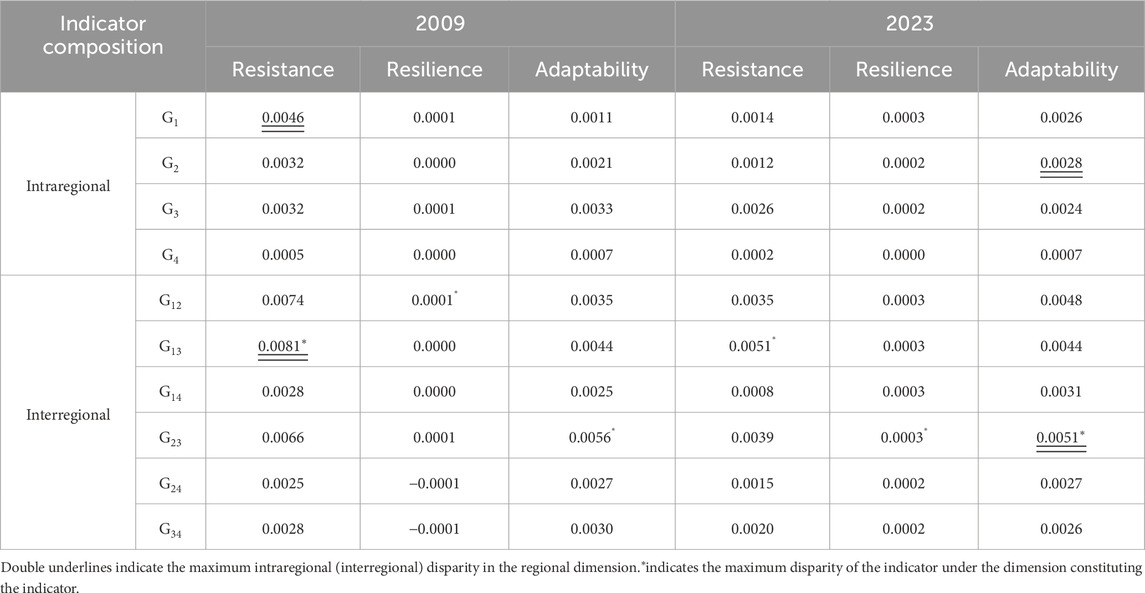
Table 6. Gini coefficient two-dimensional decomposition results for China’s urban ecological resilience development level.
5 Discussion
The overall level of ecological resilience in Chinese cities has demonstrated a consistent upward trend from 2009 to 2023, extending the temporal frame in previous research that documented an increase in urban resilience across all Chinese provinces between 2013 and 2019 (Jiao et al., 2023). Further, this study reinforces these findings from the perspective of ecological resilience, collectively indicating that China’s overarching strategies, such as “ecological civilisation construction” and the “carbon neutrality” goals, are being progressively implemented at the local level and generating positive outcomes. However, the research also identifies interregional disparities as the main source of overall resilience gaps, aligning with the findings by Jia et al. (2025). This suggests that China’s long-standing issue of regional development imbalance extends profoundly into the ecological domain, reflecting spatial mismatches in industrial development, natural environmental conditions, and policy implementation efficiency.
Although Jiao et al. (2023) reported general improvements in urban resilience nationwide, their study failed to uncover the underlying source of drivers. By employing the CRITIC weighting method and the Gini coefficient two-dimensional decomposition method, this study clearly shows that resistance is the most important factor for improving ecological resilience. This suggests that recent ecological improvements in Chinese cities may have been driven by “hard” pollution control measures than from systematic “soft” adaptations and transformative capacity-building. This distinction provides a more sophisticated comprehension of the fundamental factors that have contributed to China’s ecological advancement. Furthermore, while Jia et al. (2025) provided a static assessment of regional disparities, our dynamic decomposition reveals a more significant and nuanced trend: as the overall gap narrows, the primary source of disparity has shifted from differences in resilience between eastern and western regions to disparities in adaptability between central and western regions. This suggests that earlier policies may have effectively reduced hardware disparities, such as those observed in pollution control and green infrastructure, between eastern and western regions. However, the prevailing central challenge pertains the necessity to address software deficiencies, including technological innovation and environmental governance capabilities, in central and western regions. Future policies exclusively focused on hardware investment are therefore inadequate for addressing these profound imbalances rooted in adaptive capacity.
In light of the aforementioned consensus and discrepancies with prior studies, this study aims to elucidate the underlying causes and highlight its own contributions. Firstly, it highlights how centralised nature of China’s policy system facilitates the expeditious implementation of top-level strategies, such as ecological civilisation construction, at all levels of local government, the factor crucial to enhancing ecological resilience. Concurrently, inherent path dependencies and historical foundations perpetuate interregional disparities, thereby rendering them the dominant source of overall gaps. Secondly, in contrast to both traditional Gini coefficients and Dagum Gini coefficients, the Gini coefficient two-dimensional decomposition method employed in this study is pivotal in elucidating the observed disparities. It is evident that conventional methodologies are capable of examining the overall disparity and its primary sources, whereas the Gini coefficient two-dimensional decomposition method has the capacity to address the underlying causes of disparity and its temporal progression. This methodological innovation underpins two key findings: (i) resistance as the predominant contributor to resilience improvement, and (ii) the dynamic shift in resistance as the predominant contributor. Moreover, the study spans the period from 2009 to 2023, a timeframe that encompasses China’s transition from comprehensive pollution control to refined quality management and the implementation of the dual-carbon strategy. In the early stages, the governance focused on resistance yielded substantial outcomes. However, governance bottlenecks related to adaptability have since become more prominent at present. By capturing these structural changes, this study provides fresh and deeper insights into the ecological resilience in response to policy transformation.
Through systematic comparison, the present study corroborates the widely held view that policy interventions generally enhance ecological resilience, while introducing methodological advances that reveal the dynamic evolution of internal drivers and the shifting origins of the spatial gap, thereby making a significant contribution to the existing literature.
6 Conclusion and recommendations
6.1 Conclusion
On the basis of the panel data of 277 prefecture-level cities in China from 2009 to 2023, a comprehensive evaluation index system of urban ecological resilience in China, which uses three dimensions: resistance, resilience, and adaptability, is constructed in this paper. Furthermore, the Gini coefficient two-dimensional decomposition method is employed to measure the spatial gap and its source structure in terms of urban ecological resilience in China. The conclusions drawn are as follows: (1) The overall development level of urban ecological resilience in China tends to increase, with resistance contributing the most to this increase. (2) The overall gap in the development level of urban ecological resilience in China tends to decrease; the gap in the development level of ecological resilience has narrowed in the eastern, central, and western regions, with the exception of the northeastern region. (3) In terms of the regional dimension, the primary source of the overall disparity is the interregional gap. With respect to indicator composition, the main source of the overall gap lies in the difference in resistance. Considering both regional and indicator compositions, the intraregional gap evolved from a resistance gap in the eastern region in 2009 to an adaptability gap in the central region by 2023. The interregional gap shifted from a resistance gap between the eastern and western regions in 2009 to an adaptability gap between the central and western regions in 2023. Furthermore, among the three subindicators, the resistance gap primarily originated between the eastern and western regions; the main source of the resilience gap transitioned from between the eastern and central regions in 2009 to between the central and western regions in 2023, and the adaptability gap mainly arose between the central and western regions.
6.2 Recommendations
On the basis of the above conclusions, we propose the following policy recommendations:
First, a multilevel regional coordination mechanism should be constructed to address differences in resilience arising from varying development gradients. The interregional gap has consistently been the primary obstacle to the balanced development of urban ecological resilience in China. Addressing this obstacle hinges on strengthening the strategic links between developed and underdeveloped regions and deepening collaboration in three key areas: first, promoting the joint construction, sharing, and interconnection of ecological infrastructure; second, establishing an efficient platform for technology transfer and transformation, alongside a knowledge-sharing network; and third, encouraging the exchange of experiences and collaborative exploration of institutional innovation. Simultaneously, cross-administrative boundary ecological compensation mechanisms and scientifically sound risk-sharing systems should be established and improved. This will effectively facilitate the cross-regional flow of crucial resource elements, such as funding, technology, and talent, which are required for environmental change, and progressively resolve the resilience fault lines caused by disparities in development gradients. This study aims to establish a long-term governance framework for reducing the ecological resilience gap between regions.
Second, the foundation of resistance should be consolidated, with a focus on bridging the east–west divide and revitalising the transformation of the northeast. Given that resistance is the primary driver for enhancing urban ecological resilience and that this gap has persisted between the east and west, it has become a long-term challenge that restricts the overall improvement in resilience. To address this shortcoming, there is an urgent need for continuous and increased investment and for the systematic strengthening of key infrastructure systems and comprehensive disaster resistance capabilities related to regional ecological security. At the regional policy level, the western region should receive more precise and substantially differentiated support policies, with a focus on improving flood and drought control facilities and ecological barrier functions, to bridge its infrastructure gap with the eastern region. The transformation of the northeastern region, on the other hand, needs to overcome the path dependence of traditional development models. An ecological restoration fund for old industrial bases could be established. Priority should be given to modernising and upgrading environmental pollution control facilities to a high standard in cities with a concentration of heavy industry. Innovation should be harnessed to promote the ecological restoration and resilient reuse of idle or abandoned industrial sites. This would achieve a synergistic increase in the green and low-carbon reshaping of industrial structures and regional ecological resilience levels, injecting a sustainable new impetus into the comprehensive revitalisation of northeastern China.
Third, to address the deep-seated contradictions arising from imbalanced development within the adaptability dimension, the construction of collaborative mechanisms should be strengthened to promote regional balance. Currently, internal development disparities within the central region, coupled with structural gaps in adaptability levels between the central and western regions, have become key contradictions hindering the coordinated optimisation of the spatial pattern of national ecological resilience. To resolve this, a systematic collaborative mechanism across different levels and regions must be created. Strengthening internal integration within the central region requires breaking down interprovincial barriers and establishing robust and efficient interprovincial collaboration platforms and resource coordination mechanisms. Consensus should be fostered among provinces in the region regarding ecological resilience construction standards, evaluation systems and development paths, bridging the regional differentiation caused by uneven development. Concurrently, the strategic alignment between the central and western regions should be strengthened to construct long-term strategic partnerships and alignment mechanisms based on shared needs. Joint exploration and innovation should be undertaken to establish cross-regional ecological technology and knowledge synergy platforms, as well as resource sharing and factor optimisation allocation mechanisms. By concentrating the advantageous resources of both regions, common key bottlenecks restricting the improvement of regional adaptability should be accurately identified and addressed together. This will systematically increase the overall adaptive capacity and resilience reserves of interregional areas in response to long-term and complex environmental changes and promote the formation of a more balanced, coordinated, and sustainable new pattern of coordinated regional ecological resilience development, thereby contributing to a more balanced, coordinated, and sustainable ecological resilience development landscape.
Data availability statement
The datasets presented in this study can be found in online repositories. The names of the repository/repositories and accession number(s) can be found below: https://navi.cnki.net/knavi/detail?p=hAF3bjGzhfsCHTQcHsg9pwn3ewE8e_Qu3TVGcZ4S1n7tpbRRlMh34wz4bCJJqwPEVodfOxCql8sG0vZUb3ovqH634lDrVL4k0xdZqAAMOYCFKYtXe7H1kmz6Xn1O2Yb2&uniplatform=NZKPT.
Author contributions
QW: Conceptualization, Methodology, Writing – original draft, Supervision. MG: Writing – original draft. FP: Writing – original draft, Writing – review and editing.
Funding
The author(s) declare that financial support was received for the research and/or publication of this article. This research was financially supported by the National Natural Science Foundation of China (71904151, 42401330) and the Key Project of Philosophy and Social Sciences Research, Hubei Provincial Department of Education (23D052).
Conflict of interest
The authors declare that the research was conducted in the absence of any commercial or financial relationships that could be construed as a potential conflict of interest.
Generative AI statement
The author(s) declare that no Generative AI was used in the creation of this manuscript.
Any alternative text (alt text) provided alongside figures in this article has been generated by Frontiers with the support of artificial intelligence and reasonable efforts have been made to ensure accuracy, including review by the authors wherever possible. If you identify any issues, please contact us.
Publisher’s note
All claims expressed in this article are solely those of the authors and do not necessarily represent those of their affiliated organizations, or those of the publisher, the editors and the reviewers. Any product that may be evaluated in this article, or claim that may be made by its manufacturer, is not guaranteed or endorsed by the publisher.
References
Balland, P-A., and Rigby, D. (2017). The geography of complex knowledge. Econ. Geogr. 93 (1), 1–23. doi:10.1080/00130095.2016.1205947
Boschma, R. (2014). Towards an evolutionary perspective on regional resilience. Reg. Stud. 49 (5), 733–751. doi:10.1080/00343404.2014.959481
Chao, X. D., Liu, J., Ma, Z., Tu, Y., and Lev, B. J. M. (2024). Security assessment and diagnosis for industrial water resources using TODIMSort considering Best-Worst Method with double hierarchy hesitant fuzzy linguistic term set. Environ. Res. 259, 119539. doi:10.1016/J.ENVRES.2024.119539
Chen, J. H., Ma, H. C., Yang, S., Zhou, Z. Y., Huang, J. H., and Chen, L. C. (2023). Assessment of urban resilience and detection of impact factors based on spatial autocorrelation analysis and GeoDetector model: a case of Hunan Province. ISPRS. Int. J. Geo-inf. 12 (10), 391. doi:10.3390/IJGI12100391
Chen, N., Guo, H. X., and Xiang, H. (2023). Evaluation of urban resilience level and analysis of obstacle factors: a case study of Hunan Province, China. Front. Earth. Sc-switz 10, 1033441. doi:10.3389/FEART.2022.1033441
Cheng, A. L. (2025). Spatiotemporal changes and underlying factors of urban ecological resilience: evidence from Chinese cities. Environ. Dev. Sustain., 1–30. doi:10.1007/S10668-025-06550-4
Diakoulaki, D., Mavrotas, G., and Papayannakis, L. (1995). Determining objective weights in multiple criteria problems: the critic method. Comput. Oper. Res. 22 (7), 763–770. doi:10.1016/0305-0548(94)00059-H
Gilgur, A., and Marquez, J. E. R. (2025). San Francisco Bay area community cohesion and resilience: two case studies. Socio-Econ. Plan. Sci. 98, 102157. doi:10.1016/J.SEPS.2025.102157
Holling, C. S. (1973). Resilience and stability of ecological systems. Annu. Rev. Ecol. Syst. 4 (1), 1–23. doi:10.1146/annurev.es.04.110173.000245
Hu, H., Yan, K. G., Fan, H. B., Lv, T. G., Huang, Y., Zhang, X. M., et al. (2025). Coordination or imbalance? Understanding the relationship between economic resilience and ecological resilience in Hunan Province. Phys. Chem. Earth. 140, 103997. doi:10.1016/J.PCE.2025.103997
Jia, Z., Li, Y., Wang, J. L., Wang, Z. H., and Zhao, G. B. (2025). A study on the measurement of China's manufacturing industry chain toughness and regional heterogeneity from a dynamic perspective. Int. Rev. Econ. Financ. 102, 104329. doi:10.1016/J.IREF.2025.104329
Jiao, L. D., Wang, L. W., Lu, H., Fan, Y. W., Zhang, Y., and Wu, Y. (2023). An assessment model for urban resilience based on the pressure-state-response framework and BP-GA neural network. Urban. Clim. 49, 101543. doi:10.1016/j.uclim.2023.101543
Lan, C. L., Li, X. W., Peng, B., and Li, X. X. (2025). Unlocking urban ecological resilience: the dual role of environmental regulation and green technology innovation. Sustain. Cities. Soc. 128, 106466. doi:10.1016/J.SCS.2025.106466
Lee, C. C., Yan, J. Y., and Li, T. (2024). Ecological resilience of city clusters in the middle reaches of Yangtze River. J. Clean. Prod. 443, 141082. doi:10.1016/J.JCLEPRO.2024.141082
Li, D., Yang, W. P., and Huang, R. Y. (2023). The multidimensional differences and driving forces of ecological environment resilience in China. Environ. Impact 98, 106954. doi:10.1016/J.EIAR.2022.106954
Liang, W. J., and Xue, Y. (2025). A CAS driven framework integrating entropy cloud and fuzzy cognitive map enhances disaster resilience in urban old communities. Sci. Rep. 15 (1), 15804. doi:10.1038/S41598-025-98278-4
Peng, W. B., and Cao, X. T. (2023). Spatiotemporal differentiation of ecological resilience under renewal and its influencing mechanisms around the Changsha-Zhuzhou-Xiangtan urban agglomeration. Econ. Geogr. 43 (10), 44–52. doi:10.15957/j.cnki.jjdl.2023.10.005
Ramadan, M. S., Almurshidi, A. H., Razali, S. F. M., Ramadan, E., Tariq, A., Bridi, R. M., et al. (2025). Spatial decision-making for urban flood vulnerability: a geomatics approach applied to Al-Ain City, UAE. Urban. Clim. 59, 102297. doi:10.1016/J.UCLIM.2025.102297
Wang, Y. Y., Cai, Y. P., Xie, Y. L., Lei, C., and Zhang, P. (2023). An integrated approach for evaluating dynamics of urban eco-resilience in urban agglomerations of China. Ecol. Indic. 146, 109859. doi:10.1016/j.ecolind.2023.109859
Wang, S. J., Cui, Z. T., Lin, J. J., Xie, J. Y., and Su, K. (2022). The coupling relationship between urbanization and ecological resilience in the Pearl River Delta. J. Geogr. Sci. 32 (1), 44–64. doi:10.1007/S11442-022-1935-3
Wang, Y. X., Yu, X. H., Zhao, B. J., Xiong, X., Li, Y., and Zhang, M. (2022). Evaluation of ecological carrying capacity in Yangtze River Economic Belt and analysis of its spatial pattern evolution. Ecol. Indic. 144, 109535. doi:10.1016/J.ECOLIND.2022.109535
Yang, Z. W., Zhang, S. F., and Li, F. Y. (2024). The spatio-temporal dynamic evolution and variability pattern of urban green resilience in China based on multi-criteria decision-making. Sustain. Cities. Soc. 116, 105887. doi:10.1016/J.SCS.2024.105887
Yi, C. X., and Jackson, N. (2021). A review of measuring ecosystem resilience to disturbance. Environ. Res. Lett. 16 (5), 053008. doi:10.1088/1748-9326/ABDF09
Zhang, C., Li, Y. F., and Zhu, X. D. (2016). A social-ecological resilience assessment and governance guide for urbanization processes in east China. Sustainability 8 (11), 1101. doi:10.3390/su8111101
Keywords: ecological resilience, CRITIC, gini coefficient two-dimensional decomposition, spatial gap, structural analysis
Citation: Wan Q, Guo M and Pan F (2025) Spatial gap and two-dimensional decomposition of urban ecological resilience in China. Front. Built Environ. 11:1690346. doi: 10.3389/fbuil.2025.1690346
Received: 21 August 2025; Accepted: 15 September 2025;
Published: 30 September 2025.
Edited by:
Yang Zhang, Chengdu University of Technology, ChinaReviewed by:
Rui Qi, China University of Geosciences Wuhan, ChinaQingbin Guo, Hainan University, China
Jihong You, Guangzhou University, China
Copyright © 2025 Wan, Guo and Pan. This is an open-access article distributed under the terms of the Creative Commons Attribution License (CC BY). The use, distribution or reproduction in other forums is permitted, provided the original author(s) and the copyright owner(s) are credited and that the original publication in this journal is cited, in accordance with accepted academic practice. No use, distribution or reproduction is permitted which does not comply with these terms.
*Correspondence: Fangjie Pan, cGZqb2tAbWFpbHMuY2NudS5lZHUuY24=