 Ranjith R.
 Sekar S. K.
- 1Research Scholar, Department of Structural and Geotechnical Engineering, Vellore Institute of Technology, Vellore, Tamil Nadu, India
- 2Department of Structural and Geotechnical Engineering, School of Civil Engineering, Vellore Institute of Technology, Vellore, Tamil Nadu, India
The use of sustainable industrial waste composites in reinforced concrete structural applications will be eco-friendly. The aim of the present study is to evaluate the regression-based flexural response of reinforced concrete beams by using ceramic electrical insulator waste as a substitute for cement and aggregate. The assessment of flexural behavior is presented in this study from bending stress, deflection, and crack width measurements. It details an experimental program suitably designed and tested to evaluate the responses of reinforced insulator concrete beams (flexure, shear and bond types) and generate the regression modeling. The results indicate that, in comparison to the reference beams (M1 F, M1 B, and M1 S), the bending stress of flexure- (M4 F), bond- (M4 B), and shear-reinforced (M4 S) insulator concrete beams increased by 17.41%, 13.52%, and 27.77%, respectively. The deflection values of flexure- (M4 F), bond- (M4 B), and shear-reinforced (M4 S) insulator concrete beams decreased by 10%, 8%, and 17%, respectively, compared to the reference beams. Similarly, the crack width of flexure- (M4 F), bond- (M4 B), and shear-reinforced (M4 S) insulator concrete beams decreased by 35%, 34.72%, and 35.07%, respectively, compared to the reference beams. The difference between regression and experimentally predicted results showed less than 4% error. The regression- predicted that R2 values were more than 97%. The regression correlation reveals that there exists a close relationship among bending stress, deflection, and crack width in the first crack stage, service stage, yield stage, and ultimate stage. The sustainability factors obtained, such as energy consumption (Ec = 3521.78 MJ/m3), CO2 emission reduction (CO2e = 781.37 kg/m3), and cost benefit of 24.41%, were benefits of the study. Overall, the experimental findings aligned well with regression prediction and also demonstrate that insulator waste can be utilized to produce sustainable and cost-effective reinforced concrete without compromising structural performance.
1 Introduction
The regression analysis statistical technique can be used to model and examine the connection between one or more independent factors (such as material qualities, dimensions, and reinforcing details) and a dependent variable (such as load-bearing capability) in reinforced concrete beams. It aids in forecasting how reinforced concrete beams will behave in diverse scenarios and comprehending how numerous elements affect their functionality (Balakrishnan et al., 2023).
Umar et al. (2025b) studied the mechanical behavior of fiber-reinforced ECC engineered cementitious composite under monotonic and cyclic tensile loading with a constitutive model. Their results demonstrate that using sandblasted hooked fibers greatly increases strain capacity, reaching up to 15% while also improving tensile strength and crack healing. Notably, as compared to the control mix, hooked fibers showed a 40% increase in self-healing ability. The self-healing ability of linear fibers improved by 15%, whereas that of indented fibers improved by 30%. Similarly, Qian et al. (2024) studied the mechanical properties, self-healing capabilities, and hybrid composite fabrication of concrete made with shape memory alloys. They found that shape memory alloys improve the ductility of concrete, as seen by some hybrid compositions that show improvements in tensile and flexural strength of 27.5% and 40.18%, respectively. However, the modulus of elasticity and compression strength dropped by 5.61% and 3.31%, respectively. Compared to regular concrete, concrete containing shape memory alloys show better self-healing in addition to strength.
Ceramic electrical insulator waste has been used as binder material (Huseien et al., 2020; Ebrahimi et al., 2023) and filler materials (Senthamarai and Manoharan, 2005; Higashiyama et al., 2012) for manufacturing ordinary strength (Awoyera et al., 2016), high strength (Abou Rachied et al., 2023), and ultra-high performance (Xu et al., 2021) concrete by necessary mechanical and durability properties. Concrete with specified characteristic compressive strength of a cube at 28 days at 10–20 N/mm2, 25–55 N/mm2, and 60–80 N/mm2 is termed “ordinary strength”, “standard strength”, and “high-strength” concrete, respectively, as per IS 456:2000, 2000 (Plain and Reinforced Concrete–Code of Practice, 2000). Frattini experiments and scanning electron microscopy results showed that pastes made using ternary binder, which is composed of 50% cement and 20% insulator waste powder, had much less calcium silicate crystals. This is because synergistic interactions occurred, leading to the development of larger calcium silicate hydrate compounds (AlArab et al., 2020).
For structural purposes, Samadi et al. (2022) used recycled ceramic concrete. They used recycled tile ceramic in place of 40% and 100% of the cement and aggregates to create RC beams of 160 × 200 × 2200 mm. The ultimate flexural stiffness of the beams formed utilizing the waste materials and the control sample showed very slight difference. In comparison to the control specimen, a beam made entirely of ceramic aggregates demonstrated a 99% maximum load and a 43% reduction in deflection. Abou Rachied et al. (2023) made reinforced concrete beams of 200 mm × 300 mm × 2000 mm by replacing cement with a mixture of tile powder and furnace slag waste at 10% and 35%, respectively. Using ceramic powder, they investigated the flexural, shear, and bond characteristics of concrete beams and found nearly no difference from control concrete beams.
A beam containing porcelain powder and blast furnace slag demonstrated improved flexure, shear, and bond strength up to 13.15%, 10.25%, and 8.87% in ultimate load, respectively, compared to the control beam. Wang et al. (2023) investigated circular and rectangular steel tube stub columns filled with concrete mixed with ceramic coarse aggregate in a few axial compressive tests. The results of their investigation showed that when the confinement coefficient increased as much as 2.56, steel tube lateral confinement could greatly increase the ductility (>3) and strength (>0.001) indices. Reinforced concrete structural elements are unable to avoid shear stresses. Thus, it is essential to examine any potential interactions with other structural mechanisms such as flexure and torsion in addition to determining the impact of shear stress alone.
A statistical technique for comprehending and forecasting how different factors (independent variables) affect the behavior of a beam (dependent variable) in the context of reinforced concrete beams is regression analysis. Depending on the structure, loading conditions, and material characteristics, this might consist of predicting capacity, deflection, or other measures of performance. By quantifying the correlations between different characteristics, regression analysis assists engineers in designing structures that are safer and more efficient. Zhang et al. (2025) demonstrated that the ultimate load carrying capacity of structures can be determined by establishing a correlation between crack patterns and external loads. Interpretability is lacking in traditional regression-based approaches, which rely on costly trials.
The effectiveness of the approach was demonstrated by validation on RC beams subjected to four-point bending, which produced a mean absolute error of 20.68%. From experimental and numerical analyses on bond strength between concrete and steel reinforcement, it was concluded that bond strength is not only dependent on bar diameter but also specimen geometry (Miranda et al., 2021). There is no accepted mathematical definition for bond strength, which is a gauge of how concrete and steel grasp one another.
2 Research significance
Regression analysis and statistical validation are essential analyses that can accurately depict and validate the responses of structural elements. This study aims to ascertain the correlations between the independent and dependent variables of reinforced insulator concrete beams. Its objective is to formulate regression equations with statistical validation for predicting the performance features of M50-grade reinforced insulator concrete beams.
3 Materials and mix proportions
3.1 Insulator powder as cement replacement material and its properties
Ceramic electrical insulator waste was collected from a manufacturer (Saravana Global Energy Limited) located in Peddunaicken Kuppam, Cuddalore District in Tamil Nadu, India. In order to replace traditional concrete-making ingredients like granite aggregate and ordinary Portland cement 53 grade (OPC53), the insulator waste was crushed and ground using a jaw crusher and a ball mill to achieve the required size equivalent to conventional concrete ingredients by using the facility available at the government industrial estate for ceramics in Vridhachalam, Tamil Nadu, India. In accordance with IS 383:2016, (2016) (Specification for coarse and fine aggregates from natural sources for concrete, 2016), crushed granite was utilized as a reference coarse and fine aggregate. Cement was used in accordance with IS 12269:2013, (2013) (Specification for 53 Grade Ordinary Portland Cement, 2013). Figure 1 shows the prepared insulator aggregates: insulator powder from disposed waste. Sulfonated naphthalene-based superplasticizer was used to maintain workability.

Figure 1. Ingredients of insulator concrete and reference concrete.
The properties of insulator powder and ordinary Portland cement are compared in Table 1. The specific gravities of cement and insulator powder were determined using a Le Chatelier flask according to IS 4031:1988 (Part-11), (1988) (Methods of physical tests for hydraulic cement: Determination of density, 1988). Compared to cement, insulator powder has a lower specific gravity, reducing the density of the concrete. Particle sizes were measured with a Litesizer 500 device in accordance with ISO 22412:2017, (2017) (Particle Size Analysis-Dynamic Light Scattering, 2017). The particle size of insulator powder is 52.73% smaller than that of cement. This implies that insulator powder has a greater role in the micro-filling of concrete. Brunauer–Emmett–Teller (BET) analysis was used to determine the specific surface area in accordance with ASTM C1274:2020 (Part-12) (2020) (Standard Test Method for Advanced Ceramic Specific Surface Area by Physical Adsorption, 2020). Since the difference between the specific surface area values of cement and insulator powder is lesser (6.25%), insulator powder can be used instead of cement to improve the pozzolanic reactions.

Table 1. Properties of insulator powder and cement.
X-ray fluorescence (XRF) analysis was used to determine the chemical composition of insulator powder and cement in accordance with ASTM E1621-(Part-22), (2022) (Standard Guide for Elemental Analysis by Wavelength Dispersive X-Ray Fluorescence Spectrometry, 2022). The chemical composition of insulator powder and cement is given in Table 2. The total pozzolanic oxides (ΣP = (SiO2+ Al2O3 + Fe2O3)) in any powdered material must be more than 70% in order to be used as cement substitutes, as specified by ASTM C618 (Part-3) (2003) (Standard Specification for Coal Fly Ash and Raw or Calcined Natural Pozzolan for Use in Concrete, 2003). In the present study, ΣP is 95.46%, which enhances the pozzolanic activity of concrete in the fresh stage and improves the strength of concrete in the hardened stage. In accordance with Pereira et al. (2022), Jang and So (2015), and Higashiyama et al. (2014), the insulator powder’s total pozzolanic oxide content was 92.90%, 90.00%, and 92.71%, respectively. This is lower than the current study’s findings.

Table 2. Chemical composition of insulator powder and cement.
3.2 Insulator aggregate as granite aggregate replacement material and its properties
The insulator aggregate properties were evaluated and compared with granite aggregates. The properties of insulator and granite aggregates are compared in Table 3, where the size of insulator waste coarse and fine aggregates used in the study are 20 mm and 4.75 mm, respectively. The particle size and fineness modulus of insulator aggregate was compared with granite aggregates with reference to IS 2386:1963 (Part-1) (1963) (Methods of Test for Aggregates for Concrete: Particle Size and Shape, 1963). The fineness modulus of insulator coarse aggregate and fine aggregate were respectively 6.45% and 13.8% lesser than the granite coarse and fine aggregates. The variation in the fineness modulus of insulator aggregates greatly influences the workability and strength development of concrete. The fineness modulus of both insulator and granite fine aggregate conforms to grading zone-II as per IS 383:2016 (2016) (Specification for coarse and fine aggregates from natural sources for concrete, 2016). The size of coarse aggregate was chosen based on the geometry of concrete test specimens according to the guidelines given in IS 516:2004 (2004) (Methods of Tests for Strength of Concrete, 2004).

Table 3. Properties of insulator and granite aggregate.
The water absorption of insulator aggregate was compared with granite aggregate with reference to IS 2386:1963 (Part-1) (1963) (Methods of Test for Aggregates for Concrete: Particle Size and Shape, 1963). The insulator aggregate absorbs 70% less water than granite aggregate, which shows the poorer porosity of the former. The bulk densities of insulator aggregate were compared with granite aggregate with reference to IS 2386:1963 (Part-3) (1963) (Methods of test for aggregates for concrete: Specific gravity, density, voids, absorption and bulking, 1963). The difference in bulk densities between granite and insulator aggregate is 6.96%. The strength properties of insulator aggregate was compared with granite aggregates with reference to IS 2386:1963 (Part-4) (1963) (Methods of test for aggregates for concrete: Mechanical properties, 1963). The impact and crushing values of insulator aggregate are 16.66% and 18.51% lesser than granite aggregate, respectively. Based on the test results, insulator powder and aggregate properties are better than cement and granite aggregates.
3.3 Mix proportions
The mix proportion for M50-grade insulator concrete was designed in accordance with IS 10262:2019 (2019) (Concrete Mix Proportioning-Guidelines (Second Revision), 2019). To evaluate the performance of concrete using insulator waste as cement and aggregate replacement materials, four different types of concrete mix (M1, M2, M3, and M4) were prepared:
• M1: 100% cement and 100% crushed granite aggregate.
• M2: 30% insulator powder as substitute of cement.
• M3: 100% insulator aggregate as substitute for granite aggregate.
• M4: 30% insulator powder and 100% insulator aggregate as substitute for cement and granite aggregates, respectively.
The details of concrete mix proportions are given in Table 4. We previously used the same mix proportions to study the elevated temperature effect of concrete made with insulator powder and insulator aggregate as cement and aggregate replacement for standard strength concrete (Sekar et al., 2025). The quantity of insulator powder used was 30% as found by the pozzolanic activity test used to replace the cement. During the preliminary trials of concrete mixes, it was found that a minimum of 162 L/m3 of operating water was needed for a 20 mm maximum size of ceramic coarse aggregates in the presence of 2.925 L/m3 of superplasticizer to enhance the workability without further increasing water content. Therefore, the maximum size of coarse filler, quantity of water, and quantity of superplasticizer used was 20 mm, 162 L/m3, and 2.925 L/m3, respectively, for the four concrete mixes.

Table 4. Mix design details of insulator concrete mixes.
The volume of coarse and fine aggregates was kept the same for all mixes. Insulator concrete was more cohesive and workable than granite aggregate concrete due to the very minimal water absorption and smooth surface texture of insulator waste aggregate. The workability was examined by slump testing in compliance with IS 7320:1974 (Reaffirmed, 2008) (1974) (Specification for concrete slump test apparatus, 1974). The slump values of the M1, M2, M3, and M4 mixes were found to be 148 mm, 154 mm, 150 mm, and 158 mm, respectively. These slump values indicate that the smooth surface texture of insulator waste aggregate improves the workability of concrete at 1.35%, whereas the presence of insulator powder improves the workability of concrete by 4%. The combination of insulator powder and insulator aggregate improves the workability of concrete by 6.75%. This improvement in concrete workability is due to the presence of superplasticizer and insulator waste.
4 Methodology
4.1 Experimental details of preliminary test specimens
To determine the preliminary test specimen strength of concrete, such as compressive strength and modulus of elasticity, a cube specimen (100 mm × 100 mm × 100 mm) and cylinder specimen (150 mm in diameter, 300 mm in length) were cast and tested after 28 days of curing, on the same day as the beam testing. The experimental setup for the compressive strength and modulus of elasticity test is shown in Figure 2. According to IS 516:2004 (2004) (Methods of Tests for Strength of Concrete, 2004), the compressive strength of the cubes was tested using digital compression testing equipment with a maximum capacity of 2000 kN at a loading rate of 2.3 kN/s. The nominal maximum size of the cube specimen chosen as 100 mm3 in this study due to the 20 mm nominal maximum size of coarse aggregate utilized, as per Clause 2.8 of IS 516:2004 (2004) (Methods of Tests for Strength of Concrete, 2004). Senthamarai and Manoharan (2005) also used a 100 mm3 cube specimen in their study, corresponding to a coarse aggregate size of 20 mm. The hardened density of concrete was calculated for the cube specimen in wet conditions after wiping out the surface water after 28 days of water curing before strength testing, as illustrated in IS 516:2004 (2004) (Methods of Tests for Strength of Concrete, 2004).

Figure 2. Test setup and failure patterns of insulator cube and cylinder specimens.
The concrete cylinder specimen was used in measuring linear strain with a compressometer and lateral strain with an extensometer to determine the modulus of elasticity and Poisson’s ratio, respectively. As per IS 516:2004 (2004) (Methods of Tests for Strength of Concrete, 2004), the slope of the stress–strain graph was used to determine the modulus of elasticity and Poisson’s ratio. From the stress-strain graph using, Equations 1, 2 as given in ASTM C469 (Part-2) (2009), the modulus of elasticity and Poisson’s ratio were calculated:
where Es is static modulus in (GPa), S2 is stress corresponding to 40% of ultimate load in MPa, S1 is stress corresponding to linear strain (ε1) of 50 × 10−6, and ε2 is linear strain corresponding to S2. Poisson’s ratio was determined using Equation 2:
where μ is Poisson’s ratio and εt2 and εt1 are lateral strains corresponding to stresses S2 and S1, respectively.
To determine how the microstructure of insulator waste concrete improves the strength characteristics and flexural performance of reinforced concrete beams, the samples used for testing were ground into a powder (passing through a 90 μm sieve) following the mechanical properties’ evaluation of the preliminary insulator concrete specimens. Using a Philips X’Pert PRO PANalytical diffractometer, the hydrated chemical compounds and crystal phases were examined in compliance with ASTM E3294 (Part-22) (2022) (Standard Guide for Forensic Analysis of Geological Materials by Powder X-Ray Diffraction, 2022). The system operated at a speed of 10°/min with an angle of scattering ranging 5–80° with a 30 mA/40 kV output. The analysis used an X-ray wavelength of 1.5406 Å, which is comparable to the X-ray energy (8.04 keV) of copper K-α (CuKa) radiation.
4.2 Design and reinforcement detailing of insulator concrete beams
To find the flexural behavior, 12 reinforced concrete beams 100 × 150 × 1000 mm in size were cast (four flexure-reinforced, four bond-reinforced, and four shear-reinforced beams). The reinforcement details of the flexure, bond, and shear types of reinforced insulator concrete beams are shown in Figure 3. The geometry of reinforced concrete beams was chosen with reference to Aksoylu et al. (2023). The beams were made from a combination of three different types of reinforcement detailing (F: flexure-type reinforcement; B: bond-type reinforcement; S: shear-type reinforcement) and four different types of insulator concrete mixes (M1, M2, M3, M4):
• M1 (F), M2 (F), M3 (F), and M4 (F): flexure-type reinforced
• M1 (B), M2 (B), M3 (B), and M4 (B): bond-type reinforced
• M1 (S), M2 (S), M3 (S), and M4 (S): shear-type reinforced

Figure 3. Reinforcement details of insulator concrete beams. (a) Flexure type reinforced beams. (b) Bond type reinforced beams. (c) Shear type reinforced beams.
All beams maintained consistent tension and compression zone reinforcement ratios of (Pt – 1.21%) and (Pc – 0.77%), respectively. The middle third span of the bond beams with staggered lap splicing for compression reinforcement was used to examine flexural behavior (Figure 2B). The stirrup spacing in each beam was maintained at 100 mm c/c. To guarantee that the flexure and bond types of reinforced beam would experience flexure failure at the service stage in compliance with IS 456:2000 (2000) (Plain and Reinforced Concrete–Code of Practice, 2000), a clear span of an effective depth ratio (L/d) of 6.92 was set. The remaining four shear-reinforced beams were constructed with stirrup spacing increased to 150 mm c/c and a shear span to an effective depth ratio (a/d) of 2.30 to ensure shear failure at the service stage in compliance with IS 456:2000 (2000) (Plain and Reinforced Concrete–Code of Practice, 2000).
When using reinforced beams of the flexure and bond type with staggered lap splicing of 192 mm (24 ϕ) at midspan, two numbers (#) of 10 mm diameter (ϕ) steel bar were used as tension reinforcement and two numbers (#) of 8 mm ϕ steel bar were used as compression reinforcement, as per IS 456:2000 (2000) (Plain and Reinforced Concrete–Code of Practice, 2000). Shear-reinforced beams were strengthened using two 10-mm-wide steel bars for tension and two 8-mm-wide steel bars for compression. The effective cover remained at 20 mm. For reinforcement in compression and tension zones, steel bars of Fe550-grade were used, while stirrups were made of Fe250-grade steel with a 6 mm diameter. The properties of the steel reinforcement are given in Table 5.

Table 5. Properties of steel reinforcement.
4.3 Experimental details of reinforced insulator concrete beams
The setup for testing the beams is shown in Figure 4. A loading frame (600 kN capacity) and displacement-controlled servo hydraulic actuator (500 kN capacity) was used for testing. A connected actuator system was used to measure the load. The linear variable displacement transducer (LVDT), situated at the bond beam’s bending zone, was used to detect the deflection of the beam. It was assembled with a data logger (Nic DAQ-9174) and displacement bridge NI-9205 with DSUB (32 Ch, ±10 V to ±120 mV, 16-Bit, 120 Ω analog input). TML (Tokyo Measuring Instruments Laboratory Co., Ltd., Japan) provided the PFL-10–11 type of strain gauges (gauge length: 10 mm; gauge factor: 2.11) which were mounted at the bond beam’s compression and tension zones. In order to obtain the strain values, the lead wires from the strain gauges were connected to the strain bridge (NI9235, 8 Ch, 24-Bit, 120 Ω quarter bridge analog input) and then to the data logger (Nic DAQ-9174) using the quarter-bridge technique. Crack widths were measured using a handheld microscope with 40× visual resolution and 0.01 mm sensitivity.

Figure 4. Testing setup of insulator concrete beam.
The beams were preloaded with a minimum force of 0.5 kN before testing in order to allow the LVDT and strain gauges to operate. Simple supported end conditions and a two-point load were used to test the beams. The center-to-center distance between the supports was 900 mm. The load was applied monotonically at a rate of 2 kN/mm in the constant moment zone. MTS-STEX Pro software was used to analyze the measured data in order to determine the strain and deflection values.
4.4 Statistical and regression analysis
In the first phase, statistical analysis was performed using ANOVA: quadratic model for mechanical properties of insulator concrete. The uniformity of the mechanical properties of concrete is better understood by statistical analyses such as:
• Standard deviation (SD)
• Coefficient of variation (CV)
• F-value
• P-value
• Regression coefficient (R2)
The SD and CV were found using Equations 3, 4, respectively:
where SD is standard deviation, CV is coefficient of variance, xi is individual specimen strength, x̄ is mean strength, and n is number of specimens. Six (n = 6) test specimens were used for mass density and compressive strength evaluation for each concrete mix, and the average test results of specimens were considered statistical analysis, whereas modulus of elasticity and Poisson’s ratio tests were conducted for each mix with one specimen (n = 1). Hence, mass density and compressive strength results alone were used for statistical validation using Senthamarai and Manoharan (2005) and Umar et al. (2024).
In the second phase, a regression model was used to establish the correlation between the independent and dependent variables of the flexural behavior of reinforced insulator concrete beams. The regression analysis of flexural behavior was performed using ANOVA: quadratic model. The methodology for the regression analysis was performed as per Rajasekaran et al. (2008), Sethuraman and Suguna (2016), Balakrishnan et al. (2023), and Umar et al. (2025a).
The following concrete and steel reinforcement properties were substituted as independent variables in the regression analysis.
• Characteristic compressive strength of concrete (fck)
• Yield strength of reinforcement (fy)
• Mass density of concrete (ρ)
• Young’s modulus of concrete (Ec)
• Poisson’s ratio of concrete (νc)
• Spacing of reinforcement stirrups (ss)
The following flexural responses were substituted as dependent variables in the regression analysis at first crack load, service load, yield load, and ultimate load.
• Bending stress (fb)
• Deflection (δ)
• Crack width (W)
The predicted regression equations for bending stress and the deflection and crack width of the beams at various stages of loading were validated by the following statistical analysis results:
• regression coefficient (R2)
• F-value
• P-value
• t-Stat
5 Results and discussion
5.1 Effect of using insulator waste in the mechanical and microstructure properties of concrete
The insulator powder and aggregate blended concrete mix (M4) achieved maximum strength in terms of compressive strength and modulus of elasticity compared with the remaining mixes: M4 was respectively 9.45% and 2.11% higher than the reference concrete mix (M1). M4 showed a notable increase in compressive strength compared to the other mixes. The properties of the insulator concrete mixtures are given in Table 6. M4 attained the highest compressive strength of 65.45 MPa. In contrast to cement and granite aggregate, this demonstrates that the link between insulator powder and aggregate is stronger when superplasticizer is present. Compared to M1, the average cube compressive strength increase of M2 and M4 was 9.13% and 9.92%, respectively. M3 (insulator aggregate concrete) and M1 (granite aggregate concrete) do not significantly differ in strength.

Table 6. Properties of insulator concrete mixes.
The XRD graph of insulator concrete mixes is shown in Figure 5. It can be seen from the graph how the inclusion of insulator waste affects the microstructure or load transfer mechanism. The following mineral phases were identified: calcium aluminate silicate hydrate (C-A-S-H) gel, calcium silicate hydrate (C-S-H) gel, calcium hydroxide (portlandite C-H), and calcium aluminate sulfate hydrate (ettringite), AFt. In comparison to the M1 mix, M2 and M3 exhibited greater crystalline size, as seen by the increase in intensity observed at smaller angles (i.e., the amorphous state vanishes). All C-H intensity peaks of the mixes were determined as lower than M4 (Figure 5).
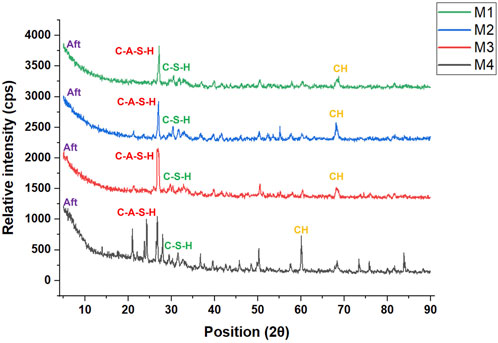
Figure 5. XRD graph of insulator concrete mixes.
Similarly, we have previously studied the microstructure and found that insulator powder substituted concrete mix increases its strength while simultaneously raising the density of the C-S-H gel (Sekar et al., 2025). The strengthened insulator concrete mixes (M2, M3, and M4) prevented in-depth core concrete damage at greater stress levels because of a better confinement effect than M1 concrete mix (Figure 6).

Figure 6. Tested insulator concrete cube specimens.
In accordance with ASTM C469 (Part-2) (2009) (Standard Test Method for Static Modulus of Elasticity and Poisson’s Ratio of Concrete in Compression, 2009), the lateral and linear strain of the concrete cylinder was determined at 40% of the ultimate load in order to determine the modulus of elasticity and Poisson’s ratio. Table 6 provides the insulator concrete’s assessed modulus of elasticity and Poisson’s ratio values. As seen in Figure 7, the insulator concrete resists higher stresses with respect to rate of strain than the reference concrete. Under uniaxial compression, M2’s maximum linear strain and equivalent lateral strain at failure were determined to be 0.00362 and 0.00086, respectively—14% less than that of reference mix M1. The insulator concrete lateral strain of 44.75% is higher than the permissible compressive strain of 0.002 as given in IS 456:2000 (2000) (Plain and Reinforced Concrete–Code of Practice, 2000).

Figure 7. Compressive stress and linear strain variation of insulator concrete mixes.
As seen in Figure 7, the linear strain at failure was greater in the insulator concrete, resulting in a higher modulus than the reference concrete. Comparing M2 to M3, the average increase in modulus was 3.75%, 2.24%, and 8.31%, respectively. This is better than the modulus of elasticity of insulator aggregate concrete (Senthamarai and Manoharan, 2005). Likewise, using tile debris raises the modulus of elasticity of concrete by 26.9% (Anderson et al., 2016). It was determined that the M1, M2, M3, and M4 mixes had Poisson’s ratio values of 0.24, 0.22, 0.24, and 0.22, respectively. According to Naenudon et al. (2023), Poisson’s ratio of geopolymer concrete with insulator aggregates varies between 0.23 and 0.27. Based on these findings, insulator waste functions well to sustain stresses that are comparable to the reference materials.
The correlation amongst the mechanical properties of M50-grade insulator concrete was evaluated using statistical analysis. The calculated statistical analysis report of mass density and compressive strength is given in Table 7. The regression coefficient (R2) of the mass density and compressive strength results of the M4 mix were 0.997 and 0.994, respectively. The predicted coefficient of variation (CV) of <5%, standard deviation (SD) of <1, and R2 of >0.98 shows that the results are more acceptable for all the mixes. Based on the comparison of the CV and SD of the present study with Senthamarai and Manoharan (2005), our results were consistent. A more precise determination of the mean concrete strength was obtained when the sample size was significant (n = 6), reducing the standard error. The properties of concrete were successively attained by a greater sample size to obtain a comparable limit of variability and confidence level (>95%). Similarly Umar et al. (2024) studied the statistical analysis of mechanical properties of concrete with bentonite clay and quarry dust using ANOVA: quadratic model. According to their statistical research, concrete with exceptional strength that matches theoretical expectations was generated by combining 10.29% bentonite clay, 7.20% quarry dust in place of cement, and 8.19% fine aggregate. This ideal mixture offers a sustainable method of producing concrete by skillfully balancing resource use and performance.

Table 7. Statistical validation of mass density and compressive strength using ANOVA.
5.2 Effect of using insulator waste in the flexural response of reinforced concrete beams
Experimental predictions of bending stress at different stages of loading are given in Table 8. Compared to reference flexure-type reinforced beams (M1(F)), the bending moment of M2 (F), M3 (F), and M4 (F) beams were increased by 10.07%, 4.20%, and 17.41%, respectively, in the ultimate stage. Similarly, the improvement of the bending moment was observed for the flexure type of reinforced concrete beams as per the literature (Rajkumar et al., 2018; Karalar et al., 2022; Samadi et al., 2022; Abou Rachied et al., 2023; Aksoylu et al., 2023). Compared to the reference bond beams M1 (B), the bending moment capacity of the M2 (B), M3 (B), and M4 (B) beams were increased by 13.52%, 3.74%, and 10.82%, respectively, in the ultimate stage.

Table 8. Experimental prediction of flexural responses at different stages of loading.
The enhancement of the bending moment was comparatively similar to earlier studies (Rajkumar et al., 2018; Karalar et al., 2022; Samadi et al., 2022; Abou Rachied et al., 2023; Aksoylu et al., 2023). In the shear types of reinforced concrete beams, the bending moment capacity of M2 (S), M3 (S), and M4 (S) were increased by 14.72%, 7.38%, and 27.77%, respectively, compared to M1 (S). Similarly, for the shear types of reinforced concrete beams, the bending moment was found, and it improved the behavior of the beams as per Ashour (2000) and Aksoylu et al. (2023). Because of greater initial stiffness, the M4 mix withstood bending well in the stages of loading. This implies that concrete that includes insulator waste enhances flexural strength. The bending moment versus deflection graph of tested beams is shown in Figure 8.

Figure 8. Bending moment: deflection variation of insulator concrete beams. (a) Flexure-type reinforced beams. (b) Bond-type reinforced beams. (c) Shear-type reinforced beams.
The percentage increase in the bending stress of insulator concrete beams compared to the reference beams at different stages is depicted in Figure 9. Similarly, high strength beams increased the bending stress to 132.26% (Balakrishnan et al., 2023). When insulator waste is added to reinforced concrete beams, it combines with the C-H gel generated during cement hydration to improve the microstructure and load transmission mechanism. The presence of SiO2 and Al2O3 in the fine insulator powder boosts the production of C-S-H gel, which raises the insulator concrete beams’ moment of resistance. Similarly, concrete members that employed ceramic powder and showed sufficient bond stress had similar outcomes (Abou Rachied et al., 2023). During the test, no horizontal fractures were seen at the insulator concrete beams’ reinforcement level, indicating that the link between the steel reinforcement and the surrounding concrete did not break.

Figure 9. Bending stress variation of insulator concrete beams at different stages of loading. (a) Flexure-type reinforced beams. (b) Bond-type reinforced beams. (c) Shear-type reinforced beams.
5.3 Effect of using insulator waste in the deflection control of reinforced concrete beams
The experimental prediction of deflection at different stages of loading is given in Table 8. The deflection of insulator concrete beams compared to reference beams at various phases is shown in Figure 10. In comparison to the M1 mix reference beam, all the M2, M3, and M4 insulator concrete beams showed less deflection. A maximum 10% reduction in deflection was observed in flexure-type reinforced M4 beams. In bond- and shear-type reinforced beams, deflection decreased by 8% and 17%, respectively. The percentage decrease of deflection was higher at yield/ultimate load (δy, δu) and lowest at cracking load (δfcr) for all types of reinforcement, indicating that the positioning of the reinforcement is more effective in reducing deformations at ultimate load.

Figure 10. Deflection variation of insulator concrete beams at different stages of loading. (a) Flexure-type reinforced beams. (b) Bond-type reinforced beams. (c) Shear-type reinforced beams.
Similarly, high-strength beams enabled a maximum reduction in deformation of 95.16% (Balakrishnan et al., 2023). More lime was accessible for pozzolanic activity due to the hydration of CaO transformed as C-H, which improved concrete strength by controlling beam deflection. Similar results were observed for the ceramic powder reinforced concrete beam (Aksoylu et al., 2023). The reinforced insulator concrete beams performed in a ductile manner because of the higher strain rate of insulator concrete in the ultimate load.
5.4 Effect of using insulator waste in the crack control of reinforced concrete beams
The experimental prediction of crack width at different stages of loading is given in Table 8. The crack-width variation of insulator concrete beams was compared to reference beams (Figure 11). The percentage reduction in crack width improves the ultimate moment of resistance of beams. In the pure bending zone, the flexure, shear, and bond types of reinforced beams (M4 mix) reduce crack widths by 35%, 34.72%, and 35.07%, respectively. The greatest decrease in crack width is consistently demonstrated by M4 due to the addition of insulator powder and aggregates, which makes the beam more rigid.

Figure 11. Crack width variation of insulator concrete beams at different stages of loading. (a) Flexure-type reinforced beams. (b) Bond-type reinforced beams. (c) Shear-type reinforced beams.
Similarly, the use of hybrid confinement in high-strength beams reduced the crack width to 60% (Balakrishnan et al., 2023). Comparing the insulator concrete mix (M4) with the reference concrete mix (M1), XRD analysis results show that the dispersed hydrated forms of C-S-H gel and C-A-S-H gel are more compatible and have a higher resistance to cracking. Insulator concrete is more compatible with steel, which improves the moment of resistance and minimizes crack width propagation at ultimate load.
5.5 Effect of using insulator waste in failure modes of reinforced concrete beams
Four distinct failure mechanisms of beams were identified during testing.
• First crack stage
• Service stage
• Yield stage
• Ultimate stage
Responses were calculated at the service stage using a factor of safety of 1.5, while the subsequent stage responses were assessed visually on the testing beam and on a computer linked to the data logger during testing. Figure 12 displays the failure pattern of the beams. The failure mode types that were found are explained as follows.

Figure 12. Failure patterns of insulator concrete beams. (a) Flexure-type reinforced beams. (b) Bond-type reinforced beams. (c) Shear-type reinforced beams.
5.5.1 First crack stage
When the beams were 20% of their ultimate load, the first microcracks spread from the strained tension zone. The initial crack width of the flexure-reinforced insulator concrete beams ranged from 0.12 to 0.15 mm when subjected to loads of 13.33 and 11.83 kN, respectively. For bond-reinforced insulator concrete beams, it ranged from 0.15 mm to 0.18 mm when subjected to loads of 12.50 and 11.33 kN, respectively. However, for shear-reinforced beams, initial crack width ranged from 0.21 mm to 0.25 mm, which corresponded to 9.10 kN and 8.22 kN of load, respectively. A similar failure pattern was observed at the first crack stage for reinforced concrete beams made using sandstone aggregates by Kumar et al. (2007).
5.5.2 Service stage
The crack width of the insulator concrete at this stage (66% of the ultimate load: ultimate load divided by a factor of 1.5) varied 0.19–0.22 mm for flexure beams, 0.26–0.28 mm for bond beams, and 0.23–0.28 mm for shear beams. According to standards like IS 456:2000 (2000) (Plain and Reinforced Concrete–Code of Practice., 2000), EN 1992 (1-1) (Design of concrete structures: General rules and rules for buildings, 2004), and ACI 318 (Part-2) (Building-Code-for-Structural-Concrete, 2002), these crack widths were within acceptable bounds of 0.3 and 0.41 mm, respectively. Similarly, using ultimate load divided by a 1.5 load factor, Gunasekaran et al. (2013) discovered the failure profile for reinforced concrete beams made with coconut shell aggregate during the service stage.
5.5.3 Yield stage
Strain and deflection data were recorded in relation to the yield load—80% of the ultimate load—where reversible loading was observed. Similarly, the yield deflection of a reinforced concrete beam composed of ceramic tile powder was determined to be 85% of the ultimate load (0.85Pmax) by Aksoylu et al. (2023). At this time, the visible fracture widths in insulator concrete flexure beams range 0.27–0.38 mm, whereas in bond beams, they range 0.35–0.45 mm. However, for a shear beam, it falls between 0.26 mm and 0.31 mm.
5.5.4 Ultimate stage
The crack width rapidly expands from the soffit of the beams in flexural tension mode as the ultimate load gradually decreases. Until the loading has stopped and the cross-sectional area exceeds its original cross-sectional area, the flexural deformation increases outward. The ultimate stage crack widths of the flexure- and bond-reinforced beams vary 0.47–0.60 mm and 0.55–0.70 mm, respectively. However, for shear beams, it is 0.37–0.47 mm. The crack patterns of tested (a) flexure beams, (b) bond beams, and (c) shear beams under ultimate stress are displayed in Figure 12. Similarly, the failure pattern of a reinforced concrete beam built with powdered ceramic tile was demonstrated by Aksoylu et al. (2023).
5.6 Regression-based results of the flexural response of reinforced insulator concrete beams
The predicted regression equations with statistical analysis of reinforced concrete beams are given in Table 9. The effective statistical validation parameters such as R2, F-value, P-value, and t-Stat were predicted by the regression equations with considerable degrees of accuracy. The predictive correlation between experimental and regression results is reliable and robust, as evidenced by the regression model. At the ultimate stage of the loading, the R2 values of bending stress, deflection and crack width were 0.999, 0.998, and 0.997, respectively. Similarly, Umar et al. (2025a) studied the regression model (R2) for the flexural behavior of cementitious composites reinforced with fibers of a shape memory alloy. The correlation for the shape memory alloy specimen appeared to be more than 0.95 and, for the cementitious composites combined with shape memory alloy, it was over 0.97. The satisfying results of the data fit show that the Weibull probability model effectively captures the relationship between the damaged amount of cementitious composites and various shape memory alloys.

Table 9. Regression equation and statistical prediction of flexural responses of insulator concrete beams using ANOVA.
According to the p-value, which is a probability that falls between 0.0010 and 0.0087, results are considered statistically significant when the value is less than a predetermined significance threshold value of 0.05. At the ultimate stage of loading, the P-values of bending stress, deflection, and crack width were 0.0074, 0.0045, and 0.0010, respectively. An even stronger effect was indicated by F-values significantly larger than 1, whereas an F-value >1 indicates a substantial difference between group averages. At the ultimate stage of loading, the F-value of bending stress, deflection, and crack width were 3.84, 2.28, and 2.37, respectively.
To determine the statistical significance of the ultimate bending stress (fb) of insulator concrete beams beyond the R2, F-value, and P-value, a paired t-test also was performed. The test result showed that the critical t-statistic was 4.303 (95% confidence interval) and the computed t-statistic was 3.239, which confirms a statistically significant finding. Because the null hypothesis is rejected, the findings are regarded as statistically significant.
The validation of bending stress results between actual and predicted values with percentage error are given in Table 10. The percentage of errors in bending stress validation falls within 4.02% in the yield stage, indicating that it satisfies the regression prediction successfully. The comparison of experimental bending stress with regression prediction is shown graphically in Figure 13. For the purpose of evaluating structural safety, the regression model accurately forecasts a maximum stress capability of beams as confirmed by the results that is close to the 45° coefficient of variables (R2) line. Compared to regression prediction graphs of deflection and crack width, the bending stress data aligns well. Similarly, regression analysis was performed for high-strength reinforced concrete beams made with fiber-reinforced bars; the findings revealed that the acceptable regression coefficient R2 varied from 0.853 to 0.969 (Balakrishnan et al., 2023).
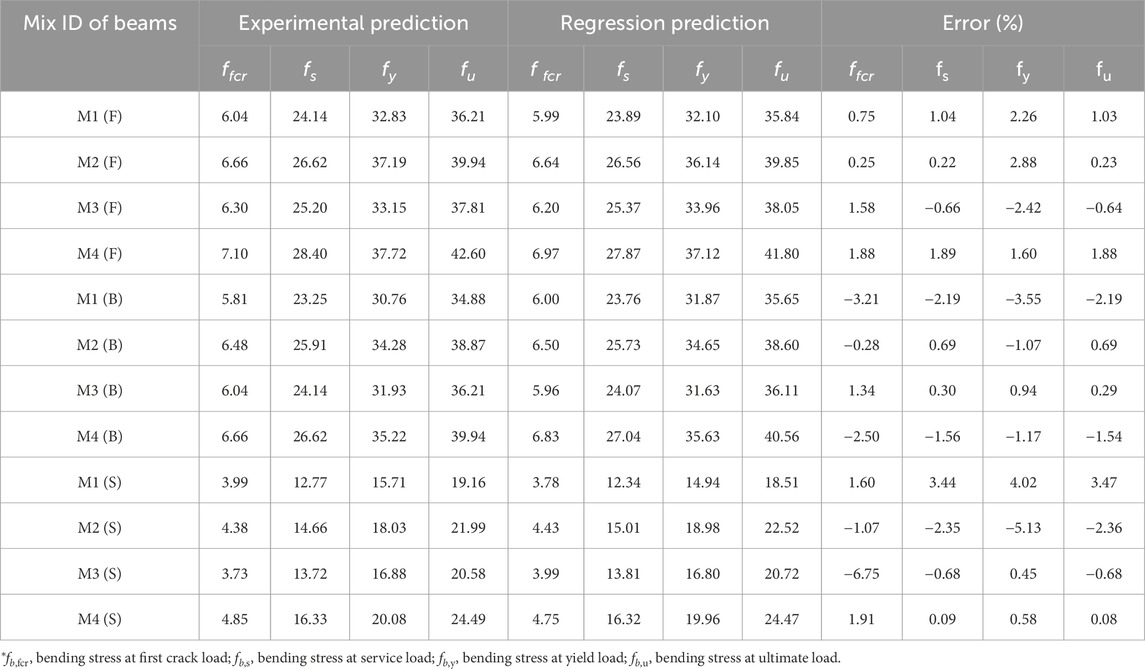
Table 10. Validation of bending stress results between actual and predicted values with percentage error.

Figure 13. Comparison of experimental bending stress with regression prediction. (a) First crack stage. (b) Service stage. (c) Yield stage. (d) Ultimate stage.
The validation of deflection results between actual and predicted values with percentage error is given in Table 11. The percentage of errors in deflection validation falls within 4.22% in the service stage, indicating that it satisfies the regression prediction. The comparison of experimental deflection with regression prediction is shown graphically in Figure 14. The data points of regression prediction and the experimental results of deflection graphs are scattered from the R2 line compared with the bending stress R2 line.

Table 11. Validation of deflection results between actual and predicted values with percentage error.

Figure 14. Comparison of experimental deflection with regression prediction. (a) First crack stage. (b) Service stage. (c) Yield stage. (d) Ultimate stage.
The validation of crack-width results between actual and predicted values with percentage error is given in Table 12. The percentage of errors in crack-width validation falls within 7.53% in the first cracking stage, indicating satisfaction with the regression prediction. The comparison of the experimental crack width of beams with regression prediction is shown as a scatter plot in Figure 15. Compared to the R2 line for bending stress, the data points from the experimental findings of crack width graphs and regression prediction are dispersed from it.
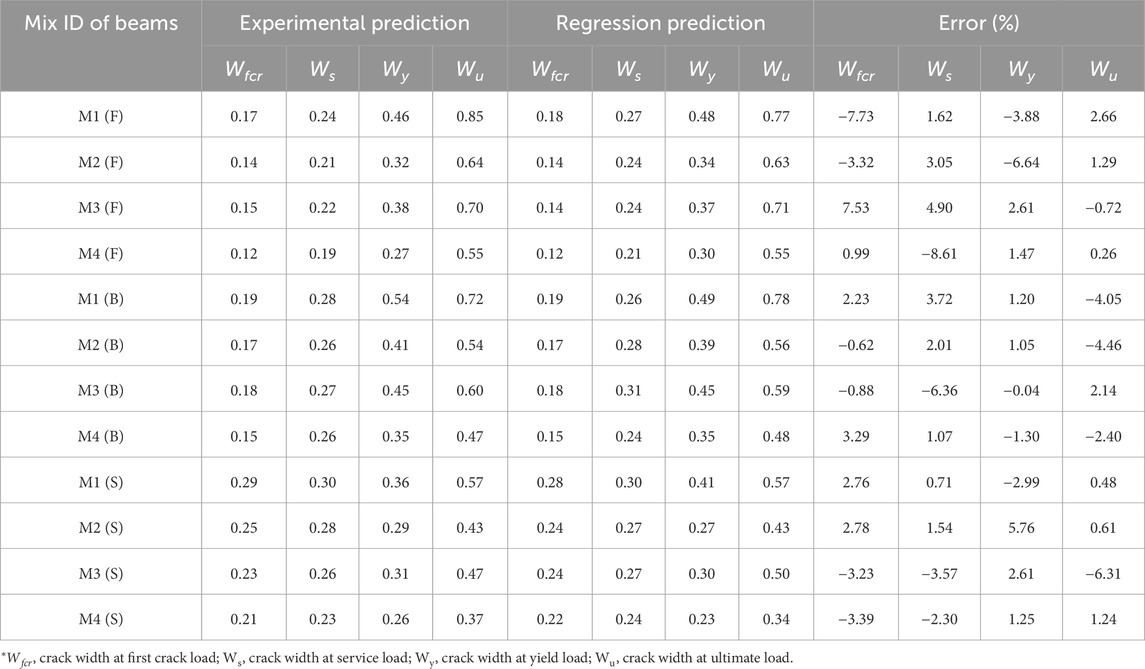
Table 12. Validation of crack width results between actual and predicted values with percentage error.

Figure 15. Comparison of experimental crack width with regression prediction. (a) First crack stage. (b) Service stage. (c) Yield stage. (d) Ultimate stage.
The predicted regression equations successfully match the experimental results, as seen by the low divergence from the regression line throughout several loading stages. The regression model is a useful tool for forecasting the flexural responses in reinforced concrete beams at different loading stages with high accuracy. Furthermore, the significant correlations suggest that experimental errors and material variability had little influence, supporting the reliability of the regression technique used and the consistency of the experimental results.
6 Sustainability and cost analysis
6.1 Energy conservation (Ec)
The sustainability index from the energy conservation (Ec) of each concrete mix was compared with the literature for Ec evaluations (Mithun and Narasimhan, 2016; Sharma and Khan, 2017; Siddique et al., 2019). Energy analysis of steel reinforcement was carried out from Mohsen and Akash (1998) as 4.7 MJ/kg of rebar (Table 13). In the present study, for each mix, four reinforced concrete beams were cast, and the weight of rebar used for each beam was approximately 15 kg. Hence, Ec by rebar for each concrete mix is calculated as 282 MJ/m3. A comparison of Ec parameters for insulator concrete mixtures is given in Table 13. The electrical energy consumption of the insulator powder blended cement calculated from Madlool et al. (2011) follows Equation 5, when n% of the cement is substituted with the insulator waste:
where Et is total energy consumption of the blend cement, Egri, c is the grinding energy consumption of cement clinkers, and Egri, ip is the grinding energy consumption of insulator powder. To forecast the grinding energy requirement, Equation 6 was used from Tokyay (1999) as
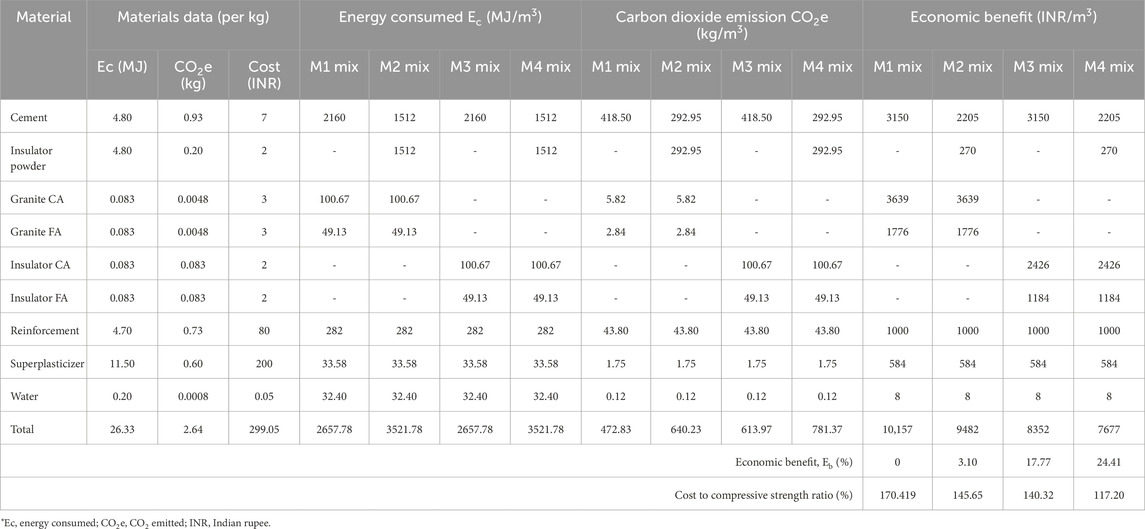
Table 13. Comparison of sustainability indices and cost–benefit analysis of reinforced insulator concrete.
In India in 2050, the specific electrical energy consumption of cement production will be Ec = 70 kWh/t (Energy Benchmarking for the Indian Cement Industry, 2021). The specific surface area (SSA) of insulator powder determines how much energy it uses, and it solely comes from the grinding process. Substitution of the SSA values of insulator (SSA = 4.49 m2/g) and cement (SSA = 4.79 m2/g) powder by Equation 6 obtains Egri, ip = 8.315 kWh/t and Egri, c = 8.327 kWh/t. By substituting the obtained grinding energy of insulator powder and cement in Equation 5 with 30% cement replaced by insulator powder, the total electrical energy consumption is Et = 8%. Insulator concrete mix M4 produced an effective Ec of 1577.98 MJ/m3. Similarly, 15% waste marble and 20% ceramic powder replacement of cement had a total energy consumption of 1.05% and 6.62% from Singh et al. (2017) and Le et al. (2020), respectively, which is lower than the value obtained in present study. For both cement and insulator powder, the specific electrical energy grinding energy ratio is 12%. This is consistent with data presented in Madlool et al. (2011).
6.2 CO2 emission control (CO2e)
The sustainability index from CO2 emissions (CO2e) of each concrete mix was compared to the literature on CO2e (Mithun and Narasimhan, 2016; Sharma and Khan, 2017; Siddique et al., 2019). CO2e analysis of steel reinforcement was performed as per Lee and Lee (2023) as 0.73 kg/kg of rebar (Table 13). In the present study, four reinforced concrete beams were cast for each mix, and the weight of rebars used for each beam was approximately 15 kg. Hence, CO2e by rebar for each concrete mix is calculated as 43.80 kg/m3.
The comparison of CO2e for insulator concrete mixtures is given in Table 13. Insulator concrete mix M4 produced effective CO2e of 781.37 kg/m3. Every ton of cement produced a considerable amount of NOx, SOx, and nanoparticles (Horinko, 2003; Mohit and Sharifi, 2019) emitted together with approximately 0.9 tons of CO2. Utilizing industrial byproducts in the construction industry is one workable way of addressing these environmental issues (Horinko, 2003). Ceramic powder must be utilized beneficially to prevent landfill disposal because of its lack of biodegradability (Xu et al., 2021). In addition to providing major environmental advantages, adding up to 50% ceramic waste powder to mortar production can improve its compressive strength and durability (Kannan et al., 2017; Xu et al., 2021).
6.3 Economic benefit (Eb)
In India, insulator waste from the industrial sectors is freely accessible. However, the projected cost of treating insulator waste for this study was 2 rupees/kg. The cost analysis is based on current market prices at the local project location (cement: 350 rupees/bag; coarse and fine aggregates: 3 rupees/kg; and steel reinforcement: 80 rupees/kg).
The cost analysis comparison for four different insulator concrete mixes is given in Table 13. The M4 mix achieves an effective cost-to-compressive-strength ratio of 117.20%. For 1 m3 of M4, an economic benefit (Eb) of 7677 rupees/m3 (24.41%) is estimated. Similarly, Siddique et al. (2019) investigated the cost–benefit analysis of concrete that substituted fine bone China ceramic waste for all fine aggregate and discovered cost savings of 814.47 rupees/m3 (14.86%) for concrete, which is 39.12% less than the current study’s M4.
7 Conclusion
The findings of regression analysis of flexural behavior along with sustainability-cum-cost analysis led to the following conclusions.
Regarding the mechanical properties and statistical analysis prediction of insulator concrete, significantly higher mechanical properties were achieved by insulator concrete mix (M4) compared to the remaining mixes. The compressive strength of insulator concrete mixes M2 and M4 was increased by 9.13% and 9.92%, respectively, compared to reference concrete M1. There is no significant difference between the strength of M3 (insulator aggregate concrete) and M1 (granite aggregate concrete). The average increases in modulus of elasticity of M2, M3, and M4 were 3.75%, 2.24%, and 8.31%, respectively, compared to M1. The modulus of insulator concrete ranges from 45.28 GPa to 47.27 GPa, which is better than insulator aggregate concrete’s modulus of elasticity. For M4, the maximum modulus of elasticity of 47.27 GPa was attained. Similarly, the lateral strain of the insulator concrete was 44.75% higher than the maximum allowable concrete strain suggested by IS456. Poisson’s ratio of insulator concrete varied from 0.22 to 0.24. The statistical analysis demonstrated that the mechanical properties of insulator concrete were significantly impacted with R2 (>98%) and CV (>5%).
Pertaining to the flexural behavior and regression-cum-statistical analysis prediction of reinforced insulator concrete beams, the moment capacity of insulator concrete bond and shear-reinforced beams increased to 8.69% and 15.87%, respectively. The service deflections of bond and shear-reinforced beams were decreased to 9.61% and 25%, respectively, due to the significant resistance offered by the C-S-H and C-H development in insulator concrete. The service crack widths of bond and shear-reinforced beams were decreased to 7.14% and 23.33%, respectively, due to the higher ΣP-95.46% present in the insulator powder. According to IS456, the theoretical prediction of crack width was conservative compared to experimental values. Therefore, the formula given in IS456 applies for insulator concrete.
In relation to sustainability and cost analysis, the effective eco-friendliness of insulator concrete (M2 and M4 mixes) can balance the environmental protection by effective energy conservation (Ec) of 24.53% and reduce carbon dioxide emission (CO2e) by 39.48%. The cost analysis shows that M4 can benefit the economy 24.41% by lowering the overall cost of concrete production with an effective cost-to-compressive-strength ratio of 117.20%. These key results show that insulator concrete beams (flexure, bond, and shear types of reinforced) shows improved enhancement in bending stress resistance, controlled deflection, and crack width due to the combination of insulator waste powder and aggregates.
8 Significance/practical implications
The material characteristics results indicate that the insulator aggregate and insulator powder properties are similar to those of granite aggregates and conventional Portland cement, respectively. The cost analysis outcomes of reinforced insulator concrete beams, flexural behavior, and mechanical characteristics of the material were all noticeably better than those of the reference concrete. The findings are valid for a range of insulator waste properties used in this study. Insulator waste may therefore be employed instead of being disposed of as industrial waste to create cost-effective, environmentally conscious, and sustainable building construction.
9 Limitations/recommendations
Depending on the origin of the insulator waste obtained, the results achieved may not be the same as the behavior of concrete produced with insulator waste from different sources. The present study serves as a foundation for additional verification of findings about the flexural behavior of reinforced concrete beams using finite element modeling.
Data availability statement
The original contributions presented in the study are included in the article/supplementary material, further inquiries can be directed to the corresponding author.
Author contributions
RR: Conceptualization, Data curation, Formal Analysis, Investigation, Methodology, Resources, Visualization, Writing – original draft. SS: Conceptualization, Funding acquisition, Project administration, Supervision, Validation, Visualization, Writing – review and editing.
Funding
The authors declare that no financial support was received for the research and/or publication of this article.
Acknowledgements
The authors wish to thank the Vellore Institute of Technology, Vellore, for providing all testing facilities to complete this study and publication of papers in referred journals.
Conflict of interest
The authors declare that the research was conducted in the absence of any commercial or financial relationships that could be construed as a potential conflict of interest.
Generative AI statement
The authors declare that no Generative AI was used in the creation of this manuscript.
Any alternative text (alt text) provided alongside figures in this article has been generated by Frontiers with the support of artificial intelligence and reasonable efforts have been made to ensure accuracy, including review by the authors wherever possible. If you identify any issues, please contact us.
Publisher’s note
All claims expressed in this article are solely those of the authors and do not necessarily represent those of their affiliated organizations, or those of the publisher, the editors and the reviewers. Any product that may be evaluated in this article, or claim that may be made by its manufacturer, is not guaranteed or endorsed by the publisher.
References
Abou Rachied, T., Dbouk, F., Hamad, B., and Assaad, J. J. (2023). Structural behavior of beams cast using normal and high strength concrete containing blends of ceramic waste powder and blast furnace slag. Clean. Mater. 7, 100179. doi:10.1016/j.clema.2023.100179
ACI 318 Part-2 (2002). Building-Code-for-Structural-Concrete. Farmington Hills, MI: American Concrete Institute (ACI).
Aksoylu, C., Özkılıç, Y. O., Bahrami, A., Yıldızel, S. A., Hakeem, I. Y., Özdöner, N., et al. (2023). Application of waste ceramic powder as a cement replacement in reinforced concrete beams toward sustainable usage in construction. Case Stud. Constr. Mater. 19, e02444. doi:10.1016/j.cscm.2023.e02444
AlArab, A., Hamad, B., Chehab, G., and Assaad, J. J. (2020). Use of ceramic-waste powder as value-added pozzolanic material with improved thermal properties. J. Mater. Civ. Eng. 32, 04020243. doi:10.1061/(asce)mt.1943-5533.0003326
Anderson, D. J., Smith, S. T., and Au, F. T. K. (2016). Mechanical properties of concrete utilising waste ceramic as coarse aggregate. Constr. Build. Mater. 117, 20–28. doi:10.1016/j.conbuildmat.2016.04.153
Ashour, S. A. (2000). Effect of compressive strength and tensile reinforcement ratio on flexural behavior of high-strength concrete beams. Eng. Struct. 22, 413–423. doi:10.1016/s0141-0296(98)00135-7
ASTM C1274:2020 Part-12 (2020). Standard test method for advanced ceramic specific surface area by physical adsorption. West Conshohocken, PA: ASTM International. doi:10.1520/C1274-12R20
ASTM C469 Part-2 (2009). Standard test method for static modulus of elasticity and poisson’s ratio of concrete in compression. United States: ASTM International. Available online at: www.astm.org.
ASTM C618 Part-3 (2003). Standard specification for coal fly ash and raw or calcined natural pozzolan for use in concrete. Available online at: www.astm.org.
ASTM E1621-Part-22 (2022). Standard guide for elemental analysis by wavelength dispersive X-Ray fluorescence spectrometry. West Conshohocken, PA: ASTM International. doi:10.1520/E1621-22
ASTM E3294 Part-22 (2022). Standard guide for forensic analysis of geological materials by powder X-Ray diffraction. West Conshohocken, PA: ASTM International. doi:10.1520/E3294-22
Awoyera, P. O., Akinmusuru, J. O., and Ndambuki, J. M. (2016). Green concrete production with ceramic wastes and laterite. Constr. Build. Mater 117, 29–36. doi:10.1016/j.conbuildmat.2016.04.108
Balakrishnan, A., Raghunath, P. N., and Suguna, K. (2023). Regression based evaluation of high-grade RC beams with hybrid confinement. Mater Today Proc. 80, 2744–2752. doi:10.1016/j.matpr.2021.07.031
Ebrahimi, M., Eslami, A., Hajirasouliha, I., Ramezanpour, M., and Pilakoutas, K. (2023). Effect of ceramic waste powder as a binder replacement on the properties of cement- and lime-based mortars. Constr. Build. Mater 379, 131146. doi:10.1016/j.conbuildmat.2023.131146
EN 1992 (1-1) (2004). Design of concrete structures. Brussels, Belgium: European Committee for Standardization (CEN)
Energy Benchmarking for the Indian Cement Industry (2021). Energy benchmarking for the Indian cement industry. Hydrabad.
Gunasekaran, K., Annadurai, R., and Kumar, P. S. (2013). Study on reinforced lightweight coconut shell concrete beam behavior under flexure. Mater. Des. 46, 157–167. doi:10.1016/j.matdes.2012.09.044
Higashiyama, H., Yagishita, F., Sano, M., and Takahashi, O. (2012). Compressive strength and resistance to chloride penetration of mortars using ceramic waste as fine aggregate. Constr. Build. Mater. 26, 96–101. doi:10.1016/j.conbuildmat.2011.05.008
Higashiyama, H., Sappakittipakorn, M., Mizukoshi, M., and Takahashi, O. (2014). Efficiency of ground granulated blast-furnace slag replacement in ceramic waste aggregate mortar. Cem. Concr. Compos. 49, 43–49. doi:10.1016/j.cemconcomp.2013.12.014
Huseien, G. F., Sam, A. R. M., Shah, K. W., and Mirza, J. (2020). Effects of ceramic tile powder waste on properties of self-compacted alkali-activated concrete. Constr. Build. Mater. 236, 117574. doi:10.1016/j.conbuildmat.2019.117574
IS 10262:2019 (2019). Concrete mix proportioning-guidelines. Second Revision. New Delhi: Bureau of Indian Standards. Available online at: www.standardsbis.in.
IS 12269:2013 (2013). Specification for 53 grade ordinary Portland cement. New Delhi: Bureau of Indian Standards.
IS 2386:1963 Part-1 (1963). Methods of test for aggregates for concrete: particle size and shape. New Delhi.
IS 2386:1963 Part-3 (1963). Methods of test for aggregates for concrete: specific gravity, density, voids, absorption and bulking. New Delhi.
IS 2386:1963 Part-4 (1963). Methods of test for aggregates for concrete: mechanical properties. New Delhi.
IS 383:2016 (2016). Specification for coarse and fine aggregates from natural sources for concrete. New Delhi: Bureau of Indian Standards.
IS 4031:1988 Part-11 (1988). Methods of physical tests for hydraulic cement: determination of density. New Delhi: Bureau of Indian Standards.
IS 456:2000 (2000). Plain and reinforced concrete – code of practice. New Delhi: Bureau of Indian Standards.
IS 516:2004 (2004). Methods of tests for strength of concrete. New Delhi: Bureau of Indian Standards.
IS 7320:1974 Reaffirmed 2008 (1974). Specification for concrete slump test apparatus. New Delhi: Bureau of Indian Standards.
ISO 22412:2017 (2017). Particle size analysis-dynamic light scattering. Switzerland: ISO. Available online at: www.iso.orgiTehSTANDARDPREVIEW.
Jang, H. S., and So, S. Y. (2015). The properties of cement-based mortar using different particle size of grinding waste insulator powder. J. Build. Eng. 3, 48–57. doi:10.1016/j.jobe.2015.06.007
Kannan, D. M., Aboubakr, S. H., EL-Dieb, A. S., and Reda Taha, M. M. (2017). High performance concrete incorporating ceramic waste powder as large partial replacement of Portland cement. Constr. Build. Mater. 144, 35–41. doi:10.1016/j.conbuildmat.2017.03.115
Karalar, M., Özkılıç, Y. O., Aksoylu, C., Sabri Sabri, M. M., Beskopylny, A. N., Stel’makh, S. A., et al. (2022). Flexural behavior of reinforced concrete beams using waste marble powder towards application of sustainable concrete. Front. Mater 9, 1068791. doi:10.3389/fmats.2022.1068791
Kumar, P. S., Mannan, M. A., Kurian, V. J., and Achuytha, H. (2007). Investigation on the flexural behaviour of high-performance reinforced concrete beams using sandstone aggregates. Build. Environ. 42, 2622–2629. doi:10.1016/j.buildenv.2006.06.015
Le, L., Wenfeng, L., Qinxi, Y., Mengcheng, C., and Qiang, Z. (2020). Waste ceramic powder as a pozzolanic supplementary filler of cement for developing sustainable building materials. J. Clean. Prod. 259, 120853. doi:10.1016/j.jclepro.2020.120853
Lee, S.-Y., and Lee, T.-H. (2023). Carbon emission reductions of GFRP reinforced concrete bridges in replacement of steel rebars. Int. J. Eng. Res. Mech. Civ. Eng. (IJERMCE) 10, 2456–1290.
Madlool, N. A., Saidur, R., Hossain, M. S., and Rahim, N. A. (2011). A critical review on energy use and savings in the cement industries. Renew. Sustain. Energy Rev. 15, 2042–2060. doi:10.1016/j.rser.2011.01.005
Miranda, M. P., Morsch, I. B., Brisotto, D. de S., Bittencourt, E., and Carvalho, E. P. (2021). Steel-concrete bond behavior: an experimental and numerical study. Constr. Build. Mater. 271, 121918. doi:10.1016/j.conbuildmat.2020.121918
Mithun, B. M., and Narasimhan, M. C. (2016). Performance of alkali activated slag concrete mixes incorporating copper slag as fine aggregate. J. Clean. Prod. 112, 837–844. doi:10.1016/j.jclepro.2015.06.026
Mohit, M., and Sharifi, Y. (2019). Ceramic waste powder as alternative mortar-based cementitious materials. ACI Mater. J. 116, 107–116. doi:10.14359/51716819
Mohsen, M. S., and Akash, B. A. (1998). Energy analysis of the steel making industry. Int. J. Energy Res. 22, 1049–1054. doi:10.1002/(SICI)1099-114X(19981010)22:12<1049::AID-ER422>3.0.CO;2-W
Naenudon, S., Wongsa, A., Ekprasert, J., Sata, V., and Chindaprasirt, P. (2023). Enhancing the properties of fly ash-based geopolymer concrete using recycled aggregate from waste ceramic electrical insulator. J. Build. Eng. 68, 106132. doi:10.1016/j.jobe.2023.106132
Pereira, V. M., Geraldo, R. H., Baldusco, R., and Camarini, G. (2022). Porcelain waste from electrical insulators in self-leveling mortar: materials characterization and properties. J. Build. Eng. 61, 105297. doi:10.1016/j.jobe.2022.105297
Qian, H., Umar, M., Nasir Ayaz Khan, M., Shi, Y., Manan, A., Raza, A., et al. (2024). A state-of-the-art review on shape memory alloys (SMA) in concrete: mechanical properties, self-healing capabilities, and hybrid composite fabrication. Mater. Today Commun. 40, 109738. doi:10.1016/j.mtcomm.2024.109738
Rajasekaran, A., Raghunath, P. N., and Suguna, K. (2008). Assessment of FRP confined RC columns using regression analysis. Int. J. Appl. Eng. Res. 1, 1443–1452.
Rajkumar, R., Umamaheswari, N., Kumar, A., Kumar, M., Vineeth Gupta, L. R., and Pandey, R. (2018). “Flexural behaviour of reinforced concrete beams with partial replacements of metakaolin and marble powder,” in Materials today: proceedings (Elsevier Ltd), 550–555. doi:10.1016/j.matpr.2020.03.111
Samadi, M., Baghban, M. H., Kubba, Z., Faridmehr, I., Abdul Shukor Lim, N. H., Benjeddou, O., et al. (2022). Flexural behavior of reinforced concrete beams under instantaneous loading: effects of recycled ceramic as cement and aggregates replacement. Buildings 12, 439. doi:10.3390/buildings12040439
Sekar, S. K., Ranjith, R., and Prasanth, S. (2025). Sustainable concrete matrix using ceramic electrical insulator waste as binder and filler-performance under elevated temperature. World J. Eng. doi:10.1108/WJE-06-2025-0428
Senthamarai, R. M., and Manoharan, P. D. (2005). Concrete with ceramic waste aggregate. Cem. Concr. Compos. 27, 910–913. doi:10.1016/j.cemconcomp.2005.04.003
Sethuraman, V. S., and Suguna, K. (2016). “Regression based analysis and visualization of for identifying flexural behaviour of M60 beams under repeated compressive LOAD based on observational data sets,” in Procedia computer science (Elsevier B.V.), 264–269. doi:10.1016/j.procs.2016.05.159
Sharma, R., and Khan, R. A. (2017). Sustainable use of copper slag in self compacting concrete containing supplementary cementitious materials. J. Clean. Prod. 151, 179–192. doi:10.1016/j.jclepro.2017.03.031
Siddique, S., Chaudhary, S., Shrivastava, S., and Gupta, T. (2019). Sustainable utilisation of ceramic waste in concrete: exposure to adverse conditions. J. Clean. Prod. 210, 246–255. doi:10.1016/j.jclepro.2018.10.231
Singh, M., Choudhary, K., Srivastava, A., Singh Sangwan, K., and Bhunia, D. (2017). A study on environmental and economic impacts of using waste marble powder in concrete. J. Build. Eng. 13, 87–95. doi:10.1016/j.jobe.2017.07.009
Tokyay, M. (1999). Effect of chemical composition of clinker on grinding energy requirement. Cem. Concr. Res. 29, 531–535. doi:10.1016/s0008-8846(98)00219-1
Umar, M., Qian, H., Khan, M. N. A., Siddique, M. S., Almujibah, H., A. Elshekh, A. E., et al. (2024). Strength and durability of concrete with bentonite clay and quarry dust. Front. Mater. 11, 1458836. doi:10.3389/fmats.2024.1458836
Umar, M., Qian, H., Ali, M. F., Yifei, S., Raza, A., and Manan, A. (2025a). Self-healing and flexural performance of SMA fiber-reinforced ECC under freeze-thaw and chloride salt exposure. Constr. Build. Mater. 478, 141344. doi:10.1016/j.conbuildmat.2025.141344
Umar, M., Qian, H., Ali, M. F., Yifei, S., Raza, A., Manan, A., et al. (2025b). Self-recovery and mechanical behavior of SMAF-ECC under monotonic and cyclic tensile loading with constitutive model. Constr. Build. Mater. 460, 139840. doi:10.1016/j.conbuildmat.2024.139840
Wang, Y., Huang, H., Zeng, J., Hu, W., and Cheng, Y. (2023). Axial compressive behavior of recycled ceramic coarse aggregate concrete-filled steel tubular columns. J. Constr. Steel Res. 210, 108040. doi:10.1016/j.jcsr.2023.108040
Xu, K., Huang, W., Zhang, L., Fu, S., Chen, M., Ding, S., et al. (2021). Mechanical properties of low-carbon ultrahigh-performance concrete with ceramic tile waste powder. Constr. Build. Mater. 287, 123036. doi:10.1016/j.conbuildmat.2021.123036
Keywords: insulator waste, reinforced concrete, flexural behavior, regression analysis, sustainability analysis, cost analysis
Citation: R. R and S. K. S (2025) Regression-based evaluation of the flexural response of reinforced concrete beams made with sustainable electrical insulator waste. Front. Built Environ. 11:1690642. doi: 10.3389/fbuil.2025.1690642
Received: 22 August 2025; Accepted: 23 October 2025;
Published: 02 December 2025.
Edited by:
Mario Fagone, University of Florence, ItalyReviewed by:
Salvatore Verre, University of eCampus, ItalyMuhammad Umar, Zhengzhou University, China
Copyright © 2025 R. and S. K. This is an open-access article distributed under the terms of the Creative Commons Attribution License (CC BY). The use, distribution or reproduction in other forums is permitted, provided the original author(s) and the copyright owner(s) are credited and that the original publication in this journal is cited, in accordance with accepted academic practice. No use, distribution or reproduction is permitted which does not comply with these terms.
*Correspondence: Sekar S. K., c2tzZWthckB2aXQuYWMuaW4=