- 1Civil Engineering Department, College of Engineering, University of Sulaimani, Sulaymaniyah, Kurdistan Region, Iraq
- 2Vibrance Engineering Research Center, Sulaymaniyah, Kurdistan Region, Iraq
Fiber-reinforced polymer (FRP) bars are gaining prominence in civil infrastructure due to their high strength-to-weight ratio, corrosion resistance, and low thermal conductivity. The bond strength (BS) between FRP bars and concrete, which is influenced by surface treatments like sand-coating or ribbing, plays a critical role in ensuring structural performance and durability. This study aims to predict the bond strength of different FRP bar types and surface characteristics in concrete using machine learning models. A total of 416 datasets from standard pull-out tests were collected and statistically analyzed, considering variables such as bar type, surface treatment, concrete compressive strength, bar diameter, bonded length, concrete cover, and FRP bar tensile properties. Two machine learning models, Artificial Neural Networks (ANN) and Extreme Gradient Boosting (XGBoost) were developed for bond strength prediction. Model performance was evaluated using Root Mean Squared Error (RMSE), Correlation Coefficient (R), and Scatter Index (SI). XGBoost demonstrated superior performance with lower RMSE and SI, and higher R values in 5-fold cross-validation. Sensitivity analysis identified concrete compressive strength as the most significant input in bond strength prediction. Additionally, main effect plots and Analysis of Variance (ANOVA) tests were conducted to further investigate the relationships between variables. These findings contribute to a more accurate understanding of FRP bar-concrete interactions, facilitating the optimization of structural design.
1 Introduction
Fiber Reinforced Polymer (FRP) bars have become a key innovation in concrete construction, offering solutions to many of the limitations associated with traditional steel reinforcement (Teng et al., 2012). FRP bars exhibit exceptional resistance to corrosion rather than steel (Duo et al., 2021), making them particularly valuable in harsh environments prone to chemical exposure, such as bridges and marine facilities, where durability and longevity are critical (Tatar and Milev, 2021). This corrosion resistance not only extends the lifespan of structures but also lowers maintenance costs and enhances long-term structural integrity (Younis et al., 2018; Lau et al., 2016).
A critical factor in the performance and safety of FRP-reinforced concrete structures is the bond strength between FRP bars and concrete (Nepomuceno et al., 2021). This bond strength determines the efficiency of load transfer between the concrete and the reinforcement (Pan and Leung, 2007), directly influencing structural behavior under various loading conditions. Adequate bond strength is essential to prevent premature failures such as delamination or pull-out of the reinforcement, ensuring that the structural components function as intended. Therefore, accurately predicting and understanding bond strength is crucial for the safe design of FRP-reinforced concrete structures, allowing engineers to leverage the unique properties of FRP materials effectively.
Predicting the bond strength of FRP bars in concrete is challenging due to the complex interaction of various factors (Li et al., 2022). Previous studies have extensively investigated the bond behavior of FRP bars in concrete, these studies have largely emphasized the role of concrete strength (Baena et al., 2009; Lee et al., 2008; Soong et al., 2011), bar properties (Cosenza et al., 1997; Ahmad et al., 2011; Tepfers, 2006), bonded length (Cosenza et al., 2002; Mazaheripour et al., 2013), and FRP surface textures (Solyom and Balázs, 2020).
Machine learning has emerged as a powerful tool in civil engineering, particularly for addressing complex and multifactorial problems like bond strength prediction (Wang et al., 2022). These models excel at detecting nonlinear relationships and patterns within large datasets (Suthaharan, 2016), surpassing traditional models in their ability to generalize across diverse conditions. By learning from new data continuously, machine learning models can improve prediction accuracy significantly, making them particularly promising for predicting the bond strength of FRP bars in concrete (Liu et al., 2019).
Machine learning can handle the inherent complexity of the bond strength problem compared to analytical and numerical models which are often constrained by the specific experimental conditions under which the data were collected, limiting their applicability to a broader range of scenarios or materials not included in the original datasets and often rely on simplifications (Mashrei et al., 2013). By avoiding oversimplifications, machine learning models offer the potential for more reliable and versatile predictions. For instance, Basaran et al. (2021) demonstrated the utility of machine learning in predicting bond strength using various methods, highlighting its potential in this domain. Their research focused on the bond strength and development length of FRP bars in concrete, analyzing experimental findings against predictions from various international codes and machine learning methods including: Gaussian Process Regression (GPR), Artificial Neural Networks (ANN), Support Vector Machines Regression (SVMR), Regression Tree, and Multiple Linear Regression (MLR). A total 432 datasets were used in their study in model developments for prediction of bond strength of FRP bar using pull-out specimens, input parameters including reinforcement types, only four surface treatments, position of bar, bar diameter, square root of compressive strength, cover and bonded length to bar diameter ratios were considered. The results of the predictive models were compared with other methods available in the literature, including ACI 440.1R-15, CSA S6, CSA S806, and JSCE 1997. The models developed in that study, particularly the GPR models, outperformed other methods.
Furthermore, to examine the impact of different bar surface types on bond properties, Wang et al. (2024) compiled a database of 407 pull-out test results for FRP bars with various surface types—sand-coated (SC), helically wrapped (HW), ribbed (RB), and indented (IN)—from existing researches. Analysis of the database reveals that factors such as concrete compressive strength, concrete cover, embedment length, and bar diameter exert a more significant influence on the bond properties of deformed bars (HW, RB, IN) compared to SC bars. Moreover, these factors exhibit a moderate impact on HWSC and INSC bars due to their composite surface treatments. Lastly, the study evaluates the performance of several existing models for predicting the bond strength between FRP bars and concrete, and proposes a new model incorporating geometrical factors to better capture the effects of bar surface characteristics, resulting in more accurate predictions of the test results.
Additionally, for prediction of FRP bond strength in a different type of concrete, Tang et al. (2024) conducted a study utilizing machine learning (ML) techniques to predict the failure mode and bond stress in Fiber Reinforced Polymer (FRP) bars embedded in coral aggregate concrete (CAC). They analyzed a dataset comprising 221 FRP bars and CAC, testing six supervised ML models: Artificial Neural Network (ANN), Decision Tree, K-Nearest Neighbors (KNN), Random Forest, Support Vector Machine (SVM), and eXtreme Gradient Boosting Trees (XGBoost) includes factors such as the type, diameter (d), bond length, rib height (Rh), surface sand coating (Surface), tensile strength (ftu), and elastic modulus (Etu) of the FRP bars. Additionally, the cubic compressive strength of CAC (fcu) and their bond lengths (Lb) are taken into account. Moreover, to assess the effects of mix proportions on chemical adhesion and friction, the proportions of Ordinary Portland Cement (OPC), coarse aggregate (Coral stone), and fine aggregate (Coral sand) are also included as input features. Their evaluation of the models’ ability to predict failure modes through confusion matrices highlighted the Random Forest model as having the highest classification accuracy. For bond strength predictions, the ML models demonstrated superior precision compared to three existing empirical methods, with XGBoost and KNN identified as the most effective based on five regressions performance metrics. Additionally, the application of the Shapley Additive Explanation (SHAP) method revealed significant contributions of specific features—such as rib height, diameter, and bond length of FRP bars to failure mode, and compressive strength of CAC, rib height, and bond length to bond strength.
Review of the existing literature highlights the need for developing more accurate predictive models to estimate the bond strength of FRP bars in concrete, considering critical factors such as the bar’s surface characteristics and the type of fiber used. Current empirical equations in the literature are limited, as many do not account for variations in bar type or surface characteristics, reducing their generalizability and predictive accuracy. This gap underscores the necessity for advanced models, such as Artificial Neural Networks (ANNs) and XGBoost, which can capture complex non-linear relationships and interactions among multiple factors, providing more reliable predictions across a wider range of FRP bar types and surfaces.
1.1 Objectives
The primary objectives of this study are summarized as follows.
1. Develop a comprehensive machine learning model that enhances the prediction accuracy of FRP bar bond strength in concrete by including surface type of the bar and the fiber type as input parameters.
2. Compare the performance of the developed model against existing methods and international codes, quantifying improvements in predictive reliability and consistency.
3. Use advanced statistical tools to identify and analyze key factors affecting bond strength variability, enhancing understanding of their interactions within the model.
2 Methods and materials
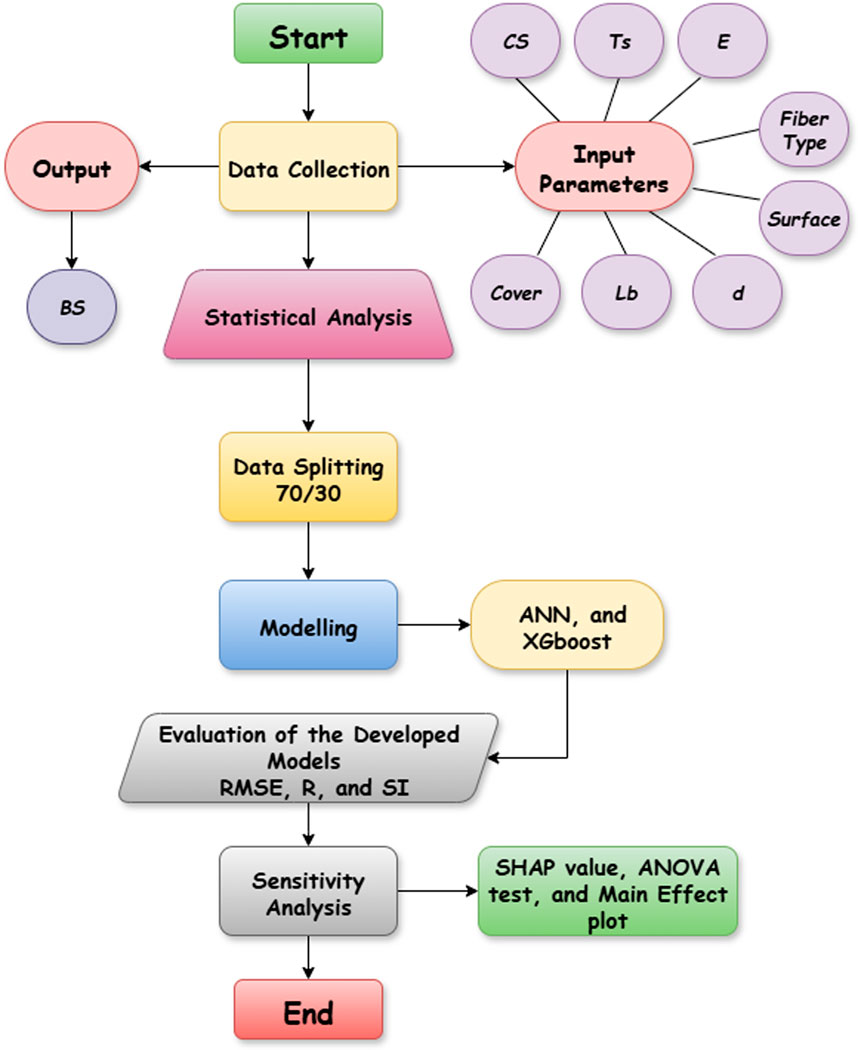
This section outlines the methodology employed to assess the bond strength of various Fiber-Reinforced Polymer (FRP) bar types with different surface characteristics in concrete, focusing on data collection, statistical analysis, and modeling. Furthermore, Figure 1 depicts the methodology flowchart of the current study.
2.1 Data collection
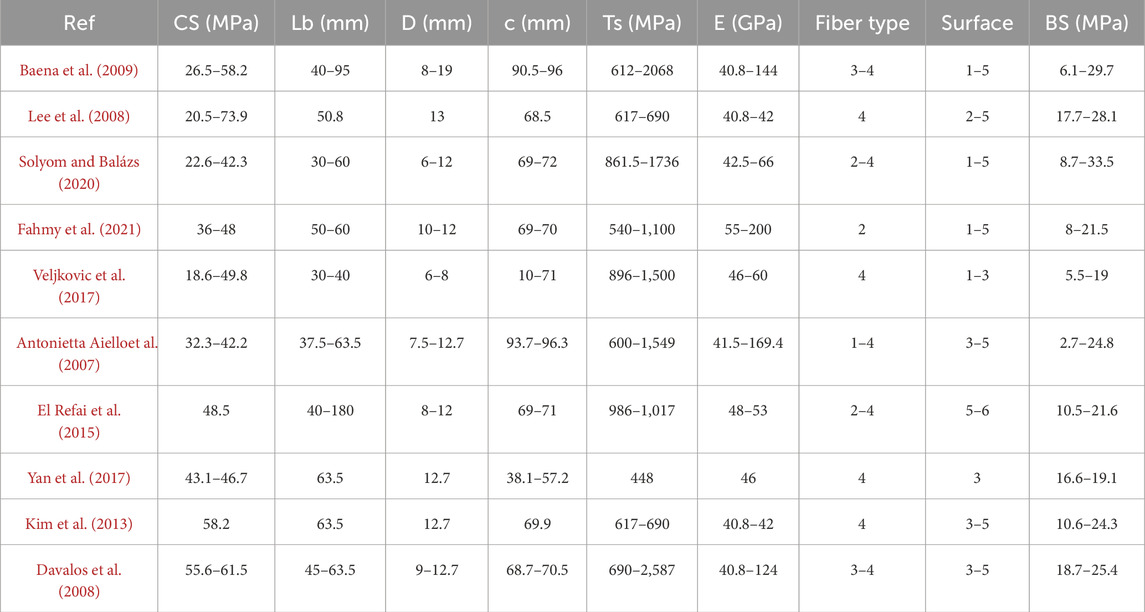
A comprehensive literature review was conducted to gather existing data on bond strength between FRP bars and concrete from (Baena et al., 2009; Lee et al., 2008; Solyom and Balázs, 2020; Fahmy et al., 2021; Veljkovic et al., 2017; Antonietta Aiello et al., 2007; El Refai et al., 2015; Yan et al., 2017; Kim et al., 2013; Davalos et al., 2008) as summarized in Table 1. Peer-reviewed journals were sourced to compile relevant findings related to different types of FRP materials (aramid, basalt, carbon, and glass) denoted as 1, 2, 3, and 4 and various surface treatment techniques (e.g., Grooved (GR), Helically Wrapped (HR), Helically Wrapped and sand coated (HR + SC), and ribbed (RB), Sand Coated (SC), and Grooved and Sand Coated (GR + SC) surfaces) which are labeled as 1 to 6. Percentage of data for each fiber type and surface characteristics for training and testing datasets can be seen in Figure 2.
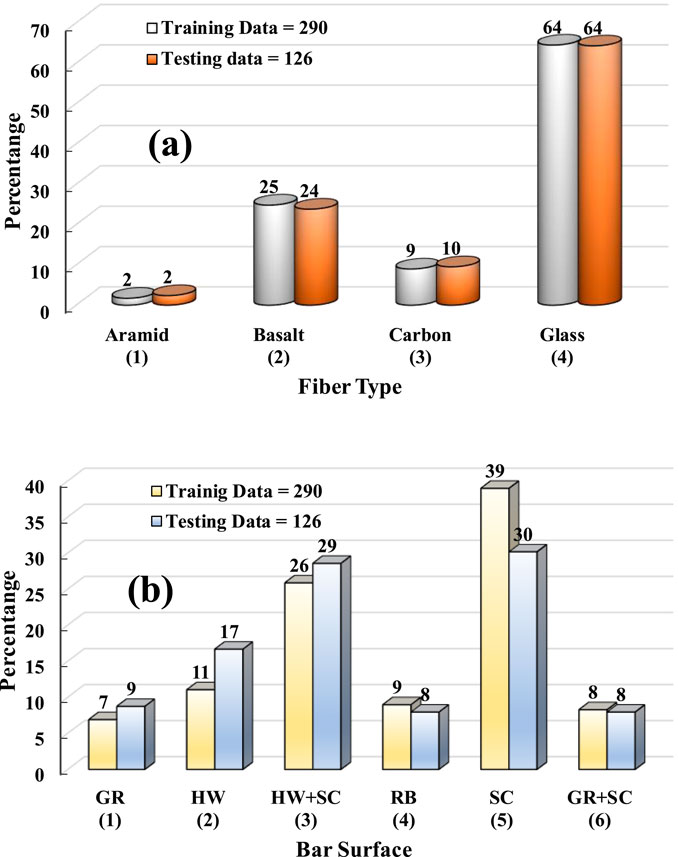
Figure 2. Percentage of data in training and testing datasets based on (a) fiber type and (b) bar surface.
2.2 Data extraction
From the selected studies, key variables were extracted, including: Type of FRP bar (Fiber Type), Surface treatment applied (Surface), concrete compressive strength (CS), diameter of the bar (d), bonded length (Lb), cover (c), tensile strength (Ts) and modulus of elasticity (E) of the FRP bar, and measured bond strength values. A systematic approach was used to ensure that the data extracted was consistent across studies, allowing for meaningful comparisons. In this analysis, the compressive strength (CS) of cylindrical specimens of 150 × 300 mm was recorded. When encountering data records with compressive strength measurements that deviated from the standard 150 × 300 mm cylinders, conversion factors provided by Elwell and Fu (Elwell et al., 1995) were applied to adjust the CS values accordingly.
2.3 Database creation
All collected data were organized into a structured database, including relevant metadata for each study. This database served as the foundation for subsequent analyses and modeling. The total number of datasets utilized for training predictive models were 416, the splitting failure mode results were excluded from the database to represent actual bond strength of the FRP bars in concrete.
2.4 Statistical analysis
Descriptive statistics were performed on the compiled data to summarize bond strength values across different types of FRP bars and surface treatments, as summarized in Table 2. Key metrics such as means, standard deviation, kurtosis, skewness, minimum and maximum values were calculated to assess overall trends.
2.5 Modeling
In this study, ANN and XGBoost are employed as predictive models. ANN is included for its ability to capture complex non-linear relationships in the data, which may not be effectively modeled by simpler algorithms (Karibasappa and Kumar, 2024). Although, ANN typically performs best with larger datasets, recent studies have demonstrated their applicability even with small structured datasets when appropriately regularized (Hijazi et al., 2020). Additionally, XGBoost is selected for its robustness and high predictive performance on small to medium-sized tabular datasets, as it combines gradient boosting with regularization techniques to reduce overfitting (Lima Marinho et al., 2024). By using both models, we aim to leverage the flexibility of ANNs in capturing complex patterns and the proven accuracy and stability of XGBoost, thus enhancing predictive performance on a relatively small dataset.
2.5.1 Artificial neural network
Artificial Neural Networks (ANNs) are computational models designed to simulate the way the human brain processes information (Nwadiugwu, 2020). ANN composed of layers of interconnected nodes, or neurons. Typically includes an input layer, one or more hidden layers, and an output layer, allowing for the transformation of input data into desired outputs through weighted connections (Rumelhart et al., 1986). Moreover, it is robust at recognizing patterns and solving complex problems in a variety of fields, including image processing, speech recognition, and financial forecasting (Haykin, 2008; Dobrescu et al., 2014; Kamble, 2016; Egmont-Petersen et al., 2002).
The learning process in ANNs involves adjusting the weights of connections based on the difference between predicted and actual outputs, a technique known as backpropagation (Rumelhart et al., 1986). This iterative learning process enables ANNs to improve their accuracy over time and adapt to new data (Goodfellow et al., 2016). The versatility and scalability of ANNs have led to their widespread adoption across various fields including healthcare, autonomous systems, natural language processing, and increasingly in the construction industry (Akinosho et al., 2020; Ahmed et al., 2022). This broad applicability demonstrates their capacity to generalize from training data to unseen scenario (Basheer and Hajmeer, 2000).
2.5.2 XGboost
XGBoost (Extreme Gradient Boosting) is a powerful and efficient machine learning algorithm designed for structured data analysis. It is an implementation of gradient boosted decision trees, which combines the predictions of multiple weak learners to create a strong predictive model. XGBoost has gained immense popularity in data science competitions and industry applications due to its scalability, flexibility, and exceptional performance in handling large datasets with missing values and outliers (Chen and Guestrin, 2016; Nguyen et al., 2022).
One of the key features of XGBoost is its ability to perform regularization, which helps prevent overfitting and enhances model generalization. The algorithm employs a novel optimization technique that improves training speed and performance by leveraging parallel computing (Chen and Guestrin, 2016). Additionally, XGBoost supports a wide range of objective functions, making it versatile for tasks such as classification, regression, ranking, and applications related to predicting the mechanical behavior of structures (Dhaliwal et al., 2018; Tang et al., 2025; Yaqoob et al., 2024). Its reliability and accuracy have made XGBoost a popular choice among practitioners and researchers (Zhang et al., 2022). During model training, the predictions from previously built trees are incorporated into the training of the new tree to minimize loss through iterative updates (Zhang et al., 2025). The objective function is expressed in Equation 1:
where obj is the objective function;
2.6 Assessment of the developed models
To evaluate the performance of the predictive models for estimating bond strength between various Fiber-Reinforced Polymer (FRP) bars and concrete, several statistical metrics were employed.
2.6.1 Correlation coefficient (R)
Pearson correlation coefficient (R) is a statistical measure that quantifies the linear relationship between two variables. It ranges from −1 to 1 (Sedgwick, 2012), where 1 indicates a perfect positive linear relationship, −1 indicates a perfect negative linear relationship, and 0 indicates no linear relationship. The formula for R is shown in Equation 2:
Where; BSM and BSP are the observed values, are the predicted values, and
2.6.2 Root Mean Square Error (RMSE)
The RMSE measures the average magnitude of the prediction errors (Equation 3):
n is the number of observations. Lower RMSE values signify better model performance.
2.6.3 Scatter index (SI)
The scatter index normalizes the RMSE relative to the mean of the observed values (Equation 4):
A lower scatter index indicates more consistent predictions relative to the observed values. Additionally, SI < 0.1 shows excellent performance of the model. Moreover, the performance is good if 0.1 < SI < 0.2, fair if 0.2 < SI < 0.3, and poor performance if SI > 0.3 (Despotovic et al., 2016).
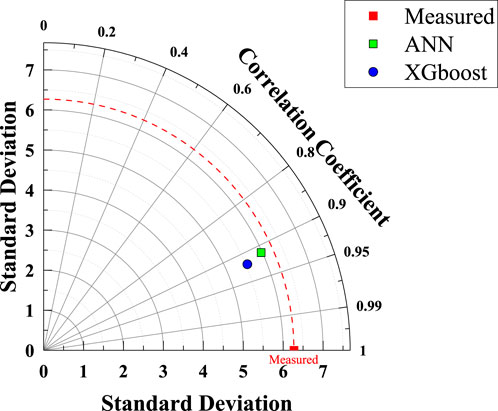
Moreover, five-fold cross-validation was used to assess the predictive performance of the developed models across different sections of the dataset. In each iteration, the training dataset was split into five parts, with the model trained on 80% of the data and tested on the remaining 20%. Additionally, a Taylor diagram was generated to simultaneously compare the standard deviation and correlation coefficients of the predicted bond strength values against the measured values.
3 Results and analysis
3.1 Statistical analysis
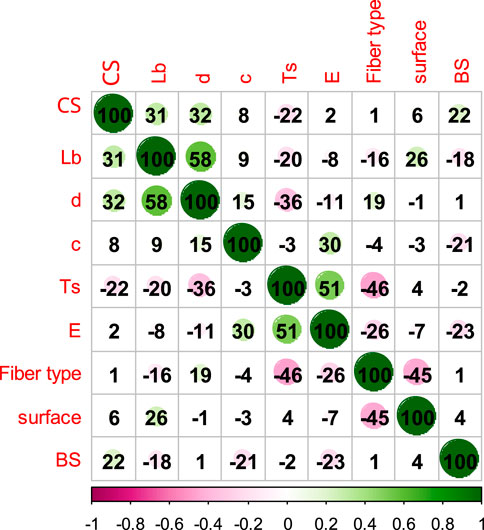
Table 2 shows the result of the statistical analysis on the collected data, correlation coefficient was also determined between the predictor and response variable to find possible correlation between the independent variables and the target value, as shown in Figure 3. The lower R values indicates that the bond strength of the FRP bar not possibly predicted using simple linear regression or other single predictor model due to non-linearity of the composite materials’ properties. Figure 4 show the marginal plot for scatter between bond strength and each input parameters with individual histogram of the variables.
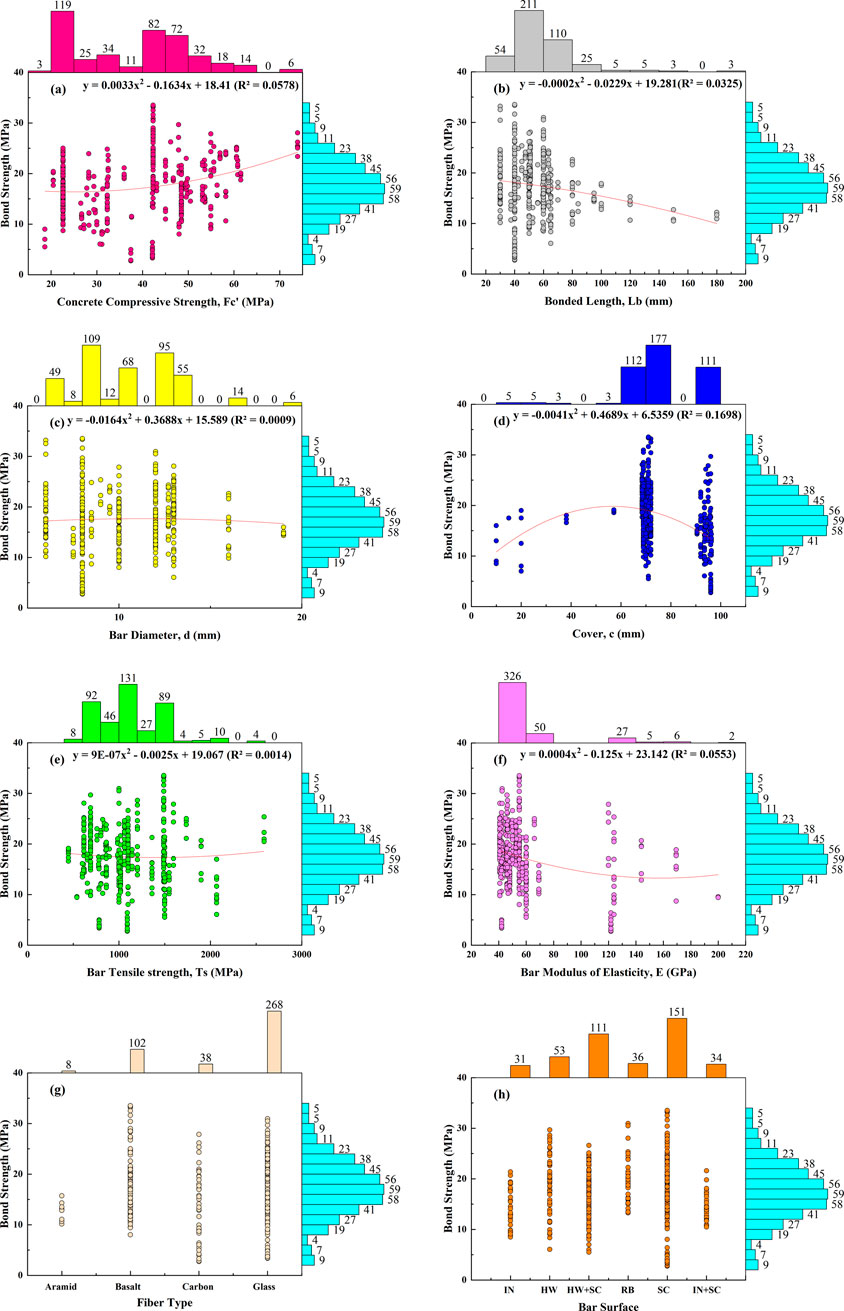
Figure 4. Marginal plot for histogram and scatterplot between BS and (a) CS, (b) Lb, (c) d, (d) c, (e) Ts, (f) E, (g) Fiber type, and (h) Bar surface.
3.2 Result of the developed model
In the following subsections the results of the developed models are presented, including the relationship between predicted and measured bond strength values, residual errors and comparison between evaluation metrices of the developed models.
3.2.1 ANN model
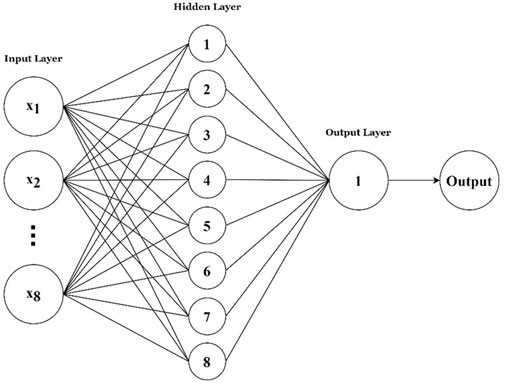
In this study, a single layer neural network was employed to predict the FRP bar bond strength values. Hidden neurons from 5–15 was examined to choose the best structure with best performance of the test dataset, as illustrated in Figure 5. From the examination result, 8 hidden neurons were selected based on the RMSE and R for the testing dataset, as shown in Figure 6. Random Logistic Sigmoid and pure linear activation functions were used in the hidden and output layers, respectively.
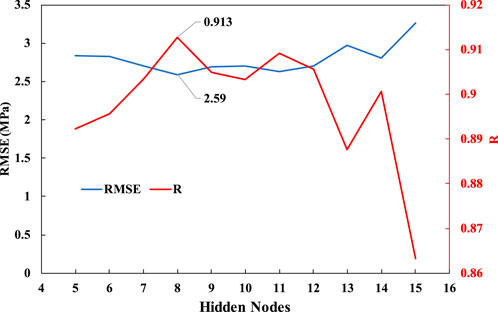
Figure 5. Performance of ANN model in the testing phase with single hidden layer and 5 to 15 hidden neurons based on RMSE and R.
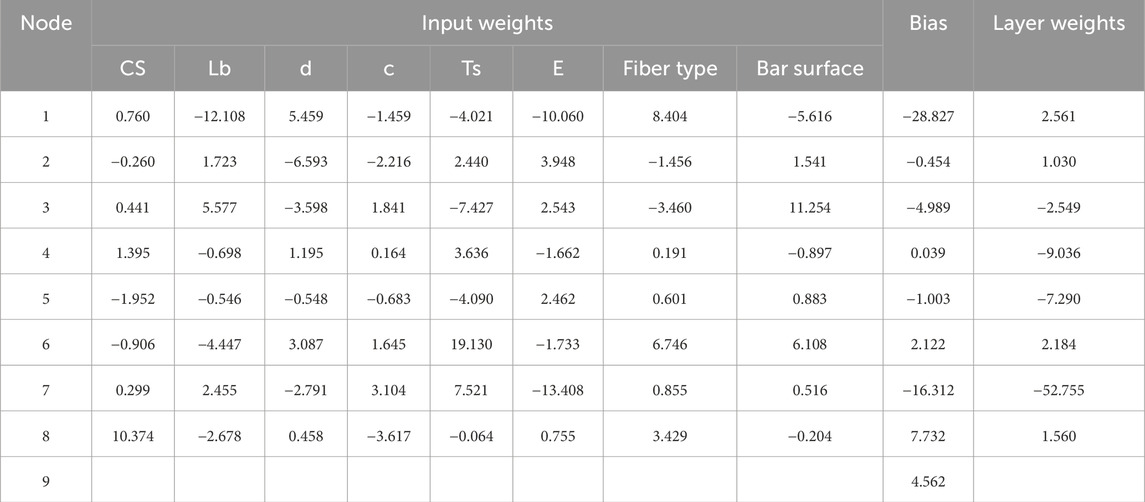
The scatter plot between measured and predicted bond strength using ANN model is shown in Figure 7, which include an error line of ±20% indicating that nearly over 80% of the prediction data are laid between these two lines. Additionally, the bond strength of FRP bar in concrete can be efficiently predicted using ANN model using weight and biases shown in Table 3 and Equations 5–7:
Where n is the total number of hidden nodes from 1 to 8.
3.2.2 XGboost model
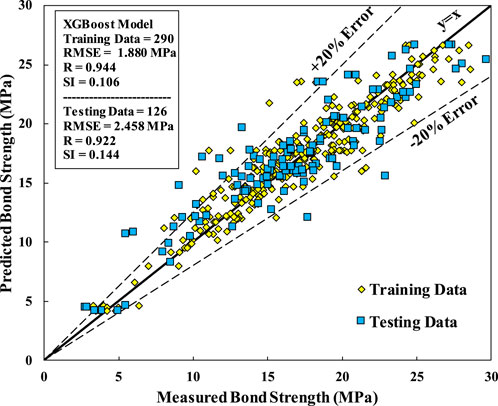
In the current study the XGboost model’s parameters were optimized to ensure robust predictions. The training parameters were carefully selected by grid search then manual tune to minimize overfitting while maximizing predictive accuracy using 5-fold cross validation. The result of hyperparameters were max_depth = 3, min_child_weight = 4, eta = 0.1, and gamma = 0.1, nround = 430. Figure 8 shows the relationship between measured and predicted bond strength. Additionally, the regression line and ±20% error bounds on the plot show most data points fall within acceptable prediction errors, emphasizing the model’s practical utility.
Moreover, the predictive performance of the XGBoost model for estimating FRP bar bond strength, was assessed. The model’s Root Mean Square Error (RMSE) of 1.880 MPa and a correlation coefficient (R) of 0.944 indicate a strong predictive accuracy. The Scatter Index (SI) value of 0.106 further demonstrates the model’s capability in capturing the data trend effectively.
Overall, the XGBoost model, through its optimal training parameters and performance metrics, exhibits robust predictive capability for estimating bond strength. A sample of XGboost tree is provided in Figure 9.
3.3 Comparison between performance of the developed model
Based on the evaluation metrices provided in Section 2.6, the developed models were evaluated and compared. XGboost model performed better than ANN model with 7% and 5% lower RMSE for training and testing datasets, respectively. Also, based on R between measured and predicted bond strength the Xgboost model is better with 0.944 and 0.922 for training and testing phased compared to R 0.935 and 0.913 of ANN model, in the mentioned phases. Both models’ predictions are good since the SI values are between 0.1 and 0.2 (Figures 7, 8). Moreover, The Tailor diagram (Figure 10) shows that XGboost model is better than ANN model with higher R, however, the standard deviation of the predicted bond strength values of ANN model is closer to that of measured bond strength values.
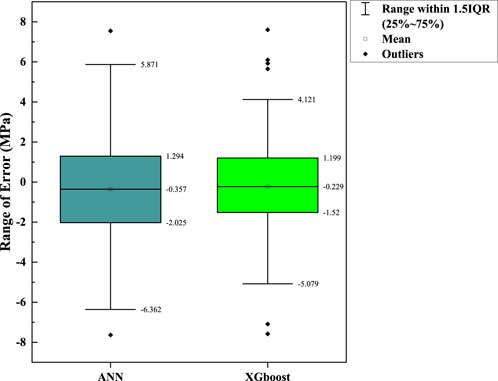
Furthermore, for better understanding the prediction performance of the created models, 5-fold cross validation was applied. Based on the result, XGboost model is better than ANN model, as show in Figure 11. According to error range shown in Figure 12, XGboost model has a lower error range from −5.079 to 4.121 MPa compared to ANN model −6.362 to 5.871 MPa indicating superior performance of the model.
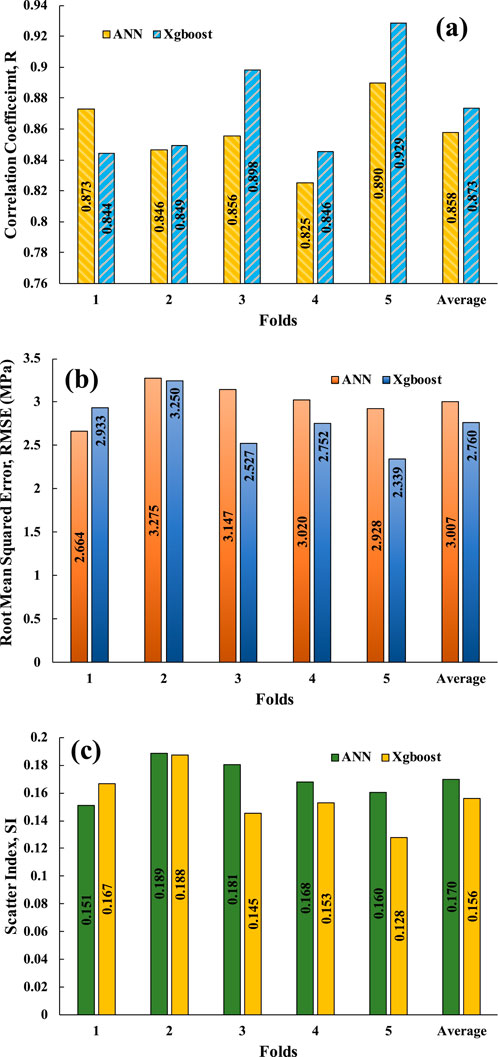
Figure 11. Comparison between the developed models using 5-fold cross-validation based (a) R, (b) RMSE, and (c) SI.
4 Sensitivity analysis
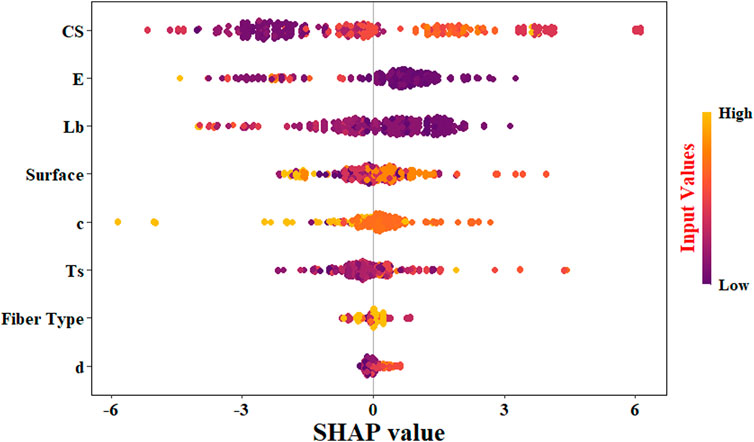
As previously discussed, this study employed sensitivity analysis to identify the most influential parameter affecting the bond strength of the FRP bar in concrete. Within this framework, the Shapley Additive Explanation method was applied to XGBoost model, revealing that the compressive strength of the concrete is the most critical parameter for predicting bond strength. Conversely, the bar type and its diameter were identified as less significant input parameters, as illustrated in Figure 13. The positive and negative effect of each parameter could be interpreted in Figure 14. As results demonstrate, the compressive strength, bar diameter, and tensile strength positively affected the bond strength, while embedded length and bar modules of elasticity effects were negative on the bond strength. Other parameters like bar type and surface are also important in the prediction of bond strength, however their effect could not be illustrated through SHAP values, because they act as a categorical variable higher number does not represent higher or lower performance.
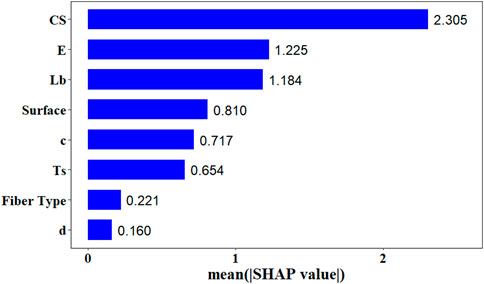
Figure 13. Importance of the predictors in forecasting bond strength of FRP bar in concrete based on average SHAP value.
Moreover, the main effect plot was generated between mean value of bond strength and other input parameters to demonstrate the effect of each parameter on the bond of FRP bar in concrete, as shown in Figure 15. The result suggests that the levels of the independent variable have different impacts on the dependent variable. It can show that as the levels of the independent variable change, the effect on the dependent variable is not consistent—increasing in some cases and decreasing in others.
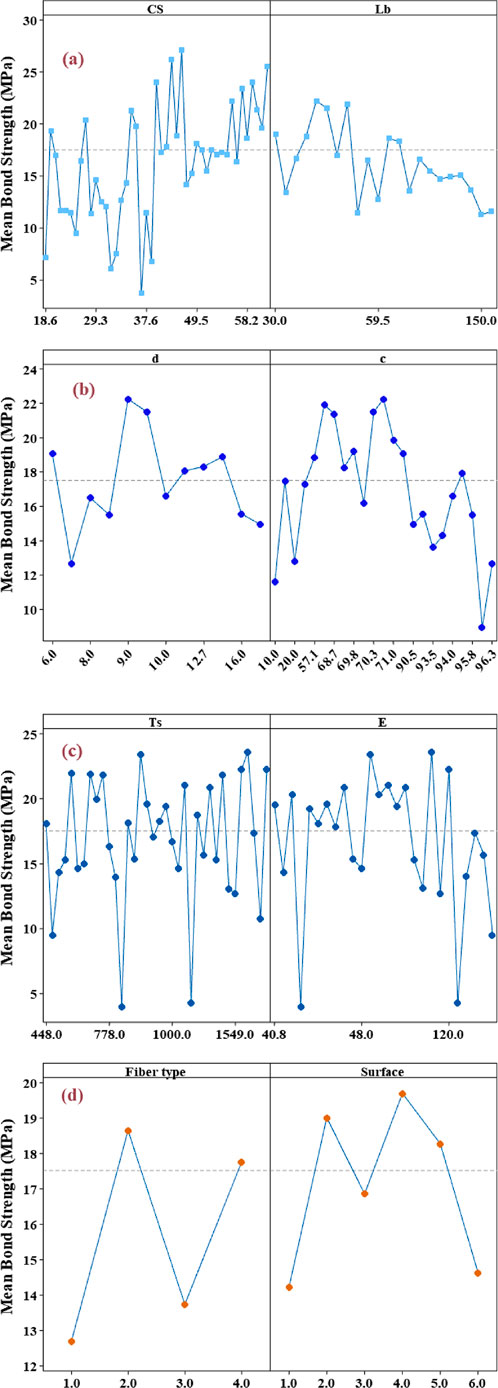
Figure 15. Main effect of predictors on the bond strength of FRP bars in concrete (a) CS and Lb, (b) d and c, (c) Ts and E, and (d) Fiber type and surface.
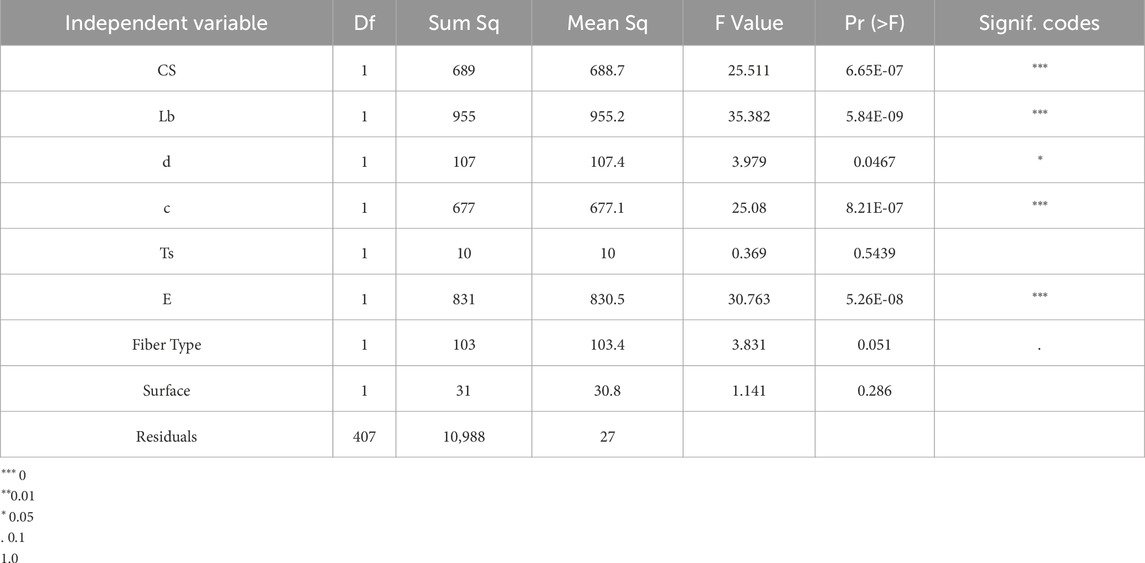
Furthermore, the importance of input parameters was analyzed through ANOVA test, as summarized in Table 4. The test shows that the variables CS, Lb, c, and E are significantly affecting the dependent variable, as indicated by very low p-values and high F values. These variables are strongly influencing the outcomes. The variable d shows a moderate effect on the dependent variable, marked by significance at the 0.05 level. While its influence is less than the primary factors, it still plays a notable role. Fiber type, with a p-value slightly above 0.05, suggests a possible influence that did not reach traditional levels of statistical significance, hinting at a potential effect under different conditions or in conjunction with other variables. Conversely, Surface and Ts do not significantly affect the dependent variable, indicating that these factors do not alter outcomes in the current study setting. This analysis helps prioritize factors for further research and practical application, focusing on those with the most substantial impact on results. Finally, the input variables in the current study were decided based on previous researches on different bond strength measurement test setups like hinged beam, looking for best models for predicting the bond strength of FRP bars in concrete using standard pull-out test and to be used for finding correlation between bond strength measured with pull-out and hinged beam test in future studies.
5 Comparison of the developed models with the code formulation and previous literature
In this section, the developed models in the current study compared with the previous literature. The key parameters of the developed analytical models are determined using curve fitting from experimental results. Typically, these simplified analytical models rely on a limited number of variables identified through the fitting process, and do not account for the multiple factors affecting bond behavior. As a result, they tend to be slightly imprecise and often produce overly conservative predictions (Rezazadeh et al., 2017). In this study, the result of ANN and XGboost models were compared with ACI440.1R-15 (ACI440.1R-15, 2015) and Choi et al. (2012) as shown in Figure 16. Table 5 summarizes the evaluation metrices for predictive performance of the mentioned analytical models on the testing dataset. As mentioned earlier, Basaran et al. (2021) compared ANN, SVM, and GPR with ACI ACI440.1R-15, Compared to ANN model, ANN model in the current study has lower RMSE for the testing dataset. Compared to GPR model in the mentioned study the XGboost model is outperformed GPR model.
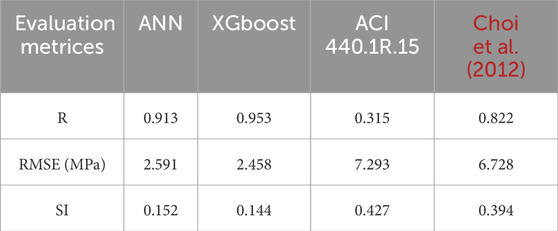
Table 5. Comparison between performance of developed models in the current study and two analytical models
Moreover, the results of the current study, when compared with similar studies on the bond strength of FRP bars in heat-damaged concrete and the shear strength of beams strengthened with FRP jackets, demonstrate the effectiveness and reliability of ANN and XGBoost models in predicting structural performance (Haddad et al., 2026; Gasser et al., 2023).
6 Conclusion
This study investigated factors influencing FRP-bar bond performance using a comprehensive literature review and predictive modeling based on 416 datasets. The key findings are as follows.
1. A literature review identified crucial factors affecting FRP-concrete bond behavior, including material properties, bar surface characteristics, and surrounding concrete strength.
2. The predictive models developed in this study outperformed previously proposed models, achieving lower RMSE and higher correlation coefficients (R).
3. The XGBoost model outperformed the ANN model in 5-fold cross-validation, with lower RMSE and SI values and higher R across validation folds. However, the ANN model is less complex, whereas XGBoost relies on a high number of trees.
4. Both models demonstrated strong performance, with scatter index (SI) values between 0.1 and 0.2, indicating reliable predictions.
5. Sensitivity analysis using SHAP values indicated that the compressive strength of concrete is the most influential factor affecting FRP bar-concrete bond strength. Complementary ANOVA tests confirmed the significance of all input parameters identified by SHAP, although they did not provide a ranking of their relative importance.
6. Main effect plots revealed interactions between independent variables, indicating that the effect of each variable cannot be interpreted independently.
Despite these promising results of the developed predictive models, certain limitations should be acknowledged.
• The dataset includes four fiber types, but the number of observations for aramid and carbon fibers is relatively low, suggesting the need for additional data.
• The models predict bond strength within the range of the collected input parameters, with tensile strength (Ts) and modulus of elasticity (E) dependent on fiber properties.
• Increasing dataset size would improve the performance and generalization of the models, particularly for aramid and carbon FRP bars.
• Since all compressive strength values were converted to cylindrical specimens of 150 × 300 mm, this represents a limitation of the developed models in predicting samples of this size. Incorporating data from different specimen sizes could improve the efficiency and generalizability of the models.
Future studies could address these limitations by incorporating larger datasets, applying advanced regularization techniques, or exploring hybrid modeling approaches to further enhance predictive performance and generalizability.
Data availability statement
The original contributions presented in the study are included in the article/supplementary material, further inquiries can be directed to the corresponding author.
Author contributions
AS: Supervision, Investigation, Validation, Methodology, Writing – review and editing, Conceptualization, Visualization, Resources, Formal Analysis, Writing – original draft, Project administration. AA: Software, Conceptualization, Writing – review and editing, Visualization, Investigation, Writing – original draft, Resources, Validation, Methodology. SM: Software, Methodology, Visualization, Writing – original draft, Writing – review and editing, Conceptualization, Project administration, Supervision. TA: Conceptualization, Visualization, Software, Writing – review and editing.
Funding
The author(s) declare that no financial support was received for the research and/or publication of this article.
Conflict of interest
The authors declare that the research was conducted in the absence of any commercial or financial relationships that could be construed as a potential conflict of interest.
Generative AI statement
The author(s) declare that Generative AI was used in the creation of this manuscript. ChatGPT-3.5 was used to assist in language editing and improving the clarity of the manuscript. All content was reviewed and verified by the authors. Authors are fully responsible for the entire content of their manuscript.
Any alternative text (alt text) provided alongside figures in this article has been generated by Frontiers with the support of artificial intelligence and reasonable efforts have been made to ensure accuracy, including review by the authors wherever possible. If you identify any issues, please contact us.
Publisher’s note
All claims expressed in this article are solely those of the authors and do not necessarily represent those of their affiliated organizations, or those of the publisher, the editors and the reviewers. Any product that may be evaluated in this article, or claim that may be made by its manufacturer, is not guaranteed or endorsed by the publisher.
References
ACI440.1R-15 (2015). Guide for the design and construction of structural concrete reinforced with fiber-reinforced polymer FRP bars. Farmington Hills, Michigan: American Concrete Institute.
Ahmad, F. S., Foret, G., and Le Roy, R. (2011). Bond between carbon fibre-reinforced polymer (CFRP) bars and ultra high performance fibre reinforced concrete (UHPFRC): experimental study. Constr. Build. Mater. 25 (2), 479–485. doi:10.1016/j.conbuildmat.2010.02.006
Ahmed, M., AlQadhi, S., Mallick, J., Kahla, N. B., Le, H. A., Singh, C. K., et al. (2022). Artificial neural networks for sustainable development of the construction industry. Sustainability 14 (22), 14738. doi:10.3390/su142214738
Akinosho, T. D., Oyedele, L. O., Bilal, M., Ajayi, A. O., Delgado, M. D., Akinade, O. O., et al. (2020). Deep learning in the construction industry: a review of present status and future innovations. J. Build. Eng. 32, 101827. doi:10.1016/j.jobe.2020.101827
Antonietta Aiello, M., Leone, M., and Pecce, M. (2007). Bond performances of FRP rebars-reinforced concrete. J. Mater. Civ. Eng. 19 (3), 205–213. doi:10.1061/(ASCE)0899-1561(2007)19:3(205)
Baena, M., Torres, L., Turon, A., and Barris, C. (2009). Experimental study of bond behaviour between concrete and FRP bars using a pull-out test. Compos. Part B Eng. 40 (8), 784–797. doi:10.1016/j.compositesb.2009.07.003
Basaran, B., Kalkan, I., Bergil, E., and Erdal, E. (2021). Estimation of the FRP-Concrete bond strength with code formulations and machine learning algorithms. Compos. Struct. 268, 113972. doi:10.1016/j.compstruct.2021.113972
Basheer, I. A., and Hajmeer, M. (2000). Artificial neural networks: fundamentals, computing, design, and application. J. Microbiol. methods 43 (1), 3–31. doi:10.1016/S0167-7012(00)00201-3
Chen, T., and Guestrin, C. (2016). Xgboost: a scalable tree boosting system. In: Proceedings of the 22nd acm sigkdd international conference on knowledge discovery and data mining; 2016 August 13-17; San Francisco, CA, USA: ACM.p. 785–794. doi:10.1145/2939672.2939785
Choi, D.-U., Chun, S.-C., and Ha, S.-S. (2012). Bond strength of glass fibre-reinforced polymer bars in unconfined concrete. Eng. Struct. 34, 303–313. doi:10.1016/j.engstruct.2011.08.033
Cosenza, E., Manfredi, G., and Realfonzo, R. (1997). Behavior and modeling of bond of FRP rebars to concrete. J. Compos. Constr. 1 (2), 40–51. doi:10.1061/(ASCE)1090-0268(1997)1:2(40)
Cosenza, E., Manfredi, G., and Realfonzo, R. (2002). Development length of FRP straight rebars. Compos. Part B Eng. 33 (7), 493–504. doi:10.1016/S1359-8368(02)00051-3
Davalos, J. F., Chen, Y., and Ray, I. (2008). Effect of FRP bar degradation on interface bond with high strength concrete. Cem. Concr. Compos. 30 (8), 722–730. doi:10.1016/j.cemconcomp.2008.05.006
Despotovic, M., Nedic, V., Despotovic, D., and Cvetanovic, S. (2016). Evaluation of empirical models for predicting monthly mean horizontal diffuse solar radiation. Renew. Sustain. Energy Rev. 56, 246–260. doi:10.1016/j.rser.2015.11.058
Dhaliwal, S. S., Nahid, A.-A., and Abbas, R. (2018). Effective intrusion detection system using XGBoost. Information 9 (7), 149. doi:10.3390/info9070149
Dobrescu, E., Nastac, D.-I., and Pelinescu, E. (2014). Short-term financial forecasting using ANN adaptive predictors in cascade. Int. J. Process Manag. Benchmarking 4 (4), 376–405. doi:10.1504/IJPMB.2014.065519
Duo, Y., Liu, X., Liu, Y., Tafsirojjaman, T., and Sabbrojjaman, M. (2021). Environmental impact on the durability of FRP reinforcing bars. J. Build. Eng. 43, 102909. doi:10.1016/j.jobe.2021.102909
Egmont-Petersen, M., de Ridder, D., and Handels, H. (2002). Image processing with neural networks—a review. Pattern Recognit. 35 (10), 2279–2301. doi:10.1016/s0031-3203(01)00178-9
El Refai, A., Ammar, M.-A., and Masmoudi, R. (2015). Bond performance of basalt fiber-reinforced polymer bars to concrete. J. Compos. Constr. 19 (3), 04014050. doi:10.1061/(ASCE)CC.1943-5614.0000487
Elwell, D. J., and Fu, G. (1995). Compression testing of concrete: cylinders vs. cubes. New York: New York state department of transportation.
Fahmy, M. F. M., Ahmed, S. A. S., and Wu, Z. (2021). Bar surface treatment effect on the bond-slip behavior and mechanism of basalt FRP bars embedded in concrete. Constr. Build. Mater. 289, 122844. doi:10.1016/j.conbuildmat.2021.122844
Gasser, M., Mahmoud, O., Elsayed, T., and Deifalla, A. (2023). Reliable machine learning for the shear strength of beams strengthened using externally bonded FRP jackets. Front. Mater. 10, 1153421. doi:10.3389/fmats.2023.1153421
Goodfellow, I., Bengio, Y., Courville, A., and Bengio, Y. (2016). Deep learning. Cambridge: MIT Press.
Haddad, R., Almasaeid, H., and Saeed, A. (2026). Predicting bond strength between externally bonded FRP and heat-damaged concrete using ANN. J. Soft Comput. Civ. Eng. 10 (1), e223688. doi:10.22115/scce.2025.1945
Hijazi, A., Al-Dahidi, S., and Altarazi, S. (2020). A novel assisted artificial neural network modeling approach for improved accuracy using small datasets: application in residual strength evaluation of panels with multiple site damage cracks. Appl. Sci. 10 (22), 8255. doi:10.3390/app10228255
Kamble, B. C. (2016). Speech recognition using artificial neural network–a review. Int. J. Comput. Commun. Instrum. Eng. 3 (1), 61–64. doi:10.15242/IJCCIE.U0116002
Karibasappa, R., and Kumar, A. (2024). Comparative analysis of fingerprint-based models for indoor visible light positioning: superior performance of ANN over KNN and DNN. J. Opt. 54, 2442–2452. doi:10.1007/s12596-024-02289-9
Kim, B., Doh, J. H., Yi, C. K., and Lee, J. Y. (2013). Effects of structural fibers on bonding mechanism changes in interface between GFRP bar and concrete. Compos. Part B Eng. 45 (1), 768–779. doi:10.1016/j.compositesb.2012.09.039
Lau, D., Qiu, Q., Zhou, A., and Chow, C. L. (2016). Long term performance and fire safety aspect of FRP composites used in building structures. Constr. Build. Mater. 126, 573–585. doi:10.1016/j.conbuildmat.2016.09.031
Lee, J. Y., Kim, T. Y., Kim, T. J., Yi, C. K., Park, J. S., You, Y. C., et al. (2008). Interfacial bond strength of glass fiber reinforced polymer bars in high-strength concrete. Compos. Part B Eng. 39 (2), 258–270. doi:10.1016/j.compositesb.2007.03.008
Li, R., Liu, L., and Cheng, M. (2022). Estimating the bond strength of FRP bars using a hybrid machine learning model. Buildings 12 (10), 1654. doi:10.3390/buildings12101654
Lima Marinho, T., do Nascimento, D. C., and Pimentel, B. A. (2024). Optimization on selecting XGBoost hyperparameters using meta-learning. Expert Syst. 41 (9), e13611. doi:10.1111/exsy.13611
Liu, Z., Wu, D., Liu, Y., Han, Z., Lun, L., Gao, J., et al. (2019). Accuracy analyses and model comparison of machine learning adopted in building energy consumption prediction. Energy Explor. and Exploitation 37 (4), 1426–1451. doi:10.1177/0144598718822400
Mashrei, M. A., Seracino, R., and Rahman, M. S. (2013). Application of artificial neural networks to predict the bond strength of FRP-to-concrete joints. Constr. Build. Mater. 40, 812–821. doi:10.1016/j.conbuildmat.2012.11.109
Mazaheripour, H., Barros, J. A. O., Sena-Cruz, J. M., Pepe, M., and Martinelli, E. (2013). Experimental study on bond performance of GFRP bars in self-compacting steel fiber reinforced concrete. Compos. Struct. 95, 202–212. doi:10.1016/j.compstruct.2012.07.009
Nepomuceno, E., Sena-Cruz, J., Correia, L., and D'Antino, T. (2021). Review on the bond behavior and durability of FRP bars to concrete. Constr. Build. Mater. 287, 123042. doi:10.1016/j.conbuildmat.2021.123042
Nguyen, N.-H., Abellán-García, J., Lee, S., Garcia-Castano, E., and Vo, T. P. (2022). Efficient estimating compressive strength of ultra-high performance concrete using XGBoost model. J. Build. Eng. 52, 104302. doi:10.1016/j.jobe.2022.104302
Nwadiugwu, M. C. (2020). Neural networks, artificial intelligence and the computational brain. arXiv preprint arXiv:2101.08635. doi:10.48550/arXiv.2101.08635
Pan, J., and Leung, C. K. (2007). Effect of concrete composition on FRP/concrete bond capacity. J. Compos. Constr. 11 (6), 611–618. doi:10.1061/(ASCE)1090-0268(2007)11:6(611)
Rezazadeh, M., Carvelli, V., and Veljkovic, A. (2017). Modelling bond of GFRP rebar and concrete. Constr. Build. Mater. 153, 102–116. doi:10.1016/j.conbuildmat.2017.07.092
Rumelhart, D. E., Hinton, G. E., and Williams, R. J. (1986). Learning representations by back-propagating errors. Nature 323 (6088), 533–536. doi:10.1038/323533a0
Solyom, S., and Balázs, G. L. (2020). Bond of FRP bars with different surface characteristics. Constr. Build. Mater. 264, 119839. doi:10.1016/j.conbuildmat.2020.119839
Soong, W. H., Raghavan, J., and Rizkalla, S. H. (2011). Fundamental mechanisms of bonding of glass fiber reinforced polymer reinforcement to concrete. Constr. Build. Mater. 25 (6), 2813–2821. doi:10.1016/j.conbuildmat.2010.12.054
Suthaharan, S. (2016). Machine learning models and algorithms for big data classification. Integr. Ser. Inf. Syst. 36, 1–12. doi:10.1007/978-1-4899-7641-3_10
Tang, Y., Zhou, C., Wang, W., Zhang, W., and Cheng, Y. (2024). Machine learning driven bond performance prediction between FRP bars and coral aggregate concrete. Constr. Build. Mater. 442, 137684. doi:10.1016/j.conbuildmat.2024.137684
Tang, Y., Wang, W., Huang, Q., Cheng, Y., and Zhou, C. (2025). Shear performance prediction of RC beams shear-strengthened with FRP sheet: a machine learning driven design-oriented method. Eng. Struct. 334, 120240. doi:10.1016/j.engstruct.2025.120240
Tatar, J., and Milev, S. (2021). Durability of externally bonded fiber-reinforced polymer composites in concrete structures: a critical review. Polymers 13 (5), 765. doi:10.3390/polym13050765
Teng, J. G., Yu, T., and Fernando, D. (2012). Strengthening of steel structures with fiber-reinforced polymer composites. J. Constr. steel Res. 78, 131–143. doi:10.1016/j.jcsr.2012.06.011
Tepfers, R. (2006). Bond clause proposals for FRP bars/rods in concrete based on CEB/FIP model code 90. Part 1: design bond stress for FRP reinforcing bars. Struct. Concr. 7 (2), 47–55. doi:10.1680/stco.2006.7.2.47
Veljkovic, A., Carvelli, V., Haffke, M. M., and Pahn, M. (2017). Concrete cover effect on the bond of GFRP bar and concrete under static loading. Compos. Part B Eng. 124, 40–53. doi:10.1016/j.compositesb.2017.05.054
Wang, X., Mazumder, R. K., Salarieh, B., Salman, A. M., Shafieezadeh, A., and Li, Y. (2022). Machine learning for risk and resilience assessment in structural engineering: progress and future trends. J. Struct. Eng. 148 (8), 03122003. doi:10.1061/(ASCE)ST.1943-541X.0003392
Wang, J., Xiao, F., Lai, Z., Yang, J., and Tian, S. (2024). Bond of FRP bars with different surface characteristics to concrete. Structures 59, 105731. doi:10.1016/j.istruc.2023.105731
Yan, F., Lin, Z., Zhang, D., Gao, Z., and Li, M. (2017). Experimental study on bond durability of glass fiber reinforced polymer bars in concrete exposed to harsh environmental agents: freeze-thaw cycles and alkaline-saline solution. Compos. Part B Eng. 116, 406–421. doi:10.1016/j.compositesb.2016.10.083
Yaqoob, A., Verma, N. K., Aziz, R. M., and Shah, M. A. (2024). Optimizing cancer classification: a hybrid RDO-XGBoost approach for feature selection and predictive insights. Cancer Immunol. Immunother. 73 (12), 261. doi:10.1007/s00262-024-03843-x
Younis, A., Ebead, U., and Judd, S. (2018). Life cycle cost analysis of structural concrete using seawater, recycled concrete aggregate, and GFRP reinforcement. Constr. Build. Mater. 175, 152–160. doi:10.1016/j.conbuildmat.2018.04.183
Zhang, P., Jia, Y., and Shang, Y. (2022). Research and application of XGBoost in imbalanced data. Int. J. Distributed Sens. Netw. 18 (6), 155013292211069. doi:10.1177/15501329221106935
Keywords: FRP bar, bond strength, surface characteristics, compressive strength, machine learning models
Citation: Salih AM, Abdalla AA, Mohammad Ali SR and Abdullah TA (2025) Forecasting bond strength of various FRP bars with different surface characteristics in concrete using machine learning models. Front. Built Environ. 11:1692879. doi: 10.3389/fbuil.2025.1692879
Received: 26 August 2025; Accepted: 30 September 2025;
Published: 10 November 2025.
Edited by:
Nikos D. Lagaros, National Technical University of Athens, GreeceReviewed by:
Yi Cheng, Southeast University, ChinaMoamen Kamel, Texas A&M University San Antonio, United States
Copyright © 2025 Salih, Abdalla, Mohammad Ali and Abdullah. This is an open-access article distributed under the terms of the Creative Commons Attribution License (CC BY). The use, distribution or reproduction in other forums is permitted, provided the original author(s) and the copyright owner(s) are credited and that the original publication in this journal is cited, in accordance with accepted academic practice. No use, distribution or reproduction is permitted which does not comply with these terms.
*Correspondence: Ameer M. Salih, YW1lZXIuc2FsaWhAdW5pdnN1bC5lZHUuaXE=
 Ameer M. Salih
 Aso A. Abdalla
 Sardar R. Mohammad Ali1



![Scatter plot comparing predicted bond strength (MPa) to measured bond strength (MPa). Data points represent different models: ANN (brown circles), XGboost (blue squares), ACI440.1R-15 (yellow triangles), and Choi et al. [57] (blue crosses). A diagonal line indicates y = x.](https://www.frontiersin.org/files/Articles/1692879/fbuil-11-1692879-HTML/image_m/fbuil-11-1692879-g016.jpg)