 Andrei-Odey Kadhim
 Iolanda-Gabriela Craifaleanu
 Eugen Lozincă
- Department of Reinforced Concrete Structures, Technical University of Civil Engineering, Faculty of Civil, Industrial and Agricultural Buildings, Bucharest, Romania
The accurate estimation of plastic rotational capacity in reinforced concrete (RC) elements is essential for performance-based seismic design and structural safety assessments. In this study, an extensive experimental database, comprising 258 rectangular and 151 circular RC column specimens, was compiled based on open data available and used to train machine learning models for predicting this parameter. Three algorithms, i.e. Support Vector Regression (SVR), Random Forest (RF), and Extreme Gradient Boosting (XGBoost), were implemented and optimized using grid search within a nested cross-validation framework. The predictive performance was evaluated by averaging the coefficient of determination (R2) across five outer folds, while final accuracy was assessed on the test set using both R2, the Mean Absolute Error (MAE), the root mean squared error (RMSE), and the mean absolute percentage error (MAPE). Model interpretability was improved using SHAP (SHapley Additive exPlanations) analysis, which quantified the influence of input parameters on predictions. Finally, a stacking ensemble model was developed to integrate the strengths of the individual regressors. The proposed methodology demonstrates increased accuracy and robustness in predicting the plastic rotational capacity of both circular and rectangular RC columns, providing a valuable tool for seismic assessment and structural reliability analysis.
1 Introduction
In recent years, machine learning techniques have been increasingly used in structural engineering due to their ability to model complex nonlinear relationships between structural parameters. Compared to analytical methods, which often rely on simplifications and idealized assumptions, machine learning algorithms can identify patterns directly from experimental data and provide accurate predictions for various structural responses. Predicting plastic rotational capacity is particularly demanding, as it is influenced by multiple factors such as axial load ratio, longitudinal and transverse reinforcement detailing, and confinement, whose combined effects on ductility and post-yield behavior are highly nonlinear. This complexity highlights the need for advanced data-driven approaches such as machine learning algorithms.
Recent contributions in structural engineering emphasize the growing role of machine learning (ML) in improving predictive models and supporting design practices. Solorzano and Plevris (2022) developed an artificial neural network (ANN)-based surrogate model to estimate the lateral load capacity of RC shear walls, demonstrating that the proposed model can achieve accuracy similar to that of nonlinear finite element pushover analysis while drastically reducing the computational time and power. Aladsani et al. (2022) employed the XGBoost algorithm to predict the drift capacity of RC shear walls and used SHAP values to assess the contribution of individual input parameters. Tsiatas et al. (2022) compared several regression algorithms for predicting deflections in laminated composite beams, using a large synthetic dataset generated through a refined higher-order beam theory. The best-performing algorithm (Extra-Trees model) obtained appropriately minor prediction errors, in line with current engineering practices. In another study, Damikoukas and Lagaros (2025) obtained significantly improved prediction accuracy for the seismic response of buildings by combining earthquake time histories with ambient vibration data and a dataset comprising 1197 MDOF 2D models within a deep neural network (DNN)-based framework. Luo and Paal (2019) proposed an optimized SVM algorithm to estimate the plastic rotational capacity of RC columns for different failure modes (flexure, flexure-shear, and shear), with their regression model outperforming both the standard SVM and empirical formulas used in current design codes. In a separate study, Nguyen et al. (2020) demonstrated the applicability of ANN models in structural engineering by developing an empirical equation to predict the axial capacity of circular CFST columns. Comparisons with the empirical equations stated in the current design codes show that the proposed equation can predict the axial compressive capacity more accurately. Logistic regression has also been used to develop fragility models for bridges (Kameshwar and Padgett, 2017), soil–structure systems (Koutsourelakis, 2010), and RC shear walls (Yazdi et al., 2016), showing improved reliability in estimating seismic damage probabilities. Other studies have focused on post-earthquake visual data: German et al. (2012) proposed an image-based method to detect spalling in RC columns using entropy classifiers, tested on images from the 2010 Haiti earthquake, while Mao et al. (2020) presented a time-series anomaly detection framework for structural health monitoring, supporting the automation of damage identification.
Despite these promising developments, several limitations remain. Many datasets obtained from reinforced concrete members testing are unbalanced, with fewer samples for brittle failure mechanisms. This reduces model accuracy when predicting less frequent behaviors. In addition, validation methods are sometimes insufficiently rigorous, and the lack of interpretability of complex machine learning models can limit their application in engineering practice.
In performance-based seismic design, plastic rotation capacity is one of the most important parameters. When structures are subjected to seismic actions, plastic hinges form in regions of maximum bending moment, usually at the ends of beams and columns. The ability of these regions to undergo large rotations without significant loss of strength determines the overall ductility and energy dissipation capacity of the structure. Estimating plastic rotation capacity is essential for both the design of new structures and the assessment of existing buildings. Traditional methods, such as empirical formulas or simplified sectional analysis, are often inaccurate when applied to elements with non-standard cross-sectional shapes, reinforcement, or loading conditions. This creates a need for data-driven models that can incorporate multiple variables and better reflect real structural behavior.
In an earlier study conducted by the first two authors (Kadhim and Craifaleanu, 2025), six supervised machine learning algorithms were applied to predict the plastic rotational capacity of reinforced concrete vertical structural members. For columns, the datasets comprised 171 rectangular and 151 circular specimens. Each record included geometric, reinforcement, and mechanical parameters, as well as failure modes. The best results were obtained using Support Vector Regression (SVR) and eXtreme Gradient Boosting (XGBoost). However, low and even negative values of the coefficient of determination, R2, were recorded during cross-validation, especially for elements with shear-dominated failure modes. This was caused by the small number of brittle failure specimens in the database. Additionally, the evaluation conducted in the cited study focused only on maximum R2 values, without analyzing the average predictive performance or result consistency. Also, no feature importance analysis was performed to assess the influence of each input parameter.
The observed limitations highlighted the need to improve both the datasets and the modeling approach. Firstly, the low number of brittle failures affected the training of models, making it difficult to obtain reliable predictions for non-ductile behavior. Secondly, using only the highest R2 scores did not reflect the real performance of the models across different subsets of data. Thirdly, the lack of interpretability made it challenging to understand how each parameter influenced the predicted values.
The present study addresses these limitations, aiming at improving the accuracy and robustness of machine learning models for predicting the plastic rotational capacity of reinforced concrete members. Compared to the earlier work, the current research relies on an expanded experimental database including 258 rectangular and 151 circular specimens, incorporates SHAP (SHapley Additive exPlanations) analysis to enhance model interpretability, and develops a stacking ensemble framework that integrates multiple regressors. Furthermore, a nested cross-validation strategy was adopted during hyperparameter tuning to ensure an unbiased evaluation protocol and avoid data leakage.
In summary, this study develops machine learning models that are designed to be both accurate and transparent in predicting the plastic rotational capacity of reinforced concrete columns. By combining an extended experimental database with advanced evaluation and interpretability techniques, the study contributes to more reliable predictive tools for structural assessment under seismic loading, supporting performance-based design, vulnerability analysis, and decision-making processes for strengthening or retrofitting reinforced concrete structures.
2 Materials and methods
2.1 Overall approach
The database for rectangular columns was expanded with 89 new test samples, improving the balance between failure types and increasing dataset variability. The newly added data includes specimens with various reinforcement ratios, axial loads, and cross-sectional dimensions, to provide broader coverage of practical design cases.
Particular attention was given to a deeper analysis of the datasets used. Statistical plots, such as violin plots, were created to visualize the distribution of each input parameter. Heatmaps were generated as well to analyze the correlation between each input parameter and the target output (plastic rotation capacity), separately for circular and rectangular column sections.
Three machine learning algorithms, SVR, Random Forest (RF), and XGBoost, were selected for analysis, based on the performance observed in (Kadhim and Craifaleanu, 2025). These were reimplemented and optimized using grid search and nested cross-validation, where the training set was divided into two subsets: one for hyperparameter optimization and one for model training. This method was applied to prevent data leakage and to ensure more accurate evaluation. Unlike in the first study, where only the highest R2 values were considered, the R2 score was computed as the average over five outer folds using nested cross-validation, where model hyperparameters were tuned within each training split. Subsequently, the best-performing model was retrained on the whole training set and evaluated on the independent test set, where both R2 and Mean Absolute Error (MAE) were measured. This approach allows a more realistic and robust evaluation of model accuracy and generalization.
To improve model interpretability, SHapley Additive exPlanations (SHAP) value plots were created for each regressor. These plots indicate the relative importance of each input variable in the prediction process. Parameters having the highest influence on the output in most models were identified.
An ensemble model was next developed by combining the three individual regressors in a stacking regressor. In this model, the predictions of SVR, RF, and XGBoost were used as inputs for a meta-regressor that generates the final prediction. The goal was to obtain better overall results by combining the advantages of each algorithm.
2.2 Database
The present study focuses exclusively on reinforced concrete columns with rectangular and circular cross sections. The column database was divided into two main subsets: the original database, extracted from the PEER Structural Performance Database (Berry et al., 2004), and an extended dataset, consisting of 86 additional rectangular column specimens collected from recent experimental studies.
From the PEER database, 151 circular columns and 172 rectangular columns were used. All specimens were subjected to quasi-static cyclic lateral loading. The test configuration typically consisted of cantilever-type elements loaded laterally at the top while being axially compressed. The boundary conditions were idealized as fixed at the base. Only specimens with complete input data were selected.
An additional set of 86 reinforced concrete specimens with rectangular cross-sections was collected from recent experimental studies published in the literature (Tran, 2010; Wibowo et al., 2013; Xiao and Zhang, 2007; Woods et al., 2006; Melo et al., 2015; Pham and Li, 2014; Esaki, 1996; Wu et al., 2021; Ousalem et al., 2025; Li et al., 2014). These specimens were added to the original set of 172 rectangular columns extracted from the PEER database, resulting in a total of 258 rectangular columns included in this study.
The inclusion of these 86 specimens improved the statistical balance of the rectangular column dataset, especially regarding brittle and mixed failure types, which were underrepresented in the original set. The final dataset for rectangular columns includes 258 specimens, categorized according to their observed failure modes: 147 specimens failed predominantly in flexure, 67 exhibited a mixed flexure–shear failure, and 44 experienced brittle failure primarily governed by shear.
Similarly, the dataset for circular columns consists of 151 specimens, comprising 94 flexural failures, 27 with combined flexure–shear mechanisms, and 30 with shear-induced failure modes.
All specimens were encoded using the same input structure and parameter definitions as in the PEER database, to ensure full compatibility and uniform processing during model training and evaluation.
Scatter plots illustrating the relationship between various input parameters and plastic rotational capacity for the rectangular columns and, respectively, circular columns in the analyzed datasets were given in the supplementary material (Supplementary Figures S1-S7).
2.3 Input parameters
The input parameters used in this study were selected based on their influence on the plastic rotational capacity of reinforced concrete columns, as observed in prior experimental and numerical research. The following variables were used:
• concrete compressive strength (fc [MPa]);
• longitudinal and transverse reinforcement yield stress (fy, fyw [MPa]);
• longitudinal reinforcement ratio (ρl);
• transverse reinforcement ratio (ρw);
• shear span to effective depth ratio (L/d);
• axial load ratio (P/Agfc);
• failure mode (Flexure/Shear/Flexure - Shear).
These variables are consistent with those identified in previous empirical models. In particular, the models proposed by Pujol et al. (1999) and Elwood and Moehle (2005) include column aspect ratio, concrete strength, longitudinal and transverse reinforcement ratios and yield stresses, and axial load ratio as governing predictors. Furthermore, Luo and Paal (2019) demonstrated the relevance of failure mode as a predictor in machine learning-based drift capacity models.
For each specimen, the corresponding failure mode was assigned the value 1, while the other two were set to 0. For example, if a column exhibited a shear failure, the ‘Shear’ variable was set to 1, and both ‘Flexure’ and ‘Flexure–Shear’ were set to 0. This transformation allowed the use of categorical information in machine learning models that require numerical input.
The output variable used as a prediction target was the plastic rotational capacity. In cases where this value was not explicitly specified in the database, it was approximated as the ratio between the displacement at failure and the shear span or effective height of the column, expressed as a percentage. For ductile specimens, the maximum displacement was used. For brittle or combined failure modes, the displacement at 80% lateral strength drop was considered (Figure 1). This definition is consistent with the approach of Elwood and Moehle (2005), who proposed using the 80% criterion in the presence of strength degradation, and with Luo and Paal (2019), who adopted this method while using maximum drift for ductile cases without strength deterioration.
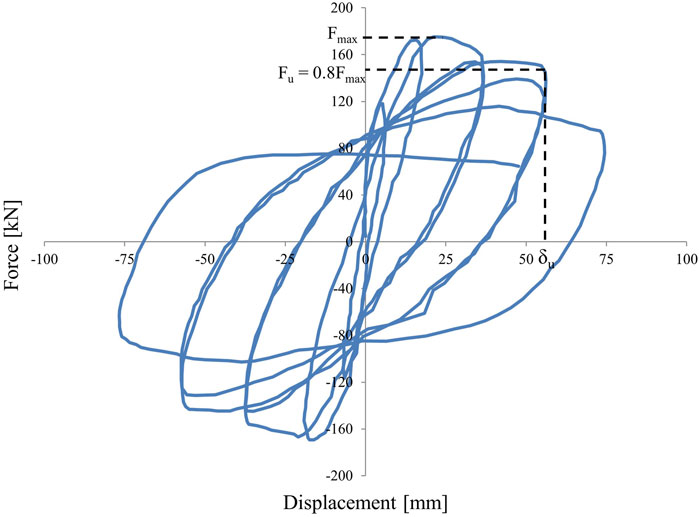
Figure 1. Selection of ultimate displacement for elements with brittle failure.
2.4 Statistical distributions of data
Tables 1, 2 describe the statistical ranges of the parameters for rectangular and circular columns in the database.
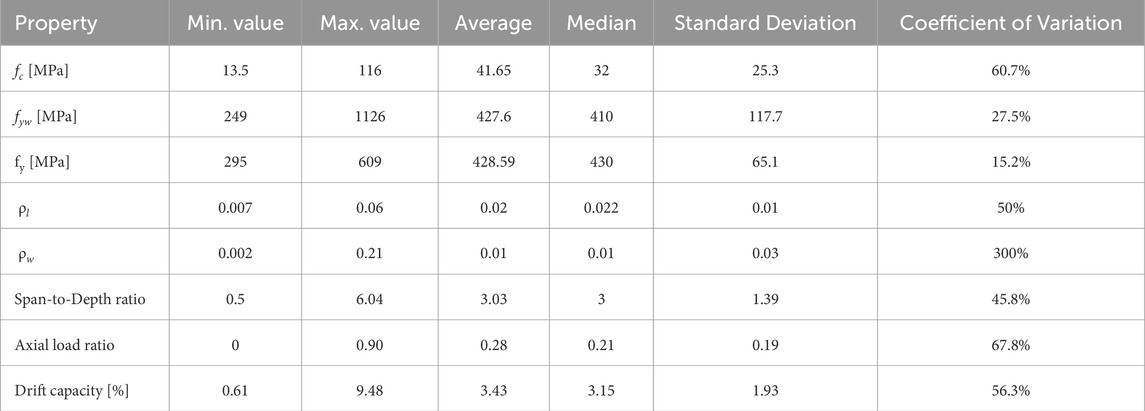
Table 1. Statistical ranges of the selected parameters for the rectangular columns database.
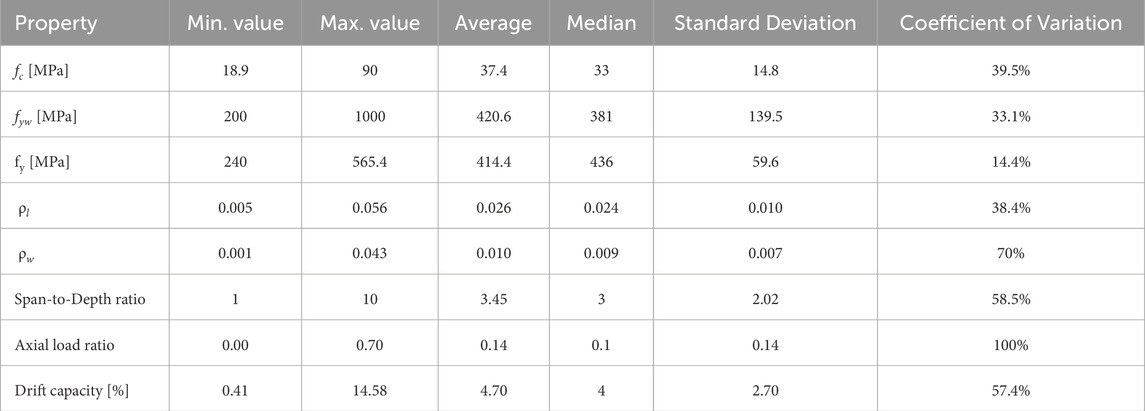
Table 2. Statistical ranges of the selected parameters for the circular columns database.
The variability and distribution of each input parameter were assessed and visualized using violin plots for rectangular and circular concrete columns (Figure 2).
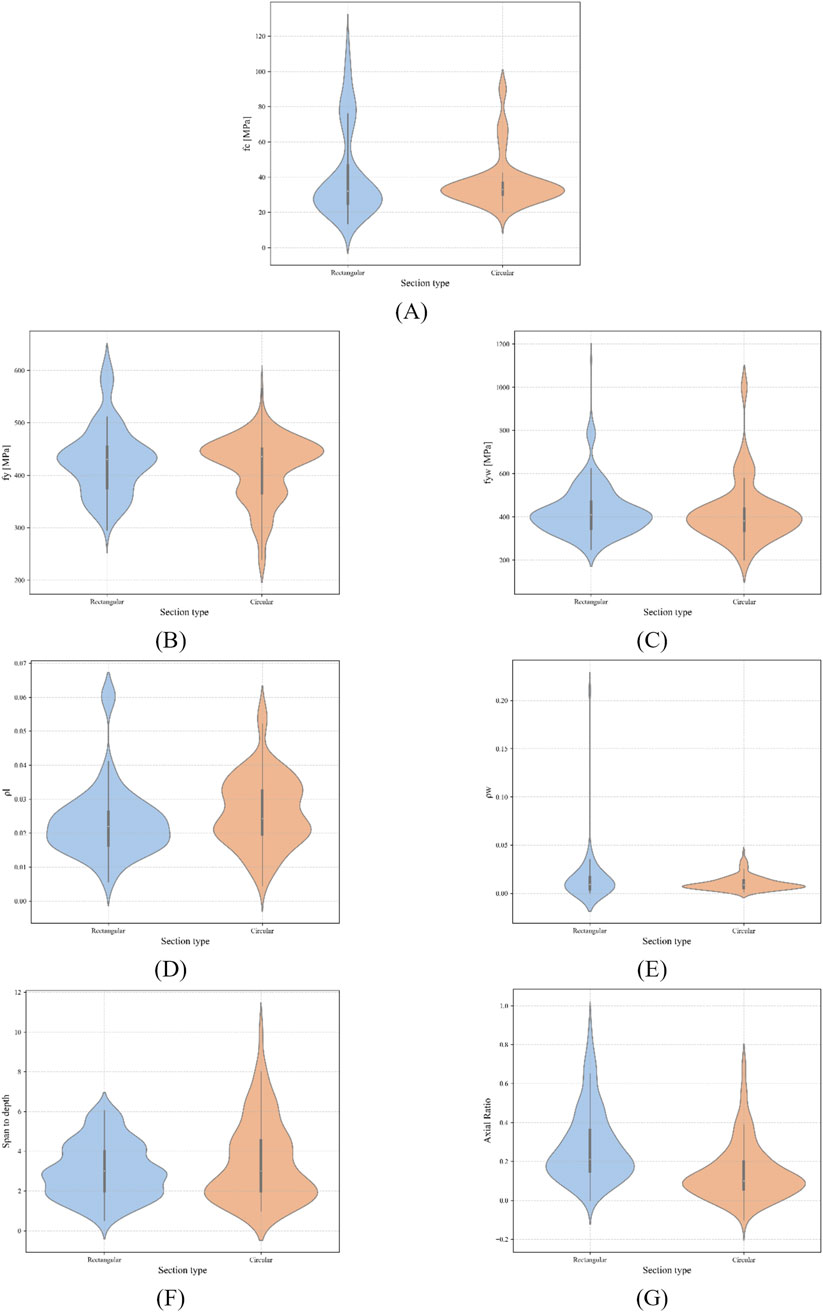
Figure 2. Violin plots of parameter distributions for rectangular and circular columns: (A) concrete compressive strength, fc. (B) longitudinal reinforcement yield stress fy. (C) transverse reinforcement yield stress, fyw. (D) longitudinal reinforcement ratio, ρl. (E) transverse reinforcement ratio, ρw. (F) Shear span to effective depth ratio. (G) Axial load ratio.
The violin plots indicate that the distribution of concrete compressive strength (Figure 2A) exhibits greater variability in rectangular columns, with values ranging from approximately 13 MPa to over 120 MPa, whereas values for circular columns are predominantly concentrated within the 20 60 MPa range.
For the reinforcement yield strength (Figures 2B,C), both cross-sectional shapes display quite similar distributions, although circular columns present a slightly higher concentration around the median value, especially for the transverse reinforcement.
The longitudinal reinforcement ratio in rectangular columns varies between 0.005 and 0.065, while circular specimens generally exhibit slightly lower values (Figure 2D). Transverse reinforcement ratios (Figure 2E) show greater dispersion in rectangular columns, reflecting the diversity of confinement configurations across the experimental programs.
The shear span-to-depth ratio (Figure 2F) displays a wider variation range for circular columns, including values exceeding 6, whereas rectangular columns are mainly clustered between 2 and 6. Axial load ratios (Figure 2G) are more widely dispersed in rectangular columns, while in circular columns, they are predominantly below 0.4, indicating more moderate axial loading conditions. However, it can be noticed that, overall, most specimens were tested for axial load ratios lower than 0.4.
To evaluate the statistical relationships between the input variables and the plastic rotation capacity, correlation matrices were generated separately for the rectangular (Figure 3) and circular (Figure 4) column datasets. The Pearson correlation coefficient, r, was used to assess the linear dependencies between parameters, including the three failure mode indicators.
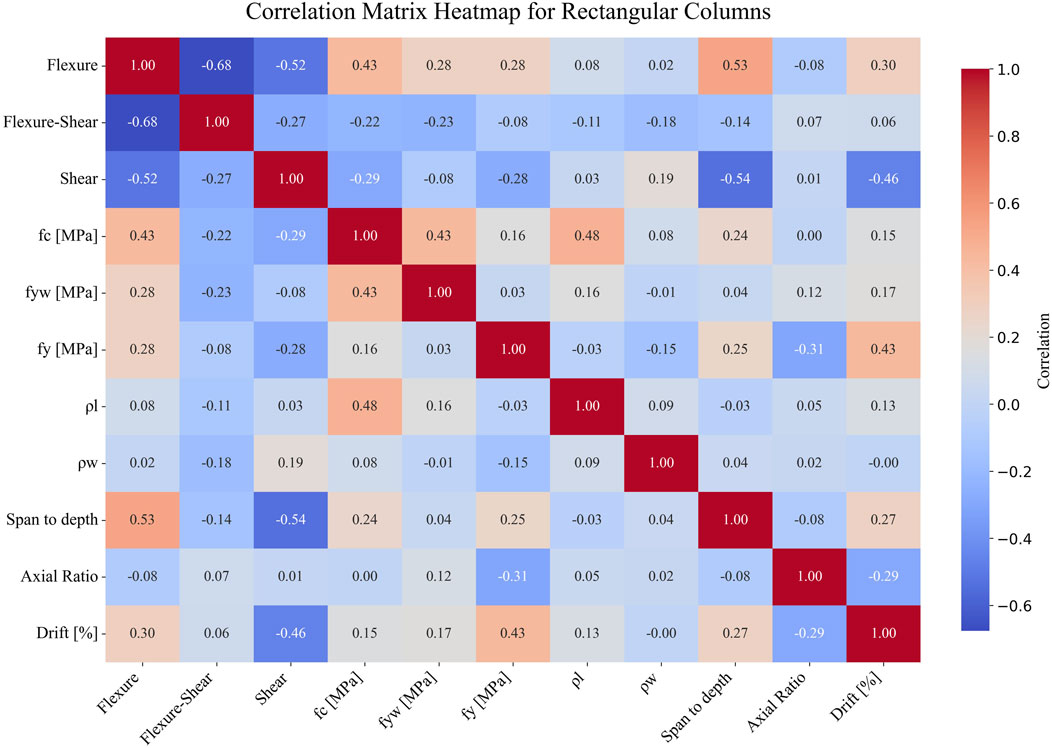
Figure 3. Pearson correlation matrix for rectangular columns.
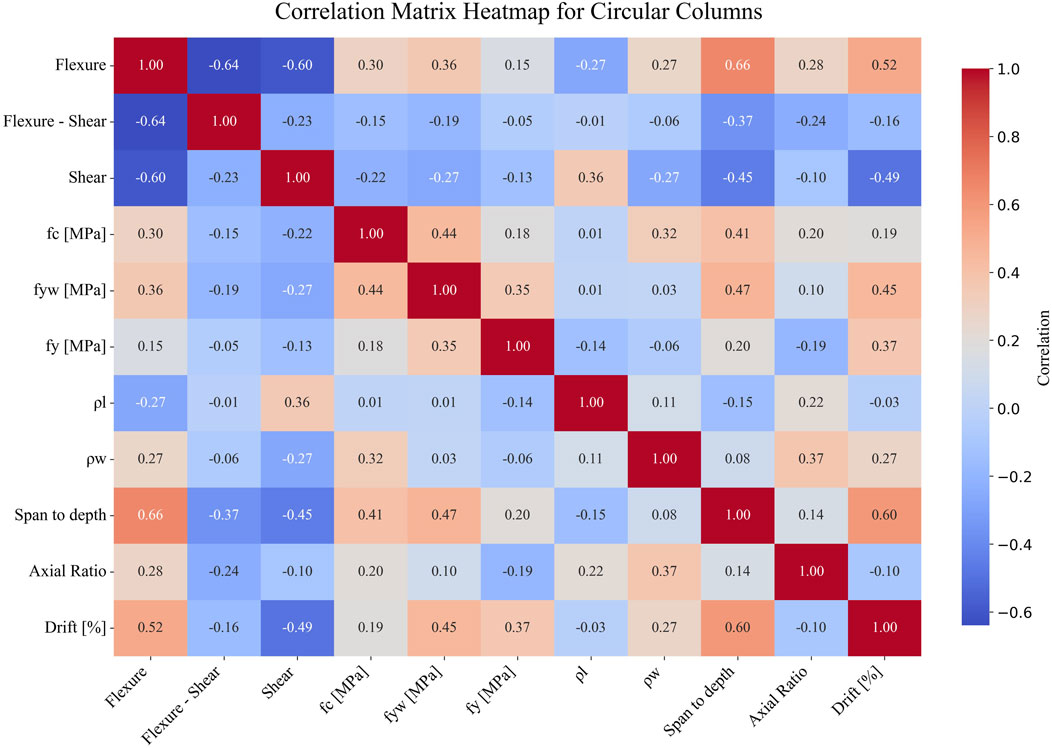
Figure 4. Pearson correlation matrix for circular columns.
For the rectangular columns considered in the study, the plastic rotation capacity shows a moderately positive correlation with the yield strength fy (r = 0.43) and a weaker positive correlation with the flexural failure mode (r = 0.30) and concrete compressive strength fc (r = 0.15). A moderate negative correlation is observed with the shear failure mode (r = −0.46), indicating reduced rotational capacity when shear mechanisms dominate. The longitudinal reinforcement ratio ρl has a weak positive correlation (r = 0.13). The shear span-to-depth ratio (L/d) shows a weak positive relationship (r = 0.27), and the axial load ratio (P/Agfc) presents a small negative correlation (r = −0.29). The extremely high coefficient of variation obtained for the transverse reinforcement ratio provides an explanation for its weak correlation with plastic rotational capacity. For the rectangular columns, the yield strength and the failure mode exert more influence on ductility than the reinforcement ratios or the slenderness.
The significant diversity of transverse reinforcement detailing most probably reduces the ability of this parameter to exhibit a consistent linear relationship with the target variable. Moreover, confinement effectiveness, which should positively contribute to plastic rotation capacity, is highly influenced by other factors as well, such as hoops spacing and configuration, diameter, number and placement of longitudinal bars, shear span-to-depth ratio, and axial load ratio, and its contribution may be very low for certain configurations. As mentioned earlier, most of the column specimens were tested at lower axial load ratios, in which the confinement mechanism is not fully engaged.
For the circular columns considered in the study, the plastic rotation capacity is strongly and positively correlated with the shear span-to-depth ratio (r = 0.60) and shows moderate positive relationships with the transverse reinforcement ratio (r = 0.27), the longitudinal reinforcement yield strength (r = 0.37), and the transverse reinforcement yield strength (r = 0.45). The concrete strength also presents a small positive correlation (r = 0.19). A moderate negative correlation is observed with the shear failure mode (r = −0.49), while the axial load ratio shows a weak negative relationship (r = −0.10). Compared to rectangular columns, circular specimens show stronger relationships between the plastic rotation capacity and both L/d and transverse reinforcement properties, possibly reflecting the more uniform confinement effectiveness in circular cross-sections.
2.5 Regressors
2.5.1 Support Vector Regression (SVR)
Support Vector Regression (SVR) is a supervised machine learning algorithm that has been successfully applied in various engineering fields, including structural performance modeling. In contrast to classical regression approaches that aim to minimize the overall prediction error, SVR constructs a regression function, f(x), capable of predicting a continuous target variable from a set of input features. The general form of the prediction function is given by Equation 1:
where:
• f (x) is the predicted output for the input vector x,
• Φ (x) is a nonlinear mapping to a high-dimensional feature space,
• w is the weight vector,
• b is the bias term.
The SVR optimization problem aims to determine the optimal w and b that minimize the model complexity, expressed by the squared norm ∥w∥2, while allowing prediction errors within a tolerance ε. Deviations larger than ε are measured using slack variables ξi and ξi*, which quantify the extent to which predictions fall outside the ε-insensitive zone. The primal optimization problem can be formulated by Equation 2:
subject to the conditions in Equation 3:
where:
• C is a regularization constant penalizing prediction errors outside the ε tube,
• ξi,
To handle nonlinear dependencies, SVR employs kernel functions. One of the most popular kernel functions for SVR is the Radial Basis Function (RBF). The RBF kernel allows SVR to perform regression in the original space while modeling complex, nonlinear relationships implicitly (Smola and Schölkopf, 2004).
As the SVR showed the best performance in the previous study (Kadhim and Craifaleanu, 2025), the model was subsequently reimplemented and further optimized through grid search within a nested cross-validation framework, aiming to enhance its generalization capability and adapt it to the extended database employed in the present study.
2.5.2 Random Forest regression (RF)
Random Forest (RF) is an ensemble learning algorithm that combines the predictions of multiple decision trees to improve accuracy and reduce overfitting. Introduced by Breiman (2001), the method operates by constructing a multitude of regression trees during training and outputting the mean prediction of the individual trees.
Each tree is built from a bootstrap sample of the training dataset, and, at each node split, a random subset of features is considered.
For M decision trees {T1(x), T2(x), … TM(x)}, the prediction of the RF is expressed by Equation 4:
where Tm (x) is the output of the mth decision tree.
Random Forests are characterized by high generalization capacity, the ability to handle multicollinearity, and robustness to overfitting, particularly when applied to noisy or high-dimensional datasets (Verikas et al., 2011). In the study performed by Kadhim and Craifaleanu (2025), RF demonstrated high robustness and low sensitivity to overfitting, confirming its suitability for problems involving numerous input parameters and nonlinear interactions.
2.5.3 Extreme Gradient Boosting (XGBoost)
Extreme Gradient Boosting (XGBoost) is an advanced implementation of gradient boosting machines, largely used recently due to its performance and computational efficiency. The algorithm constructs an ensemble of weak learners, typically regression trees, in a sequential manner, where each new tree corrects the residual errors made by the previous ensemble (Chen and Guestrin, 2016).
At each boosting step t, a new function ft(x) is added to minimize the following regularized objective function in Equation 5:
where:
•
•
• l is a differentiable loss function (e.g., squared error),
•
•
•
This regularized formulation prevents overfitting and ensures model generalization. Additionally, XGBoost uses a second-order Taylor expansion of the loss function and employs shrinkage (learning rate) and column subsampling, enhancing both accuracy and speed.
The final prediction is given by Equation 6:
where T is the total number of trees.
XGBoost was reimplemented in this study for its efficiency and strong predictive capability when modeling nonlinear and interaction-heavy relationships among structural parameters.
2.5.4 Stacking ensemble regression
Stacking is an ensemble learning technique that combines multiple base regressors through a meta-model, which learns to aggregate their outputs in an optimal way. Unlike bagging or boosting, stacking allows the combination of heterogeneous models such as Support Vector Regression, Random Forest, and XGBoost, exploiting their individual strengths while compensating for their weaknesses (Wolpert, 1992).
A typical stacking ensemble consists of two levels:
• Base learners–multiple regressors trained on the same dataset
• Meta-learner–a linear or tree-based model trained on the predictions made by the base learners.
In this work, SVR, RF, and XGBoost served as the base learners, while RidgeCV (Scikit-learn Developers, 2025a). was used as the meta-learner. This approach was adopted to exploit the complementary strengths of the individual algorithms: the ability of SVR to capture smooth nonlinear trends, the robustness of RF to noise and feature interactions, and the strong performance of XGBoost in complex, high-dimensional settings. RidgeCV was chosen as the meta-regressor for its ability to reduce the effects of multicollinearity between the predictions of the base learners through L2 regularization (Scikit-learn Developers, 2025a). It's built-in cross-validation automatically finds the optimal regularization parameter, removing the need for a separate tuning step. This makes the ensemble more stable and improves generalization.
2.6 Model implementation
2.6.1 Data preprocessing
To avoid data leakage and ensure a fair evaluation protocol, the datasets of the rectangular and circular RC columns were split into training and testing sets using an 80/20 ratio before any scaling or transformation was applied. If scaling were performed on the entire dataset prior to splitting, the statistical parameters of the transformation (mean and standard deviation in the case of standardization) would be computed using both training and test samples. This would implicitly transfer information from the test set into the training process, leading to data leakage. Such leakage results in overly optimistic performance estimates, as the model would be indirectly influenced by data that should remain completely unseen until final evaluation (Scikit-learn Developers, 2025b).
To scale the predictors, excluding the categorical parameters such as failure modes, the StandardScaler from scikit-learn (Scikit-learn Developers, 2025c) was fit exclusively on the training subset and then applied to both training and test sets independently. While scaling is not strictly necessary for tree-based models such as RF and XGBoost, it was applied uniformly to ensure comparability between models and to facilitate consistent integration within the stacking ensemble, where base learners operate on inputs of similar magnitude.
To obtain robust and unbiased estimates of model performance, a nested cross-validation (CV) strategy was implemented. This method is especially appropriate when hyperparameter tuning is involved, as it separates model selection from performance evaluation. The nested CV procedure consisted of two levels:
• Outer loop: Estimated the generalization performance by partitioning the training data into five folds using KFold (Scikit-learn Developers, 2025d). Each fold served once as a validation fold, while the remaining four folds were used for training and hyperparameter tuning.
• Inner loop: Within each outer fold’s training data, a second 5-fold CV was conducted to identify the optimal hyperparameters using GridSearchCV (Scikit-learn Developers, 2025e). The configuration achieving the best mean score across the inner folds was selected for model training in that outer loop.
After completing the nested CV procedure, GridSearchCV was rerun on the entire training dataset (80% of the specimens) to select the globally optimal hyperparameters. Each model was then retrained on this complete training set and evaluated once on the independent 20% hold-out test set, which was never used in any stage of training or tuning. This protocol, combined with the strict separation of preprocessing steps between training and test data, ensures that no information leakage or overfitting could occur.
2.6.2 Hyperparameter tuning
The present study performed systematic hyperparameter tuning to maximize predictive accuracy and improve generalization. For each model, a predefined search space of relevant hyperparameter values was established. The tuning was performed using the GridSearchCV function (Scikit-learn Developers, 2025e), which evaluates every possible combination of hyperparameter values by training the model on the training set and assessing its performance through K-Fold cross-validation (Scikit-learn Developers, 2025c). At each fold, the model is fitted on K−1 subsets and validated on the remaining subset, ensuring that all data points are used for both training and validation. GridSearchCV computes the coefficient of determination (R2) for every hyperparameter combination across all cross-validation splits. The configuration yielding the highest average R2 score is selected as optimal. Once identified, the model is retrained on the full training set using these optimal hyperparameters.
The following hyperparameters were optimized in each regressor:
• SVR: regularization parameter C, kernel type, kernel coefficient (γ), epsilon-insensitive tube (ε), and degree (for polynomial kernels).
• RF: number of trees, maximum tree depth, and minimum samples required to split a node.
• XGBoost: number of boosting rounds, maximum tree depth, learning rate, and row subsampling ratio.
• Stacking Regressor: base-level models set to their tuned configurations, with RidgeCV as the meta-learner.
2.6.3 Model interpretation
Model interpretability was examined using SHAP (SHapley Additive exPlanations) (Lundberg, 2018), a method that breaks down each individual prediction into the contributions made by each input feature. Based on concepts from game theory, SHAP values indicate how much each variable increases or decreases the predicted output. This analysis was applied only to the three individual regressors (SVR, RF, and XGBoost). The results provided a clearer view of the internal decision-making process, highlighting the most influential parameters and allowing comparison of feature importance across models.
2.7 Performance evaluation metrics
To assess the predictive capability of each regression model, several performance metrics were employed: the coefficient of determination (R2), the adjusted coefficient of determination (Adjusted R2), the mean absolute error (MAE), the root mean squared error (RMSE), and the mean absolute percentage error (MAPE).
The reported nested CV R2 values represent the average performance computed across the five outer folds of the nested cross-validation, based on the respective test subsets. After hyperparameter tuning, each optimized model was retrained on the whole training dataset and evaluated on the independent test set, where all metrics (R2, Adjusted R2, MAE, RMSE, and MAPE) were reported to ensure a comprehensive assessment of model performance.
The coefficient of determination R2 (Scikit-learn Developers, 2025f) measures the proportion of variance in the dependent variable that is predictable from the independent variables. It is defined by Equation 7:
where:
•
•
•
The adjusted coefficient of determination (Adjusted R2) corrects the value of R2 by taking into account the number of predictors relative to the sample size, thus providing a more unbiased estimate of model performance. It is defined by Equation 8:
where:
•
•
•
The mean absolute error (MAE) (Scikit-learn Developers, 2025g) quantifies the average magnitude of the absolute differences between predicted and observed values, without considering their direction (Equation 9):
MAE is expressed in the same unit as the target variable and provides an intuitive understanding of average prediction error.
The root mean squared error (RMSE) (Scikit-learn Developers, 2025h), also expressed in the same unit as the target variable, is defined as the square root of the mean squared error (Equation 10) and penalizes larger deviations more strongly than MAE:
Finally, the mean absolute percentage error (MAPE) (Scikit-learn Developers, 2025i) expresses the prediction error as a percentage relative to the observed values (Equation 11):
The evaluation was carried out separately for each model and for both column cross-section types (rectangular and circular) to allow a consistent and interpretable comparison across all methods.
3 Results and discussion
Following optimization, the best-performing models were trained on the entire training set and subsequently evaluated on the independent test set using a comprehensive set of performance metrics, namely, the coefficient of determination (R2), the adjusted coefficient of determination (Adjusted R2), the mean absolute error (MAE), the root mean squared error (RMSE), and the mean absolute percentage error (MAPE).The optimized hyperparameters for each model are summarized in Table 3.

Table 3. Optimized hyperparameters for each model.
The statistical indicators obtained on the test set, together with the nested CV average R2 scores for the three base models, applied separately to circular and rectangular columns, are presented in Table 4 and illustrated in Figure 5. All models demonstrated very good predictive accuracy, with slightly higher performance on the rectangular column dataset, as indicated by higher R2 and Adjusted R2 values and lower MAE, RMSE, and MAPE values on the corresponding test sets.
• Rectangular columns: XGBoost achieved the highest average R2 (0.71) across the five outer folds during hyperparameter tuning, while SVR yielded the best test set performance (R2 = 0.83, Adj. R2 = 0.79, MAE = 0.64, RMSE = 0.75, MAPE = 20.5%).
• Circular columns: Random Forest attained the highest average R2 during optimization (0.61), closely followed by SVR (0.60). On the test set, SVR again provided the best performance (R2 = 0.79, Adj. R2 = 0.70, MAE = 0.92, RMSE = 1.11, MAPE = 20.9%).
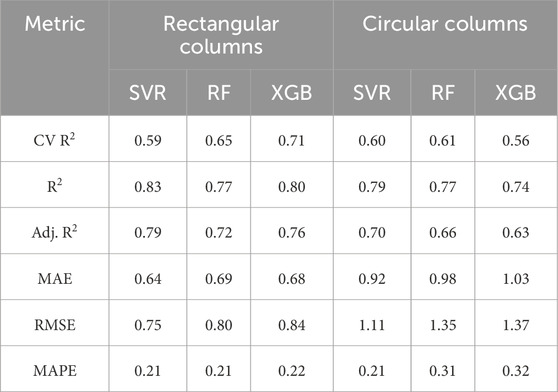
Table 4. Performance metrics of the optimized models on the test sets for rectangular and circular columns.
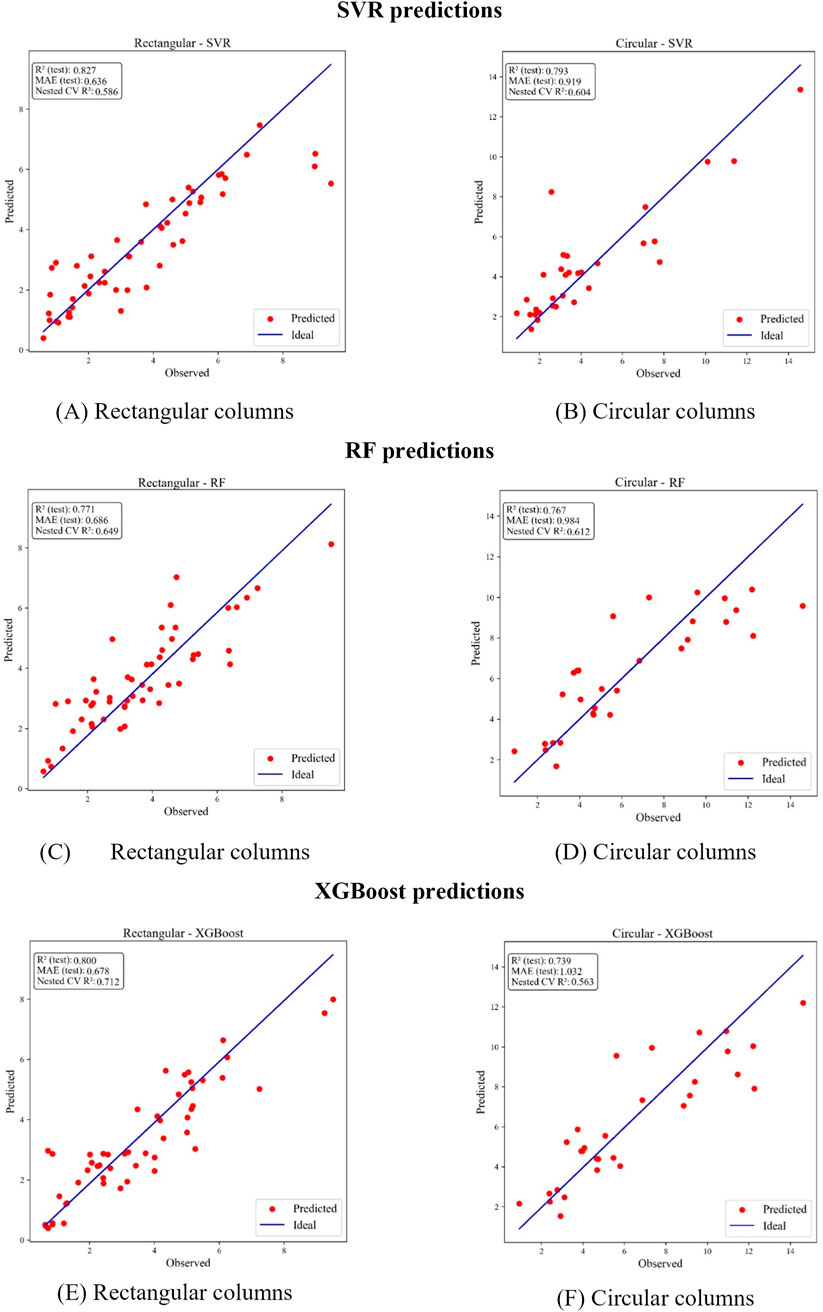
Figure 5. Predicted vs. observed values for (A) rectangular SVR, (B) circular SVR, (C) rectangular RF, (D) circular RF, (E) rectangular XGBoost, and (F) circular XGBoost.
Regarding the most influential input parameters, for rectangular columns, both SHAP and Pearson correlation analyses consistently identified yield strength (fy) as a key factor influencing plastic rotational capacity. Pearson coefficients show a moderate positive correlation for fy (r = 0.43), while SHAP values rank fy among the top predictors across all three models. The shear span-to-depth ratio (L/d) also appears in both analyses, with Pearson showing a weaker correlation (r = 0.27) and SHAP revealing a stronger nonlinear contribution in all models. In contrast, parameters like transverse reinforcement ratio (ρw) have negligible Pearson correlation but are given moderate importance by SHAP, indicating nonlinear or interaction effects not captured by linear correlation.
For circular columns, both methods highlight L/d and transverse reinforcement yield strength (fyw) as important. Pearson analysis reports a strong correlation for L/d (r = 0.60) and moderate for fyw (r = 0.45), which aligns with their high SHAP importance across SVR, RF, and XGBoost. Axial load ratio shows a weak Pearson correlation (r = – 0.10) but is given higher SHAP significance in the models, again suggesting nonlinear influence.
Pearson correlations indicate that the main variables show weak linear associations with each other (e.g., axial load ratio and transverse reinforcement r = 0.02 for rectangular and r = 0.37 for circular columns; axial load ratio and longitudinal reinforcement r = 0.05 and r = −0.22, respectively). Similarly, the correlation between span-to-depth ratio and transverse reinforcement is almost negligible (r = 0.04 for rectangular, r = 0.08 for circular). Despite these near-zero values, SHAP analysis highlights that the combined action of these parameters plays a decisive role in governing plastic rotational capacity. For example, transverse reinforcement improves confinement and ductility, but this beneficial effect is significantly reduced when the axial load ratio is high, as the enlarged concrete compression zone limits deformation capacity. Moreover, the yield stress of transverse reinforcement (fyw) directly influences shear capacity, and low shear resistance often results in brittle failures. Likewise, small L/d ratios are typically associated with brittle shear-controlled failures, and SHAP shows that this effect is exacerbated when transverse reinforcement is insufficient. Longitudinal reinforcement ratio exhibits a dual influence: high percentages of tensile reinforcement relative to the compressed bars increase the size of the concrete compression zone and reduce ductility, particularly under high axial load, whereas very low reinforcement levels may result in reduced flexural strength and premature rupture of the tensile bars before displacement demands are reached. In addition, longitudinal reinforcement yield stress (fy) governs flexural strength, such that low fy (lower strength steels) reduces moment capacity. However, in exchange, lower strength steels typically exhibit increased strain ductility, as compared with those of higher strength, which contributes to increasing the plastic deformation capacity. These findings demonstrate that SHAP uncovers nonlinear interaction effects between parameters that appear nearly uncorrelated in Pearson analysis, underlining the importance of multivariate interactions in explaining ductility and rotational capacity. From a design perspective, these results highlight the need to ensure a balanced combination of axial load level, span-to-depth ratio, and reinforcement detailing to avoid brittle failure and to achieve reliable ductile performance.Overall, the agreement between SHAP and Pearson is strongest for variables with direct physical links to rotational capacity (L/d, fy, fyw), while discrepancies arise mainly for parameters with nonlinear or interaction-driven effects, where SHAP provides additional insights beyond the linear relationships measured by Pearson coefficients.
Figure 6 shows the SHAP feature importance for each base model.
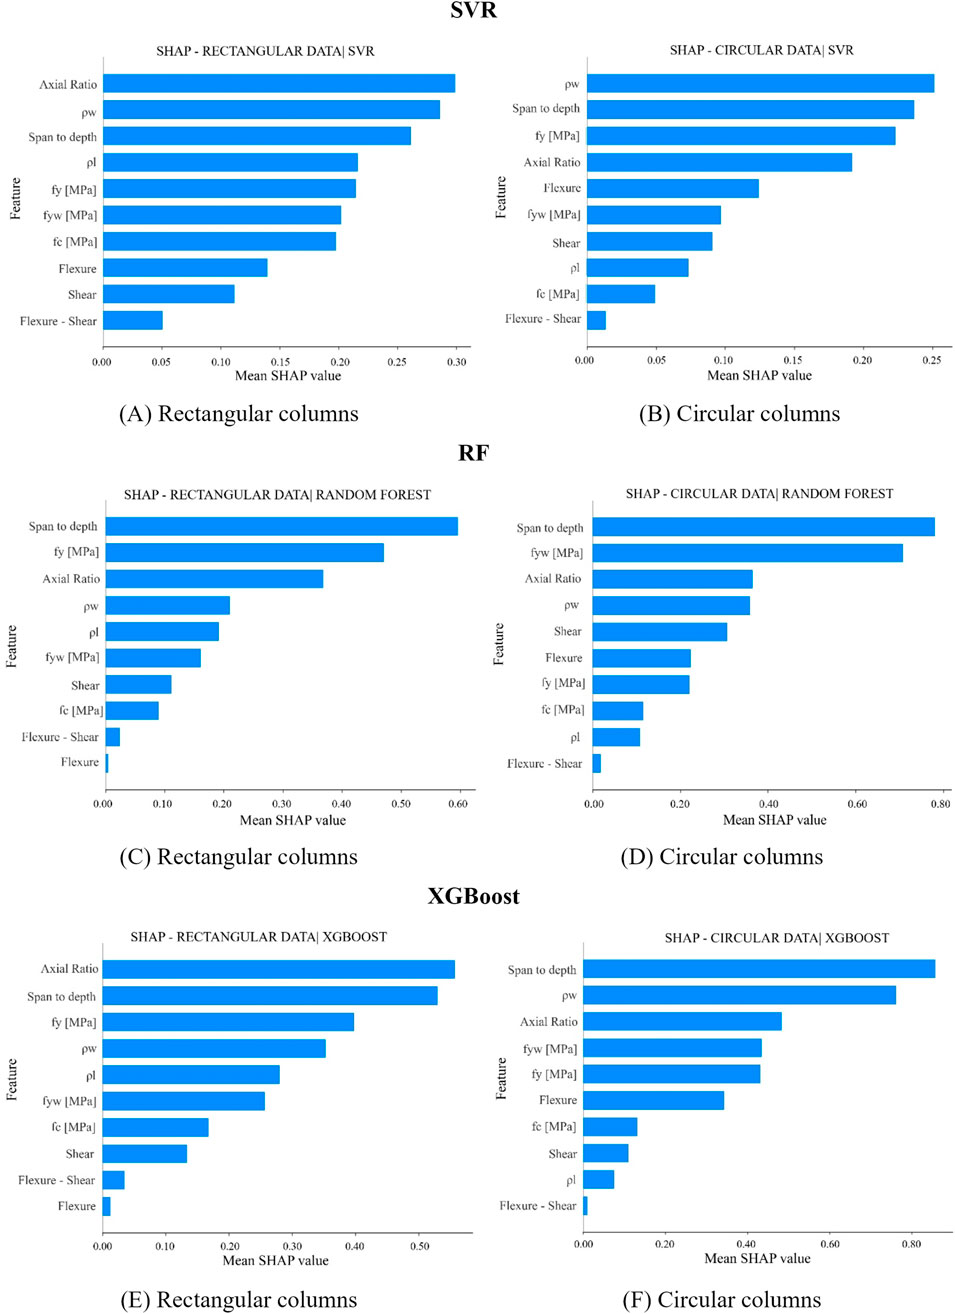
Figure 6. SHAP feature importance for (A) rectangular SVR, (B) circular SVR, (C) rectangular RF, (D) circular RF, (E) rectangular XGBoost, and (F) circular XGBoost.
To further enhance accuracy, the three base models were integrated into a Stacking Ensemble Regressor, with RidgeCV as the meta-learner. The ensemble approach provided the best overall accuracy, achieving superior values of R2 and MAE compared to the individual models:
• Rectangular columns: R2 = 0.82, Adj. R2 = 0.78, MAE = 0.51, RMSE = 0.82, MAPE = 22.8%
• Circular columns: R2 = 0.83, Adj. R2 = 0.76, MAE = 0.76, RMSE = 1.19, MAPE = 21.5%
While RMSE and MAPE values were slightly higher than those obtained with SVR, the ensemble consistently improved the most widely used indicators of regression accuracy (R2 and MAE). This confirms that combining models increases predictive stability and robustness across both ductile and brittle failure modes, as also illustrated in Figure 7.
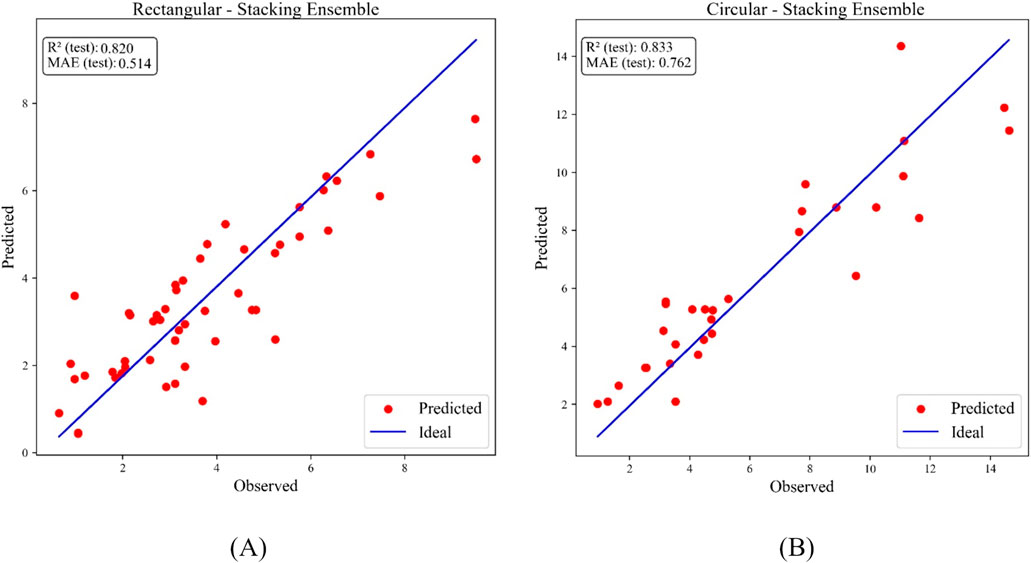
Figure 7. Stacking Ensemble Regressor predictions for (A) rectangular and (B) circular columns.
4 Conclusion
The present study investigated the capacity of four machine learning models (Support Vector Regression (SVR), Random Forest (RF), XGBoost, and a Stacking Ensemble) to predict the plastic rotational capacity of reinforced concrete columns with rectangular and circular cross-sections.
Two experimental databases were employed. The dataset for rectangular columns comprised 258 specimens, of which 147 failed in flexure, 67 exhibited a combination of flexure–shear failure, and 44 failed in a brittle manner due to shear. The dataset for circular columns contained 151 specimens, of which 94 experienced flexural failure, 27 failed due to combined flexure–shear mechanisms, and 30 failed primarily due to shear.
Hyperparameter tuning was carried out using grid search within a nested cross-validation framework, where the training data was split into inner folds for hyperparameter tuning and outer folds for performance evaluation. R2 scores averaged over the five outer folds were used to evaluate model generalization, while the final models were assessed on an independent test set using a comprehensive set of indicators, namely, R2, Adjusted R2, MAE, RMSE, and MAPE.SHapley Additive exPlanations (SHAP) analysis was used for interpreting the contribution of each input parameter to the predictions generated by the three base models (SVR, RF, and XGBoost). The results confirmed the dominant influence of longitudinal and transverse reinforcement yield strengths and of span-to-depth ratio on plastic rotational capacity, while also revealing nonlinear effects for parameters such as transverse reinforcement ratio and axial load ratio that were not evident from Pearson correlation analysis.
The integrated use of hyperparameter tuning, nested cross-validation, and SHAP-based interpretability substantially improved the accuracy, robustness, and transparency of the models, compared to previous studies.
Among the individual regressors, SVR achieved the most accurate predictions on the independent test sets, while XGBoost provided the most consistent cross-validation performance and Random Forest showed good robustness to dataset variability.
The Stacking Ensemble Regressor offered the most balanced performance overall, improving R2 and MAE compared to the base models. Although not all error measures were superior to those of SVR, the ensemble provided greater robustness and reliability, confirming the advantage of model integration.Despite these results, the main limitation of the study remains the relatively small number of available experimental tests worldwide, particularly for brittle shear failures. This underrepresentation led to an imbalanced dataset that may affect generalization for these specific failure types.
Overall, the study highlighted, as well, the importance of data sufficiency and accuracy, implementation of advanced validation techniques, systematic hyperparameter tuning, and application of SHAP-based interpretability in obtaining more accurate and reliable models for predicting plastic rotational capacity, in support of their potential application in seismic assessment and performance-based design.
Data availability statement
Publicly available datasets were analyzed in this study. The main part of the data can be found here: https://nisee.berkeley.edu/spd/, while the other sources used were cited in Sections 2.2 of the paper.
Author contributions
A-OK: Methodology, Conceptualization, Validation, Investigation, Writing – original draft, Visualization, Data curation, Software, Formal Analysis. I-GC: Funding acquisition, Project administration, Formal Analysis, Writing – review and editing, Validation, Conceptualization, Supervision, Investigation. EL: Validation, Formal Analysis, Writing – review and editing, Supervision.
Funding
The author(s) declare that financial support was received for the research and/or publication of this article. This study was partially funded through Grant No. GnaC-ARUST-2024-UTCB-17, provided by the Technical University of Civil Engineering Bucharest. The financial support for the publication of this article is gratefully acknowledged.
Conflict of interest
The authors declare that the research was conducted in the absence of any commercial or financial relationships that could be construed as a potential conflict of interest.
Generative AI statement
The author(s) declare that no Generative AI was used in the creation of this manuscript.
Any alternative text (alt text) provided alongside figures in this article has been generated by Frontiers with the support of artificial intelligence and reasonable efforts have been made to ensure accuracy, including review by the authors wherever possible. If you identify any issues, please contact us.
Publisher’s note
All claims expressed in this article are solely those of the authors and do not necessarily represent those of their affiliated organizations, or those of the publisher, the editors and the reviewers. Any product that may be evaluated in this article, or claim that may be made by its manufacturer, is not guaranteed or endorsed by the publisher.
Supplementary material
The Supplementary Material for this article can be found online at: https://www.frontiersin.org/articles/10.3389/fbuil.2025.1693218/full#supplementary-material
References
Aladsani, M., Burton, H., Abdullah, S., and Wallace, J. (2022). Explainable machine learning model for predicting drift capacity of reinforced concrete walls. ACI Struct. J. 119 (1), 191–204. doi:10.14359/51734484
Berry, M., Parrish, M., and Eberhard, M. (2004). PEER structural performance database user’s manual. Available online at: http://nisee.berkeley.edu.
Chen, T., and Guestrin, C. (2016). “XGBoost: a scalable tree boosting system,” in Proceedings of the 22nd ACM SIGKDD international conference on knowledge discovery and data mining (San Francisco, CA, USA: ACM), 785–794. doi:10.1145/2939672.2939785
Damikoukas, S., and Lagaros, N. D. (2025). A data-driven machine learning framework for predicting building seismic response using ambient vibration data. Lect. Notes Civ. Eng., 141–148. doi:10.1007/978-3-031-92044-8_14
Elwood, K. J., and Moehle, J. P. (2005). Drift capacity of reinforced concrete columns with light transverse reinforcement. Earthq. Spectra 21 (1), 71–89. doi:10.1193/1.1849774
Esaki, F. (1996). “Reinforcing effect of steel plate hoops on ductility of R/C square column,” in Proceedings of the eleventh world conference on earthquake engineering. Elsevier Science Ltd.
German, S., Brilakis, I., and Desroches, R. (2012). Rapid entropy-based detection and properties measurement of concrete spalling with machine vision for post-earthquake safety assessments. Adv. Eng. Inf. 26 (4), 846–858. doi:10.1016/j.aei.2012.06.005
Kadhim, A.-O., and Craifaleanu, I.-G. (2025). Predicting plastic rotational capacity of reinforced concrete elements using machine learning. Model. Civ. Environ. Eng. 20 (1), 20–33. doi:10.2478/mmce-2025-0002
Kameshwar, S., and Padgett, J. E. (2017). Effect of vehicle–bridge interaction on seismic response and fragility of bridges. Earthq. Eng. and Struct. Dyn. 47 (3), 697–713. doi:10.1002/eqe.2986
Koutsourelakis, P. S. (2010). Assessing structural vulnerability against earthquakes using multidimensional fragility surfaces: a Bayesian framework. Probabilistic Eng. Mech. 25 (1), 49–60. doi:10.1016/j.probengmech.2009.05.005
Li, Y.-A., Huang, Y.-T., and Hwang, S.-J. (2014). Seismic response of reinforced concrete short columns failed in shear. ACI Struct. J. 111 (4), 1–10. doi:10.14359/51686780
Lundberg, S. M. (2018). Welcome to the SHAP documentation. În SHAP (SHapley additive exPlanations). Available online at: https://shap.readthedocs.io/en/latest/index.html
Luo, H., and Paal, S. G. (2019). A locally weighted machine learning model for generalized prediction of drift capacity in seismic vulnerability assessments. Computer-Aided Civ. Infrastructure Eng. 34 (11), 935–950. doi:10.1111/mice.12456
Mao, J., Wang, H., and Spencer, B. F. (2020). Toward data anomaly detection for automated structural health monitoring: exploiting generative adversarial nets and autoencoders. Struct. Health Monit. 20 (4), 1609–1626. doi:10.1177/1475921720924601
Melo, J., Varum, H., and Rossetto, T. (2015). Experimental cyclic behaviour of RC columns with plain bars and proposal for eurocode 8 formula improvement. Eng. Struct. 88, 22–36. doi:10.1016/j.engstruct.2015.01.033
Nguyen, M.-S., Thai, D.-K., and Kim, S.-E. (2020). Predicting the axial compressive capacity of circular concrete filled steel tube columns using an artificial neural network. Steel Compos. Struct. 35 (3), 415–437. doi:10.12989/scs.2020.35.3.415
Ousalem, H., Kabeyasawa, T., Tasai, A., and Iwamoto, J. (2025). Effect of hysteretic reversals on lateral and axial capacities of reinforced concrete columns. Available online at: https://data.jci-net.or.jp/data_pdf/25/025-01-2062.pdf.
Pham, T. P., and Li, B. (2014). Seismic performance of reinforced concrete columns with plain longitudinal reinforcing bars. ACI Struct. J. 111. doi:10.14359/51686572
Pujol, S., Ramirez, J. A., and Sozen, M. A. (1999). Drift capacity of reinforced concrete columns subjected to cyclic shear reversals, seismic response of concrete bridges, SP-187. Editor K. Krishnan Farmington Hills, MI: American Concrete Institute. 255–274.
Scikit-learn Developers (2025a). “Ridge regression and classification,” in Scikit-learn: machine learning in python. Available online at: https://scikit-learn.org/stable/modules/linear_model.html#ridge-regression.
Scikit-learn Developers (2025b). “Common pitfalls,” in Scikit-learn: machine learning in python. Available online at: https://scikit-learn.org/stable/common_pitfalls.html.
Scikit-learn Developers (2025c). StandardScaler. În scikit-learn: machine learning in python. Available online at: https://scikit-learn.org/stable/modules/generated/sklearn.preprocessing.StandardScaler.html#sklearn.preprocessing.StandardScaler.
Scikit-learn Developers (2025d). KFold. În Scikit-learn: Machine learning in python (v1.7.1). Available online at: https://scikit-learn.org/stable/modules/generated/sklearn.model_selection.KFold.html.
Scikit-learn Developers (2025e). GridSearchCV. În Scikit-learn: Machine learning in python (v1.7.1). Available online at: https://scikit-learn.org/stable/modules/generated/sklearn.model_selection.GridSearchCV.html.
Scikit-learn Developers (2025f). “sklearn.metrics.r2_score,” in Scikit-learn: machine learning in python. Available online at: https://scikit-learn.org/stable/modules/generated/sklearn.metrics.r2_score.html.
Scikit-learn Developers (2025g). “Sklearn.metrics.mean_absolute_error,” in Scikit-learn: machine learning in python. Available online at: https://scikit-learn.org/stable/modules/generated/sklearn.metrics.mean_absolute_error.html.
Scikit-learn Developers (2025h). in Scikit-learn: machine learning in python. Available online at: https://scikit-learn.org/stable/modules/generated/sklearn.metrics.mean_squared_error.html.
Scikit-learn Developers (2025i). in Scikit-learn: machine learning in python. Available online at: https://scikit-learn.org/stable/modules/generated/sklearn.metrics.mean_absolute_percentage_error.html.
Smola, A. J., and Schölkopf, B. (2004). A tutorial on support vector regression. Statistics Comput. 14 (3), 199–222. doi:10.1023/B:STCO.0000035301.49549.88
Solorzano, G., and Plevris, V. (2022). ANN-Based surrogate model for predicting the lateral load capacity of RC shear walls. 8th Eur. Congr. Comput. Methods Appl. Sci. Eng. doi:10.23967/eccomas.2022.050
Tran, C. T. N. (2010). Experimental and analytical studies on the seismic behavior of reinforced concrete columns with light transverse reinforcement (doctoral dissertation). Singapore: Nanyang Technological University.
Tsiatas, G. C., Kotsiantis, S., and Charalampakis, A. E. (2022). Predicting the response of laminated composite beams: a comparison of machine learning algorithms. Front. Built Environ. 8, 855112. doi:10.3389/fbuil.2022.855112
Verikas, A., Gelzinis, A., and Bacauskiene, M. (2011). Mining data with random forests: a survey and results of new tests. Pattern Recognit. 44 (2), 330–349. doi:10.1016/j.patcog.2010.08.011
Wibowo, A., Wilson, J. L., Lam, N. T. K., and Gad, E. F. (2013). Drift performance of lightly reinforced concrete columns. Eng. Struct. 59, 522–535. doi:10.1016/j.engstruct.2013.11.016
Wolpert, D. H. (1992). Stacked generalization. Neural Netw. 5 (2), 241–259. doi:10.1016/s0893-6080(05)80023-1
Woods, J. M., Kiousis, P. D., Ehsani, M. R., Hamid, S., and Fritz, W. (2006). Bending ductility of rectangular high strength concrete columns. Eng. Struct. 29 (8), 1783–1790. doi:10.1016/j.engstruct.2006.09.024
Wu, D., Ding, Y., Su, J., Li, Z.-X., Zong, L., and Feng, K. (2021). Effects of tie detailing configurations on reinforcement buckling and seismic performance of high-strength RC columns. Soil Dyn. Earthq. Eng. 147, 106791. doi:10.1016/j.soildyn.2021.106791
Xiao, J., and Zhang, C. (2007). Seismic behavior of RC columns with circular, square and diamond sections. Constr. Build. Mater. 22 (5), 801–810. doi:10.1016/j.conbuildmat.2007.01.010
Keywords: reinforced concrete structures, plastic rotation capacity, machine learning, stacked ensemble, SHAP (SHapley additive exPlanations), ensemble learning
Citation: Kadhim A-O, Craifaleanu I-G and Lozincă E (2025) Stacked ensemble and SHAP-based approach for predicting plastic rotational capacity in RC columns. Front. Built Environ. 11:1693218. doi: 10.3389/fbuil.2025.1693218
Received: 26 August 2025; Accepted: 22 September 2025;
Published: 17 October 2025.
Edited by:
Nikos D. Lagaros, National Technical University of Athens, GreeceReviewed by:
Hamid Khodadadi Koodiani, University of Texas at San Antonio, United StatesXiangsheng Liu, University of Nottingham, United Kingdom
Copyright © 2025 Kadhim, Craifaleanu and Lozincă. This is an open-access article distributed under the terms of the Creative Commons Attribution License (CC BY). The use, distribution or reproduction in other forums is permitted, provided the original author(s) and the copyright owner(s) are credited and that the original publication in this journal is cited, in accordance with accepted academic practice. No use, distribution or reproduction is permitted which does not comply with these terms.
*Correspondence: Iolanda-Gabriela Craifaleanu, aW9sYW5kYS5jcmFpZmFsZWFudUB1dGNiLnJv, aS5jcmFpZmFsZWFudUBnbWFpbC5jb20=