 Jitendra Khatti
 Swapnil Mishra
- 1Department of Civil Engineering, Rajasthan Technical University, Kota, Rajasthan, India
- 2Department of Mining Engineering, Indian Institute of Technology (ISM), Dhanbad, India
This research compares the support vector machine (SVM), gene expression programming (GEP), feedforward neural network (FFNN), gated recurrent unit (GRU), long short-term memory (LSTM), support vector regressor (SVR), and bidirectional long short-term memory (BiLSTM) models in predicting penetration (PR) rate of earth pressure balance shield tunnel boring machine (ETBM). A dataset has been compiled using the cutterhead rotation speed (CRS), mean thrust (F/A), mean cutterhead torque (T/D3), upper earth pressure (UEP), lower earth pressure (LEP), and torque penetration index (TPI) features of 1,197 ETBM events. The presence of multicollinearity was analyzed using the variance inflation factor (VIF) method. It was observed that CRS, F/A, T/D3, UEP, LEP, and TPI have weak, moderate, considerable, moderate, problematic, and considerable multicollinearity, respectively. The performance (R) comparison revealed that the BiLSTM models predicted PR (=1.0000 in testing and validation) with higher performance than SVM, SVR, GEP, FFNN, GRU, and LSTM models. In addition, the score analysis (=285), error characteristics curve (=7.03E-07), generalizability (m and n < 0.00), Wilcoxon test (confidence = 95.02%), uncertainty analysis (first rank), Anderson-Darling test (accept the normality hypothesis), and objective function criterion (=0.0003) presented that the BiLSTM model is an optimal performance computational model in predicting PR of ETBM. It was also noted that the CRS, F/A, T/D3, UEP, LEP, and TPI features are more reliable for accurately predicting PR.
1 Introduction
In rock excavation, the performance of a tunnel boring machine (TBM) is an essential parameter (Roxborough and Phillips, 1975). The average revolution of the cutterhead is referred to as the penetration rate, measured in millimeters per revolution (Bruland, 1998). The TBM is capable of high-speed excavation with high-quality performance (Barton, 2000). The net penetration rate of full-face TBM depends on the orientation of the rock anisotropy (Sanio, 1985). The rock mass porosity enhances the penetration rate (Howarth et al., 1986). However, the rock mass penetration rate and geological properties define the project’s overall cost (Alber, 2000). The underground excavation in hard rock using the TBM is difficult because of (i) boreability, (ii) advance rates, and (iii) penetration rates. The failure occurs because of the inaccurate assessment of TBM boreability, advance rate, and penetration rate. These unexpected outcomes demoralize the geotechnical and tunnel engineers who use the TBM for underground excavation (Ozdemir, 1970). Several tunnel and geotechnical engineers used different computational methods to assess the TBM’s performance and solve this issue.
Grima et al. (2000) utilized the neuro-fuzzy method to assess TBM performance. Yagiz (2002) reported a good agreement between actual and estimated penetration rates. Okubo et al. (2003) introduced an expert system to 18 tunnels in Japan, obtaining the most reliable results. Benardos and Kaliampakos (2004) stated that the strategic development of tunneling projects can be executed using an artificial neural network (ANN) model. Bieniawski von Preinl et al. (2006) introduced a new method, namely, the rock mass excavability indicator, for optimizing tunnel construction. The boreability analysis can be performed using an ensemble neural network (Zhao et al., 2007). The empirical method estimates the TBM performance using the average distance between planes of weakness (DPW), the angle between the tunnel axis and the planes of weakness (α), uniaxial compressive strength (UCS), and punch slope index (PSI) with an agreement of 0.82 (Yagiz, 2008). Gong and Zhao (2009) noted that (i) the UCS and volumetric joint count significantly affect the penetration rate, (ii) the UCS of rock is inversely proportional to the penetration rate, (iii) the brittle index and penetration rate growths together, (iv) the penetration rate increases with angle of tunnel axial to joint plane (condition < 600). Hassanpour et al. (2009) concluded that the rock mass cuttability index (RMC) and TBM parameters, specifically the field penetration index (FPI), correlate well. Using empirical approaches, Ma and Luo (2009) accurately predicted the tender prices and budgets of tunneling projects. To derive nonlinear equations, Yagiz et al. (2009) used UCS, rock brittleness index (Bi), DPW, and angle as input variables. The coefficient of determination was obtained to be over 0.80. The researcher also reported that the ANN is a better predictive tool than empirical tools. Hassanpour et al. (2010) analyzed the TBM performance using empirical methods and concluded that (i) RMC has a better relation with FPI and (ii) fracture condition affects the TBM performance. Using a punch penetration test, Yagiz and Gokceoglu (2010) estimated rock brittleness. Hassanpour et al. (2011) noted that FPI is strongly related to rock quality designation (RQD), joint spacing, and uniaxial compressive strength (UCS). Yagiz and Karahan (2011) achieved a higher testing performance of particle swarm optimization (PSO) in assessing the TBM performance, specifically 0.737. Shahriar et al. (2012) estimated the penetration rate using UCS, α, joint spacing (Js), and volumetric joint count (Jv). The authors concluded that (i) penetration rate (PR) has a strong relationship with UCS, (ii) PR increases with UCS and Js, and (iii) PR decreases with Jv. A summary of the published empirical models/equations for predicting TBM performance is given in Table 1.
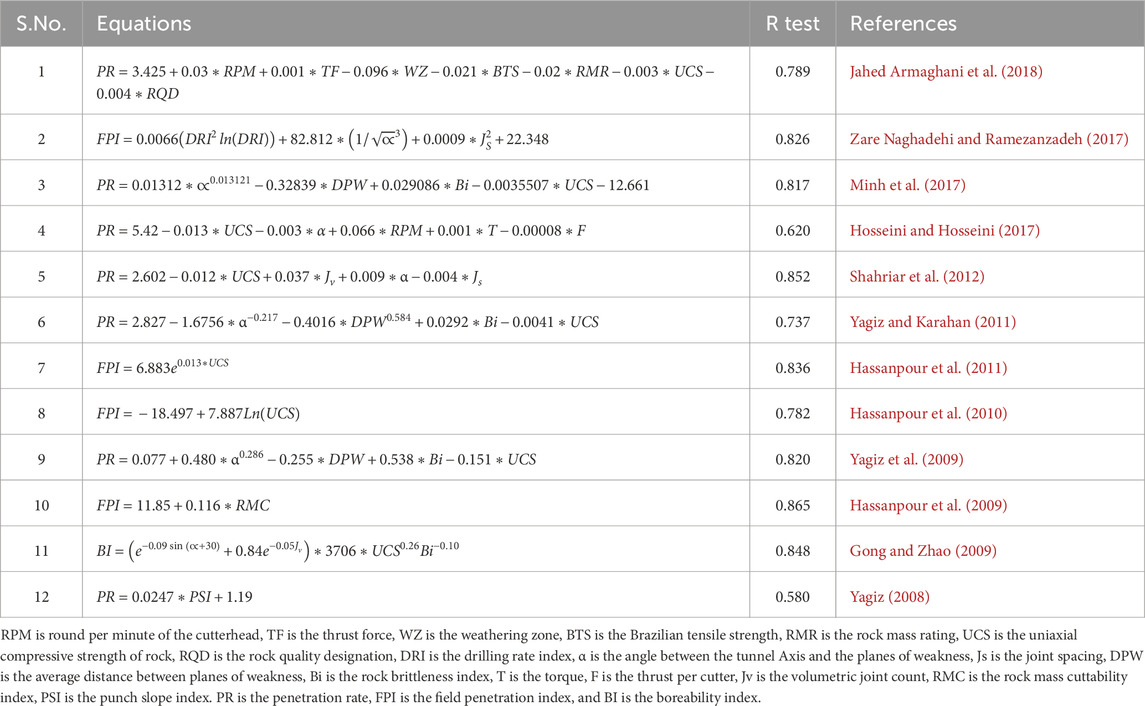
Table 1. Summary of the published empirical models/equations.
Several computational approaches have been developed and employed in tunnel engineering in the last decades to assess TMB performance (PTBM). Song Z. P. et al. (2023) estimated the PTBM using UCS, rock integrity factor (Kv), basic quality index (BQ), RQD, Brazilian tensile strength (BTS), and Bi as input variables for the computational model, i.e., the deep belief network (DBN) model. Song K. et al. (2023) computed PTBM using the whale optimization algorithm-based stacking model (WOA_STK) approach. Shi et al. (2023a) constructed two regression models: an ensemble regression model based on bagging (PRB) and random forest (PRF). Furthermore, Shi et al. (2023b) analyzed the cutting force of the cutter using the polynomial decision tree (DT_PR) model. Zhang et al. (2023) applied a decision forest model to classify the rock-breaking performance of TBM for surrounding rock excavability conditions. Yu Z. et al. (2023) employed support vector machine (SVM), random forest (RF), extreme gradient boosting (XGBoost), and artificial neural network (ANN) models, each combined with whale optimization algorithm (WOA) and sparrow search algorithm (SSA), to assess the PTBM. Yu et al. used RQD, UCS, the ratio of the boulder (RB), compression modulus (CM), internal friction angle (IFA), cohesion (C), cutterhead speed (CS), cutterhead torque (CT), total thrust (TT), and chamber earth pressure (CEP) as input variables to assess the PTBM. Yu H. et al. (2023) stated that the multi-channel decoupled deep neural network (MCD_DNN) model gives a reliable prediction of the PTBM. Conversely, Yan et al. (2023) employed the partial least squares regression with the boosted regression tree (PLSR_BRT) model to predict PTBM, achieving a correlation coefficient (R) of 0.9798 and a root mean square error (RMSE) of 1.78. Wang et al. (2023) noted that the biogeography-based support vector regression (BSVR) predicts PTBM better (R = 0.9995, RMSE = 0.00497) than the biogeography-based multilayer perceptron neural network (BMLPNN) model. Shan et al. (2023) performed real-time PTBM prediction using the recurrent neural network (RNN) with an RMSE of 0.1239. Samadi et al. (2023) assessed the PTBM of metamorphic rocks using fuzzy techniques and concluded that the Takagi-Sugeno fuzzy model performed better, with an R of 0.8741. Qin et al. (2023) computed the cutterhead torque using long short-term memory (LSTM) neural network. Noorian-Bidgoli (2023) employed the whale-optimized gene expression programming (WOA_GEP) model (Li Z. et al., 2021) and predicted PTBM with an RMSE of 1.41, which is better than the ordinary GEP model. An optimization algorithm can better predict PTBM (Lu and Shi, 2023). A two-dimensional convolutional neural network (CNN) predicts TBM’s torque and total thrust with a determination coefficient (R2) of 0.865 and 0.923, respectively (Li et al., 2023). The stochastic model assesses the penetration rate of TBM with a Variance accounted for (VAF) of 84.4%, a determination coefficient (R2) of 0.84, and a root mean square error (RMSE) of 0.03 (Jafarshirzad et al., 2023). Gokceoglu et al. (2023) predicted PTBM for the Bahce-Nurdagi tunnel using a random forest (RF) model. Fu et al. (2023) stated that the graphical convolutional network (GCN) model attains an accuracy of 0.9986 in predicting geological conditions. The cutterhead power and specific energy are significant variables for penetration rate prediction (Flor et al., 2023). Feng and Wang (2023) analyzed the theoretical importance of the field penetration index (FPI) in predicting TBM performance. The researchers reported that the FPI has a good relationship with UCS and rock integrity.
Zhang et al. (2022), Yu et al. (2022), Yang et al. (2022), Wang et al. (2022), Pan et al. (2022), and Mahmoodzadeh et al. (2022) implemented optimized computational models. The investigators obtained the most reliable TBM performance. In addition, Ma et al. (2022) and Liu et al. (2022) compared different machine-learning approaches, including support vector machines, decision trees, K-Nearest Neighbours, Naïve Bayesian, and stacked autoencoders, to determine the most effective prediction tool. Using Copula theory, Li et al. (2022) analyzed the five-dimensional joint probability distribution. Kullarkar et al. (2022) reported that the ANN model predicts the PTBM with low RMSE and high Kazemi and Barati (2022) predicted the PTBM of hard rocks using the multi-gene genetic programming (MGGP) model. Karrari et al. (2022) analyzed rock classification systems and geo-mechanical properties, such as rock mass index (RMI), rock mass quality (RMQ), geological strength index (GSI), rock mass rating (RMR), rock quality designation (RQD), toughness index (TI), joint parameters (JP), Young’s Modulus (E), Brazilian tensile strength (BTS), UCS, and obtained good agreement (in terms of R) of more than 0.75. Kang et al. (2022) classified soil using support vector machine (SVM), decision tree (DT), light gradient boosting machine (LGBM), extreme gradient boosting (XGBoost), gradient boosting (GB), and adaptive boosting (AdaBoost) models, with TBM parameters. Jin et al. (2022) evaluated the cutterhead torque using an adaptive residual long short-term memory (ARLSTM) model, achieving a mean absolute percentage error (MAPE) of 5.2%. Huang et al. (2022) used cutterhead rotational velocity (Vc), cutterhead power (W), cutterhead pressure (CP), total thrust force (F), advance rate (AR), sum of motor current (IC), sum of motor torque (T), sum of motor power (MP), and field penetration index (FPI) to assess the cutter-head torque by the BiLSTM model. Also, Guo et al. (2022), Geng et al. (2022), Bazargan et al. (2022), and Ayawah et al. (2022) successfully assessed the performance of tunnel boring machines using computational approaches.
Liu et al. (2021), Zhou et al. (2021), Zhang et al. (2021), and Zeng et al. (2021) developed the hybrid machine and deep models using the cutter diameter (D), round per minute of cutter (RPM), penetration rate (PR), cutter size (CZ), overload factor-stability factor (N), thrust per cutter (F), torque (T), rock quality designation (RQD), UCS, rock mass rating (RMR), Brazilian tensile strength (BTS), weathering zone (WZ), thrust force per cutter (TFC), and round per minute of the cutter (RPM) variables. Yu et al. (2021) employed semi-supervised learning methods, including support vector machines (SVM), decision trees (DT), k-nearest neighbors (kNN), random forests (RF), and deep neural networks (DNN), to predict the rock mass type for tunnel boring machines (TBM). Xu et al. (2021) noted that the long short-term memory model performed better than convolutional neural network (CNN), Bayesian regularisation (BR), kNN, random forest (RF), gradient tree boosting (GTB), and SVM models, achieving an accuracy of 89.78%. Wu et al. (2021) assessed real-time rock mass conditions using DNN, RF, kNN, and Adaboost models using ten independent variables, i.e., RPM, torque (T), AR, pressure of shield (Ps), pressure of gripper shoe pump (Pgsp), penetration rate (PR), torque (T), cutterhead power (W), pressure of gripper shoe (Pgs), and pressure of control pump (Pcp). Shaterpour-Mamaghani and Copur (2021) used twenty-one datasets to predict the performance of a raised boring machine by empirical methods. Shahrour and Zhang (2021) reviewed the use of computational approaches in tunnel engineering. Parsajoo et al. (2021) and Harandizadeh et al. (2021) compared conventional adaptive neuro-fuzzy inference system (ANFIS) and hybrid ANFIS in predicting TBM performance parameters using rock brittleness index (Bi), field single cutter load (PC), fracture spacing (Fs), and angle between the tunnel axis, the planes of weakness (α), etc. Li J. et al. (2021) estimated the thrust and torque of TBM using LSTM and RF. Grasmick and Mooney (2021) assessed the cutterhead clogging using computational approaches. Goodarzi et al. (2021) studied the Zagros Mountains water tunnel project for predicting the PTBM in soft sedimentary rocks. The researcher observed a strong relationship between UCS, penetration, and cutter load. Garcia et al. (2021) computed the penetration rate of TBM using context and control parameters of TBM. Gao et al. (2021) utilized the LSTM model and compared it with the autoregressive integrated moving average with exogenous variables (ARIMAX) model in assessing the penetration rate of TBM. Gao et al. used penetration rate (PR), thrust force (TF), cutterhead torque (CT), and cutterhead pressure (CP) as input variables to train and test the models. Bardhan et al. (2021) compared minimax probability machine regression (MPMR), relevance vector machine (RVM), extreme learning machine (ELM), functional network (FN), and hybrid ensemble (HENSM) models. Armaghani et al. (2021) used empirical and statistical methods to estimate the PR and AR of TBM in fresh through weathered granite. Afradi et al. (2021) concluded that the fuzzy algorithm is more effective in predicting the penetration rate of TBM.
Zhang Y. et al. (2020a) proposed a particle swarm-optimized relevance vector machine (R = 0.9875) model for assessing the PTBM. Moreover, Zhang et al. (2020b) used big data, i.e., 15182017, to assess the PTBM. Zhang et al. (2020c) concluded that the classification and regression tree (CART) predicted the PTBM with residuals of 0.003135. Liu B. et al. (2020) assessed the rock mass parameters, i.e., UCS, angle between the tunnel axis and the planes of weakness (α), average distance between planes of weakness (DPW), and rock brittleness index (Bi), with the R2 of 0.737, 0.845, 0.731, and 0.657 using model simulated annealing backpropagation neural network (SA_BPNN) by thrust per cutter (F), torque (T), PR, and RPM input parameters. In addition, Liu Q. et al. (2020) predicted rock mass parameters using the AdaBoost_CART model with an accuracy of 0.865.
Zhou et al. (2020), Yang et al. (2020), Samaei et al. (2020), Rispoli et al. (2020), Nagrecha et al. (2020), Mokhtari and Mooney (2020), Koopialipoor et al. (2020), and Hasanpour et al. (2020) compared the machine, hybrid, and deep learning approaches. It is noted that the quality and quantity of the database affect the model’s performance. It was also found that selecting a suitable optimization algorithm plays a crucial role in the prediction. Arbabsiar et al. (2020) used 2058 datasets to assess the advance rate of TBM in hard rock. Afradi et al. (2020) compared the ant colony optimization (ACO), bee colony optimization (BCO), and particle swarm optimization (PSO) algorithms. The authors noted that the PSO predicts the PR of TBM with an R2 of 0.9717 and an RMSE of 0.3418. Afradi and Ebrahimabadi (2020) compared the SVM, ANN, and GEP models to predict the penetration rate of TBM. The authors concluded that the GEP model predicted PR better than the SVM and ANN models, with an RMSE of 0.11. Abolhosseini et al. (2020) analyzed the geotechnical parameters that affect the PR of TBM. For that aim, the investigators used UCS, BTS, Young’s Modulus (E), porosity (n), tunnel quality index (Q), geological strength index (GSI), rock structure rating (RR), cutter life index (CLI), and RMR parameters to predict the PR. Koopialipoor et al. (2019a) predicted PTBM utilizing the group method of data handling (GMDH) approach with an R2 = 0.924 and RMSE = 0.169. Koopialipoor et al. (2019b) used RQD, UCS, rock mass rating (RMR), BTS, weathering zone (WZ), thrust force (TF), and RPM to assess the PR of TBM using 100 datasets. Conversely, Zhang et al. (2019) used a big operational dataset to assess the geological condition of the TBM. Xu et al. (2019) stated that ANN predicts the PR of TBM with higher performance than kNN, SVM, CART, and Chi-squared automatic interaction detection (CHAID) approaches in the testing phase. Seker and Ocak (2019) estimated the performance of road headers using the ELM approach. Liu et al. (2019) implemented improved SVR models using UCS, Bi, DPW, and α parameters of 180 samples. Frough et al. (2019), Fattahi (2019), Chen et al. (2019), Tan et al. (2018), Sun et al. (2018), Shaterpour-Mamaghani et al. (2018), Salimi et al. (2018), Naghadehi et al. (2018), Mikaeil et al. (2018), Jamshidi (2018), and Jahed Armaghani et al. (2018) concluded that the soft computing approaches are less time-consuming and reliable. Still, a quality database is required to achieve an excellent performance. Conversely, Fatemi et al. (2018), Avunduk and Copur (2018), Zare Naghadehi and Ramezanzadeh (2017), Yagiz (2017), Salimi et al. (2017), Minh et al. (2017), Hosseini and Hosseini (2017), Fattahi and Babanouri (2017), Armaghani et al. (2017), and Adoko et al. (2017) obtained a good relationship among PTBM, UCS, RQD, joint condition rating in RMR (Jc), joint spacing (Js), α, plastic limit, joint spacing (Js), Bi, siever’s J value (SJ), drilling rate index (DRI), abrasion value (AV), BTS, fracture spacing (FS), individual cutter force (Fn), RQD, joint condition rating in RMR (Jc), ground water (GW), RMR, tunnel quality index (Q), and geological strength index (GSI), thrust per cutter (F), torque (T), RPM, the average distance between planes of weakness (DPW), weathering zone (WZ), thrust force (TF), and RPM. Table 2 summarises the computational models used for predicting tunnel boring machine performance.

Table 2. Summary of published computational models.
1.1 Gap identification
The literature study demonstrates that several researchers employed SVR, SVM, GEP, ANN, and LSTM models to predict the performance of ETBM. These investigations were conducted using various datasets and features. It is well known that feature selection plays a crucial role in predicting ETBM performance. Most researchers employed the soft computing models using different combinations of Bi, BTS, C, CT, CLI, CM, CS, DPW, EPF, F, IFA, Js, OP, T, W, TT, PSI, and WZ features to predict the performance of ETBM. Still, no researcher has developed and compared the different soft computing approaches, i.e., SVR, SVM, GEP, FFNN, GRU, LSTM, and BiLSTM, using cutterhead rotation speed (CRS), mean thrust (F/A), mean cutterhead torque (T/D3), upper earth pressure (UEP), lower earth pressure (LEP), and torque penetration index (TPI) features to assess the ETBM performance. The literature also demonstrated that the prediction capabilities of soft computing models are significantly affected by the number of databases. Therefore, it is quite less possible to speak about the optimal performance model to predict the performance of ETBM. The thorough literature review illustrates that no investigator has determined, analyzed, and discussed the collinearity in the dataset and its effect on the prediction capabilities of computational models.
1.2 Novelty of the current investigation
Based on the gap identified in the literature, the following novelty statements have been drawn:
• The present investigation employs the SVR, SVM, GEP, FFNN, GRU, LSTM, and BiLSTM models to analyze their capabilities in predicting the penetration rate of shield tunnel boring machine in mixed face conditions.
• The research trains, tests, and validates the prediction capabilities of SVR, SVM, GEP, FFNN, GRU, LSTM, and BiLSTM models using cutterhead rotation speed (CRS), mean thrust (F/A), mean cutterhead torque (T/D3), upper earth pressure (UEP), lower earth pressure (LEP), and torque penetration index (TPI) features for the first time in predicting the penetration rate of TBM.
• This study examines the multicollinearity of CRS, F/A, T/D3, UEP, LEP, and TPI features using the variance inflation factor (VIF) method and analyzes the impact of feature multicollinearity on the prediction capabilities of SVR, SVM, GEP, FFNN, GRU, LSTM, and BiLSTM models.
• This investigation performs extensive analyses, including score analysis, error characteristics curve, Wilcoxon test, Uncertainty analysis, curve fitting, and accuracy matrix, to determine the optimal performance model for predicting the penetration rate of TBM.
1.3 Research significance
Alber (2000) stated, “The overall tunnel project cost depends on the TBM performance and geological properties, which is not easy to estimate.” Conversely, Ozdemir (1970) said, “The underground excavation in mixed face using the TBM is difficult, and the unexpected outcomes demoralize the geotechnical and tunnel engineers to use the TBM for underground excavation. This investigation will help tunnel and mining engineers calculate the penetration rate of ETBM and propose the overall cost of the tunnel project. This work will help engineers select the suitable computational method for predicting the ETBM performance.
2 Investigation methodology
This research implements SVR, SVM, GEP, FFNN, GRU, LSTM, and BiLSTM models to predict the penetration (PR) rate of ETBM. The cutterhead rotation speed (CRS in RPM), mean thrust (F/A in MF), mean cutterhead torque (T/D3 in MT), upper earth pressure (UEP in MPa), lower earth pressure (LEP in MPa), and torque penetration index (TPI) parameters of 1197 datasets have been used for the first time in assessing the PR of ETBM. The selected parameters have been screened (Asteris et al., 2020) and normalized using the min-max function (Asteris et al., 2025a; 2025b) to develop models. The multicollinearity of the database has been determined for CRS, F/A, T/D3, UEP, LEP, and TPI parameters using the variance inflation factor (VIF) method. Furthermore, the hypothesis has been analyzed and identified using analysis of variance (ANOVA) and Z tests. Based on the literature study, it has been observed that researchers employed different soft computing models using 70:30 and 80:20 datasets (train: test). Therefore, 1,000 (=84%), 100 (=8%), and 97 (=8%) data points have been randomly selected for training (TRNG), testing (TSTG), and validation (VDTN) purposes, published by Yan (2022). The models based on SVR, SVM, GEP, FFNN, GRU, LSTM, and BiLSTM approaches have been developed and configured using MATLAB R2020a and Python platforms. Three new performance indexes, i.e., IOS, IOA, and a20, have been implemented to measure the prediction capabilities of the computational models. In addition, conventional performance metrics, including RMSE, MAE, MAPE, WMAPE, NS, NMBE, VAF, R2, adj R2, RSR, and R, have been used to measure the performance of models. A score analysis is performed for each TRNG, TSTG, and VDTN phase of PR prediction. In addition, the prediction accuracy has been determined by plotting the regression error characteristics (REC) curve and calculating the curve’s (AOC) area. Moreover, the accuracy metrics have been derived using TRNG, TSTG, and VDTN performance metrics, namely, R, RSR, R2, VAF, NS, MAE, and RMSE. A generalizability analysis is also performed for the PR prediction. The predicted and actual penetration rates of ETBM have been compared using the Wilcoxon test. An uncertainty analysis is also performed to determine the uncertainty of the variables. The curve fitting is determined by computing the ratio of test/validation to training RMSE. To determine the normality of the output, the Anderson-Darling (AD) test is performed on the actual and predicted penetration rates of ETBM. Finally, an optimal performance computational model has been introduced to predict the PR of ETBM based on the overall analysis of performance metrics, generalizability, Wilcoxon test, uncertainty analysis, curve fitting, accuracy metrics, and AD test. The ability of the optimal performance model has also been analyzed by (i) performance comparison and (ii) parametric comparison in terms of correlation coefficient. Thus, the current work introduces an optimal performance computational model for assessing the PR of ETBM. Figure 1 presents the investigation methodology.

Figure 1. Investigation methodology chart.
3 Data analysis and computational methods
3.1 Data analysis
The present research uses the database published by Yan (2022), which was collected from the project in the center of Guangzhou City, China, connecting Dayuan station (Long-Da section) and Guangzhou South station, as shown in Figure 2a. The distance between Zhuliao Station and Guangzhou South Station is approximately 46.5 km. The Long-Da section had two sections: mining and shield tunnel sections (approximate length is 3.11 km). Before shield tunnel excavation, a series of boreholes were drilled along the tunnel alignment to assess the geological conditions. Soil and rock samples extracted from these boreholes were tested to determine the geotechnical parameters required for shield tunneling. However, the geological properties between boreholes were estimated through interpolation, which may not accurately capture the real-time subsurface conditions encountered during tunneling. As such, the geological profile derived from borehole data only offers an approximate representation of the actual ground conditions. Based on the borehole investigations, the geological formations along the west and east tunnel lines were classified into three categories: formations with soft soil, formations with uneven soft soil and hard rock, and formations with full-section hard rock. The distribution of these formations is as follows: (a) formation with soft soil: 1,159 m (37.3%) along the west line and 1,131 m (35.3%) along the east line, (b) formation with uneven soft soil and hard rock: 1,194 m (38.5%) along the west line and 1,236 m (39.7%) along the east line, and (c) formation with full-section hard rock: 747 m (24.1%) along the west line and 750 m (24.1%) along the east line.
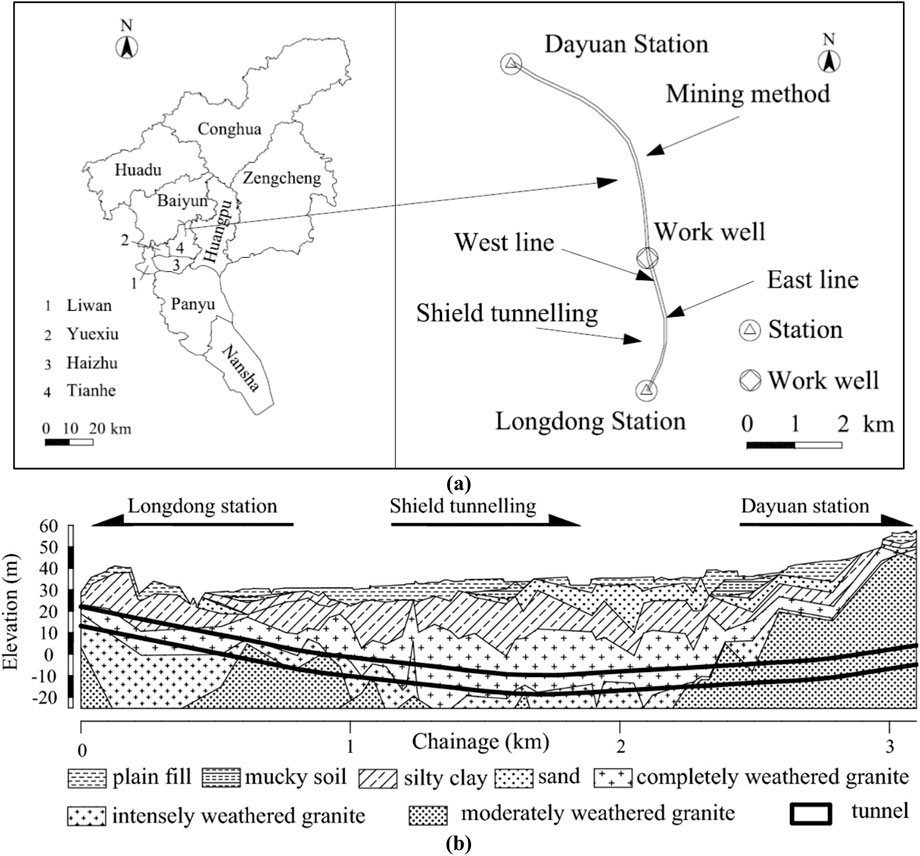
Figure 2. Illustration of (a) map of Guangzhou City and Long-Da section, (b) geological profile of construction site.
The earth pressure balance shield machine (ETBM) was installed to excavate the double-line tunnel. The ETBM was configured with a shield diameter of 9,150 mm, shield length of 15 m, entire device length of 103 m, a total mass of 1,260 t, installed power of 4,500 kW, screw conveyor power of 315 kW, cutter-head power of 12*250 kW, cutter-head speed of 0–2.8 r/min, the cutter-head opening rate of 35%, maximum torque of 19760 kN.m, the maximum thrust of 81.895 kN, and a maximal advance rate of 60 mm/min. The geological conditions and properties were determined from the boreholes along the tunnel, as shown in Figure 2b.
The database consists of 1,197 results of cutterhead rotation speed (CRS), advance rate (AR), mean thrust (F/A), mean cutterhead torque (T/D3), upper earth pressure (UEP), lower earth pressure (LEP), penetration rate (PR), torque penetration index (TPI), specific energy (SE), field penetration index (FPI). The CRS (in RPM), F/A (in MF), T/D3 (in MT), UEP (in MPa), LEP (in MPa), and TPI have been used as independent variables to assess the PR of ETBM. Table 3 presents the statistical summary of the independent and dependent variables. Furthermore, the frequency distributions of each variable (independent and dependent) have been determined and plotted in Supplementary Figure A1.

Table 3. Statistical summary of datasets.
The strength among the variables is identified using the correlation coefficient method, which includes both linear and nonlinear methods. The present study employs the distance correlation coefficient method, a nonlinear approach, to examine the strength of relationships among CRS, F/A, T/D3, UEP, LEP, TPI, AR, and PR. The value of correlation shows (i) very strong strength if it is more than ±0.81, (ii) strong strength if it varies from ±0.61 to ±0.80, (iii) moderate strength if it varies from ±0.41 to ±0.60, (iv) weak strength if it varies from ±0.21 to ±0.40, (v) no strength if it varies from ±0.00 to ±0.20 (Hair et al., 2013). Figure 3 presents the strength of the variables used in this work.

Figure 3. Strength among the variables using the distance correlation method.
Figure 3 illustrates that (a) CRS has strong strength with PR, TPI, and T/D3; (b) CRS has very strong strength with LEP, UEP, and F/A; (c) F/A has strong strength with PR; (d) F/A very strongly strengthen with TPI, LEP, UEP, T/D3, CRS; (e) T/D3 has very strong strength with TPI, LEP, UEP, F/A; (f) T/D3 strongly strengthen with PR and CRS; (g) UEP has very strong strength with CRS, F/A, T/D3, LEP; (h) UEP strongly strengthen with PR and TPI; (i) LEP very strongly strengthen with CRS, F/A, T/D3, UEP; (j) LEP strongly strengthen with PR and TPI; and (k) TPI very strongly strengthen with PR, T/D3, and F/A. Figure 5 illustrates the cumulative predictive strength of CRS, F/A, T/D3, UEP, LEP, and TPI variables in predicting the PR (Figure 4) of ETBM. Figure 4 presents that the TPI, F/A, CRS, LEP, T/D3, and UEP variables have cumulative strength of 84.72%, 80.20%, 79.55%, 79.13%, 78.91%, and 77.92%, respectively, with PR. It can be observed that the TPI variable plays a significant role in predicting PR.

Figure 4. Cumulative strength of input variables with PR.
The distance correlation and cumulative strength results demonstrate the significance of the input variables, indicating the presence of multicollinearity. Therefore, a multicollinearity analysis has been performed for each input variable to predict the probability of penetration rate (PR) of ETBM. Multicollinearity is a phenomenon that occurs when the variables are highly correlated in regression analysis. Figure 3 reveals the multicollinearity between the CRS (=0.795) and LEP (=0.791) in the PR prediction. The correlation coefficient is one method used to determine the degree of multicollinearity in a dataset. However, the correlation coefficient does not reveal the level of multicollinearity. Therefore, the variance inflation factor

Table 4. Results of dataset multicollinearity.
The following statements have been mapped for the research hypothesis (RH) based on the multicollinearity results.
• Cutterhead rotation speed (CRS) and lower earth pressure (LEP) affect the prediction of the PR of TBM.
• Mean thrust (F/A), mean cutter-head torque (T/D3), and torque penetration index (TPI) have equal contributions in the prediction of the PR of TBM.
Analysis of variance (ANOVA) and Z and T tests are statistical approaches used to test the research hypothesis. The t-test is performed for limited datasets, i.e., those with fewer than 30 observations. However, this research consists of more than 30 datasets. Therefore, the ANOVA test is performed in this research, and the results are mentioned in Supplementary Table A1. From Supplementary Table A1, it is noted that the CRS (=2098.6), F/A (=7800.7), T/D3 (=809.0), UEP (=2472.5), LEP (=2460.5), and TPI (=1461.4) have higher F value than F crit value, i.e., 3.8 in the PR prediction. Moreover, the CRS, F/A, T/D3, UEP, LEP, and TPI variables have p-values of less than 0.05. Therefore, the variables accept the RH in predicting PR. Furthermore, a Z-test has been performed to confirm the research hypothesis. The results of the Z-test have been summarised in Supplementary Table A2. Supplementary Table A2 shows that the CRS, T/D3, UEP, and LEP variables have negative z-values, indicating that the z-scores are below the mean. It can be seen that the CRS, F/A, T/D3, UEP, LEP, and TPI variables have higher z critical two tail values (=1.96) than z critical one tail (=1.64). According to the outcomes of the ANOVA and Z tests, it can be stated that the selected variables—i.e., CRS, F/A, T/D3, UEP, LEP, and TPI—follow the statistical criteria in predicting PR, and support the research hypothesis statements for the current study.
3.2 Computational approaches
3.2.1 Support vector regressor (SVR)
One popular supervised learning network for estimating continuous variables is support vector regression (SVR). The support vector machine (SVM) algorithm and SVR concept are comparable. The hyperplane with maximum marks in this model of computing machinery is the best-fit line (Khatti et al., 2023; Smola and Schölkopf, 2004). SVR is well-suited for predicting TBM penetration rate due to its ability to model non-linear relationships between input features (e.g., geotechnical parameters, machine settings) and output values. Its robustness to outliers and high generalization capability make it ideal for handling noisy real-world data often encountered in tunneling operations.
3.2.2 Support vector machine (SVM)
Support vector machine (SVM) is an established method of supervised machine learning algorithms successfully applied to classify and predict with small samples and nonlinearity by constructing a hyperplane or set of hyperplanes in a high or infinite-dimensional space (Cortes and Vapnik, 1995). SVM is traditionally used for classification, and it can assist in categorizing TBM operational modes (e.g., efficient vs. inefficient cutting) or predicting discrete penetration rate classes. This categorization can help predefine TBM behavior under varying geological conditions, thereby supporting decision-making in real-time control systems.
3.2.3 Gene expression programming
Gene expression programming (GEP) is a genotype-phenotype multi-genic system that combines the strengths of genetic programming and the simplicity of the genetic algorithm (Ferreira, 2001). Unlike its predecessors, GEP encodes multiple evolutionary algorithms as linear structures known as chromosomes composed of genes of equal length. The determinants of GEP are the chromosomes and the expression tree (Ets). The algorithm utilizes two languages: the language of genes and the language of expression trees. The sequence of genes can be deduced from the expression tree, and vice versa, using the Karva language. GEP has two domains: the head and the tail. The head encodes the chosen functions and variables to solve problems, while the tail provides a terminal reservoir to ensure that all programs produced by GEP are error-free (Ferreira, 2001). GEP is a symbolic regression method that can evolve interpretable mathematical expressions to predict the TBM penetration rate. Its ability to discover complex, non-linear relationships and represent them as human-readable formulas makes it particularly valuable for providing insights into influential variables and their interactions.
3.2.4 Feedforward neural network
The feedforward neural network (FFNN) is a multilayer perceptron neural network model. It is characterized by moving in a single direction and progressing through hidden layers to estimate output factors. The learning process of FFNN involves adjusting the weights and biases of the nodes to optimize the model’s output (Zell, 1994). The FFNN model has the following features: (i) universal approximation, (ii) capability for nonlinear function approximation, (iii) Support parallel processing, (iv) robustness to noise, (v) ease of training, and (vi) capability for adaptive learning. Therefore, the FFNN models have been constructed in this work. The FFNN model exhibits complex, non-linear relationships between multiple input parameters (e.g., thrust force, torque, and uniaxial compressive strength) and the penetration rate. Their flexibility and adaptability to diverse data patterns make them effective for static prediction tasks in TBM performance modeling.
3.2.5 Gated recurrent network
Cho et al. (2014) proposed the gated recurrent unit (GRU) structure to solve the overhead reduction in the LSTM network. The GRU incorporates reset and update gate concepts to mitigate the vanishing gradient problem. Specific coefficients and sigmoid functions define these gates. The update gate, denoted as Tu, functions as a switch, determining whether to use the previous mode, input, or a combination of both. By employing this functionality, the GRU can consider multiple past time steps when predicting future steps, making it effective for long sequential data. The reset gate also functions as a switch, indicating how much previous information is irrelevant to the current step and how much of the preceding step information should be utilized. When the reset gate is in the zero position, the network treats the input sequence as if reading the initial part, allowing it to discard the previously calculated state. GRU is a type of recurrent neural network capable of learning temporal dependencies in sequential data. In TBM operations, where performance evolves, GRU can capture the influence of past tunneling behavior (e.g., cumulative advance, changing geology) on the current penetration rate, thereby improving time-dependent predictions.
3.2.6 Long short-term memory
Long Short-Term Memory (LSTM) is an artificial neural network in the field of artificial intelligence and deep learning (Hochreiter and Schmidhuber, 1997). When training conventional recurrent neural networks (RNNs), the vanishing gradient problem can occur. The LSTM approach was developed by Hochreiter (1991). An input gate, an output gate, a forget gate, and a cell component of a typical LSTM unit (Hochreiter and Schmidhuber, 1996; Gers et al., 2000). LSTM networks excel at learning long-term dependencies in sequential data. For TBM penetration rate prediction, LSTM can leverage historical data trends and account for time lags between input conditions and machine response, making it suitable for dynamic and adaptive performance forecasting. A flowchart of the LSTM model’s computation (Equations 1–6) is shown in Figure 5.
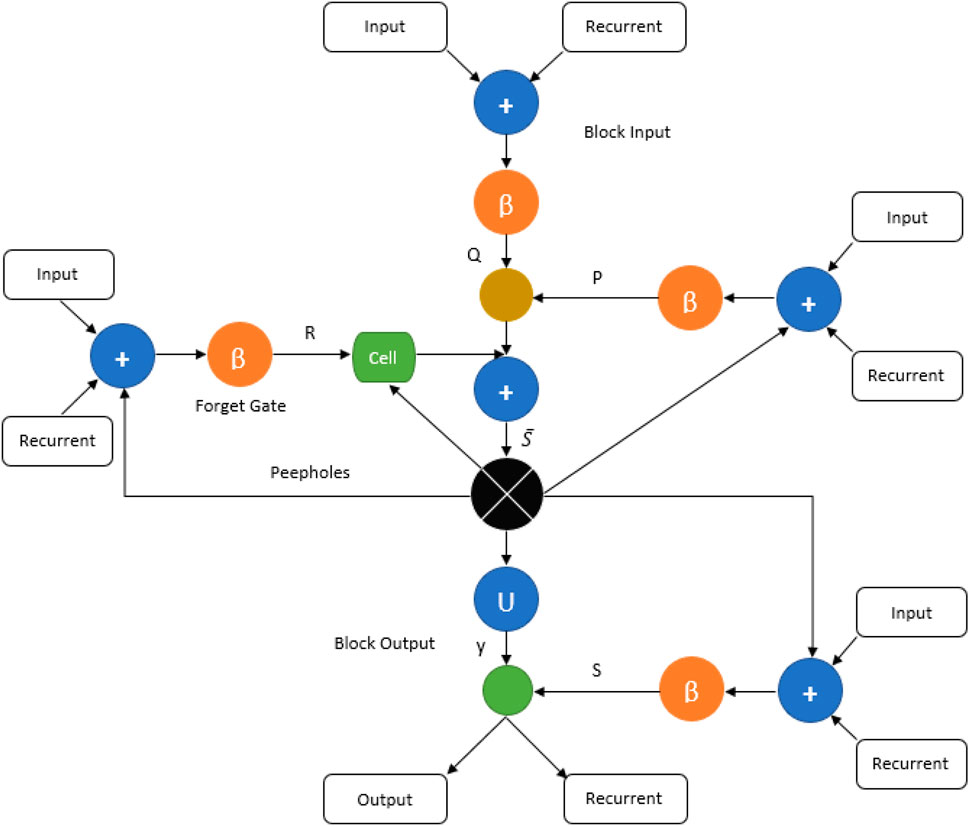
Figure 5. Flowchart of the LSTM model’s computation (Khatti and Grover, 2023a).
The LSTM networks compute from an input
where Initial values
3.2.7 Bidirectional long short-term memory
An improved LSTM method, specifically BiLSTM, combines data from previous and future time steps to produce predictions or classifications. The two distinct LSTM networks that comprise this system are designed to process input sequences in two ways: (1) forward and (2) backward. These networks enhance the comprehension of sequential data. A BiLSTM’s cells consist of the forward LSTM, the backward LSTM, and the concatenation. BiLSTM enhances the prediction capability of standard LSTM by processing input sequences in both forward and backward directions. This is particularly useful for analyzing pre- and post-cutting geological conditions, allowing the model to better understand the contextual relationships that affect the TBM penetration rate over time.
3.2.8 Hyperparameter tuning
Hyperparameter tuning is essential to computational mechanics to obtain the best results. The hyperparameters of SVR, SVM, GEP, FFNN, GRU, LSTM, and BiLSTM have been configured by analyzing published research by Khatti et al. (2023), Khatti et al. (2024), Hosseini et al. (2023), and Kumar et al. (2023). Table 5 shows the configurations of hyperparameters of SVR, SVM, GEP, FFNN, GRU, LSTM, and BiLSTM models in predicting the PR of E_.
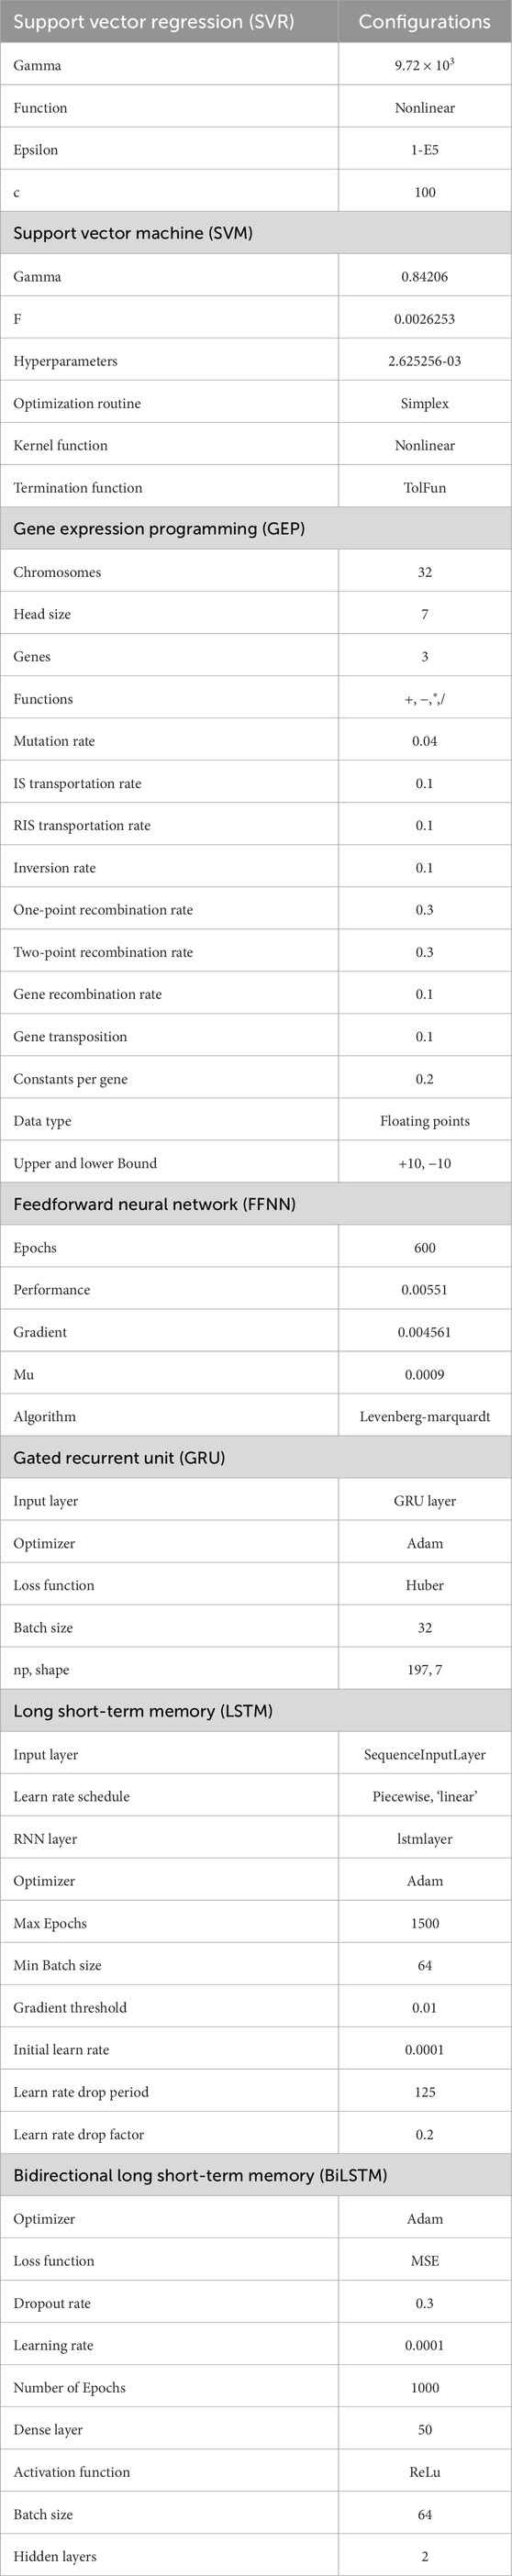
Table 5. Configuration of hyperparameters.
3.3 Sensitivity analysis
Sensitivity analysis is carried out to assess the relative impact of the input variables on the result. This study employs the cosine amplitude method, the most popular approach. Equation 7 has been used to determine the strength of independent variables in predicting the PR of ETBM:
where
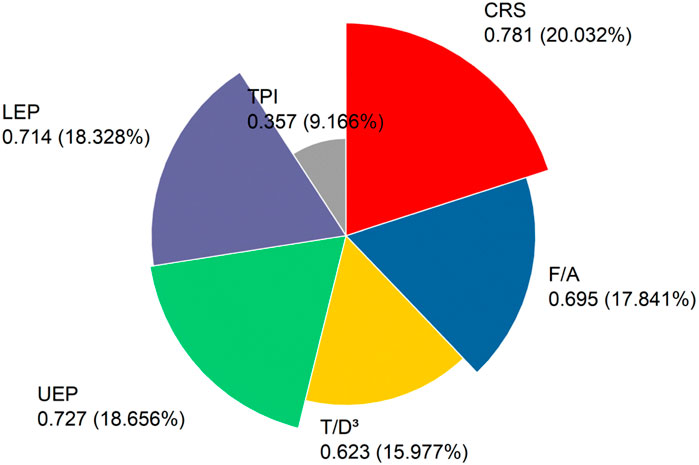
Figure 6. Depiction of sensitivity of independent variables in predicting the PR of ETBM.
4 Results and discussion
To determine the optimal performance computational model (OPCM), the performance of the employed models has been measured using fourteen metrics, including three new index metrics: IOA, IOS, and a20. The conventional metrics, including RMSE, MAE, MAPE, WMAPE, NMBE, NS, VAF, R2, Adj R2, RSR, and R, have also been implemented to compare the OPCM with published models. These metrics have been selected to capture various dimensions of model accuracy and reliability. RMSE and MAE quantify the average magnitude of errors, with RMSE being more sensitive to large deviations. MAPE and WMAPE express errors in percentage terms, offering scale-independent interpretations. NMBE helps detect systematic bias by indicating tendencies towards under- or overestimation. NSE and VAF assess how well the model predictions replicate the observed variance. At the same time, R2 and Adjusted R2 measure the explanatory power of the model, with the latter adjusting for the number of predictors to avoid overfitting. RSR normalizes RMSE against the standard deviation of observations, enabling cross-model comparability. Lastly, the correlation coefficient (R) evaluates the strength and direction of the linear relationship between observed and predicted values. Together, these metrics provide a holistic and robust assessment of model performance. In addition to conventional error and correlation metrics, the Agreement Index (IOA), Scatter Index (IOS), and a20-index were employed to further assess the agreement between predicted and observed values. The Agreement Index (IOA), proposed by Willmott, measures the degree to which predictions align with observations, accounting for both bias and dispersion; values closer to 1 indicate stronger agreement. The Scatter Index (IOS) is a normalized version of the RMSE, typically expressed as the ratio of RMSE to the mean or standard deviation of the observed data, making it particularly useful for comparing performance across datasets of different scales. The a20-index evaluates the percentage of predictions that fall within ±20% of the observed values, offering a practical interpretation of model accuracy, especially in real-world scenarios where a certain error tolerance is acceptable. The mathematical formulation, with ideal values of the performance metrics, is presented in Supplementary Table A3.
4.1 Simulation of results
The SVM, SVR, GEP, FFNN, GRU, LSTM, and BiLSTM models predict the advance and penetration rate of ETBM in this work. The training (TRNG) and testing (TSTG) performances of the models are summarized in Supplementary Table A4. Supplementary Table A4 shows that the SVM model again outperformed the SVR model in predicting TBM’s PR. Model SVM computed PR with NMBE of 0.0009 mm/r, WMAPE of 0.0063 mm/r, MAPE of 0.0075 mm/r, MAE of 0.0531 mm/r, and RMSE of 0.0889 mm/r, comparatively less than SVM model in the TSTG phase. It is also found that model SVM attained R of 0.9999, RSR of 0.0105, Adj R2 of 0.9999, VAF of 99.99, and NS of 0.9999, which are close to the ideal values. The comparison of GEP and SVM models presents that the GEP model predicted PR with less residuals (RMSE = 0.6763 mm/r, MAE = 0.5137 mm/r) than the SVM model. Model GEP gained R of 0.9971, RSR of 0.0802, Adj R2 of 0.9938, VAF of 99.41, and NS of 0.9936, comparatively less than the SVM model. Moreover, model GRU (R = 1.0000, RSR = 0.0103, Adj R2 = 0.9999, VAF = 99.99, NS = 0.9999, NMBE = 0.0009 mm/r, WMAPE = 0.0065 mm/r, MAPE = 0.0088 mm/r, MAE = 0.0553 mm/r, RMSE = 0.0870 mm/r) outperformed the FFNN model (R = 0.9937, RSR = 0.1172, Adj R2 = 0.9564, VAF = 98.75, NS = 0.9863, NMBE = 0.1151 mm/r, WMAPE = 0.0977 mm/r, MAPE = 0.1118 mm/r, MAE = 0.8294 mm/r, RMSE = 0.9885 mm/r) in predicting the PR of TBM. Comparing the LSTM and BiLSTM models, it has been observed that model BiLSTM (R = 1.0000, RSR = 0.0048, Adj R2 = 1.0000, VAF = 100.00, NS = 1.0000) achieved higher performance than LSTM (R = 1.000, RSR = 0.0097, Adj R2 = 0.9999, VAF = 99.99) model in predicting PR. Model BiLSTM (NMBE = 0.0002 mm/r, WMAPE = 0.0039 mm/r, MAPE = 0.0045 mm/r, MAE = 0.0330 mm/r, RMSE = 0.0406 mm/r) computed PR with least residuals than LSTM, close to ideal values. The overall analysis reveals that model BiLSTM outperformed the SVR, SVM, GEP, FFNN, GRU, and LSTM model in TRNG (R = 1.0000, RSR = 0.0014, Adj R2 = 1.0000, VAF = 100.00, NS = 1.0000, NMBE = 0.0000 mm/r, WMAPE = 0.0008 mm/r, MAPE = 0.0013 mm/r, MAE = 0.0133 mm/r, RMSE = 0.0163 mm/r) and TSTG (R = 1.0000, RSR = 0.0048, Adj R2 = 1.0000, VAF = 100.00, NS = 1.0000, NMBE = 0.0002 mm/r, WMAPE = 0.0039 mm/r, MAPE = 0.0045 mm/r, MAE = 0.0330 mm/r, RMSE = 0.0406 mm/r) phases of PR prediction. Furthermore, the reliability of SVR, SVM, GEP, FFNN, GRU, LSTM, and BiLSTM models has been analyzed by IOS, IOA, and a20 indexes. Conversely, it has been found that model BiLSTM is highly reliable in predicting the PR of TBM in the TRNG (IOS = 0.0009, IOA = 1.000, a20 = 100.00) and TSTG (IOS = 0.0478, IOA = 0.9998, a20 = 100.00) phases. For the visual analysis of results, the statistical relationship between actual and predicted PR has been mapped with residual for the BiLSTM model and presented in Figure 7.

Figure 7. Illustration of (a) statistical relationship between actual and predicted PR and (b) residual using the BiLSTM models.
4.2 Validation of models
From the analysis of the TRNG and TSTG performances, it is observed that each model is highly capable of predicting the PR. Each model achieved a performance of over 95% (R = 0.95) in both the TRNG and TSTG phases. To validate the prediction accuracy of each model, ninety-seven datasets were used as validation (VDTN) databases in predicting TBM’s PR. The validation performance of each model is summarized in Supplementary Table A4. In addition, the models’ prediction capabilities have been analysed using the Taylor plot, as depicted in Supplementary Figure A2.
Supplementary Figure A2 shows that the models SVM, SVR, GEP, FFNN, GRU, LSTM, and BiLSTM predicted PR with a standard deviation of 4.050, 2.695, 4.261, 4.099, 4.056, 4.058, and 4.055, respectively. The Model BiLSTM computed the PR of TBM with a standard deviation of 4.055, which is close to the actual values in the validation datasets. Therefore, the BiLSTM model is the best architectural model for predicting the PTBM. Additionally, the VDTN performances of each model were analysed and compared in the PR prediction. Model BiLSTM (R = 1.000, RSR = 0.0029, Adj R2 = 1.0000, VAF = 100.00, NS = 1.0000, NMBE = 0.0001 mm/r, WMAPE = 0.0023 mm/r, MAPE = 0.0027 mm/r, MAE = 0.0267 mm/r, RMSE = 0.0321 mm/r) also outperformed the SVM, SVR, GEP, FFNN, GRU, and LSTM models in predicting PR of TBM. The SVR model performed poorly compared to the SVM, GEP, FFNN, GRU, and LSTM models in predicting the PR of TBM. Based on the analysis of the Taylor plot and performance metrics, it has been observed that model BiLSTM is the best architectural model for predicting PR. Therefore, the confidence interval has been computed for each phase of model BiLSTM in predicting PR, as shown in Figure 8. Figure 8 demonstrates that model BiLSTM assessed the penetration rate of TBM with confidence intervals of ±1.1, ±1.3, and ±1.5 in the TRNG, TSTG, and VDTN phases, respectively.

Figure 8. Illustration of the confidence interval for model BiLSTM in predicting PR of TBM.
4.3 Score analysis
A straightforward method called score analysis is used to determine the optimal performance computational model for predicting the PR of ETBM. In this analysis, each model’s score is calculated based on the total number of models, i.e., LX (where LX in the current research is 7), for each performance metric. Furthermore, the total score of each model is calculated by summating the scores of all performance metrics. Thus, the total score is calculated for each training, testing, and validation phase. The summation of selected phases calculates the grand score. In this work, fourteen performance metrics measured the score of each model in each TRNG, TSTG, and VDTN phase. The results of the score analysis are summarized in Supplementary Table A5. Supplementary Table A4 shows that the BiLSTM model obtained the highest score in each phase of the PR prediction for TBM. Model BiLSTM scored 95, 95, and 95 in the TRNG, TSTG, and VDTN phases, respectively, followed by the LSTM (TRNG = 82, TSTG = 74, VDTN = 82) model. Supplementary Figure A3 depicts the score comparison of all models in predicting PR.
From the overall analysis, the model BiLSTM shows superiority with an overall score of 285 in predicting PR, as depicted in Supplementary Figure A4. The LSTM model obtained an overall score of 238 in predicting the PR of TBM and secured second place in this research. It is also noted that the SVR model achieved the lowest overall score, i.e., 42, in predicting PR. Hence, the BiLSTM model is the best architectural model for predicting the performance of TBM.
4.4 Regression error characteristics (REC)
The REC curve for a particular model represents the trade-off between accuracy and precision. Plotting the percentage of predicted points within the tolerance (y-axis) against the error tolerance (x-axis) is how REC displays data. The amount of error that is acceptable for a particular prediction is measured by the error tolerance. The percentage of data points where the predicted value falls within the designated error tolerance of the true value is the predicted within tolerance percentage. Higher curve models are able to correctly predict a higher percentage of points within a given error tolerance because they have less area over the curve. In this work, the REC curve has been plotted for each TRNG, TSTG, and VDTN phase of the PR prediction. Figures 9a–c illustrates the PR prediction’s REC curve and the AOC value shown in Table 6.

Figure 9. Illustration of REC plot in (a) TRNG, (b) TSTG, and (c) VDTN phases of the PR prediction.

Table 6. Results of REC curve.
Table 6 reveals that model BiLSTM predicted PR with the AOC of 1.16E-07, 7.03E-07, and 4.41E-07 in the TRNG, TSTG, and VDTN phases, respectively. Hence, the BiLSTM model is the most suitable architectural model for predicting TBM performance.
4.5 Accuracy metrix
Based on the outstanding performance of the BiLSTM model, the accuracy of each model in each TRNG, TSTG, and VDTN phase has been calculated, compared, and presented in Supplementary Figure A5. Supplementary Figures A5a–c presents that model BiLSTM achieved higher accuracies in TRNG (RMSE = 99.98%, MAE = 99.99%, NS; VAF; R2; R = 100.00%, RSR = 99.86%), TSTG (RMSE = 99.96%, MAE = 99.97%, NS; VAF; R2; R = 100.00%, RSR = 99.52%), and VDTN (RMSE = 99.97%, MAE = 99.97%, NS; VAF; R2; R = 100.00%, RSR = 99.71%) phase of the PR prediction, close to the 100%. Hence, this research identifies the BiLSTM model as the most effective architectural model.
4.6 Generalizability analysis
The generalizability analysis is an external validation method used to assess the predictive capabilities of the computational model. It makes sure that the model is not just overfitting the training set. In this work, the generalizability of models has been analyzed to identify the optimal computational model for predicting the performance of TBM. Golbraikh and Tropsha (2002) proposed a theory and applied it to develop an accurate model in this investigation. Supplementary Table A6 provides a summary of the theory’s various mathematical aspects related to its expressions. Table 7 presents the results of each model’s generalizability in predicting TBM’s PR. Table 7 shows that the BiLSTM models achieved excellent generalizability in predicting PR, demonstrating superiority over the SVR, SVM, GEP, FFNN, LSTM, and GRU models employed in this work.

Table 7. Generalizability result obtained in predicting AR and PR of TBM.
4.7 Wilcoxon test
The present research employs the Wilcoxon signed-rank test to determine the optimal computational model for predicting TBM PR. This test compares the two samples and examines their difference. There is a significant difference between zero and the median difference between the paired scores. Supplementary Table A7 shows the Wilcoxon test results in predicting the PR of TBM. Figures 10a–c shows that the model BiLSTM predicted PR with the least confidence level (CL) difference, which is close to the actual PR confidence level difference. Hence, this work has identified the BiLSTM model as the optimal computational model for achieving optimal performance.
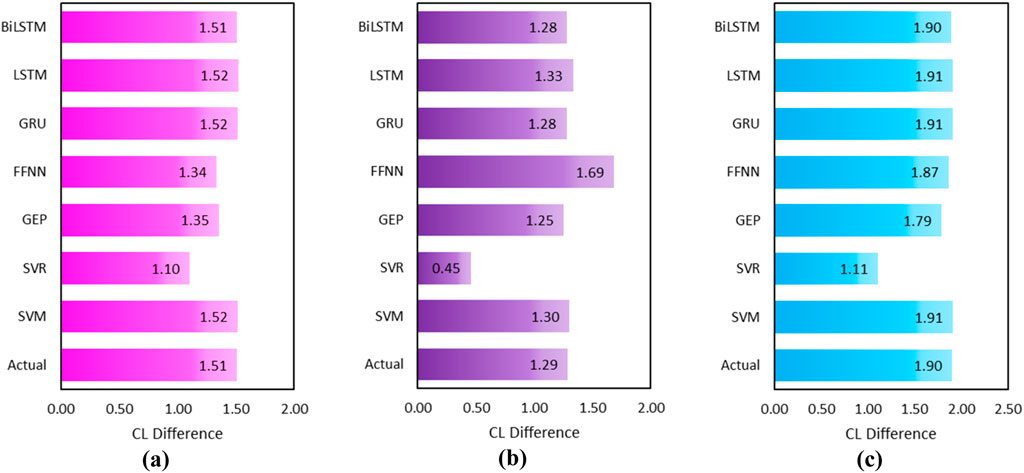
Figure 10. Illustration of CL difference in (a) TRNG, (b) TSTG, and (c) VDTN of the PR prediction.
4.8 Uncertainty analysis
The ability of the proposed computational models to accurately predict the output is demonstrated through the use of uncertainty analysis to assess model uncertainty. The uncertainty analysis is performed separately using the total TRNG, TSTG, and VDTN datasets. This analysis is carried out by mean of error (MOE), standard deviation (SD), sample size (SS), margin of error (ME), standard error (SE), upper band (UB), lower band (LB) and width of confidence band (WCB). The results of uncertainty analysis in predicting AR and PR are summarized in Supplementary Table A8. Supplementary Table A8 demonstrates that model BiLSTM ranked first in each training, testing, and validation of the PR prediction. It is noted that the BiLSTM model predicted the penetration rate of TBM with the minor uncertainty band. Figure 11 illustrates the uncertainty band during the PR prediction training, testing, and validation phases.

Figure 11. Illustration of uncertainty band in (a) TRNG, (b) TSTG, (c) VDTN of the PR prediction.
4.9 Anderson-darling test
A statistical test to determine whether a sample of data is representative of a given probability distribution is the Anderson-Darling (AD) test. By comparing the sample data’s cumulative distribution function (or CDF) to the CDF of the proposed distribution, one can compute the Anderson-Darling test statistic. The null hypothesis, which states that the data are taken from the proposed distribution, is then evaluated to see if it should be rejected by comparing the test statistic to a critical value. This research uses the Minitab statistical tool to conduct the AD test for complete datasets (including predicted). Supplementary Table A9 presents the AD test results and graphical presentation, as shown in Figure 12. Supplementary Table A9 indicates that model BiLSTM assessed the PR with an AD value of 55.593, which is close to the actual AD value of the PR, i.e., 55.596. It is also noted that the BiLSTM model adheres to the clause of the normality hypothesis. Hence, the AD test accepts the normality hypothesis in predicting TBM’s PR.

Figure 12. Illustration of AD test results in the prediction of PR.
4.10 Curve fitting
Curve fitting is finding a function that minimizes the error between the actual and estimated values. The under, over, and best fit are the types of curve fitting. This research predicts models’ overfitting in predicting TBM’s PR. The ratio of test/validation RMSE to training RMSE estimates the overfitting of the models. Figure 13 illustrates that the model BiLSTM achieved an overfitting of 2.49 and 1.98 in the TSTG and VDTN phases, respectively, which is close to the best-fit line. Therefore, the BiLSTM model is highly recommended for predicting the penetration rate of ETBM.

Figure 13. Illustration of overfitting of models in predicting the penetration rate of TBM.
4.11 Objective function (OBJE) criterion
Gandomi et al. (2010) introduced the objective function (OBJE) criterion to evaluate the model’s performance in the TSTG and VDTN phases, utilizing TRNG performance. Equation 8 is used to determine the OBJE.
This work calculates the OBJE for both the TSTG and VDTN phases. The smallest value of OBJE presents the best computational models. The results of OBJE in predicting PR are graphically presented in Figure 14. Figure 14 demonstrates that the model BiLSTM outperformed the SVM, SVR, GEP, GRU, FFNN, and LSTM models, achieving an OBJE of 0.0003 in both the TSTG and VDTN phases. Thus, the objective function criterion also shows the robustness of the BiLSTM model in predicting the performance of ETBM.
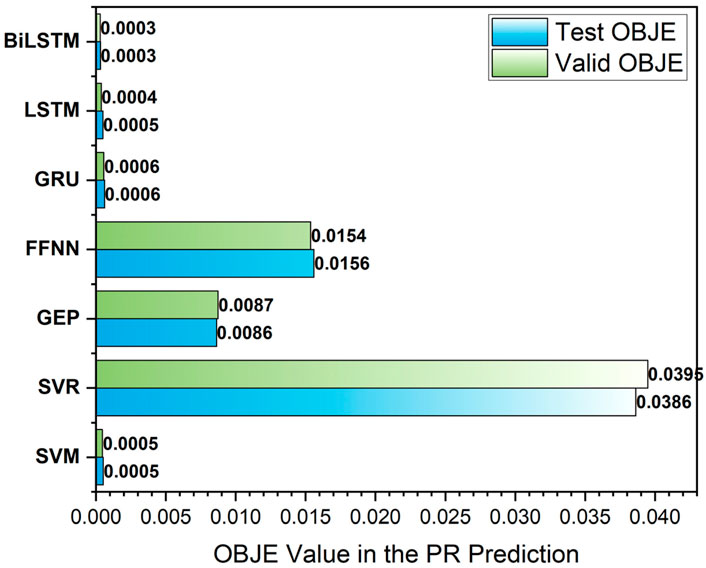
Figure 14. Illustration of OBJE in predicting the penetration rate.
4.12 Discussion and analysis of results
The number of statistical metrics in this work measures the prediction accuracy. Still, the RMSE, MAE, MAPE, WMAPE, NMBE, and RSR metrics have been used to measure the prediction accuracy in this work. This investigation presents the BiLSTM model as the optimal computational model for predicting the PR of ETBM, achieving optimal performance. Therefore, the RMSE, MAE, MAPE, WMAPE, NMBE, and RSR metrics of each SVM, SVR, GEP, FFNN, GRU, and LSTM model have been compared to find the efficiency of computational models. The results of comparing metrics with respect to BiLSTM model metrics are summarised in Supplementary Table A10. In this comparison, the higher percentage presents the poor efficiency of models. In case of PR prediction, it is noted that model LSTM gained high efficiency, close to the BiLSTM model in each TRNG (RMSE = 21%, MAE = 23%, MAPE = 20%, WMAPE = 23%, NMBE = 38%, RSR = 21%), TSTG (RMSE = 51%, MAE = 50%, MAPE = 50%, WMAPE = 50%, NMBE = 76%, RSR = 51%), and VDTN (RMSE = 21%, MAE = 19%, MAPE = 14%, WMAPE = 19%, NMBE = 37%, RSR = 21%) phase. Therefore, it can be stated that the SVR model has lower efficiency, while LSTM has higher efficiency in predicting the performance of ETBM. Figures 15a–c demonstrates the efficiency comparison of each model in terms of percentage.

Figure 15. Illustration of efficiency comparison in (a) TRNG, (b) TSTG, (c) VDTN phase of the PR prediction.
Another analysis has been conducted using a regression tool to determine the BiLSTM model’s robustness in predicting TBM’s PR. For this analysis, the complete database is analyzed using linear regression, and the relationship between the input variables is mapped and illustrated in Figure 16.
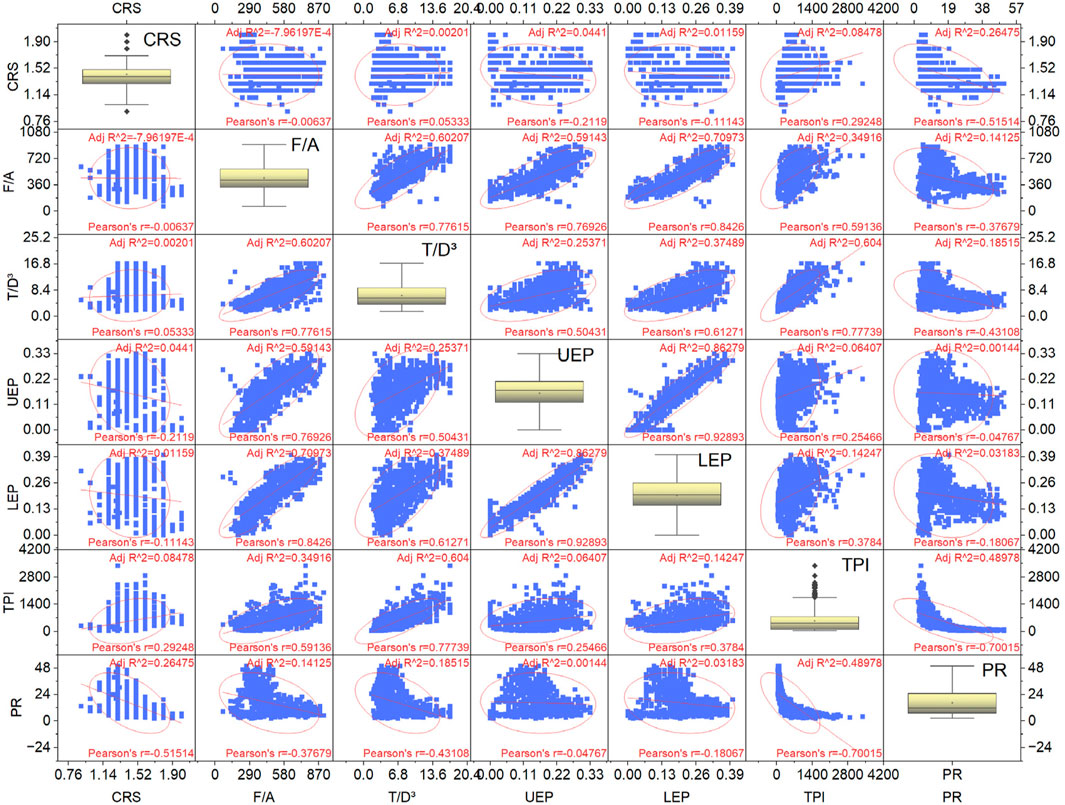
Figure 16. Relationship between variables in predicting TBM performance.
Figure 16 presents (a) CRS has no relationship with F/A (=−0.0064), T/D3 (=0.0533), LEP (=−0.1114), (b) CRS has a weak relationship with UEP (=−0.2119), TPI (=0.2925), (c) CBR has a moderate relationship with PR (=−0.5151), (d) F/A has a strong relationship with T/D3 (=0.7761), UEP (=0.7693), (e) F/A has a very strong relationship with LEP (=0.8426), (f) F/A has a weak relationship with PR (=−0.3768), (g) T/D3 has a strong relationship with LEP (=0.6127) and TPI (=0.7774), (h) T/D3 has a moderate relationship with UEP (=0.5043), (i) T/D3 has a moderate relationship with PR (=−0.4311), (j) UEP has no relationship with PR (=−0.0477), (k) UEP has a very strong relationship with LEP (=0.9289), (l) LEP has no relationship with PR (=−0.1807), and (m) TPI has a strong relationship with PR (=−0.7001). The study reveals that PR has a negative correlation with the CRS, F/A, T/D3, UEP, LEP, and TPI variables. Here, the negative sign shows that the two variables are inversely proportional. In simple words, one variable decreases if the relative variable increases continuously. In the regression analysis, one input variable is varied, while the remaining variables remain constant. Table 8 presents the selection criteria for variables and their values in predicting the PR of TBM.

Table 8. Selection of variables and their values.
Figure 17 illustrates that the penetration rate of TBM continuously decreases with the increase of each input variable. Figures 17a,d illustrates the inverse relationship between PR, CRS, and UEP variables. Figure 16 also presents that the PR of TBM is decreasing with each input variable, confirming the prediction capabilities of the optimal performance computational model, i.e., BiLSTM, in this research. In addition, the comparison of the BiLSTM model’s performance with that of published models reveals that the BiLSTM model outperforms the published models in predicting the performance of ETBM, as shown in Supplementary Table A11.

Figure 17. Illustration of regression analysis using model BiLSTM in predicting PR for a constant variable (a) CRS, (b) F/A, (c) T/D3, (d) UEP, (e) LEP, (f) TPI.
5 Summary and conclusion
This investigation compares the SVM, SVR, GEP, FFNN, GRU, LSTM, and BiLSTM models to find the optimal performance computational model for predicting the penetration rate (PR) of ETBM. Eleven hundred and ninety-seven datasets created training, testing, and validation databases by selecting 1,000, 100, and 97 datasets, respectively. Fourteen performance metrics were used to measure the model’s performance in each phase. The following conclusions are drawn in this investigation:
• Impact of Input Variables–This investigation uses CRS, F/A, T/D3, UEP, LEP, and TPI variables, and it concludes that each model achieves a prediction performance of more than 96% in each phase. Therefore, the combination of CRS, F/A, T/D3, UEP, LEP, TPI variables is better than the combinations of (i) RQD, UCS, RB, CM, IFA, C, CS, CT, TT, CEP; (ii) UCS, Bi, DPW, α; (iii) EPF, WP, T, CT, RPM, CF, W; (iv) F, Jv, UCS, RPM, T, α, a, Ab, Qc; (v) RQD, UCS, RMR, BTS, TFC, RPM in predicting the TBM performance.
• Impact of Multicollinearity–This research computes the weak, moderate, considerable, moderate, problematic, and considerable multicollinearities for CRS, F/A, T/D3, UEP, LEP, and TPI, respectively. The impact of multicollinearity is observed in predicting PR using SVR models. The SVR model performs poorly compared to the BiLSTM, LSTM, GEP, GRU, SVM, and FFNN models. On the other hand, it is noted that the BiLSTM model achieved excellent performance and accuracy in predicting PR, even in the presence of moderate and problematic multicollinearity.
• Optimal Performance Computational Model–This research conducts over eight analyses to determine the optimal performance computational model for predicting TBM performance. These analyses, (i) performance (R = 1.0000 in PR prediction); (ii) score analysis (total score = 285 in PR prediction); (iii) REC (AOC = 7.03E-07 in PR prediction); (iv) accuracy metrics (R = 100.00% in PR prediction); (v) generalizability analysis (m and n = −0.03 and 0.00 in PR prediction); (vi) Wilcoxon test (confidence = more than 95% in PR prediction); (vii) uncertainty analysis (rank = 1 in PR prediction); (viii) AD test (= reject null hypothesis of normality); (ix) curve fitting (close to the best-fit); and (x) objective function criterion (OBJE = 0.0003 in PR prediction) present the BiLSTM model is an optimal performance computational model in predicting PR of TBM. BiLSTM outperformed due to its ability to learn from both past and future contextual information in sequential data. Unlike single-directional or static models, BiLSTM captures temporal dependencies more comprehensively, enhancing accuracy in dynamic tunneling environments. Its bidirectional structure makes it especially effective in modeling complex, time-dependent patterns in real-time operations.
To conclude, this investigation introduces the BiLSTM model as an optimal performance computational model in predicting the mixed face’s earth pressure balance shield tunnel boring machine performance (ETBM). Based on the capabilities of the BiLSTM model, it may be used to solve the tunnel and mining problems. Finding the ideal structure through various analyses is one of the drawbacks of the machine learning models used in this work. Consequently, metaheuristic optimization algorithms can be used to optimize the coefficients and weights of the models. The current study will assist experts and tunnel engineers in estimating the total project cost by determining the performance of the ETBM. This investigation may be extended by developing different combinations of features and analyze the impact of feature dimensionality on the performance of soft computing models. To the best of the author’s knowledge, a significant advantage over the published work is that the SVM, SVR, GEP, FFNN, GRU, LSTM, and BiLSTM models have never before been developed, trained, tested, and analyzed for estimating the performance of an earth pressure balance shield tunnel boring machine (ETBM).
Data availability statement
The details of the database [https://doi.org/10.1016/j.dib.2022.108726] are provided in the manuscript. The models and codes developed for this research are available from the corresponding author upon reasonable request.
Author contributions
JK: Methodology, Writing – original draft, Software, Funding acquisition, Formal Analysis, Visualization, Supervision, Investigation, Resources, Validation, Conceptualization, Project administration, Data curation, Writing – review and editing. SM: Conceptualization, Writing – review and editing, Formal Analysis, Visualization.
Funding
The author(s) declare that no financial support was received for the research and/or publication of this article.
Conflict of interest
The authors declare that the research was conducted in the absence of any commercial or financial relationships that could be construed as a potential conflict of interest.
Generative AI statement
The author(s) declare that no Generative AI was used in the creation of this manuscript.
Any alternative text (alt text) provided alongside figures in this article has been generated by Frontiers with the support of artificial intelligence and reasonable efforts have been made to ensure accuracy, including review by the authors wherever possible. If you identify any issues, please contact us.
Publisher’s note
All claims expressed in this article are solely those of the authors and do not necessarily represent those of their affiliated organizations, or those of the publisher, the editors and the reviewers. Any product that may be evaluated in this article, or claim that may be made by its manufacturer, is not guaranteed or endorsed by the publisher.
Supplementary material
The Supplementary Material for this article can be found online at: https://www.frontiersin.org/articles/10.3389/fbuil.2025.1699466/full#supplementary-material
References
Abolhosseini, H., Hashemi, M., and Ajalloeian, R. (2020). Evaluation of geotechnical parameters affecting the penetration rate of TBM using neural network (case study). Arabian J. Geosciences 13, 183–11. doi:10.1007/s12517-020-5183-5
Adoko, A. C., Gokceoglu, C., and Yagiz, S. (2017). Bayesian prediction of TBM penetration rate in rock mass. Eng. Geol. 226, 245–256. doi:10.1016/j.enggeo.2017.06.014
Afradi, A., and Ebrahimabadi, A. (2020). Comparison of artificial neural networks (ANN), support vector machine (SVM) and gene expression programming (GEP) approaches for predicting TBM penetration rate. SN Appl. Sci. 2, 2004–2016. doi:10.1007/s42452-020-03767-y
Afradi, A., Ebrahimabadi, A., and Hallajian, T. (2020). Prediction of tunnel boring machine penetration rate using ant colony optimization, bee colony optimization and the particle swarm optimization, case study: sabzkooh water conveyance tunnel. Min. Mineral Deposits 14 (2), 75–84. doi:10.33271/mining14.02.075
Afradi, A., Ebrahimabadi, A., and Hallajian, T. (2021). Prediction of TBM penetration rate using fuzzy logic, particle swarm optimization and harmony search algorithm. Geotechnical Geol. Eng. 40, 1513–1536. doi:10.1007/s10706-021-01982-x
Alber, M. (2000). Advance rates of hard rock TBMs and their effects on project economics. Tunn. Undergr. Space Technol. 15 (1), 55–64. doi:10.1016/S0886-7798(00)00029-8
Arbabsiar, M. H., Farsangi, M. A. E., and Mansouri, H. (2020). A new model for predicting the advance rate of a tunnel boring machine (TBM) in hard rock conditions. Rudarsko-Geološko-Naftni Zb. 35 (2), 57–74. doi:10.17794/rgn.2020.2.6
Armaghani, D. J., Mohamad, E. T., Narayanasamy, M. S., Narita, N., and Yagiz, S. (2017). Development of hybrid intelligent models for predicting TBM penetration rate in hard rock condition. Tunn. Undergr. Space Technol. 63, 29–43. doi:10.1016/j.tust.2016.12.009
Armaghani, D. J., Yagiz, S., Mohamad, E. T., and Zhou, J. (2021). Prediction of TBM performance in fresh through weathered granite using empirical and statistical approaches. Tunn. Undergr. Space Technol. 118, 104183. doi:10.1016/j.tust.2021.104183
Asteris, P. G., Apostolopoulou, M., Armaghani, D. J., Cavaleri, L., Chountalas, A. T., Guney, D., et al. (2020). On the metaheuristic models for the prediction of cement-metakaolin mortars compressive strength. arXiv 1 (1), 063. doi:10.12989/mca.2020.1.1.063
Asteris, P. G., Sivenas, T., Gkantou, M., Formisano, A., and Tien-Thinh, L. (2025a). Estimation of axial load-carrying capacity of elliptical concrete filled steel tubular columns using computational intelligence. J. Build. Eng. 112, 113738. doi:10.1016/j.jobe.2025.113738
Asteris, P. G., Drosopoulos, G. Α., Cavaleri, L., Formisano, A., Drougkas, A., Milani, G., et al. (2025b). Mapping and revealing the nature of masonry compressive strength using computational intelligence. Structures 78, 109189. doi:10.1016/j.istruc.2025.109189
Avunduk, E., and Copur, H. (2018). Empirical modeling for predicting excavation performance of EPB TBM based on soil properties. Tunn. Undergr. Space Technol. 71, 340–353. doi:10.1016/j.tust.2017.09.016
Ayawah, P. E., Sebbeh-Newton, S., Azure, J. W., Kaba, A. G., Anani, A., Bansah, S., et al. (2022). A review and case study of artificial intelligence and machine learning methods used for ground condition prediction ahead of tunnel boring machines. Tunn. Undergr. Space Technol. 125, 104497. doi:10.1016/j.tust.2022.104497
Bardhan, A., Kardani, N., GuhaRay, A., Burman, A., Samui, P., and Zhang, Y. (2021). Hybrid ensemble soft computing approach for predicting penetration rate of tunnel boring machine in a rock environment. J. Rock Mech. Geotechnical Eng. 13 (6), 1398–1412. doi:10.1016/j.jrmge.2021.06.015
Barton, N. R. (2000). TBM tunnelling in jointed and faulted rock. Brookfield, VT: A.A. Balkema Publishers.
Bazargan, S., Chakeri, H., Sharghi, M., and Dias, D. (2022). Analysis of the performance of cutting tools of tunnel boring machine (TBM) in silty-sand soils using artificial neural network (ANN)–case study: tabriz metro line 2 project. Asian J. Water, Environ. Pollut. 19 (2), 71–78. doi:10.3233/ajw220026
Benardos, A. G., and Kaliampakos, D. C. (2004). Modelling TBM performance with artificial neural networks. Tunn. Undergr. Space Technol. 19 (6), 597–605. doi:10.1016/j.tust.2004.02.128
Bieniawski von Preinl, Z. T., Celada Tamames, B., Galera Fernandez, J. M., and Alvarez Hernandez, M. (2006). Rock mass excavability indicator: new way to selecting the optimum tunnel construction method. Tunn. Undergr. Space Technol. Incorporating Trenchless Technol. Res. 21 (3), 237. doi:10.1016/j.tust.2005.12.016
Bruland, A. (1998). Hard rock tunnel boring. Ph.D. Thesis (Trondheim: Norwegian University of Science and Technology).
Chen, H., Xiao, C., Yao, Z., Jiang, H., Zhang, T., and Guan, Y. (2019). “Prediction of TBM tunneling parameters through an LSTM neural network,” in 2019 IEEE international conference on robotics and biomimetics (ROBIO) (IEEE), 702–707. doi:10.1109/ROBIO49542.2019.8961809
Cho, K., Van Merriënboer, B., Bahdanau, D., and Bengio, Y. (2014). On the properties of neural machine translation: encoder-decoder approaches. arXiv Prepr. arXiv:1409.1259, 103–111. doi:10.3115/v1/w14-4012
Cortes, C., and Vapnik, V. (1995). Support-vector networks. Mach. Learn. 20, 273–297. doi:10.1007/BF00994018
Fatemi, S. A., Ahmadi, M., and Rostami, J. (2018). Evaluation of TBM performance prediction models and sensitivity analysis of input parameters. Bull. Eng. Geol. Environ. 77, 501–513. doi:10.1007/s10064-016-0967-2
Fattahi, H. (2019). Tunnel boring machine penetration rate prediction based on relevance vector regression. Int. J. Optim. Civ. Eng. 9 (2), 343–353. Available online at: https://sid.ir/paper/329497/en.
Fattahi, H., and Babanouri, N. (2017). Applying optimized support vector regression models for prediction of tunnel boring machine performance. Geotechnical Geol. Eng. 35 (5), 2205–2217. doi:10.1007/s10706-017-0238-4
Feng, S., and Wang, S. (2023). Theoretical considerations of field penetration index model and its application in TBM performance prediction. Geomechanics Geophys. Geo-Energy Geo-Resources 9 (1), 84. doi:10.1007/s40948-023-00603-6
Ferreira, C. (2001). Gene expression programming: a new adaptive algorithm for solving problems. arXiv Prepr. cs/0102027. doi:10.48550/arXiv.cs/0102027
Flor, A., Sassi, F., La Morgia, M., Cernera, F., Amadini, F., Mei, A., et al. (2023). Artificial intelligence for tunnel boring machine penetration rate prediction. Tunn. Undergr. Space Technol. 140, 105249. doi:10.1016/j.tust.2023.105249
Frough, O., Khetwal, A., and Rostami, J. (2019). Predicting TBM utilization factor using discrete event simulation models. Tunn. Undergr. Space Technol. 87, 91–99. doi:10.1016/j.tust.2019.01.017
Fu, X., Wu, M., Tiong, R. L. K., and Zhang, L. (2023). Data-driven real-time advanced geological prediction in tunnel construction using a hybrid deep learning approach. Automation Constr. 146, 104672. doi:10.1016/j.autcon.2022.104672
Gandomi, A. H., Alavi, A. H., Sahab, M. G., and Arjmandi, P. (2010). Formulation of elastic modulus of concrete using linear genetic programming. J. Mech. Sci. Technol. 24, 1273–1278. doi:10.1007/s12206-010-0330-7
Gao, B., Wang, R., Lin, C., Guo, X., Liu, B., and Zhang, W. (2021). TBM penetration rate prediction based on the long short-term memory neural network. Undergr. Space 6 (6), 718–731. doi:10.1016/j.undsp.2020.01.003
Garcia, G. R., Michau, G., Einstein, H. H., and Fink, O. (2021). Decision support system for an intelligent operator of utility tunnel boring machines. Automation Constr. 131, 103880. doi:10.1016/j.autcon.2021.103880
Geng, Q., He, F., Ma, M., Liu, X., Wang, X., Zhang, Z., et al. (2022). Application of full-scale experimental cutterhead system to study penetration performance of tunnel boring machines (TBMs). Rock Mech. Rock Eng. 55 (8), 4673–4696. doi:10.1007/s00603-022-02886-9
Gers, F. A., Schmidhuber, J., and Cummins, F. (2000). Learning to forget: continual prediction with LSTM. Neural Comput. 12 (10), 2451–2471. doi:10.1162/089976600300015015
Gokceoglu, C., Bal, C., and Aladag, C. H. (2023). Modeling of tunnel boring machine performance employing random forest algorithm. Geotechnical Geol. Eng. 41, 4205–4231. doi:10.1007/s10706-023-02516-3
Golbraikh, A., and Tropsha, A. (2002). Beware of q2. J. Mol. Graph. Model. 20 (4), 269–276. doi:10.1016/S1093-3263(01)00123-1
Gong, Q., and Zhao, J. (2009). Development of a rock mass characteristics model for TBM penetration rate prediction. Int. J. Rock Mech. Min. Sci. 46 (1), 8–18. doi:10.1016/j.ijrmms.2008.03.003
Goodarzi, S., Hassanpour, J., Yagiz, S., and Rostami, J. (2021). Predicting TBM performance in soft sedimentary rocks, case study of zagros mountains water tunnel projects. Tunn. Undergr. Space Technol. 109, 103705. doi:10.1016/j.tust.2020.103705
Grasmick, J., and Mooney, M. (2021). A probabilistic geostatistics-based approach to tunnel boring machine cutter tool wear and cutterhead clogging prediction. J. Geotechnical Geoenvironmental Eng. 147 (12), 05021014. doi:10.1061/(ASCE)GT.1943-5606.0002701
Grima, M. A., Bruines, P. A., and Verhoef, P. N. W. (2000). Modeling tunnel boring machine performance by neuro-fuzzy methods. Tunn. Undergr. Space Technol. 15 (3), 259–269. doi:10.1016/S0886-7798(00)00055-9
Guo, D., Li, J., Jiang, S. H., Li, X., and Chen, Z. (2022). Intelligent assistant driving method for tunnel boring machine based on big data. Acta Geotech. 17 (4), 1019–1030. doi:10.1007/s11440-021-01327-1
Hair, J. F., Ortinau, D. J., and Harrison, D. E. (2013). Essentials of marketing research. New York: Oxford University Press.
Harandizadeh, H., Armaghani, D. J., Asteris, P. G., and Gandomi, A. H. (2021). TBM performance prediction developing a hybrid ANFIS-PNN predictive model optimized by imperialism competitive algorithm. Neural Comput. Appl. 33 (23), 16149–16179. doi:10.1007/s00521-021-06217-x
Hasanpour, R., Rostami, J., Schmitt, J., Ozcelik, Y., and Sohrabian, B. (2020). Prediction of TBM jamming risk in squeezing grounds using bayesian and artificial neural networks. J. Rock Mech. Geotechnical Eng. 12 (1), 21–31. doi:10.1016/j.jrmge.2019.04.006
Hassanpour, J., Rostami, J., Khamehchiyan, M., and Bruland, A. (2009). Developing new equations for TBM performance prediction in carbonate-argillaceous rocks: a case history of nowsood water conveyance tunnel. Geomechanics Geoengin. An Int. J. 4 (4), 287–297. doi:10.1080/17486020903174303
Hassanpour, J., Rostami, J., Khamehchiyan, M., Bruland, A., and Tavakoli, H. R. (2010). TBM performance analysis in pyroclastic rocks: a case history of karaj water conveyance tunnel. Rock Mech. Rock Eng. 43, 427–445. doi:10.1007/s00603-009-0060-2
Hassanpour, J., Rostami, J., and Zhao, J. (2011). A new hard rock TBM performance prediction model for project planning. Tunn. Undergr. Space Technol. 26 (5), 595–603. doi:10.1016/j.tust.2011.04.004
Hochreiter, S. (1991). Untersuchungen zu dynamischen neuronalen netzen. Diploma (Technische Universität München), 91 (1), 31.
Hochreiter, S., and Schmidhuber, J. (1996). LSTM can solve hard long time lag problems. Adv. Neural Inf. Process. Syst. 9.
Hochreiter, S., and Schmidhuber, J. (1997). Long short-term memory. Neural Comput. 9 (8), 1735–1780. doi:10.1162/neco.1997.9.8.1735
Hosseini, M., and Hosseini, S. J. (2017). Introducing new equation for predicting penetration rate of tunnel boring machine. Amirkabir J. Civ. Eng. 49 (2), 313–322. doi:10.22060/ceej.2015.398
Hosseini, S., Khatti, J., Taiwo, B. O., Fissha, Y., Grover, K. S., Ikeda, H., et al. (2023). Assessment of the ground vibration during blasting in mining projects using different computational approaches. Sci. Rep. 13 (1), 18582. doi:10.1038/s41598-023-46064-5
Howarth, D. F., Adamson, W. R., and Berndt, J. R. (1986). Correlation of model tunnel boring and drilling machine performances with rock properties. Int. J. Rock Mech. Min. Sci. and Geomechanics Abstr. 23 (2), 171–175. doi:10.1016/0148-9062(86)90344-X
Huang, X., Zhang, Q., Liu, Q., Liu, X., Liu, B., Wang, J., et al. (2022). A real-time prediction method for tunnel boring machine cutter-head torque using bidirectional long short-term memory networks optimized by multi-algorithm. J. Rock Mech. Geotechnical Eng. 14 (3), 798–812. doi:10.1016/j.jrmge.2021.11.008
Jafarshirzad, P., Ghasemi, E., Yagiz, S., and Kadkhodaei, M. H. (2023). Evaluation of hard rock tunnel boring machine (TBM) performance using stochastic modeling. Geotechnical Geol. Eng. 41, 3513–3529. doi:10.1007/s10706-023-02471-z
Jahed Armaghani, D., Faradonbeh, R. S., Momeni, E., Fahimifar, A., and Tahir, M. M. (2018). Performance prediction of tunnel boring machine through developing a gene expression programming equation. Eng. Comput. 34, 129–141. doi:10.1007/s00366-017-0526-x
Jamshidi, A. (2018). Prediction of TBM penetration rate from brittleness indexes using multiple regression analysis. Model. Earth Syst. Environ. 4, 383–394. doi:10.1007/s40808-018-0432-2
Jin, Y., Qin, C., Tao, J., and Liu, C. (2022). An accurate and adaptative cutterhead torque prediction method for shield tunneling machines via adaptative residual long-short term memory network. Mech. Syst. Signal Process. 165, 108312. doi:10.1016/j.ymssp.2021.108312
Kang, T. H., Choi, S. W., Lee, C., and Chang, S. H. (2022). Soil classification by machine learning using a tunnel boring machine’s operating parameters. Appl. Sci. 12 (22), 11480. doi:10.3390/app122211480
Karrari, S. S., Heidari, M., Hamidi, J. K., Khaleghi-Esfahani, M., and Teshnizi, E. S. (2022). Predicting tunnel-boring machine penetration rate utilizing geomechanical properties. Q. J. Eng. Geol. Hydrogeology 55 (4), qjegh2021–126. doi:10.1144/qjegh2021-126
Kazemi, M., and Barati, R. (2022). Application of dimensional analysis and multi-gene genetic programming to predict the performance of tunnel boring machines. Appl. Soft Comput. 124, 108997. doi:10.1016/j.asoc.2022.108997
Khatti, J., and Grover, K. S. (2023a). Prediction of compaction parameters for fine-grained soil: critical comparison of the deep learning and standalone models. J. Rock Mech. Geotechnical Eng. 15 (11), 3010–3038. doi:10.1016/j.jrmge.2022.12.034
Khatti, J., Samadi, H., and Grover, K. S. (2023). Estimation of settlement of pile group in clay using soft computing techniques. Geotechnical Geol. Eng. 42, 1729–1760. doi:10.1007/s10706-023-02643-x
Khatti, J., Grover, K. S., Kim, H. J., Mawuntu, K. B. A., and Park, T. W. (2024). Prediction of ultimate bearing capacity of shallow foundations on cohesionless soil using hybrid LSTM and RVM approaches: an extended investigation of multicollinearity. Comput. Geotechnics 165, 105912. doi:10.1016/j.compgeo.2023.105912
Koopialipoor, M., Nikouei, S. S., Marto, A., Fahimifar, A., Jahed Armaghani, D., and Mohamad, E. T. (2019a). Predicting tunnel boring machine performance through a new model based on the group method of data handling. Bull. Eng. Geol. Environ. 78, 3799–3813. doi:10.1007/s10064-018-1349-8
Koopialipoor, M., Tootoonchi, H., Jahed Armaghani, D., Tonnizam Mohamad, E., and Hedayat, A. (2019b). Application of deep neural networks in predicting the penetration rate of tunnel boring machines. Bull. Eng. Geol. Environ. 78, 6347–6360. doi:10.1007/s10064-019-01538-7
Koopialipoor, M., Fahimifar, A., Ghaleini, E. N., Momenzadeh, M., and Armaghani, D. J. (2020). Development of a new hybrid ANN for solving a geotechnical problem related to tunnel boring machine performance. Eng. Comput. 36, 345–357. doi:10.1007/s00366-019-00701-8
Kullarkar, S. D., Thote, N. R., Jain, P., Naithani, A. K., and Singh, T. N. (2022). “Performance estimation of the tunnel boring machine in the deccan traps of India using ANN and statistical approach,” in International conference on advances in data-driven computing and intelligent systems (Singapore: Springer Nature Singapore), 523–536. doi:10.1007/978-981-99-3250-4_40
Kumar, D. R., Samui, P., Burman, A., Wipulanusat, W., and Keawsawasvong, S. (2023). Liquefaction susceptibility using machine learning based on SPT data. Intelligent Syst. Appl. 20, 200281. doi:10.1016/j.iswa.2023.200281
Li, G., Xue, Y., Su, M., Qiu, D., Wang, P., Liu, Q., et al. (2022). Probabilistic evaluation of tunnel boring machine penetration rate based on case analysis. KSCE J. Civ. Eng. 26 (11), 4840–4850. doi:10.1007/s12205-022-0128-z
Li, X., Yao, M., Yuan, J. D., Wang, Y. J., and Li, P. Y. (2023). Deep learning characterization of rock conditions based on tunnel boring machine data. Undergr. Space 12, 89–101. doi:10.1016/j.undsp.2022.10.010
Li, J., Li, P., Guo, D., Li, X., and Chen, Z. (2021). Advanced prediction of tunnel boring machine performance based on big data. Geosci. Front. 12 (1), 331–338. doi:10.1016/j.gsf.2020.02.011
Li, Z., Yazdani Bejarbaneh, B., Asteris, P. G., Koopialipoor, M., Armaghani, D. J., and Tahir, M. M. (2021). A hybrid GEP and WOA approach to estimate the optimal penetration rate of TBM in granitic rock mass. Soft Comput. 25 (17), 11877–11895. doi:10.1007/s00500-021-06005-8
Liu, B., Wang, R., Guan, Z., Li, J., Xu, Z., Guo, X., et al. (2019). Improved support vector regression models for predicting rock mass parameters using tunnel boring machine driving data. Tunn. Undergr. Space Technol. 91, 102958. doi:10.1016/j.tust.2019.04.014
Liu, B., Wang, R., Zhao, G., Guo, X., Wang, Y., Li, J., et al. (2020a). Prediction of rock mass parameters in the TBM tunnel based on BP neural network integrated simulated annealing algorithm. Tunn. Undergr. Space Technol. 95, 103103. doi:10.1016/j.tust.2019.103103
Liu, Q., Wang, X., Huang, X., and Yin, X. (2020b). Prediction model of rock mass class using classification and regression tree integrated AdaBoost algorithm based on TBM driving data. Tunn. Undergr. Space Technol. 106, 103595. doi:10.1016/j.tust.2020.103595
Liu, B., Wang, Y., Zhao, G., Yang, B., Wang, R., Huang, D., et al. (2021). Intelligent decision method for main control parameters of tunnel boring machine based on multi-objective optimization of excavation efficiency and cost. Tunn. Undergr. Space Technol. 116, 104054. doi:10.1016/j.tust.2021.104054
Liu, Y., Huang, S., Wang, D., Zhu, G., and Zhang, D. (2022). Prediction model of tunnel boring machine disc cutter replacement using kernel support vector machine. Appl. Sci. 12 (5), 2267. doi:10.3390/app12052267
Lu, Z., and Shi, K. (2023). A novel VMD-LHPO-KELM machine learning-based TBM boring parameter prediction. Earth Sci. Inf. 16 (3), 2925–2938. doi:10.1007/s12145-023-01043-2
Ma, J., and Luo, X. (2009). “The time and cost modeling of TBM in tunnelling based on risk evaluation,” in 2009 third international symposium on intelligent information technology application workshops (IEEE), 202–205. doi:10.1109/IITAW.2009.129
Ma, T., Jin, Y., Liu, Z., and Prasad, Y. K. (2022). Research on prediction of TBM performance of deep-buried tunnel based on machine learning. Appl. Sci. 12 (13), 6599. doi:10.3390/app12136599
Mahmoodzadeh, A., Nejati, H. R., Mohammadi, M., Ibrahim, H. H., Rashidi, S., and Rashid, T. A. (2022). Forecasting tunnel boring machine penetration rate using LSTM deep neural network optimized by grey wolf optimization algorithm. Expert Syst. Appl. 209, 118303. doi:10.1016/j.eswa.2022.118303
Mikaeil, R., Zare Naghadehi, M., and Ghadernejad, S. (2018). An extended multifactorial fuzzy prediction of hard rock TBM penetrability. Geotechnical Geol. Eng. 36, 1779–1804. doi:10.1007/s10706-017-0432-4
Minh, V. T., Katushin, D., Antonov, M., and Veinthal, R. (2017). Regression models and fuzzy logic prediction of TBM penetration rate. Open Eng. 7 (1), 60–68. doi:10.1515/eng-2017-0012
Mokhtari, S., and Mooney, M. A. (2020). Predicting EPBM advance rate performance using support vector regression modeling. Tunn. Undergr. Space Technol. 104, 103520. doi:10.1016/j.tust.2020.103520
Naghadehi, M. Z., Samaei, M., Ranjbarnia, M., and Nourani, V. (2018). State-of-the-art predictive modeling of TBM performance in changing geological conditions through gene expression programming. Measurement 126, 46–57. doi:10.1016/j.measurement.2018.05.049
Nagrecha, K., Fisher, L., Mooney, M., Rodriguez-Nikl, T., Mazari, M., and Pourhomayoun, M. (2020). As-encountered prediction of tunnel boring machine performance parameters using recurrent neural networks. Transp. Res. Rec. 2674 (10), 241–249. doi:10.1177/0361198120934796
Noorian-Bidgoli, M. (2023). Optimizing the gene expression algorithm using the whale algorithm to predict the penetration rate of the tunnel boring machine. Prepr. Res. Square. doi:10.21203/rs.3.rs-3242797/v1
Okubo, S., Fukui, K., and Chen, W. (2003). Expert system for applicability of tunnel boring machines in Japan. Rock Mech. Rock Eng. 36, 305–322. doi:10.1007/s00603-002-0049-6
Ozdemir, L. (1977). Development of theoretical equations for predicting tunnel boreability 1970-1979-Mines Theses and Dissertations. Golden, CL, United States: Colorado School of Mines.
Pan, Y., Liu, Q., Liu, Q., Bo, Y., Liu, J., Peng, X., et al. (2022). Comparison and correlation between the laboratory, semi-theoretical and empirical methods in predicting the field excavation performance of tunnel boring machine (TBM). Acta Geotech. 17 (2), 653–676. doi:10.1007/s11440-021-01228-3
Parsajoo, M., Mohammed, A. S., Yagiz, S., Armaghani, D. J., and Khandelwal, M. (2021). An evolutionary adaptive neuro-fuzzy inference system for estimating field penetration index of tunnel boring machine in rock mass. J. Rock Mech. Geotechnical Eng. 13 (6), 1290–1299. doi:10.1016/j.jrmge.2021.05.010
Qin, Y., Zhou, J., Xiao, D., Qin, C., and Qian, Q. (2023). High-precision cutterhead torque prediction for tunnel boring machines using an attention-based embedded LSTM neural network. Measurement 224, 113888. doi:10.1016/j.measurement.2023.113888
Rispoli, A., Ferrero, A. M., and Cardu, M. (2020). From exploratory tunnel to base tunnel: hard rock TBM performance prediction by means of a stochastic approach. Rock Mech. Rock Eng. 53, 5473–5487. doi:10.1007/s00603-020-02226-9
Roxborough, F. F., and Phillips, H. R. (1975). Rock excavation by disc cutter. Int. J. Rock Mech. Min. Sci. and Geomechanics Abstr. 12 361–366. doi:10.1016/0148-9062(75)90547-1
Salimi, A., Rostami, J., and Moormann, C. (2017). Evaluating the suitability of existing rock mass classification systems for TBM performance prediction by using a regression tree. Procedia Eng. 191, 299–309. doi:10.1016/j.proeng.2017.05.185
Salimi, A., Faradonbeh, R. S., Monjezi, M., and Moormann, C. (2018). TBM performance estimation using a classification and regression tree (CART) technique. Bull. Eng. Geol. Environ. 77, 429–440. doi:10.1007/s10064-016-0969-0
Samadi, H., Mahmoodzadeh, A., Hussein Mohammed, A., Alenizi, F. A., Hashim Ibrahim, H., Nematollahi, M., et al. (2023). Application of several fuzzy-based techniques for estimating tunnel boring machine performance in metamorphic rocks. Rock Mech. Rock Eng. 57, 1471–1494. doi:10.1007/s00603-023-03602-x
Samaei, M., Ranjbarnia, M., Nourani, V., and Naghadehi, M. Z. (2020). Performance prediction of tunnel boring machine through developing high accuracy equations: a case study in adverse geological condition. Measurement 152, 107244. doi:10.1016/j.measurement.2019.107244
Sanio, H. P. (1985). Prediction of the performance of disc cutters in anisotropic rock. Int. J. Rock Mech. Min. Sci. and Geomechanics Abstr. 22, 153–161. doi:10.1016/0148-9062(85)93229-2
Seker, S. E., and Ocak, I. (2019). Performance prediction of roadheaders using ensemble machine learning techniques. Neural Comput. Appl. 31 (4), 1103–1116. doi:10.1007/s00521-017-3141-2
Shahriar, K., Ahangari, K., and Kamali-Bandpey, H. (2012). A statistical model for prediction TBM performance using rock mass characteristics in the TBM driven Alborz tunnel project. Res. J. Appl. Sci. Eng. Technol. 4 (23), 5048–5054.
Shahrour, I., and Zhang, W. (2021). Use of soft computing techniques for tunneling optimization of tunnel boring machines. Undergr. Space 6 (3), 233–239. doi:10.1016/j.undsp.2019.12.001
Shan, F., He, X., Armaghani, D. J., and Sheng, D. (2023). Effects of data smoothing and recurrent neural network (RNN) algorithms for real-time forecasting of tunnel boring machine (TBM) performance. J. Rock Mech. Geotechnical Eng. 16, 1538–1551. doi:10.1016/j.jrmge.2023.06.015
Shaterpour-Mamaghani, A., and Copur, H. (2021). Empirical performance prediction for raise boring machines based on rock properties, pilot hole drilling data and raise inclination. Rock Mech. Rock Eng. 54, 1707–1730. doi:10.1007/s00603-020-02355-1
Shaterpour-Mamaghani, A., Copur, H., Dogan, E., and Erdogan, T. (2018). Development of new empirical models for performance estimation of a raise boring machine. Tunn. Undergr. Space Technol. 82, 428–441. doi:10.1016/j.tust.2018.08.056
Shi, M., Hu, W., Li, M., Zhang, J., Song, X., and Sun, W. (2023a). Ensemble regression based on polynomial regression-based decision tree and its application in the in-situ data of tunnel boring machine. Mech. Syst. Signal Process. 188, 110022. doi:10.1016/j.ymssp.2022.110022
Shi, M., Geng, Q., Lv, L., and Zhang, S. (2023b). A decision tree-assisted polynomial regression model with application in the cutting force analysis of cutters of a tunnel boring machine. Eng. Optim. 55 (5), 823–840. doi:10.1080/0305215X.2022.2039131
Smola, A. J., and Schölkopf, B. (2004). A tutorial on support vector regression. Statistics Comput. 14, 199–222. doi:10.1023/B:STCO.0000035301.49549.88
Song, Z. P., Cheng, Y., Zhang, Z. K., and Yang, T. T. (2023a). Tunnelling performance prediction of cantilever boring machine in sedimentary hard-rock tunnel using deep belief network. J. Mt. Sci. 20 (7), 2029–2040. doi:10.1007/s11629-023-7931-y
Song, K., Yang, H., and Wang, Z. (2023b). A hybrid stacking framework optimized method for TBM performance prediction. Bull. Eng. Geol. Environ. 82 (1), 27. doi:10.1007/s10064-022-03047-6
Sun, W., Shi, M., Zhang, C., Zhao, J., and Song, X. (2018). Dynamic load prediction of tunnel boring machine (TBM) based on heterogeneous in-situ data. Automation Constr. 92, 23–34. doi:10.1016/j.autcon.2018.03.030
Tan, Q., Yi, L., and Xia, Y. M. (2018). Performance prediction of TBM disc cutting on marble rock under different load cases. KSCE J. Civ. Eng. 22, 1466–1472. doi:10.1007/s12205-017-1048-1
Wang, J., Mohammed, A. S., Macioszek, E., Ali, M., Ulrikh, D. V., and Fang, Q. (2022). A novel combination of PCA and machine learning techniques to select the Most important factors for predicting tunnel construction performance. Buildings 12 (7), 919. doi:10.3390/buildings12070919
Wang, H., Liu, E., and Wei, H. (2023). Tunnel boring machine performance assessment and prediction applying hybrid artificial intelligence. J. Intelligent and Fuzzy Syst. Prepr., 1–18. doi:10.3233/JIFS-232989
Wu, Z., Wei, R., Chu, Z., and Liu, Q. (2021). Real-time rock mass condition prediction with TBM tunneling big data using a novel rock–machine mutual feedback perception method. J. Rock Mech. Geotechnical Eng. 13 (6), 1311–1325. doi:10.1016/j.jrmge.2021.07.012
Xu, H., Zhou, J., G Asteris, P., Jahed Armaghani, D., and Tahir, M. M. (2019). Supervised machine learning techniques to the prediction of tunnel boring machine penetration rate. Appl. Sci. 9 (18), 3715. doi:10.3390/app9183715
Xu, C., Liu, X., Wang, E., and Wang, S. (2021). Prediction of tunnel boring machine operating parameters using various machine learning algorithms. Tunn. Undergr. Space Technol. 109, 103699. doi:10.1016/j.tust.2020.103699
Yagiz, S. (2002). Development of rock fracture and brittleness indices to quantify the effects of rock mass features and toughness in the CSM model basic penetration for hard rock tunneling machines. Ph.D. thesis. Department of mining and Earth systems engineering, 289.
Yagiz, S. (2008). Utilizing rock mass properties for predicting TBM performance in hard rock condition. Tunn. Undergr. Space Technol. 23 (3), 326–339. doi:10.1016/j.tust.2007.04.011
Yagiz, S. (2017). New equations for predicting the field penetration index of tunnel boring machines in fractured rock mass. Arabian J. Geosciences 10, 33–13. doi:10.1007/s12517-016-2811-1
Yagiz, S., and Gokceoglu, C. (2010). Application of fuzzy inference system and nonlinear regression models for predicting rock brittleness. Expert Syst. Appl. 37 (3), 2265–2272. doi:10.1016/j.eswa.2009.07.046
Yagiz, S., and Karahan, H. (2011). Prediction of hard rock TBM penetration rate using particle swarm optimization. Int. J. Rock Mech. Min. Sci. 48 (3), 427–433. doi:10.1016/j.ijrmms.2011.02.013
Yagiz, S., Gokceoglu, C., Sezer, E., and Iplikci, S. (2009). Application of two non-linear prediction tools to the estimation of tunnel boring machine performance. Eng. Appl. Artif. Intell. 22 (4-5), 808–814. doi:10.1016/j.engappai.2009.03.007
Yan, T. (2022). Data on prediction of geological characteristics during shield tunnelling in mixed soil and rock ground. Data Brief 45, 108726. doi:10.1016/j.dib.2022.108726
Yan, C., Li, G., Wang, H., and Duan, S. (2023). Development of a PLSR-BRT model for predicting the performance of tunnel boring machines. Int. J. Geomechanics 23 (3), 04022314. doi:10.1061/IJGNAI.GMENG-7738
Yang, H., Wang, Z., and Song, K. (2020). A new hybrid grey wolf optimizer-feature weighted-multiple kernel-support vector regression technique to predict TBM performance. Eng. Comput. 38, 2469–2485. doi:10.1007/s00366-020-01217-2
Yang, J., Yagiz, S., Liu, Y. J., and Laouafa, F. (2022). Comprehensive evaluation of machine learning algorithms applied to TBM performance prediction. Undergr. Space 7 (1), 37–49. doi:10.1016/j.undsp.2021.04.003
Yu, H., Tao, J., Qin, C., Xiao, D., Sun, H., and Liu, C. (2021). Rock mass type prediction for tunnel boring machine using a novel semi-supervised method. Measurement 179, 109545. doi:10.1016/j.measurement.2021.109545
Yu, H., Zhou, X., Zhang, X., and Mooney, M. (2022). Enhancing earth pressure balance tunnel boring machine performance with support vector regression and particle swarm optimization. Automation Constr. 142, 104457. doi:10.1016/j.autcon.2022.104457
Yu, Z., Li, C., and Zhou, J. (2023a). Tunnel boring machine performance prediction using supervised learning method and swarm intelligence algorithm. Mathematics 11 (20), 4237. doi:10.3390/math11204237
Yu, H., Qin, C., Tao, J., Liu, C., and Liu, Q. (2023b). A multi-channel decoupled deep neural network for tunnel boring machine torque and thrust prediction. Tunn. Undergr. Space Technol. 133, 104949. doi:10.1016/j.tust.2022.104949
Zare Naghadehi, M., and Ramezanzadeh, A. (2017). Models for estimation of TBM performance in granitic and mica gneiss hard rocks in a hydropower tunnel. Bull. Eng. Geol. Environ. 76, 1627–1641. doi:10.1007/s10064-016-0950-y
Zell, A. (1994). Simulation neuronaler netze [simulation of neural networks], original document in German.
Zeng, J., Roy, B., Kumar, D., Mohammed, A. S., Armaghani, D. J., Zhou, J., et al. (2021). Proposing several hybrid PSO-extreme learning machine techniques to predict TBM performance. Eng. Comput. 38, 3811–3827. doi:10.1007/s00366-020-01225-2
Zhang, Q., Liu, Z., and Tan, J. (2019). Prediction of geological conditions for a tunnel boring machine using big operational data. Automation Constr. 100, 73–83. doi:10.1016/j.autcon.2018.12.022
Zhang, Y., Wei, M., Su, G., Li, Y., Zeng, J., and Deng, X. (2020a). A novel intelligent method for predicting the penetration rate of the tunnel boring machine in rocks. Math. Problems Eng. 2020, 1–15. doi:10.1155/2020/3268694
Zhang, Q., Liu, Z., and Tan, J. (2020b). “August. Predicting the performance of tunnel boring machines using big operational data,” in 2020 IEEE sixth international conference on big data computing service and applications (BigDataService) (IEEE Computer Society), 179–182. doi:10.1109/BigDataService49289.2020.00035
Zhang, Q., Hu, W., Liu, Z., and Tan, J. (2020c). TBM performance prediction with Bayesian optimization and automated machine learning. Tunn. Undergr. Space Technol. 103, 103493. doi:10.1016/j.tust.2020.103493
Zhang, X. P., Xie, W. Q., Liu, Q. S., Yang, X. M., Tang, S. H., and Wu, J. (2021). Development and application of an in-situ indentation testing system for the prediction of tunnel boring machine performance. Int. J. Rock Mech. Min. Sci. 147, 104899. doi:10.1016/j.ijrmms.2021.104899
Zhang, Y., Chen, J., Han, S., and Li, B. (2022). Big data-based performance analysis of tunnel boring machine tunneling using deep learning. Buildings 12 (10), 1567. doi:10.3390/buildings12101567
Zhang, J., Shi, K., Majiti, H., Shan, H., Fu, T., Shi, R., et al. (2023). Study on the classification and identification methods of surrounding rock excavatability based on the rock-breaking performance of tunnel boring machines. Appl. Sci. 13 (12), 7060. doi:10.3390/app13127060
Zhao, Z., Gong, Q., Zhang, Y., and Zhao, J. (2007). Prediction model of tunnel boring machine performance by ensemble neural networks. An Int. J. 2 (2), 123–128. doi:10.1080/17486020701377140
Zhou, J., Yazdani Bejarbaneh, B., Jahed Armaghani, D., and Tahir, M. M. (2020). Forecasting of TBM advance rate in hard rock condition based on artificial neural network and genetic programming techniques. Bull. Eng. Geol. Environ. 79, 2069–2084. doi:10.1007/s10064-019-01626-8
Zhou, J., Qiu, Y., Zhu, S., Armaghani, D. J., Li, C., Nguyen, H., et al. (2021). Optimization of support vector machine through the use of metaheuristic algorithms in forecasting TBM advance rate. Eng. Appl. Artif. Intell. 97, 104015. doi:10.1016/j.engappai.2020.104015
Nomenclature
a Specific work of Chiseling
a20 a20 Index
Ab Rock Abrasion Resistance Index
ABC_SVR Artificial Bee Colony Algorithm Based Support Vector Regressor
AdaBoost Adaptive Boosting
Adj
ANFIS Adaptive Neuro-Fuzzy Inference System
ANN Artificial Neural Network
AR Advance Rate
ARIMAX Autoregressive Integrated Moving Average with Explanation
ARLSTM Adaptive Residual Long Short-Term Memory
AV Abrasion Value
BBO_FW_MKL_SVR Biogeography-Based Optimized Feature Weighted Multiple Kernel Learning Support Vector Regressor
BI Boreability Index
Bi Rock Brittleness Index
BMLPNN Biogeography-Based Multilayer Perceptron Neural Network
BPNN Backpropagation Algorithm-Based Neural Network
BQ Basic Quality Index
BR Bayesian Regularization
BRMR Bored Rock Mass Rating
BSVR Biogeography Based Support Vector Regressor
BTS Brazilian Tensile Strength
C Cohesion
CART Classification and Regression Trees
CEP Chamber Earth Pressure
CFF Core Fracture Frequency
CHAID Chi-squared Automatic Interaction Detection
CLI Cutter Life Index
CM Compression Modulus
CNN Convolutional Neural Network
CoP Control Parameters
CS Cutterhead Speed
CT Cutterhead Torque
CxP Context Parameters
CZ Cutter Size
D Cutter Diameter
DE_SVR Differential Evolution Algorithm Based Support Vector Regressor
DPW Average Distance between Planes of Weakness
DRI Drilling Rate Index
DT Decision Tree
DT Total Datasets used in the research
DT_PR Decision Tree Polynomial Regression Model
E Young’s Modulus
ELM Extreme Learning Machine
EM Empirical Method
ENN Ensemble Neural Network
EPR Evolutionary Polynomial Regression
ETBM Earth Pressure Balance Shield Tunnel Boring Machine
F Thrust per Cutter
FA_ANN Firefly Algorithm-Based Artificial Neural Network
FEP Field Excavation Performance
FLogics Fuzzy Logics
FN Functional Network
Fn Individual Cutter Force
FPI Field Penetration Index
FS Fracture Spacing
GB Gradient Boosting
GCN Graph Convolutional Network
GEO Geological Parameters
GEP Gene Expression Programming
GMDH Group Method of Data Handling
GP Genetic Programming
GSA_SVR Gravitational Search Algorithm Based Support Vector Regressor
GSI Geological Strength Index
GTB Gradient Tree Boosting
GW Ground Water
GWO_FW_ MKL_SVR Grey Wolf Optimized Feature Weighted Multiple Kernel Learning Support Vector Regressor
GWO_LSTM Grey Wolf Optimized Long Short-Term Memory
HENSM Hybrid Ensemble Model
IC Sum of Motor Current
ICA Imperialist Competitive Algorithm
IFA Internal Friction Angle
IOA Agreement Index
IOS Scatter Index
JP Joint Parameters
k Slope of Predicted versus Actual Performance of TBM
kNN K-Nearest Neighbor
KR Rock Mass Permeability
LGBM Light Gradient Boosting Machine
LR Linear Regression
LSSVM Least Square Support Vector Machine
LSTM Long Short-Term Memory
m and n Factors for Estimating the Predictive Power of the Proposed Models
MAE Mean Absolute Error
MAPE Mean Absolute Percentage Error
MCD_DNN Multi-Channel Decoupled Deep Neural Network
MFIS Mamdani Fuzzy Inference System
MKL_SVR Multiple Kernel Learning Support Vector Regressor
MLP Multilayer Perceptron
MLR Multilinear Regression
MP Sum of Motor Power
MPMR Minimax Probability Machine Regression
MSE Mean Square Error
N Overload Factor-Stability Factor
n Porosity
NB Naïve Bayesian
NFIS Neuron Fuzzy System
NMBE Normalized Mean Bias Error
NS Nash-Sutcliffe Efficiency
OA Orientation Angle
OBJE Objective Function Criterion
OD Overburden Construction Depth
OP Operational Parameters
PDP Partial Dependence Plots
PF Field Single Cutter Load
PLSR_BRT Partial Least Squares Regression with Boosted Regression Tree
PNR Poisson Ratio
PR Penetration Rate
PRB Ensemble Regression Model Based on Bagging
PRF Ensemble Regression Model Based on Feature Randomness
PS Pressure of Shield
PSI Punch Slope Index
PSO_RVM Particle Swarm Optimized Relevance Vector Machine
Q Tunnel Quality Index
Qc Quartz Content
R Correlation Coefficient
RB Ratio of Boulder
RF Random Forest
RFC Rock Fracture Class
RMC Rock Mass Cuttability Index
RMFD Rock Mass Fracture Degree
RMI Rock Mass Index
RMQ Rock Mass Quality
RMR Rock Mass Rating
RMSE Root Mean Square Error
RNN Recurrent Neural Network
RPM Round Per Minute of the Cutter
RQD Rock Quality Designation
RR Rock Structure Rating
RSR Root Mean Square Error to Observation’s Standard Deviation Ratio
RVM Relevance Vector Machine
SA_BPNN Simulated Annealing Backpropagation Neural Network
SAE Stacked Autoencoder
SHH Schmidt Hammer Hardness
SJ Siver’s J value
Sp Spacing
SRE Surrounding Rock Excavatability
SRMBi Specific Rock Mass Boreability Index
SSA Sparrow Search Algorithm
SSH Shore Scleroscope Hardness
SVM Support Vector Machine
SVR Support Vector Regressor
T Torque
TF Thrust Force
TFPC Thrust Force per Cutter
TI Toughness Index
TSF Takagi Sugeno Fuzzy
TT Total Thrust
UCS Uniaxial Compressive Strength
VAF Variance Accounted For
W Cutter-head Power
w/d Water-table Surface relative to the tunnel Depth
WD Weathering Degree
WMAPE Weighted Mean Absolute Percentage Error
WOA Whale Optimization Algorithm
WOA_STK Whale Optimization Algorithm-Based Stacking Model
WOA_XGBoost Whale Optimization Algorithm-Based Extreme Gradient Boosting
WZ Weathering Zone
XGBoost Extreme Gradient Boosting
yi Predicted Performance of TBM
α Angle between the Tunnel Axis and the Planes of Weakness
Keywords: bidirectional long short-term memory, multicollinearity, penetration rate, tunnel boring machine, feature selection
Citation: Khatti J and Mishra S (2025) Estimating shield tunnel boring machine penetration rate in mixed face conditions: feature selection and multicollinearity effects on machine and deep learning models. Front. Built Environ. 11:1699466. doi: 10.3389/fbuil.2025.1699466
Received: 05 September 2025; Accepted: 29 October 2025;
Published: 19 November 2025.
Edited by:
Xinbao Yu, University of Texas at Arlington, United StatesReviewed by:
Panagiotis G. Asteris, School of Pedagogical and Technological Education, GreeceXuedong Bai, Shenzhen University, China
Copyright © 2025 Khatti and Mishra. This is an open-access article distributed under the terms of the Creative Commons Attribution License (CC BY). The use, distribution or reproduction in other forums is permitted, provided the original author(s) and the copyright owner(s) are credited and that the original publication in this journal is cited, in accordance with accepted academic practice. No use, distribution or reproduction is permitted which does not comply with these terms.
*Correspondence: Jitendra Khatti, aml0ZW5kcmFraGF0dGkxOTdAZ21haWwuY29t