 Yanping Miao1
 Chiheng Cai2Xuhe Zheng1Changyue Liu1Jianxi Ren2*Baojun Xu1Ke Wang2Kun Zhang2Pengfei Zhang2Jianqiang Yuan1
- 1Shenmu Hongliulin Mining Co., Ltd., Shaanxi Coal Group Shenmu, China
- 2School of Architecture and Civil Engineering, Xi’an University of Science and Technology, Xi’an, Shaanxi, China
Coal-rock dynamic disasters, especially rock bursts, pose serious threats to mining safety and production efficiency in deep mining operations. To improve the accuracy and intelligence of coal-rock burst risk assessment, this paper proposes a BP neural network model optimized by Particle Swarm Optimization (PSO). The model integrates coal seam mechanical parameters, mining conditions, and surrounding rock properties as input indicators to construct a comprehensive evaluation system. PSO is applied to optimize the initial weights and thresholds of the BP neural network to avoid local minima and improve convergence speed and prediction accuracy. The optimized model is trained using field monitoring and testing data. Comparative experiments demonstrate that the PSO-BP model exhibits higher prediction accuracy and better generalization ability compared to the traditional BP network. The results indicate that this method can effectively evaluate the risk of coal-rock burst and provides technical support for early warning and disaster prevention in coal mines.
1 Introduction
Coal remains China’s primary energy source, playing a crucial role in ensuring national economic development. However, with increasing mining depth and more complex geological conditions, the frequency and intensity of dynamic disasters such as rock bursts have grown significantly, posing serious threats to mining safety and operational efficiency (Kang, 2021; He and Wang, 2023; Yun et al., 2025). Understanding the mechanisms of rock bursts and developing accurate risk assessment methods are therefore of paramount importance (Mahmood et al., 2022a; Asteris et al., 2021; Zhang et al., 2025; Liu et al., 2024; Tan et al., 2025).
In previous studies, scholars have proposed a variety of methods for evaluating coal-rock burst risk, including stress increment assessment based on self-weight stress superposition, the critical stress index method, fuzzy comprehensive evaluation models, the CW-TOPSIS model, chaos particle swarm optimization BP neural networks, and deep learning approaches. These achievements have provided valuable theoretical and methodological support for rockburst prediction. However, existing evaluation methods-including statistical models, BP neural networks, and their optimizations with PSO-still suffer from several limitations, such as strong subjectivity, susceptibility to local optima, and dependence on high-quality datasets. Moreover, most models fail to effectively integrate multi-source monitoring information, thereby restricting their robustness under complex geological conditions.
A deep learning framework for coal-rock burst risk (DLFR) was constructed based on the fractal dimension of microseismic information. Influencing factors were screened using gray relational analysis (GRA), information gain ratio (IGR), and Pearson correlation coefficient, while model performance was evaluated through indicators such as macro-F1, accuracy, and fitness curves. Taking Gaojiapu Coal Mine as a case study, the performance of BP neural network, support vector machine (SVM), and their particle swarm optimization (PSO)-based optimized models within this framework was explored, verifying the reliability of the models. Additionally, the quantification of mining-induced seismicity can address the issue of insufficient training samples, providing a basis for graded and precise prevention and control (Cheng et al., 2023). A coal mine rock burst evaluation index system was constructed, with the criterion layer including geological conditions, safety management, mining technology and other factors, and the index layer covering 24 factors such as mining depth and coal-rock mechanical properties. The weights calculated by “Analytic Hierarchy Process (AHP) and entropy weight method” were fused, and the Lagrange function was introduced to build an optimized decision-making model. Through the Euclidean distance function, the preference coefficient was obtained, and then the combined weights of the indexes were derived. Finally, a CW-TOPSIS coal mine rock burst evaluation model was established to judge the rock burst grade (Chen et al., 2021). Moment tensors (MTs) have been widely applied to study the triggering mechanisms of high-magnitude events (HMEs). However, the clustering characteristics of MTs prior to HMEs have rarely been systematically explored, which restricts the application of MTs in HME prediction and dynamic hazard risk management. This study aims to characterize the clustering properties of MTs before HMEs and apply them to HME prediction, and proposes a seismic clustering method suitable for hybrid MT inversion to obtain reliable source mechanism solutions (Liu et al., 2023).
A multi-parameter index-based risk assessment and prediction model for coal mass impact was proposed. This model considers the characteristics of acoustic emission and electromagnetic emission signals during mine impact processes, and constructs a new energy accumulation index S. Meanwhile, combined with microseismic monitoring indicators E (microseismic energy) and N (microseismic frequency), static and dynamic risk assessment and prediction models for coal mass impact were established. The study adopted principal component analysis and density ellipse method to determine index S, and then obtained the distribution and variation laws of acoustic emission and electromagnetic emission signals (Luo et al., 2022; Zhang et al., 2020; Zhang et al., 2010) introduced a fuzzy comprehensive evaluation method based on the analytic hierarchy process (AHP), constructing a multi-level fuzzy evaluation model to quantitatively assess both the rock burst hazard of coal seams and the effectiveness of roadway bolt support (Wang et al., 2017). Optimized BP neural networks using a particle swarm optimization (PSO) algorithm, and found that under an error threshold of 0.001, the convergence speed of the optimized BP neural network was 4–5 times faster than that of the standard BP network (Yin et al., 2016). Combined chaos theory, PSO, and BP neural networks to propose a chaos-PSO-BP model, which produced superior prediction results for rock bursts compared to conventional BP neural networks.
Based on the seismic data and 24 coal burst records during the period of 16 months, a risk assessment method including three indexes (Static Intensity Index (SII), Dynamic Intensity Index (DII), and Risk Assessment Index (RAI)) was derived from seismic energy attenuation. In consideration of the static and dynamic response, the superposition effects of seismic energy were proposed to improve the performance of risk assessment (Liu et al., 2022). A BP neural network-based impact risk assessment method is proposed. This method uses existing impact pressure data to construct a regression model through the BP network, and adopts the particle swarm optimization (PSO) algorithm to optimize the connection weights, so as to improve the problems of slow convergence and proneness to falling into local optimum of the BP network. Verified with mine risk assessment as an example, the results show that this method has accuracy and overall applicability (Zhang, 2021). To assess the rock burst-prone areas in the lower seams during multi-seam mining, a method for evaluating rock burst hazards in multi-seam mining was established, and an energy density risk index (EDRI) was developed. It is demonstrated that EDRI can more accurately reflect potential rock burst areas compared with the multi-factor coupling analysis method. The EDRI of the upper coal seam was used to divide the rock burst risk zones of the lower coal seam, thus establishing a rock burst hazard assessment method for multi-seam mining (Shen et al., 2017). Recent research has increasingly focused on hybrid intelligent models to improve prediction reliability (Wang et al., 2023). Improved the BP neural network framework by applying the Levenberg-Marquardt training algorithm with normalized data. Their model achieved superior prediction accuracy-peaking at 97%-with performance improving as sample size increased (Yuan et al., 2023) introduced a PCA-PSO-ELM model, combining principal component analysis (PCA), particle swarm optimization (PSO), and extreme learning machine (ELM). This integrated approach mitigated randomness in ELM inputs and hidden thresholds, achieving 100% accuracy on test data and demonstrating rapid learning speed, strong generalization, and high robustness (Fu et al., 2024) applied a Bayesian-optimized LSTM model (BO-LSTM) to 3 years of microseismic data. By identifying key daily indicators-total energy, maximum energy, and frequency-their model outperformed alternative deep learning approaches, illustrating effective time-series feature extraction for predictive tasks (Wojtecki et al., 2024) tackled the challenge of distinguishing rare rock bursts from numerous non-destructive tremors using an ensemble of machine learning classifiers, balanced by the ADASYN algorithm.
Numerous studies on machine learning applications. A study based on ASTM and BS standards examined the effects of different sand gradations and water-reducing polymers (WRP) on the properties of cement grout. The results showed that WRP significantly reduced the water–cement ratio and improved both fluidity and compressive strength, with the strength enhancement varying by curing period and dosage. Fine-grained sand exhibited superior strength performance under identical conditions (Mahmood et al., 2022b). A study employed ensemble soft computing models to predict the liquefaction potential index (LPI) of fine-grained soils. XGBoost achieved 99% accuracy in predicting liquefaction potential, serving as a reliable alternative to empirical methods (Ghani et al., 2024). A WOA-LMBPNN model is proposed to predict reinforced concrete beam deflection, showing higher accuracy and robustness than PSO-LMBPNN (Zhao et al., 2022). Two hybrid fuzzy systems (FS-DE, FS-FFA) are proposed to predict the axial capacity of circular CFST columns, achieving 9.68% and 6.58% accuracy improvements over the base model and outperforming design codes (Liao et al., 2021). A study developed artificial neural networks to predict rock unconfined compressive strength using Schmidt hammer number, compressional wave velocity, and porosity. Among ANN-LM, ANN-PSO, and ANN-ICA models, ANN-ICA achieved the highest accuracy, with predictions within ±20% of experimental values for 86% of samples. A closed-form equation and GUI are provided for verification (Le et al., 2022).
Despite these advancements, current evaluation methods still exhibit subjectivity and inconsistency due to differences in the selection and weighting of influencing factors. In this study, we first select key indicators for evaluating coal–rock burst risk and construct a dataset. Through correlation analysis, we identify dominant factors affecting burst potential. Based on these factors, we establish a PSO-optimized BP neural network model and verify its applicability through field tests conducted in underground coal mines. The novelty of this study lies in the customized improvement of the traditional PSO-BP model for coal–rock dynamic disaster prediction. Instead of relying on random initialization, the initial weights and thresholds of the BP network are optimized using PSO with an adaptive mutation mechanism, which to some extent addresses the challenges of “slow convergence and susceptibility to overfitting” in conventional BP models. Unlike existing hybrid models such as chaos-PSO-BP, the proposed framework is capable of integrating multiple inputs and multi-physical parameters to effectively handle the coupled data from field monitoring in coal mines.
The structure of this paper is organized as follows: Section 3 introduces the research methodology and the PSO-BP neural network framework; Section 4 presents the experimental data and results; Section 5 provides an engineering case analysis; and Section 6 offers future perspectives and concludes the paper.
2 Research significance
Although numerous studies have been conducted on rock burst prediction and risk assessment, existing approaches still face limitations such as insufficient feature extraction, low adaptability to complex geological conditions, and susceptibility to local optima. These challenges restrict the robustness and generalization ability of current models.
This study addresses, to some extent, the challenges of slow convergence and overfitting in the BP model for coal–rock dynamic disaster prediction, providing a customized improvement tailored to scenarios characterized by limited samples and strong nonlinearity. By proposing a systematic framework that integrates field validation with computational intelligence, this research enriches the existing body of knowledge. The results not only broaden the application scope of hybrid neural network models in rock burst risk assessment but also offer practical reference for risk prevention in deep mining engineering.
3 Selection of impact risk indicators and dataset construction
3.1 Case studies of rock burst incidents
3.1.1 Rock burst at working face 109
Working face 109 is the first fully mechanized mining face in its panel and is flanked by solid coal seams on both sides. The designed mining length along the strike is 220 m, with a recoverable strike length of 2,340 m. The coal seam dip angle ranges from less than 5°–10°. The maximum absolute gas emission from the face is 32.35 m3/min. The mining method employed is fully mechanized top coal caving, with roof management by full caving. The average burial depth of the face is 825.27 m. The roof consists of a composite structure dominated by siltstone and coarse-grained sandstone, while the floor mainly comprises aluminous mudstone, which easily swells when exposed to water.
No faults are developed within the face area, and geological structures have minimal impact on rock burst occurrences. However, two rock burst events have occurred in the same coal seam at this level. The in-situ stress field in this area is dominated by horizontal stress, with the maximum principal horizontal stress reaching up to 30.6 MPa, while the vertical stress is the minimum principal stress.
During the retreat phase, dynamic phenomena in the coal seam became increasingly frequent and intense during roadway excavation. Notable manifestations included loud explosive sounds (coal cannon phenomena) and coal block ejection in unsupported zones. The roof exhibited significant subsidence, and the steel supports in the roadway were compressed, deformed, or even fractured.
3.1.2 Rock burst at working face 1416
Working face 1416 has an average mining depth of 565.6 m, with a designed recoverable strike length of 1,688 m and an inclined length of 220 m. The coal seam dip is generally less than 10°, with minimal variation. The maximum absolute gas emission ranges from 18 to 22 m3/min. The immediate roof consists of sandy mudstone, while the floor is mudstone, which easily softens and swells upon water exposure.
Although no prominent fault structures are present within the face, it is located on the northwestern flank of the Yuangou syncline, where a secondary anticline and syncline are also developed. These folds have a significant influence on rock burst occurrence. Borehole stress monitoring of coal pillars within the face recorded a stress value of 23.02 MPa. No rock bursts were recorded in the same coal seam during the development phase.
However, during retreat mining, dynamic manifestations attributed to rock bursts were observed, including sudden floor heaving and minor rib deformation forming mesh-like patterns. In densely excavated areas such as roadways and chambers, rock burst events occurred more frequently, often characterized by skin delamination, material ejection, and other dynamic responses. These phenomena were mostly concentrated in high-stress areas induced by folds and fault interactions.
3.1.3 Rock burst at working face 224
Working face 224 has an average burial depth of 577.98 m and a coal seam dip between 2° and 7°, with stable occurrence conditions. According to gas geological data, the face is located within a high-gas zone, with absolute gas emission during retreat mining ranging from 18 to 37 m3/min. The immediate roof comprises siltstone, while the floor is made up of carbonaceous mudstone. The topographic contour variations in the area are relatively gentle, and the region is affected by a syncline-like structure.
This working face is mined beneath a protective seam, where tectonic stress is significantly released during protective seam extraction. A 74 m coal pillar was left between the return air roadway and the adjacent goaf, while the other side of the face had not yet been mined and was not influenced by coal pillar stress. The mine had previously experienced a rock burst during retreat mining in the isolated working face 220.
During retreat at face 224, a rock burst occurred, characterized by violent vibrations, coal dust dispersion, and floor uplift at the center. Two roof fall events were also reported, along with significant roadway deformation.
3.2 Determination of evaluation indicators and dataset construction
The selection of evaluation indicators is a critical step for accurately assessing the risk of coal-rock bursts. As demonstrated by the case analyses above, rock bursts do not follow a fixed occurrence pattern nor are they directly tied to a single factor; rather, they are often induced by the combined effect of multiple factors. Therefore, when identifying influencing factors, considerations should include the feasibility of data acquisition and the effectiveness of each factor in representing key influences. Suitable parameters should be selected accordingly.
Based on the above case studies and existing research, this study incorporates coal body stress as one of the essential influencing factors for rock burst risk. A total of ten indicators affecting coal-rock burst risk are identified, including: mining depth (Z1), coal seam dip angle (Z2), width of the coal pillar section (Z3), uniaxial compressive strength (Z4), coal body stress (Z5), geological structure (Z6), historical frequency of rock bursts in the same horizontal coal seam (number of events n, Z7), roof management (Z8), pressure relief condition of protective seams (Z9), and the spatial relationship between the working face and adjacent goaf areas (Z10). The influencing factors include mining depth, coal seam dip angle, sectional coal pillar width, uniaxial compressive strength, in-situ coal stress, geological structures, history of rock burst occurrences in adjacent coal seams, roof control measures, pressure relief conditions of protective seams, and the spatial relationship between the working face and adjacent goaf areas.
By collecting dynamic records of rock burst phenomena from multiple mining faces, this study compiles a representative dataset comprising 111 original rock burst samples summarized in Table 1. The rock burst risk levels are classified into four categories: no risk, weak risk, moderate risk, and strong risk.
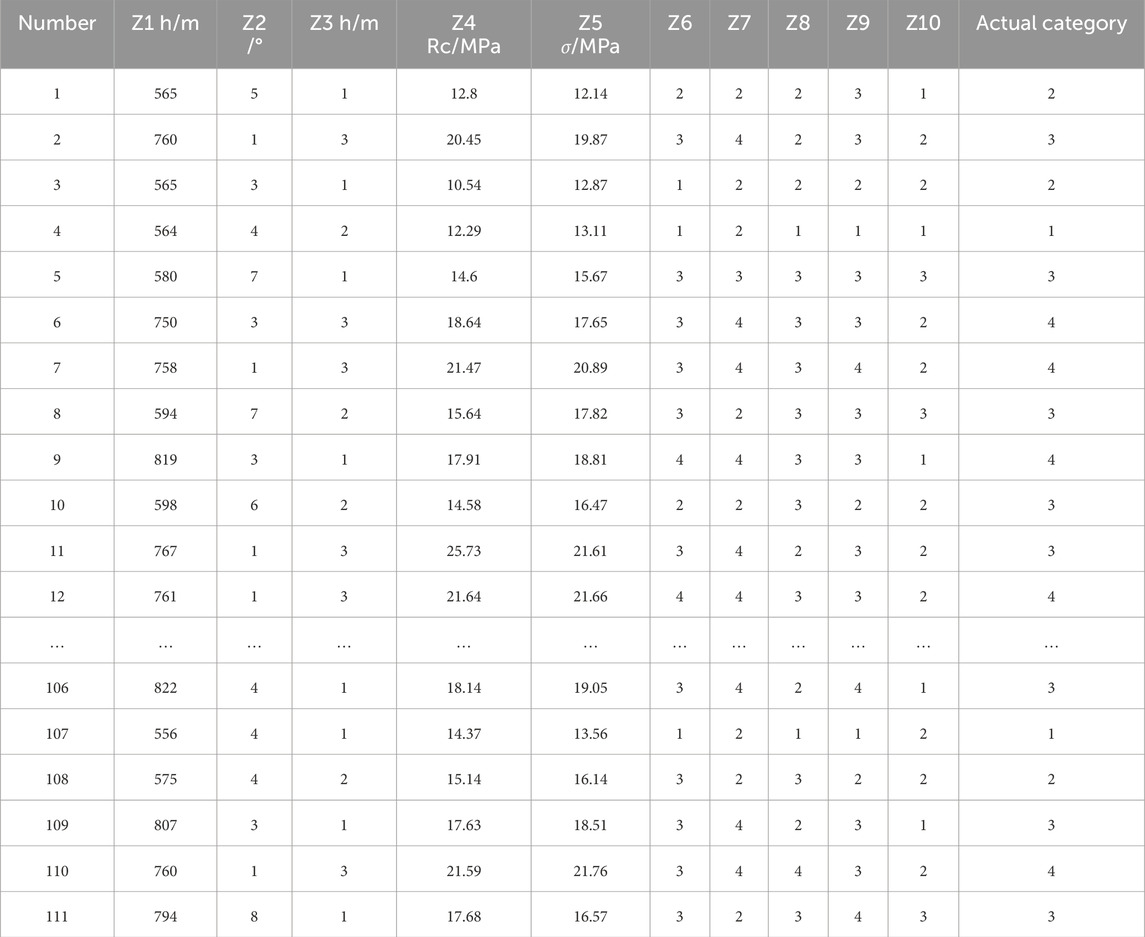
Table 1. Selected rock burst hazard sample data.
In the established sample dataset (as shown in Figure 1), there are 22 samples classified as having no rock burst risk, accounting for 19.8% of the total; 34 samples with weak rock burst risk, accounting for 30.6%; 30 samples with moderate risk, accounting for 27.0%; and 25 samples with strong risk, accounting for 22.5%. The distribution of samples among different risk categories is therefore imbalanced.
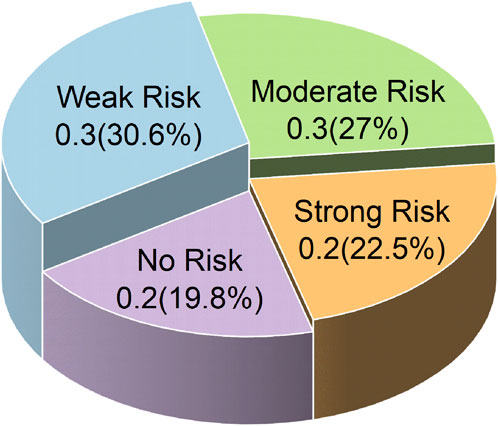
Figure 1. Distribution proportion of rock burst hazard sample data.
During the machine learning model training process, such class imbalance can cause the classifier to be biased toward the majority classes, which negatively impacts the recognition accuracy for minority classes. To mitigate this issue, the dataset was first randomly shuffled, and then an oversampling technique was applied to randomly replicate samples from minority classes, thereby balancing the dataset and improving the model’s sensitivity to less represented categories. The quantitative assignment of impact hazard influence factors is shown in Table 2.
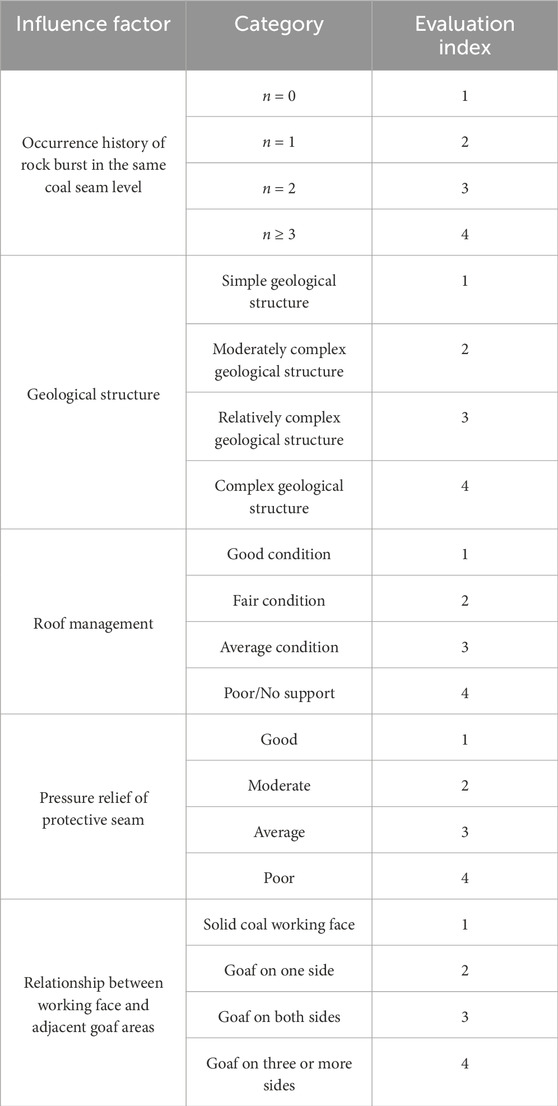
Table 2. Quantitative assignment of impact hazard influence factors.
Furthermore, data standardization was performed prior to training to enhance the stability and convergence of the model.
Correlation analysis is a quantitative method used to describe the relationship between two or more variables, aiming to reveal the degree of association between them. The Pearson correlation coefficient is one of the most commonly used metrics for correlation analysis, with values ranging from −1, to 1. This coefficient primarily measures the linear relationship between variables. When r = 0, it indicates the absence of a linear correlation but does not necessarily imply that the variables are completely independent. The larger the absolute value of the correlation coefficient, the stronger the correlation between the variables. Values close to ±1 indicate a strong positive or negative linear relationship, while values near zero suggest a weak correlation. Prior to conducting correlation analysis between indicators, a significance test is required to ensure that the observed correlations are not due to random fluctuations. The results indicate that the significance probability p-value is less than 0.05, confirming that the calculated correlation coefficients are statistically significant and suitable for further analysis.
To clarify the actual influence degree of each factor on rock burst risk, Pearson correlation coefficients were calculated between the selected 10 evaluation indicators and the observed rock burst risk levels. As shown in Figure 2, indicators such as mining depth, coal body stress, and geological structure exhibit significant positive correlations with rock burst risk levels. This indicates that deep burial environments, high-stress conditions, and complex geological structures significantly increase the likelihood of rock burst occurrence. Among all indicators, coal body stress has the highest correlation coefficient of 0.76 with rock burst risk level, confirming its critical role in the mechanism of rock burst disasters.
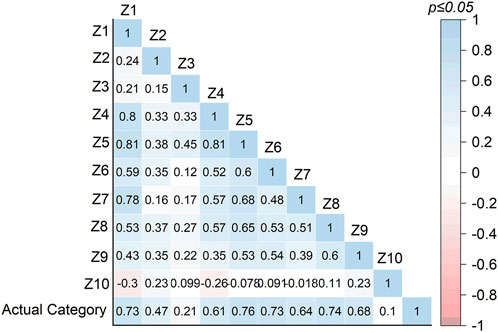
Figure 2. Heatmap of correlations among selected indicators.
The correlation coefficients between the sectional coal pillar width, the relationship between the working face and adjacent goaf, and the actual risk level are relatively low at 0.21 and 0.10, respectively. The reason for these lower values is that some data samples are adjacent to solid coal pillars rather than goaf areas, which reduces the apparent correlation. Therefore, these lower coefficients do not imply that the above two indicators have minimal impact on rock burst occurrence.
4 PSO-BP neural network structure and parameter determination
4.1 Basic principles of BP neural network
In practical applications, the Backpropagation (BP) algorithm remains one of the most widely used models within artificial neural networks. The core characteristic of the BP neural network lies in the synergy between its multilayer feedforward architecture and adaptive learning mechanism. As a typical artificial feedforward neural network, its structure transforms linear weighted inputs into nonlinear responses through nonlinear activation functions such as Sigmoid or ReLU, enabling the network output to be more “flexible” and granting the network the capability to classify complex patterns. Compared to a single-layer perceptron, BP networks can achieve hierarchical mapping from raw input data to high-level semantic representations.
In constructing neural network models, the determination of core parameters is not governed by explicit rules or standards; instead, it largely relies on empirical formulas or repeated trials to identify optimal values. The key parameters typically include the number of network layers, the number of neurons in the input and hidden layers, the number of hidden nodes, the activation functions, and the learning rate.
For a backpropagation (BP) neural network, the number of hidden layers can theoretically be set arbitrarily. However, increasing the number of hidden layers also increases the complexity of the network. In practice, a single hidden layer is generally sufficient to meet most problem-solving requirements. Therefore, in this study, the BP neural network model for evaluating coal–rock burst risk adopts a single hidden layer.
To facilitate the output of burst risk levels, the risk was categorized into four classes: no risk, low risk, moderate risk, and high risk. Accordingly, the output layer consists of four neurons. Based on Kolmogorov’s theorem, the number of hidden nodes was initially set at 10, and then adjusted within the range of 1–10 additional nodes to achieve optimal performance under error constraints.
The choice of activation function directly affects the network’s expressive power, convergence speed, and stability. Since the BP neural network is designed to address nonlinear problems, incorporating nonlinear activation functions enhances its representational capacity. In this study, the hidden layer employs the hyperbolic tangent sigmoid function (tansig), available in the MATLAB toolbox, with a value range of (−1, 1). For the output layer, the Softmax function is applied. This function not only considers the input to each neuron but also incorporates the outputs of other neurons, transforming the network outputs into a probability distribution. Consequently, cross-entropy is selected as the loss function to measure the divergence between the predicted and actual distributions. Unlike the mean squared error (MSE) function, cross-entropy exhibits monotonicity in classification tasks, and larger errors produce larger gradients, thereby accelerating weight updates during backpropagation. To prevent overfitting, regularization techniques were applied in the model, and PSO optimization was employed to provide improved initial weights and thresholds, thereby stabilizing the training process and reducing the risk of overfitting.
The theoretical foundation of the BP neural network lies in the gradient descent algorithm, where the learning rate determines the step size for parameter updates. If the learning rate is set too high, the optimization process may overshoot the optimal solution; if too low, convergence will be excessively slow. In engineering practice, relatively low learning rates are preferred to enable fine-tuning and ensure stable convergence. In this study, the learning rate was determined to be 0.01 through feedback from the command algorithm. The specific parameter settings of the model are shown in Table 3.
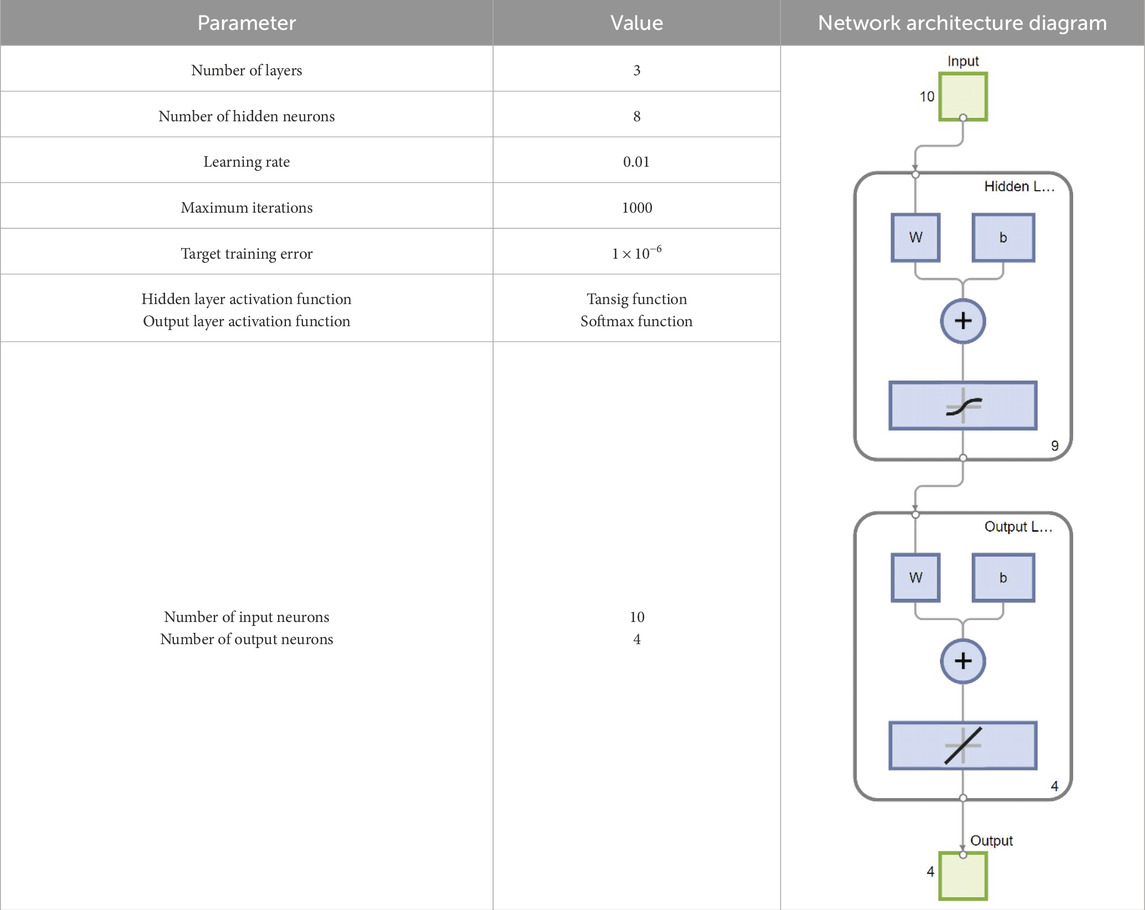
Table 3. Basic parameters of the BP neural network.
4.2 Construction and analysis of the BP neural network model
4.2.1 Model construction
Due to the differences in orders of magnitude between experimental conditions and test results, directly inputting unnormalized data into the model may cause certain features to dominate the training process, thereby masking other critical variables. In this study, min–max normalization was employed to map all variables into the [0,1] range, ensuring consistency across features and preventing gradient vanishing or explosion (Asteris et al., 2020; Asteris et al., 2025). This approach facilitates model convergence and supports the stable training of BP neural networks as well as metaheuristic optimization models such as PSO-BP.
The training of the BP neural network involves two main processes: (i) forward propagation, where the network produces prediction results, and (ii) backward propagation, where the model parameters are optimized via gradient descent to approximate the true targets. Its algorithmic implementation can be summarized as follows:
1. Network Initialization: Based on the system input–output sequence (X, Y), the numbers of neurons in the input, hidden, and output layers (n, l, m) are determined. The connection weights (w11, wq1) between neurons in adjacent layers, the hidden layer thresholds (aj), and the output layer thresholds (bk) are initialized randomly, providing the network with an initial “cognitive baseline”. The learning rate η, activation functions, network depth, and neuron count per layer are also specified.
2. Hidden Layer Output Calculation: Given the input vector X, the output of the hidden layer Z is computed from the input–hidden layer weights w11 and thresholds aj (Equation 1):
where n is the number of input neurons (set to 10 in this model) and l is the number of hidden layer neurons (set to 8 in this model). The choice of the activation function f(⋅) greatly influences the prediction accuracy. In this study, the following activation function is used (Equation 2):
3. Output Layer Output Calculation: Using the hidden layer output Zj, the output layer result Yk is computed from the hidden–output layer weights wq1 and thresholds bk (Equation 3):
where m is the number of output neurons (set to 4 in this model).
4. Error Calculation: The network error function ek is defined based on the predicted output Yk and the expected output Ok (Equation 4):
5. Weight Update and Iteration: Based on the prediction error ek, the connection weights w11 and wq1 are updated using gradient descent (Equations 5, 6):
where η is the learning rate (set to 0.01 in this model),
6. Threshold Update: The thresholds are updated according to the error function ek, Adjustment of the network thresholds (aj and bk)) is performed to enhance model performance (Equations 7, 8):
4.2.2 Algorithm implementation and prediction results analysis
The collected impact hazard indicator data were used as the input variables for the BP neural network model. Among the 111 available datasets, 90 were randomly selected as the training set for model learning, and the remaining 21 were used as the test set for model evaluation. The training process parameters, including the number of iterations and the minimum error. During training, the prediction error decreased progressively with the increase in iterations, reaching convergence after 11 iterations, with a minimum error value of 0.17985.
As shown in Figure 3, the prediction accuracy for the training set was 82.22%. For the 21 test samples, the predicted hazard levels produced by the BP neural network matched the actual hazard levels in 15 cases, corresponding to a test accuracy of 71.42%. The relatively higher error rate indicates that the prediction accuracy requires further improvement.
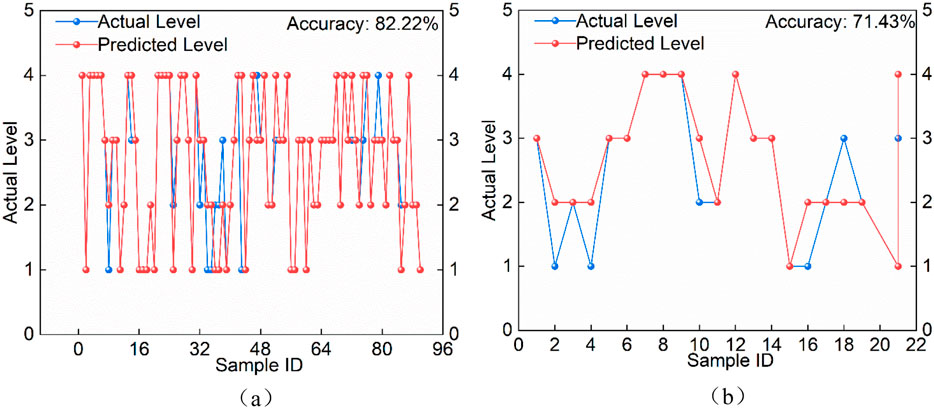
Figure 3. Training results of the BP model. (a) Prediction results for the training set. (b) Prediction results for the testing set.
Multi-feature classification aims to determine the categorical label of a sample based on multiple feature variables. As a classic neural network model, the BP algorithm can effectively handle complex classification problems. However, it has certain limitations, including relatively slow convergence and susceptibility to becoming trapped in local minima of the objective function. In the standard BP neural network, each neuron receives input solely from the previous layer, and weight updates, parameter optimization, and error adjustments are generally performed via gradient descent. This approach makes the model’s convergence highly sensitive to the initialization of weights and thresholds. In complex high-dimensional feature spaces, the existence of multiple local minima means that once the algorithm converges to a suboptimal point, it is difficult to escape and find the global optimum, thereby reducing both classification accuracy and generalization capability.
4.3 PSO-BP neural network model for rockburst hazard evaluation
4.3.1 Model construction
To enhance the prediction accuracy of the BP neural network model, the Particle Swarm Optimization (PSO) algorithm was incorporated to search for optimal weights and thresholds. This approach mitigates the issues of local optima and slow convergence caused by random initialization. The PSO-BP neural network is a hybrid model that combines the global search capability of PSO with the local optimization capability of BP.
During optimization, PSO iteratively updates particle positions and velocities, gradually reducing individual fitness values. When the optimal fitness is achieved or the predefined iteration limit is reached, the algorithm terminates, yielding the optimal connection weights and thresholds for the BP neural network.
1. Based on the pre-established BP neural network evaluation model, initialize PSO parameters, including population size, particle velocity range, and maximum number of iterations, to construct the PSO-BP evaluation model.
2. Randomly divide the dataset into training and testing subsets, and import them into the constructed model.
3. Begin training: calculate each particle’s fitness value via the fitness function, obtain the personal best (P-Best) and global best (G-Best) values, and update them iteratively. If the P-Best does not meet the convergence criterion within the specified accuracy, continue iterations until termination conditions are satisfied.
4. Use the final G-Best solution as the initial weights and thresholds for the BP neural network, train the model, and output the optimal prediction results.
4.3.2 Algorithm implementation and evaluation results analysis
To verify whether the prediction accuracy of the rock burst risk assessment model optimized by the particle swarm algorithm improves, the model was trained and tested using evaluation indicator data.
To ensure reproducibility and control the randomness in PSO initialization, we fixed the random seed using rng (1,2,3). We also verified with alternative seeds (4,5,6 and 7,8,9), and the accuracy variation was within ±2%. For the learning rate, we conducted controlled tests with values of 0.001, 0.01, and 0.1. Results showed that a learning rate of 0.001 led to extremely slow convergence, while 0.1 caused oscillations and divergence. A value of 0.01 achieved a balanced trade-off, enabling stable convergence to the target error within 2000 iterations. Regarding the hidden node number, comparative experiments with 5 repetitions indicated that nine nodes yielded the highest accuracy on both training and testing sets. For the PSO parameters, we tested combinations of sizepop = 3/5/10 and maxgen = 20/30/50. The setting of sizepop = 5 and maxgen = 30 was found optimal, as it consistently identified the best BP initialization while balancing accuracy and computational 14 efficiency. Increasing either population size or iterations improved accuracy but also significantly increased computation time. These experimental details have been added to the revised manuscript. A fixed inertia weight is suitable for small-sample experiments and preliminary validations, as it is easy to understand and implement. For high-dimensional problems or when more precise convergence control is required, a linearly decreasing or adaptive inertia weight strategy should be considered. Therefore, this study adopts a fixed inertia weight. To examine the sensitivity of PSO parameters, this study first conducted small-scale experiments within the range of C1, C2∈ [1,4]. The results showed that the model accuracy fluctuated between 61.9% and 80.9%, indicating that different parameter combinations had a noticeable impact on performance. Although certain settings (e.g., C1 = 2.0, C2 = 4.0) achieved relatively high accuracy, the final choice was C1 = C2 = 4.49, a parameter setting widely recommended in theory. According to the Clerc-Kennedy constriction factor theory, this configuration provides a stable balance between exploration and exploitation, preventing excessive oscillations or premature convergence under complex working conditions. Parameter configurations for the PSO-BP model are detailed in Table 4.

Table 4. Parameter settings of the PSO-BP model.
First, the dataset containing rock burst hazard assessment indicators was loaded, and a subset of the data was randomly selected as the training set, with the remaining samples used as the testing set. The testing set was further divided into 8, 14, and 21 samples, corresponding to training sets of 103, 97, and 90 samples, respectively.
Since the BP neural network is inherently sensitive to both the size and quality of the training set, an increase in the testing set size (and a corresponding reduction in the training set) inevitably affects prediction accuracy. When the prediction accuracy for all three testing scenarios exceeded 85%, it indicated that the BP neural network—after optimization—achieved a notable improvement in predictive performance.
As shown in Figure 4, the PSO-optimized BP neural network achieved 100% accuracy in predicting rock burst hazard levels. This demonstrates that the global search strategy of the PSO algorithm effectively alleviates the original BP network’s tendency to overfit the training data distribution, while also enhancing the model’s ability to identify low-probability events.
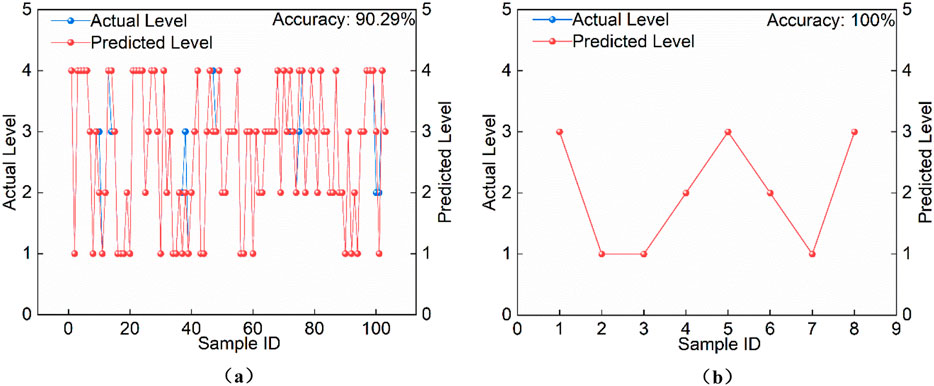
Figure 4. Training results of the PSO-BP model (testing set size: 8 samples). (a) Prediction results for the training set. (b) Prediction results for the testing set.
From Figure 5, it can be seen that although the reduction in training sample size led to a slight drop in prediction precision, only one misclassification occurred, and the model still maintained high accuracy. Specifically, when the testing set sizes were 8 samples (Figure 4), 14 samples (Figure 5), and 21 samples (Figure 6), the corresponding prediction accuracies were 100%, 92.86%, and 85.71%, respectively. As the size of the testing set increased and the training set decreased, prediction errors rose accordingly; however, overall accuracy consistently remained above 85%.
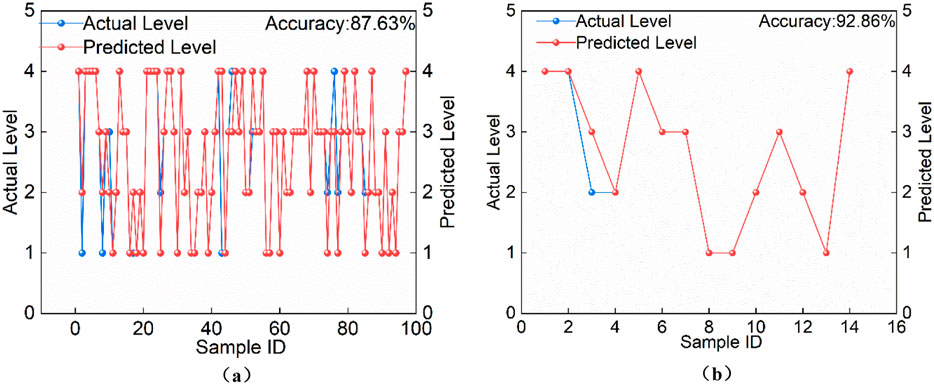
Figure 5. Training results of the PSO-BP model (testing set size: 14 samples). (a) Prediction results for the training set. (b) Prediction results for the testing set.
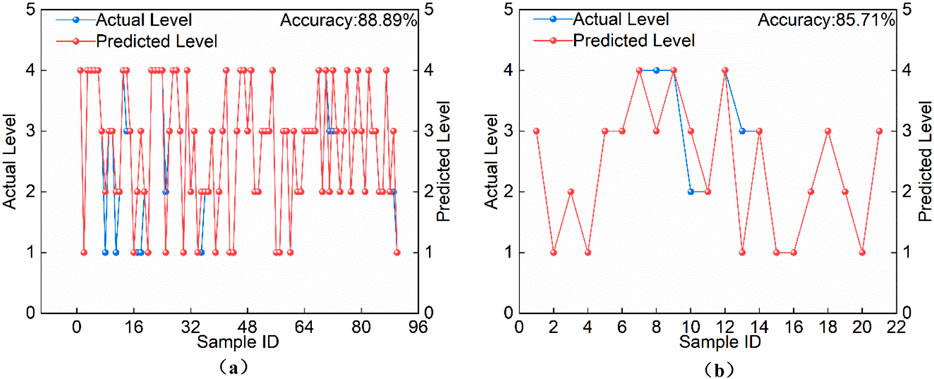
Figure 6. Training results of the PSO-BP model (testing set size: 21 samples). (a) Prediction results for the training set. (b) Prediction results for the testing set.
Figure 7 shows the confusion matrix of the prediction results for the test set when the test set size is 21 samples, the constructed model performs well overall in classifying the four categories, with an overall accuracy of about 85%. Among them, the recognition of Category 1 and Category 2 is the most effective: Category 1 achieves a recall rate of 100%, and Category 2 reaches a precision of 100%, indicating that the model can stably identify and accurately predict these two categories. In contrast, the classification performance of Category 3 and Category 4 is slightly lower. Category 3 has a precision of 75%, and Category 4 has a recall rate of 75%, suggesting that in some cases the model tends to misclassify these samples into other categories. This confusion may be related to data imbalance and insufficient feature differences between certain categories. Overall, the model can effectively distinguish the four categories, though there remains room for improvement in the classification of Category 3 and Category 4. The PSO-BP classification performance metrics are shown in Table 5. These results confirm that integrating PSO into the BP neural network effectively improves the prediction accuracy of rock burst hazard assessment models.
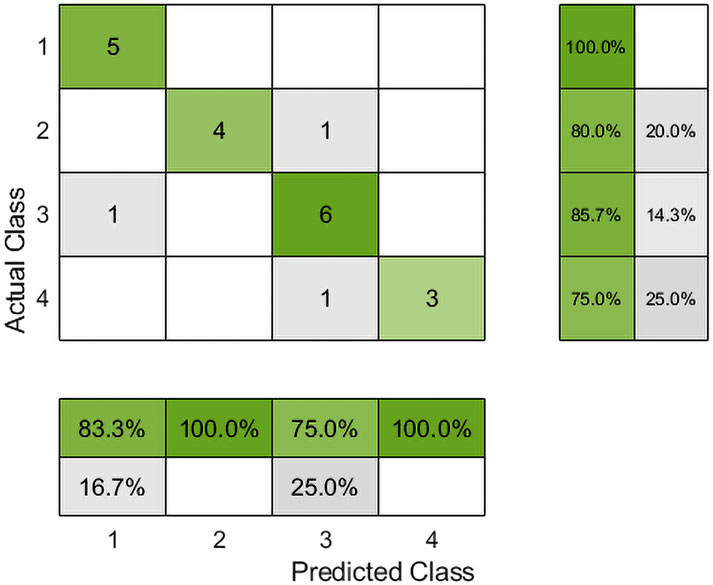
Figure 7. Confusion matrix for test data (PSO-BP).
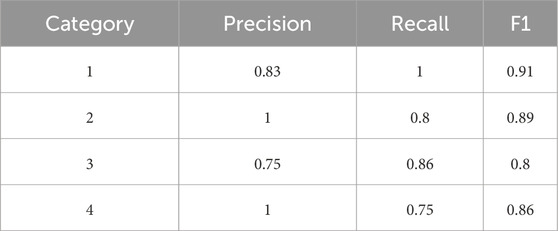
Table 5. PSO-BP classification performance metrics.
5 Engineering case study
5.1 Overview of the working face
The 224 working face is located at a coal seam depth of 508.1–647.7 m, approximately 74 m from the transportation roadway of the shallower 222 working face. Vertically above it lies the goaf of the 3–2 coal seam’s 2302 working face, which was completely mined out by 31 October 2015. The roadway layout follows a “U-shaped” configuration, consisting of a transportation roadway, a cut-through, and a return airway. Both the transportation and return roadways are arranged parallel to the coal seam’s strike.
The 224 transportation roadway lies 21–39 m vertically below and 44 m offset in parallel from the 2302 transportation roadway, while the 224 return airway is 24–37 m vertically below and 15 m offset from the 2302 return airway. The 224 working face extracts the 4–2 coal seam, which is stable, black, stratified, and classified as medium-hard coal. The seam thickness ranges from 5.6 to 14.2 m, averaging 8.2 m, with a complex internal structure containing 3–7 layers of partings. These partings are 0.3–1.0 m thick, with a high ash content at the base gradually transitioning to carbonaceous mudstone.
The immediate roof consists of dark grey to grey-black siltstone, thinly bedded, with a thickness of 3.7–38.4 m (average 21.76 m). The floor is composed of carbonaceous mudstone, gradually transitioning from the 4-2 coal seam, occasionally interbedded with dark grey siltstone, averaging 6.16 m in thickness. The coal seam’s contour lines are relatively gentle, with minor folds and synclinal structures lacking prominent axial features. Local undulations are present, but no major faults have been detected.
As mining depth has progressively increased, the 224 working face has experienced intense rock burst phenomena during both roadway excavation and production. In roadways, these manifest as localized roof falls, severe spalling, poor roadway formation, and difficulties in support installation. In the retreating working face, typical issues include severe floor heave in exposed roadways, minor sidewall deformation, and mesh-bag formation.
Rock burst incidents are more frequent in areas with dense roadways and chambers, sometimes accompanied by dynamic phenomena such as spalling of rock skin. Investigations revealed that stress concentration induced by geological structures is particularly significant in this region, with most events occurring in coal mass zones affected by folding or faulting. Abnormal stress accumulation triggers energy build-up and sudden release within the coal, greatly increasing the risk of dynamic instability in surrounding rock. Therefore, accurate rock burst hazard assessment prior to mining is critical for safe production.
5.2 Engineering application of the rock burst hazard evaluation model
This study identifies ten evaluation indicators: mining depth (Z1), coal seam dip angle (Z2), sectional coal pillar width (Z3), uniaxial compressive strength (Z4), coal mass stress (Z5), geological structure (Z6), historical rock burst occurrences at the same seam level (Z7, occurrence count), roof management conditions (Z8), stress relief from protective seam mining (Z9), and the relationship between the working face and adjacent goaf areas (Z10).
Based on drilling data, geological records, and monitoring information, six sample datasets-including the 14# drill site—were compiled as the testing set (Table 6) to verify the applicability of the model.
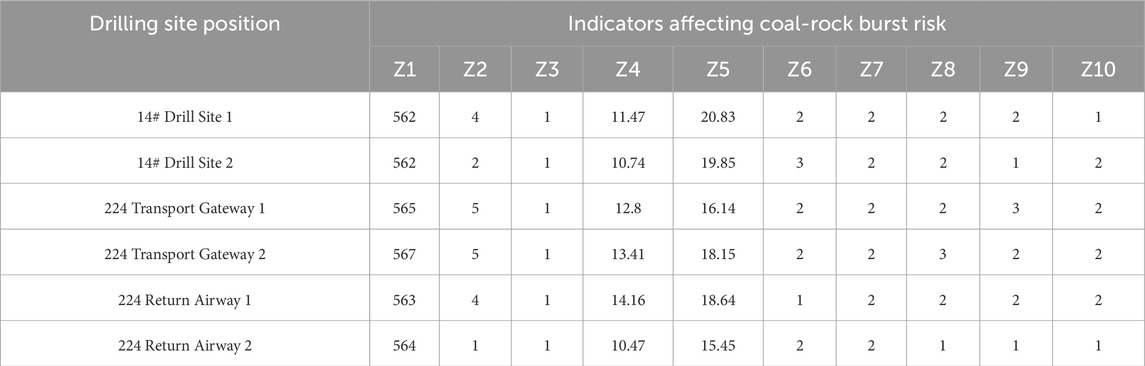
Table 6. Rock burst risk evaluation data for the 224 working face.
The selected samples were fed into the PSO-BP model for training, and the results are shown in Figure 8.
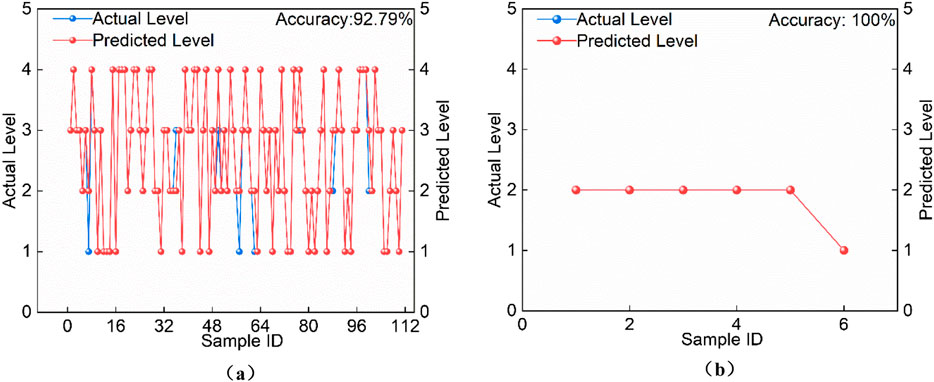
Figure 8. Rock burst risk prediction results for the 224 working face. (a) Prediction results for the training set. (b) Prediction results for the testing set.
As illustrated, the PSO-BP model provides reliable evaluations of coal–rock burst hazards, with predictions largely consistent with on-site observations, demonstrating strong engineering applicability.
From the actual field conditions, an analysis of rock burst phenomena at the six selected testing locations was conducted from three perspectives: acoustic signs, roof–floor conditions, and sidewall behavior. Prior to the occurrence of a rock burst, the internal stress within the coal–rock mass becomes sharply concentrated. The coal and rock strata often experience fracturing or rapid displacement, frequently accompanied by crisp splitting sounds; during drilling operations, muffled, thunder-like blasting noises may occasionally be heard.
As shown in Figure 9, in terms of the roof, distinct delamination can be observed along the interface between the roof and coal–rock strata. Sudden roof pressure events may occur in the working face or roadway, causing rapid roof subsidence that crushes the support structures. Regarding the sidewalls, phenomena such as coal wall spalling or bulging are commonly observed, while the floor may exhibit noticeable heaving.
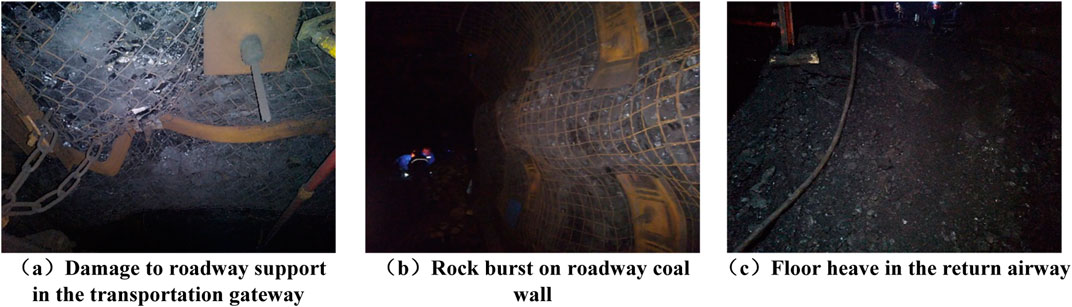
Figure 9. On-site rock burst conditions at the working face. (a) Damage to roadway support in the transportation gateway. (b) Rock burst on roadway coal wall. (c) Floor heave in the return airway.
6 Discussion
This study proposes a PSO-optimized BP neural network model for coal-rock burst risk evaluation, and its key findings and implications can be discussed as follows:
a. The PSO-BP model effectively addresses the limitations of traditional BP neural networks, such as susceptibility to local optima and slow convergence. By optimizing initial weights and thresholds through PSO’s global search capability, the model achieves higher prediction accuracy (over 85% for various test set sizes) and stronger generalization ability. This outperforms conventional methods like analytic hierarchy process (AHP), fuzzy comprehensive evaluation, and even standard BP networks, highlighting its potential for intelligent risk assessment in complex mining environments.
b. Correlation analysis identifies coal body stress as the most critical indicator (correlation coefficient = 0.76) for rock burst risk, followed by mining depth and geological structure. This aligns with field observations that high stress concentration, deep burial, and complex geological conditions are primary triggers of dynamic disasters, providing a mechanistic basis for indicator selection in risk evaluation.
c. The model’s validation in the 224 working face demonstrates good consistency between predicted results and on-site rock burst phenomena (e.g., roof delamination, floor heave, and coal wall spalling). This confirms its practical value for guiding safety measures such as pressure relief and support optimization in underground mines.
For the purpose of comparing classification predictions, the authors conducted data classification and prediction using a support vector machine, and the confusion matrix is shown in Figure 10. The classification performance for Category 1 and Category 2 is relatively weak. The main issues are that Category 1 has a relatively high missed detection rate, and Category 2 has a certain misjudgment rate during prediction.
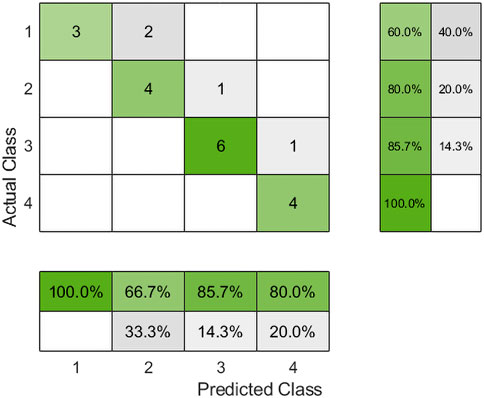
Figure 10. Confusion matrix for test data (SVM).
In this study, k-fold cross-validation, statistical significance testing, and robustness analysis were incorporated into the traditional BP network framework to comprehensively evaluate the PSO-BP model. Through 5-fold cross-validation, the PSO-BP model achieved an average accuracy of 58%–82%, outperforming the baseline BP model (48%–70%). The significance test indicated no statistical difference, which may be attributed to the limited sample size. The comparison of model accuracy under cross-validation and noise conditions is shown in Figure 11. The robustness analysis further 20 showed that, after adding Gaussian noise, the PSO-BP maintained an accuracy of 63%–71%, with only a slight decline and improved stability. These results suggest that the introduction of PSO optimization enhances both the predictive accuracy and noise resistance of the BP model, thereby supporting its applicability in challenging geological environments.
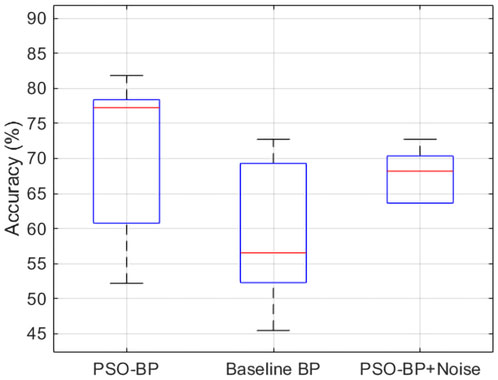
Figure 11. Comparison of model accuracy under cross-validation and noise conditions.
Although the dataset is relatively limited in size, it encompasses the mechanical properties and stress conditions relevant to coal-rock dynamic hazard risks. Nevertheless, future research should aim to expand the dataset to cover a broader range of parameter values. Although the PSO-BP model demonstrates strong performance, its generalization ability remains influenced by data diversity and distribution. The PSO-BP model shows promising performance under the tested dataset. However, broader validation on larger and independent datasets is required before recommending field deployment. Subsequent studies will emphasize dataset expansion, real-time validation, and the integration of multi-source monitoring data, aiming to further enhance the classification accuracy and robustness of the model.
In this study, several limitations of the PSO-BP model warrant reflection. First, potential bias may exist in data selection and feature design. The evaluation indicators adopted in this work were primarily derived from the geological and mining conditions of a specific coal mine, which inevitably limits the generalizability of the model. Moreover, although ten relatively comprehensive indicators were considered, other critical factors influencing rock burst hazards may have been overlooked, introducing potential feature selection bias. The PSO-BP model involves random initialization and iterative updates during the optimization process, which may lead to fluctuations in experimental results and affect reproducibility. While multiple runs and averaging were used to stabilize outcomes, ensuring complete reproducibility would require more transparent disclosure of hyperparameters and, where possible, open access to the dataset. Compared with traditional empirical criteria for rock burst assessment (e.g., critical burial depth criterion and energy index method), empirical models still offer irreplaceable advantages in terms of simplicity, interpretability, and practical applicability. This suggests that a balance must be sought between predictive performance and operational feasibility in engineering practice. Future research could explore hybrid frameworks that integrate empirical criteria with machine learning, or adopt interpretable machine learning methods to simultaneously improve accuracy and enhance practical applicability.
7 Conclusion
1. Based on a comprehensive review of existing research and documented rock burst cases, ten evaluation indicators—including mining depth and coal mass stress—were selected as key variables for coal–rock burst hazard assessment. A corresponding evaluation dataset was established, and correlation analysis revealed that coal mass stress exhibited a strong relationship with the hazard level.
2. A BP neural network model was developed for coal–rock burst hazard evaluation, with its architecture and training parameters appropriately configured. The results demonstrated that, although the BP neural network can effectively learn the mapping between input features and hazard levels, it still suffers from slow convergence and a tendency to become trapped in local optima. To enhance performance, the particle swarm optimization (PSO) algorithm was employed to optimize the initial weights and thresholds of the BP network. Experimental results showed that the PSO-BP model achieved higher prediction accuracy on both the training and testing datasets compared to the standard BP model, confirming the effectiveness of PSO in improving BP network predictive capability.
3. The PSO-BP model was applied to hazard evaluation for selected areas of the 224 working face. By optimizing the BP neural network with the particle swarm optimization algorithm, the model effectively addressed the nonlinear interactions among influencing factors in the rock burst process. It demonstrated a certain capability in distinguishing between different risk levels, and the field validation results were satisfactory.
Data availability statement
The original contributions presented in the study are included in the article, further inquiries can be directed to the corresponding author.
Author contributions
YM: Data curation, Writing – original draft, Writing – review and editing. CC: Methodology, Writing – review and editing, Investigation, Writing – original draft, Formal Analysis. XZ: Visualization, Validation, Supervision, Writing – review and editing, Investigation. CL: Supervision, Investigation, Conceptualization, Writing – review and editing, Formal Analysis. JR: Conceptualization, Methodology, Supervision, Writing – review and editing, Writing – original draft. BX: Methodology, Writing – review and editing, Formal Analysis, Data curation, Conceptualization. KW: Writing – review and editing, Writing – original draft, Conceptualization, Validation. KZ: Methodology, Formal Analysis, Writing – original draft, Writing – review and editing. PZ: Writing – review and editing, Visualization, Data curation, Project administration, Investigation. JY: Supervision, Validation, Writing – review and editing, Methodology, Conceptualization.
Funding
The author(s) declare that no financial support was received for the research and/or publication of this article.
Conflict of interest
Authors YM, XZ, CL, BX, and JY were employed by Shenmu Hongliulin Mining Co., Ltd., Shaanxi Coal Group Shenmu.
The remaining authors declare that the research was conducted in the absence of any commercial or financial relationships that could be construed as a potential conflict of interest.
Generative AI statement
The author(s) declare that no Generative AI was used in the creation of this manuscript.
Any alternative text (alt text) provided alongside figures in this article has been generated by Frontiers with the support of artificial intelligence and reasonable efforts have been made to ensure accuracy, including review by the authors wherever possible. If you identify any issues, please contact us.
Publisher’s note
All claims expressed in this article are solely those of the authors and do not necessarily represent those of their affiliated organizations, or those of the publisher, the editors and the reviewers. Any product that may be evaluated in this article, or claim that may be made by its manufacturer, is not guaranteed or endorsed by the publisher.
References
Asteris, P., Apostolopoulou, M., Armaghani, D., Cavaleri, L., Chountalas, A., Guney, D., et al. (2020). On the metaheuristic models for the prediction of cement-metakaolin mortars compressive strength. Metaheuristic Comput. Appl. 01 (01), 63–99. doi:10.12989/mca.2020.1.1.063
Asteris, P., Lemonis, M., Nguyen, T., Le, H., and Pham, B. (2021). Soft computing-based estimation of ultimate axial load of rectangular concrete-filled steel tubes. Steel Compos. Struct. 39 (04), 471–491. doi:10.12989/scs.2021.39.4.471
Asteris, P., Drosopoulos, G., Cavaleri, L., Formisano, A., Drougkas, A., Milani, G., et al. (2025). Mapping and revealing the nature of masonry compressive strength using computational intelligence. Struct. 78, 109189. doi:10.1016/j.istruc.2025.109189
Chen, G., Teng, P., Li, T., Wang, C., Chen, S., and Zhang, G. (2021). Evaluation model of rock burst in coal mine and its application. J. Taiyuan Univ. Technol. 52 (06), 966–973. doi:10.16355/j.cnki.issn1007-9432tyut.2021.06.016
Cheng, X., Qiao, W., and He, H. (2023). Study on deep learning methods for coal burst risk prediction based on mining-induced seismicity quantification. Geomech. Geophys. Geo. 9 (01), 145. doi:10.1007/s40948-023-00684-3
Fu, X., Chen, S., and Zhang, T. (2024). Prediction of rock bursts based on microseismic energy change: application of bay-esian optimization-long short-term memory combined model. Appl. Sci. 14 (20), 9277. doi:10.3390/app14209277
Ghani, S., Sapkota, S., Singh, R., Bardhan, A., and Asteris, P. (2024). Modelling and validation of liquefaction potential index of fine-grained soils using ensemble learning paradigms. Soil Dyn. Earthq. Eng. 177, 108399. doi:10.1016/j.soildyn.2023.108399
He, M., and Wang, Q. (2023). Rock dynamics in deep mining. Int. J. Min. Sci. Technol. 33 (09), 1065–1082. doi:10.1016/j.ijmst.2023.07.006
Kang, H. (2021). Seventy years development and prospects of strata control technologies for coalmine roadways in China. Chin. J. Rock Mech. Eng. 40 (01), 1–30. doi:10.13722/j.cnki.jrme.2020.0072
Le, T., Skentou, A., Mamou, A., and Asteris, P. (2022). Correlating the unconfined compressive strength of rock with the compressional wave velocity effective porosity and schmidt hammer rebound number using artificial neural networks. Rock Mech. Rock Eng. 55, 6805–6840. doi:10.1007/s00603-022-02992-8
Liao, J., Asteris, P., Cavaleri, L., Mohammed, A., Lemonis, M., Tsoukalas, M., et al. (2021). Novel fuzzy-based optimization approaches for the prediction of ultimate axial load of circular concrete-filled steel tubes. Appl. Sci. 11 (12), 629. doi:10.3390/buildings11120629
Liu, Y., Cao, A., Wang, S., Yang, Y., Guo, W., Xue, C., et al. (2022). Attenuation characteristics analysis of seismic energy and its application to risk assessment in underground coal mines. Geomat. Nat. Haz. Risk. 13 (01), 1014–1042. doi:10.1080/19475705.2022.2059018
Liu, Y., Cao, A., Wang, C., Yang, X., Wang, Q., and Bai, X. (2023). Cluster analysis of moment tensor solutions and its application to rockburst risk assessment in underground coal mines. Rock Mech. Rock Eng. 56 (09), 6709–6734. doi:10.1007/s00603-023-03388-y
Liu, G., Lei, R., Huang, L., Li, M., and Zhou, J. (2024). Study on the mining response law and coal burst risk assessment of an isolated working face. Front. Earth Sci. 12, 1487505. doi:10.3389/feart.2024.1487505
Luo, T., Fan, G., Zhang, S., Ren, S., Fan, Y., and Shen, R. (2022). A coal bump risk assessment and prediction model based on multiparameter indices. Geofluids 2022, 1–10. doi:10.1155/2022/2090809
Mahmood, W., Mohammed, A., Sihag, P., Asteris, P., and Ahmed, H. (2022a). Interpreting the experimental results of compressive strength of hand-mixed cement-grouted sands using various mathematical approaches. Arch. Civ. Mech. Eng. 22, 19. doi:10.1007/s43452-021-00341-0
Mahmood, W., Mohammed, A., Asteris, P., Kurda, R., and Armaghani, D. (2022b). Modeling flexural and compressive strengths behaviour of cement-grouted sands modified with water reducer polymer. Appl. Sci. 12 (03), 1016. doi:10.3390/app12031016
Shen, W., Dou, L., He, H., and Zhu, G. (2017). Rock burst assessment in multi-seam mining: a case study. Arab. J. Geosci. 10 (08), 196. doi:10.1007/s12517-017-2979-z
Tan, Y., Tan, Y., Guo, W., Li, B., He, S., Zhang, L., et al. (2025). Calculation model for kinetic energy and rock burst risk evaluation method during roadway excavation. Int. J. Min. Sci. Technol. 35 (05), 677–690. doi:10.1016/j.ijmst.2025.03.006
Wang, Y., Liu, L., Fu, H., and Xu, Y. (2017). Study on predicted method of mine pressure bump based on improved BP neural network. Coal Sci. Technol. 45 (10), 36–40. doi:10.13199/j.cnki.cst.2017.10.006
Wang, C., Xu, J., Li, Y., Wang, T., and Wang, Q. (2023). Optimization of BP neural network model for rock burst prediction under multiple influence factors. Appl. Sci. 13 (4), 2741. doi:10.3390/app13042741
Wojtecki, L., Bukowska, M., Iwaszenko, S., and Apel, D. (2024). Machine learning-based classification of rock bursts in an active coal mine dominated by non-destructive tremors. Appl. Sci. 14 (12), 5209. doi:10.3390/app14125209
Yin, Z., Wang, L., and Liu, Y. (2016). Prediction of rock burst based on chaos particle swarm optimization BP neural network. Coal Technol. 35 (08), 89–91. doi:10.13301/j.cnki.ct.2016.08.037
Yu, B., Yang, R., Zuo, J., and Wang, Y. (2025). A new method for multi-dimensional impact risk quantization and pressure-relief evaluation of deep rockburst mines based on FCM-EWM. Tunn. Undergr. Sp. Tech. 161, 106609. doi:10.1016/j.tust.2025.106609
Yuan, H., Ji, S., Liu, G., Xiong, L., Li, H., Cao, Z., et al. (2023). Investigation on intelligent early warning of rock burst disasters using the PCA-PSO-ELM model. Appl. Sci. 13 (15), 8796. doi:10.3390/app13158796
Yun, M., Ren, J., Zhang, L., Guo, F., and Chen, Xu. (2025). Disaster treatment and multisource monitoring of rockbursts in isolated island coal face under hard roof conditions. Sci. Rep. 15, 30739. doi:10.1038/s41598-025-15390-1
Zhang, M. (2021). Prediction of rockburst hazard based on particle swarm algorithm and neural network. Neural Comput. Appl. 34 (04), 2649–2659. doi:10.1007/s00521-021-06057-9
Zhang, K., Bai, J., Hao, Y., Li, L., Zhang, Y., Wang, X., et al. (2010). Multi-level fuzzy comprehensive evaluation on bolt support effect of seam gateway. Coal Sci. Technol. 38 (08), 10–14. doi:10.13199/j.cst.2010.08.16.zhangkx.004
Zhang, K., Kang, L., He, M., Liu, J., Cheng, Z., Sun, J., et al. (2020). Research on multi-level comprehensive evaluation of coal seam rock-burst risk in underground mine. Coal Sci. Technol. 48 (08), 82–89. doi:10.13199/j.cnki.cst.2020.08.010
Zhang, J., Xia, Q., Wu, H., Wei, S., Hu, Z., Du, B., et al. (2025). Research on rock burst prediction based on an integrated model. Sci. Rep. 15 (01), 15616. doi:10.1038/s41598-025-91518-7
Keywords: rock burst risk, BP neural network (BP), particle swarm optimization (PSO), risk evaluation, coal mine safety
Citation: Miao Y, Cai C, Zheng X, Liu C, Ren J, Xu B, Wang K, Zhang K, Zhang P and Yuan J (2025) Research on a coal-rock burst risk evaluation model based on particle swarm optimized BP neural network. Front. Built Environ. 11:1699662. doi: 10.3389/fbuil.2025.1699662
Received: 05 September 2025; Accepted: 26 September 2025;
Published: 13 October 2025.
Edited by:
Jitendra Khatti, Rajasthan Technical University, IndiaReviewed by:
Panagiotis G. Asteris, School of Pedagogical and Technological Education, GreeceFurquan Ahmad, National Institute of Technology Patna, India
Copyright © 2025 Miao, Cai, Zheng, Liu, Ren, Xu, Wang, Zhang, Zhang and Yuan. This is an open-access article distributed under the terms of the Creative Commons Attribution License (CC BY). The use, distribution or reproduction in other forums is permitted, provided the original author(s) and the copyright owner(s) are credited and that the original publication in this journal is cited, in accordance with accepted academic practice. No use, distribution or reproduction is permitted which does not comply with these terms.
*Correspondence: Jianxi Ren, cmp4MTAxOUAxMjYuY29t