 Jinhui Wang1
 Beite Li
- 1China Railway Communications Investment Group Co., Ltd., Nanning, China
- 2Guangxi China Railway Nanheng Expressway Co., Ltd., Nanning, China
- 3College of Civil Engineering and Architecture, Guangxi University, Nanning, China
Due to the influence of special geological conditions and economic factors, the construction of highways in the mountainous areas of Guangxi has employed a large number of high embankment structures. Characterized by significant settlement amounts and long settlement cycles, these high embankments are prone to issues such as cracking and uneven settlement. This study utilizes three prediction methods—exponential curve model fitting, grey system theory, and backpropagation neural network (BPNN)—to forecast the settlement of a high embankment section of a highway in Guangxi. The prediction results from these three methods are compared with actual measured values. The findings indicate that among the three methods, the BPNN achieves the best overall fitting performance; the grey system theory meets accuracy requirements while being the least affected by different spatial locations; and the exponential curve fitting method involves lower computational costs but shows greater dependence on parameter selection, yet its accuracy improves significantly as the time interval increases. The results provide a methodological basis for the settlement prediction and control of high embankments in mountainous expressways, offering practical significance for ensuring their long-term operational safety.
Highlights
• Conducted a comparative analysis of settlement predictions using multiple methods.
• Explored suitable models for predicting settlement in high embankment sections of highways.
• Innovatively applied grey system theory to the settlement prediction of high embankments.
1 Introduction
China’s vast territory means that its expressway networks inevitably traverse mountainous terrain. High embankments have become a common subgrade form in the construction of expressways in mountainous areas. Notably, extensive regions of Guangxi are characterized by karst topography. (Zhang et al., 2023), High embankments have been extensively employed in the construction of expressways in Guangxi. Currently, high embankment structures with different construction schemes commonly face challenging issues such as instability and cracking. (Zhu and Li, 2020; Xia et al., 2025; Zhang et al., 2025), therefore, effectively addressing these challenges, reducing repair costs, and ensuring road safety and smooth traffic flow have become critical issues that require urgent resolution. Accurate prediction of embankment settlement is a prerequisite that must be met to tackle this problem.
In recent years, the application of BP neural networks in the field of settlement prediction in geotechnical engineering has been continuously deepened, showing strong vitality. Its core advantage lies in the ability to adaptively adjust weights and thresholds through the backpropagation algorithm, without the need to explicitly define the constitutive relationship of the soil, thus achieving high-precision approximation of the highly nonlinear settlement-time relationship (Li et al., 2021). Especially in dealing with practical engineering problems with parameter uncertainty and complex boundary conditions, BP neural networks have demonstrated flexibility that is incomparable to traditional analytical and numerical simulation methods (Ding et al., 2023; Wei, 2023). The BP neural network can effectively calibrate soil parameters during the prediction process (Wang et al., 2007), based on in-situ measurement data from single-point settlement gauges embedded at the shoulder and center of high embankments, Yang proposed a settlement prediction method utilizing nonlinear fitting models and neural network algorithms, achieving favorable predictive outcomes (Yang et al., 2025). The use of Finite Element Models (FEM) for settlement prediction offers high accuracy and is a widely employed method. However, its drawback lies in the high computational cost involved (Huang et al., 2025). Tian integrated the use of Response Surface Methodology, Bayesian updating, and Finite Element Models to predict embankment settlement, which partially mitigated the limitations associated with Finite Element Models (Tian et al., 2023). Some scholars have also utilized 2D finite element models to investigate the settlement behavior of soft structural soils (Müthing et al., 2018). Curve fitting is also an effective method for predicting embankment settlement. This approach is straightforward to apply and requires relatively minimal data (Koslanant et al., 2025). Furthermore, Chunlin Li proposed a simplified method for predicting settlement on clay embankments in his research (Li, 2014), offering a valuable optimization to the curve fitting approach for settlement forecasting. Moreover, Liu innovatively proposed an evolutionary support vector regression approach based on an improved grey wolf optimizer for predicting high embankment settlement (Li et al., 2014). Additionally, grey system theory serves as a viable method for settlement prediction. Mao employed this theory to develop a strain prediction model for Pisha sandstone, achieving results with high accuracy and reliability. This success provides a validation for its application in predicting settlement of high embankments (Mao et al., 2025). In addition to the methods mentioned above, some scholars have also employed the Ensemble Kalman Filter (EnKF) (Tao et al., 2020) for soil settlement prediction, which also represents a potential approach for forecasting embankment settlement.
In summary, existing research has made numerous attempts in predicting embankment settlement and soil deformation, yet there remains a lack of systematic comparison among different methods. This paper takes a high embankment section of a highway in Guangxi as the study object, employing exponential curve fitting, grey system theory, and BP neural network as research methods to analyze and compare the predictive effectiveness of these approaches for high embankment settlement.
2 Methods
The road section studied in this paper is part of Guangxi’s first eight-lane, dual-direction expressway, which constitutes a key segment of the autonomous region’s planned “Horizontal 9”route. It serves as a critical link in establishing a rapid intercity corridor between Nanning and Yulin, boosting development in important towns along the route such as Hengxian, and also forms a major part of the new interprovincial passage between Guangxi and Guangdong. This study focuses on section K129 + 130 to K129 + 250 of Segment 6 of this expressway. The embankment slope at this site reaches a fill height of 40 m, meeting the definition of a high embankment. The slope angle ranges between 25° and 30°. The embankment is designed with a stepped slope, each tier having a height of 8 m. The field conditions are shown in Figure 1.
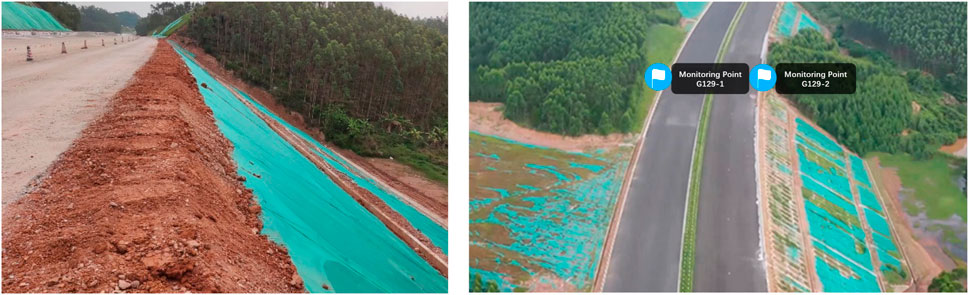
Figure 1. High embankment slope and pavement surface on site.
2.1 Settlement monitoring scheme for high embankments
The monitoring content of this study primarily includes layered settlement monitoring: the elevation of the borehole orifice at each monitoring point is set as 0 m, and the depth of each settlement ring within the settlement point is measured. Based on the initial depth of the settlement rings and their subsequent readings, the settlement amount of each ring can be calculated. To comprehensively observe the settlement behavior, two settlement monitoring points were installed at the left shoulder, and the right shoulder, labeled as G129-1 and G129-2. The distribution of the monitoring points is illustrated in Figure 2.

Figure 2. Layout of layered settlement monitoring points.
The layout of the sensing settlement rings is determined based on the length of the settlement pipe at each monitoring point. The strategy adopted is to install one sensing settlement ring every 4 m. Specifically, four settlement rings were deployed at point G129-1, and five at point G129-2. The detailed arrangement of the settlement rings is illustrated in Figure 3 (Schematic Diagram of Settlement Pipe and Sensing Settlement Rings). The parameters of each settlement monitoring point are provided in Table 1 (Description of Layered Settlement Monitoring Point Information).

Figure 3. Schematic diagram of settlement pipes and settlement inducing settlement rings.

Table 1. Information description of layered settlement monitoring points.
The layered settlement monitoring adopted in this study employed the YGK-1900 electromagnetic settlement system manufactured by Nanjing Yousi Engineering Instruments Co., Ltd. With a minimum resolution of 1 mm and a maximum measuring depth of 50 m, the instrument was produced and calibrated in accordance with the relevant provisions for deformation-monitoring instruments in the PRC standards GB/T 15406-2007 “Basic parameters and general technical conditions for geotechnical engineering instruments” and JGJ 8-2016 “Code for deformation measurement of buildings and structures.” Prior to delivery, both the probe sensitivity and the length accuracy of the measuring cable were calibrated. During field monitoring, readings were verified against the benchmark at the borehole mouth before and after every measurement to ensure the long-term stability of the measuring system.
Regarding data processing, the study followed the relevant provisions in JGJ 8-2016. Dixon’s test was applied at the 95% confidence level to identify potential outliers. Each statistically flagged value was cross-checked against the trend of adjacent data points and concurrent construction activities (e.g., rainfall, fill placement). An outlier was cautiously discarded only when it could not be explained by any known construction event and clearly violated the physical laws of soil settlement. No such outliers requiring removal were found in the present data set.
2.2 Testing of physical properties of fillers
In this study, the fill soil required for high embankments is sourced from borrow pits near high embankments in the mountainous areas of Guangxi. The main component is the weathered layer of argillaceous siltstone. In its natural state, this fill soil exhibits a typical reddish-brown color, with significant viscosity and semi-hard plastic characteristics. The fill soil also contains a small amount of gravel and rubble, accounting for approximately 14%. These fragments are mainly composed of highly weathered argillaceous siltstone, with diameters ranging from 11 to 61 mm. When the fill soil is submerged in water, it exhibits pronounced cohesive properties, its color changes to a bright red, and its cohesiveness significantly increases when the moisture content reaches a certain level.
This study evaluated the physical properties of representative fill soil in accordance with the specifications of GB/T 50123-2019 “Standard for Geotechnical Testing Methods”, and the results are shown in the Tables 2–4 below.

Table 2. Water content of soil layers at different depths of embankments.

Table 3. Basic physical performance indicators of fill soil.

Table 4. Compression coefficient and compression modulus under different moisture contents.
Meanwhile, this study also remolded these fill materials to prepare specimens with varying degrees of compaction and initial water contents for triaxial testing. The test type was consolidated-undrained (CU), and the shearing rate was 0.075 mm/min. Details and results of the test programme can be found in Table 5.

Table 5. Strength index of high embankment filler in triaxial test.
2.3 Exponential curve fitting method
When studying the prediction of soil settlement, it is necessary to conduct an in-depth analysis of the pattern of changes in the degree of soil consolidation over time. In the prediction of settlement, a time variable t is introduced, and the corresponding settlement at time t is denoted as St (Equation 1 illustrates the definition of St). The initial settlement is represented as S0. It is assumed that there is an exponential functional relationship between the average degree of consolidation and time, with the coefficients in this exponential function being denoted as a and B. Typically, a and B are coefficients influenced by the specific conditions of the engineering site, representing the impact of the on-site engineering environment on the final settlement. Based on this assumption, a mathematical formula describing the settlement at any given time t has been further derived:
Since a and S0 are both definite coefficients, we can simplify aS0 as A:
In Equation 2, there are three unknowns,
In the process of constructing the settlement prediction model, three sets of on-site settlement monitoring data with equal intervals were selected. They are marked as data points
To determine the specific values of the unknowns
Based on Equations 6–8, the specific values of the unknowns
2.4 Grey system theory
2.4.1 Data preprocessing
The GM(1,1) model, namely, the first-order single-variable prediction model in grey theory, serves as the foundation and core in the field of grey prediction (Deng and Dong, 2019; Wang et al., 2020). Its wide application goes without saying. When applying this model, the first step is to perform cumulative addition on the original data. This step not only provides key intermediate information for the modeling process but also effectively reduces the random fluctuations in the original data, thereby enhancing the stability and accuracy of the prediction results (Liu et al., 2014; Yu et al., 2015).
Suppose there are two sets of data,
The basic expression form of the GM(1,1) model is:
Let the sequence
Where, z(1)(k) is shown in Equation 13,
Then the basic form of the GM(1,1) model is shown in Equation 14:
In this paper, to accurately predict the development of post-construction settlement of high embankments, the NDGM(1,1) model in grey models is selected (Xu et al., 2025). Since the monitoring data of post-construction settlement of high embankments are often affected by various factors such as on-site conditions, it is difficult to ensure the data are read at equal time intervals, resulting in sequences with unequal time intervals. The NDGM(1,1) model is particularly good at dealing with such non-equidistant data sequences. Therefore, it can be closer to the actual engineering situation and provide more accurate predictions of high embankment settlement. Based on the GM(1,1) model, the original differential NDGM(1,1) model with unequal time intervals is further developed in this paper, in the hope of achieving more scientific and precise analysis and prediction in the field of high embankment settlement prediction.
The process of transforming a non-equidistant sequence into an equidistant sequence can be described as follows:
1. When processing the original monitoring data sequence, let the sequence be
The time interval expression for this data sequence is:
The average time interval is expressed as:
Based on the time interval Tk defined in Equation 16, a cubic spline interpolation function was used to fit the original data and generate an equidistant sequence for
To establish the DGM(1,1), the cumulative addition operation was performed on Equation 17, thereby obtaining the 1-AGO (first-order accumulated generating) time series (see Equations 19, 20):
The method of adjacent mean (MEAN) was adopted to generate a specific sequence. This sequence is obtained by calculating the average value of adjacent data points in the original data sequence (We present this sequence in Equation 21).
Where
The core of the GM(1,1) model lies in its grey differential equation, which is expressed in Equation 23:
In the GM(1,1) model, the development coefficient is a key parameter that reflects the speed and trend of system development. Additionally, the grey action quantity is also an important variable that reflects the influence of internal grey information in the system. To determine the specific values of these two parameters, the least squares method is used for precise calculation, as shown in Equations 24, 25:
From the original form of the GM(1,1) model (Equation 11), we have Equation 26.
After rearranging, we get Equations 27–29.
When constructing the original differential DGM(1,1) model, a specific prediction equation was obtained, namely, Equation 29. This equation provides a means to predict unknown data points based on model parameters and data characteristics, and it is a key component of the model application.
2. Restore
On the basis of obtaining the prediction values of the GM(1,1) model, an exponential function is used for fitting. Through the characteristics of the function, the prediction values corresponding to the original time nodes are calculated more precisely, which are the prediction results of the NGM(1,1) model, which is shown in Equation 30.
2.4.2 Interpolation error analysis
To verify the rationality of the data preprocessing steps, this paper conducted a systematic error analysis of the cubic spline interpolation method. The results show that there are reasonable differences in interpolation accuracy among different monitoring points: The Root Mean Square Error (RMSE) at point G129-1 is 1.211 mm, and the mean absolute error (MAE) is 1.035 mm; the corresponding values at point G129-2 are 3.404 mm and 2.767 mm, respectively. These differences mainly stem from the inherent characteristics of the settlement data at the two monitoring points—point G129-2 exhibits more pronounced nonlinear fluctuations during the period from day 70 to day 129, reflecting the impact of local soil inhomogeneity on the settlement process in actual engineering.
Despite the relatively higher interpolation error at point G129-2, its relative error rate of 1.792% is still far below the threshold commonly accepted in engineering practice (2%–5%). The absolute error values at both monitoring points are much smaller than the total settlement of the high embankment (178–190 mm), proving that the errors introduced by cubic spline interpolation have a negligible impact on the prediction accuracy of the subsequent NDGM(1,1) model. The error analysis of partial spline interpolation is shown in Table 6.

Table 6. Spline interpolation error analysis (partial).
2.4.3 Establishment of the NDGM(1,1) model
Settlement observation points G129-1 and G129-2 are located at the highest shoulder of the embankment, and their total settlement represents the overall settlement of the high embankment. This study uses the data from these two monitoring points to construct the NDGM(1,1) model for prediction calculations, where the settlement data from 0 to 180 days is used as the basis for modeling, and the settlement data from 196 to 254 days is used to verify the accuracy of the predictions. The settlement data obtained from points G129-1 and G129-2 are detailed in Table 7.

Table 7. Settlement data table for monitoring points G129-1 and G129-2.
The monitoring data of G129-1 and G129-2 are integrated and introduced to complete the corresponding construction of the NDGM(1,1) model. The calculation process for building the model is relatively cumbersome; Section 3.3 of Chapter 2 of this paper describes the steps for constructing this model, and this section will not elaborate on it in detail.
2.5 BP neural network method
In the structure of a neural network, there are typically input layer nodes, output layer nodes, and one or more hidden layer nodes located between them (Ji et al., 2025; Jie et al., 2025). As shown in Figure 4, this is a schematic diagram of a three-layer network architecture, which includes the input layer, hidden layer, and output layer. In this architecture, the arrows represent the paths of information flow. Each neuron is connected to all neurons in the next layer, but there are no direct connections between neurons within the same layer (Figure 5). This design ensures the layer-by-layer transmission and processing of information, enhancing the flexibility and expressive power of the network (Wang et al., 2007).

Figure 4. Topological structure of a three-layer BP network.

Figure 5. Artificial neuron model.
Relying on the BP neural network model, this study constructs a model for predicting the post-construction settlement of high embankments using MATLAB software, thereby achieving precise prediction of high embankment settlement. Taking monitoring point G129-1 as an example, before constructing the post-construction settlement prediction model, the monitoring data samples need to be converted into equidistant settlement sequences to ensure that the time intervals between each data point are consistent. This study uses interpolation and writes corresponding programs to convert the original monitoring data into equidistant sequences with a 5-day interval. A total of 51 sets of data were generated in this conversion, and the detailed data are shown in Table 8.

Table 8. Isochronal settlement sequence of post-construction settlement for G129-1.
Given the large volume and wide range of changes in the monitoring data of G129-1, normalization of the data is required to ensure the smooth progress of subsequent research. Normalization adjusts the data to the interval [0,1] to reduce the differences between data points.
In this paper, the min-max standardization method is used to normalize the sample data, with the calculation formula shown in Equation 31.
In the processing of settlement monitoring data, the concept of membership degree is introduced, which represents the result after data normalization. According to Formula 37, the monitoring data of G129-1 is normalized, and the results are shown in Table 9.

Table 9. G129-1 Normalization results of post-construction settlement data sequence.
To construct the BP network prediction model, the following steps of data selection and processing were carried out:
1. Data partitioning. The first 45 sets of data were selected from the total dataset for training the BP network prediction model; the remaining 6 sets of data were designated as validation samples to test the predictive performance of the model.
2. Construction of learning samples. In accordance with the temporal sequence, five consecutive data points were selected from the training samples, with the first four data points forming the input sample and the last data point serving as the desired output. In this way, 41 effective learning samples can be constructed from the 45 training samples, as detailed in Table 10.

Table 10. G129-1 forecast samples.
To construct the post-construction settlement prediction model for high embankments, this study, based on the obtained data samples and relevant literature, determined the following neural network structure parameters and training methods:
2.5.1 Network structure
Input layer: Contains 4 input vectors, responsible for receiving and processing raw data; Hidden layer: Composed of 6 neurons, used to capture and process the complex relationships of the input data; Output layer: Contains 1 neuron, responsible for producing the final prediction output.
The number of input-layer nodes is dictated by the underlying principle of the forecasting model. This study adopts a time-series approach: historical settlement records are used to predict the settlement at the next time step. Specifically, five consecutive settlement readings are employed—the first four serve as inputs to capture the trend, while the fifth acts as the desired output. Consequently, the input layer is fixed at four nodes.
The number of hidden-layer nodes was chosen by combining an empirical heuristic with trial-and-error evaluation. Following the widely used architectural rule of thumb proposed by Yang (Yang et al., 2025) and Yuan (Yuan et al., 2023), N =
2.5.2 Transfer functions
The hidden layer uses the logsig logarithmic S-shaped transfer function, which helps the model deal with nonlinear relationships; The output layer uses the purelin linear transfer function to ensure the continuity and accuracy of the output.
2.5.3 Training function and parameters
The training function uses the trainlm function, which is suitable for medium and small networks and has a faster convergence speed. The maximum number of iterations for the network is set to 1,000 to ensure that the model has enough opportunities to find the optimal solution; The network training target error is set to 10^-5 to ensure the prediction accuracy of the model.
2.5.4 Model training and verification
Train the network with the obtained input vectors until the training target is met or the maximum number of iterations is reached; After training, input all sample data into the network to evaluate the model’s generalization ability; Input the defined verification vectors into the network to obtain the predicted values of the post-construction settlement of the high embankment.
3 Results
3.1 Settlement monitoring data analysis
Since the completion of the embankment filling project and the initiation of the monitoring program in April 2022, through to its conclusion in December of the same year, continuous monitoring was conducted for a period of 8 months. For the original data of stratified settlement monitoring at the settlement monitoring points G129-1 to G129-2, detailed information can be found in Tables 11, 12.
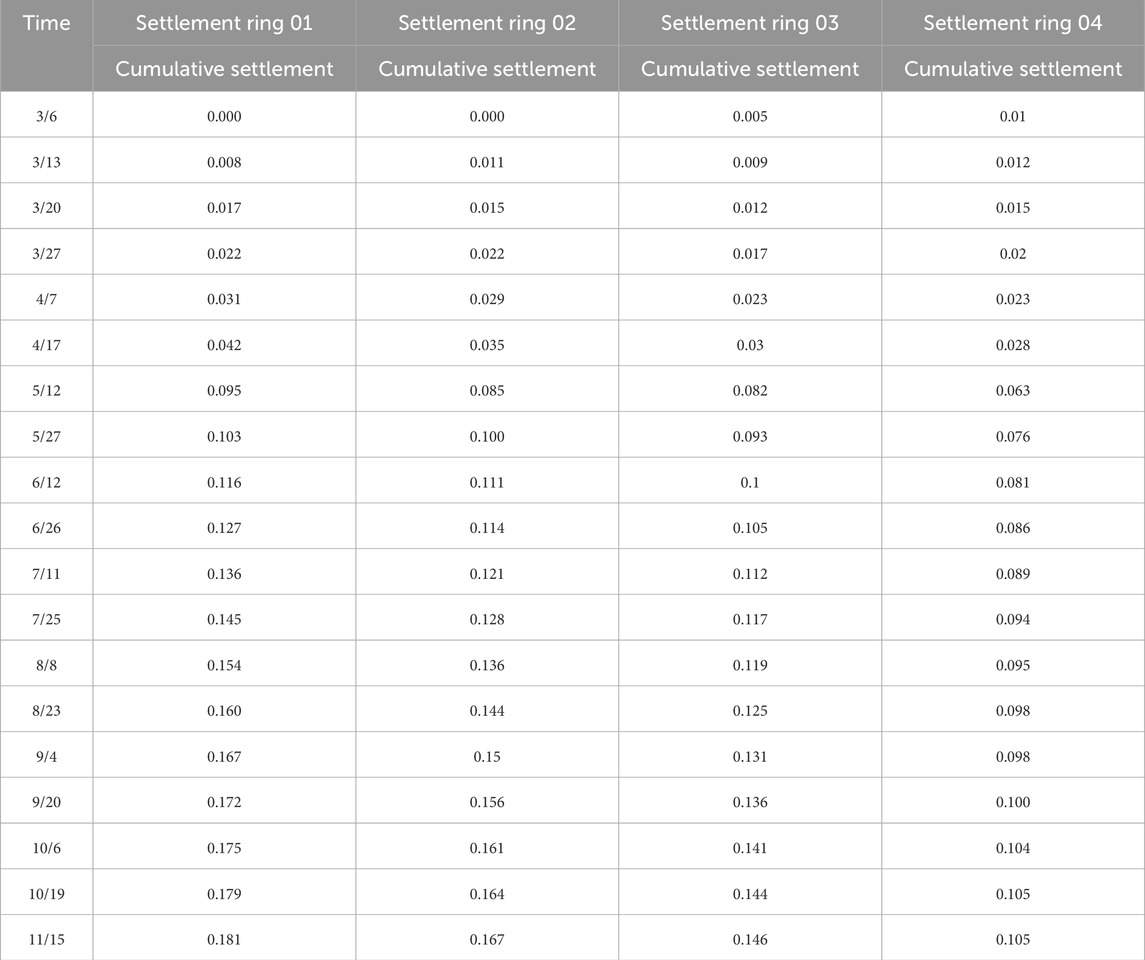
Table 11. G129-1 Original data of stratified settlement monitoring.

Table 12. G129-2 stratified settlement monitoring raw data.
Since monitoring points G129-1 and G129-2 are both located at the top of the embankment, the cumulative settlement recorded by Settlement Ring 01 at points G129-1 and G129-2 can be considered as the total settlement of the entire high embankment. Figure 6 clearly shows the cumulative settlement data of each monitoring point at the end of the monitoring period.

Figure 6. Cumulative settlement of monitoring points.
According to the data shown in Figure 6, within the 8 months after construction, the cumulative total settlement of the high embankment road surface ranged from 178 to 189 mm, and the differential settlement of the road surface was 11 mm. This result complies with the settlement standards of relevant specifications.
3.2 Analysis of prediction accuracy of settlement using exponential curve fitting
When using the exponential curve method to predict the post-construction settlement of high embankments, it is necessary to collect three sets of data with equal time intervals, and the time interval is crucial for the accuracy of the prediction (Se et al., 2025). However, under on-site conditions, it is difficult to ensure exactly the same time intervals, and it is hard to find completely consistent data in practice. It is possible to approximately select three sets of data with similar time intervals as a substitute, and since the time intervals of these data are small, they are still suitable for prediction studies. This section will use
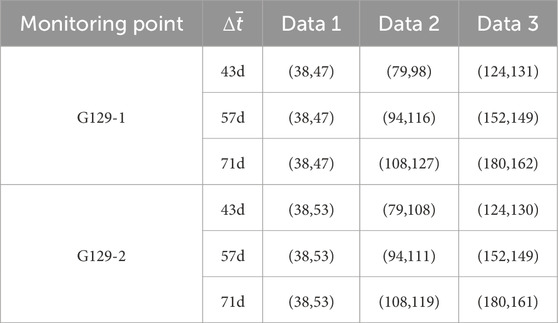
Table 13. Selection of exponential curve approximation samples.
The selected data samples were calculated and analyzed, and the parameters of the exponential curve prediction model are shown in Table 14.

Table 14. Parameters of the exponential curve forecasting model.
Using the obtained exponential curve model, the settlement of the high embankment from 196 to 254 days after construction was predicted. A detailed analysis of the prediction error can be found in Table 15, and the prediction results are shown in Figure 7.

Table 15. Precision analysis of curve method forecast model.

Figure 7. Exponential Curve Method Forecasting Effect Diagram (a) G129-1, (b) G129-2.
According to the data analysis in Table 15 and Figure 7, the exponential curve fitting method shows significant sensitivity to time intervals in the settlement prediction at monitoring points G129-1 and G129-2, and its prediction accuracy is significantly affected by the average time intervals of the data samples. The results clearly demonstrate that increasing the average time interval has a significantly positive impact on prediction accuracy. However, the marginal benefit of this improvement diminishes. Taking monitoring point G129-1 as an example, when the average time interval is set to 43 days, the prediction error is roughly stable within a range of −7%; however, when the average time interval increases to 57 days and 71 days, its prediction curves almost completely coincide, showing excellent predictive performance, with errors reduced to about 2%, fully meeting the expected accuracy requirements. On the other hand, for monitoring point G129-2, with an average time interval of 43 days, the prediction error exceeded −6.88%. But as the average time interval increased to 57 days and 71 days, the prediction curves also showed a high degree of coincidence, demonstrating excellent predictive effects, with errors stably controlled at around −2.5%, also achieving the expected accuracy standards.
3.3 Analysis of prediction accuracy of grey system theory
Using the established NDGM(1,1) model, the settlement of monitoring points G129-1 and G129-2 from day 196 to day 254 was predicted. The model’s accuracy was evaluated against the criteria listed in Table 16; the prediction results and their precision are reported in Table 17, and the predictive performance is illustrated in Figure 8.

Table 16. Reference standards for model accuracy inspection.

Table 17. Analysis of prediction accuracy based on grey system theory.

Figure 8. Predicted settlement curves based on grey system theory: (a) G129-1, (b) G129-2.
At monitoring point G129-1, the NDGM(1,1) model achieved an average relative error (a) of 0.62%, a mean-square-error ratio (C) of 0.13, and a small-error probability (P) of 0.97. The corresponding values for G129-2 are a = 1.03%, C = 0.17, and P = 0.95. According to the grey-model accuracy standards, both points reach Grade I (excellent) precision (C < 0.35 and P ≥ 0.95). It is noteworthy that G129-2 exhibits a peak prediction deviation on day 226 (measured 189 mm, predicted 180 mm, error 4.76%). This anomaly is likely caused by local soil heterogeneity or construction disturbances, underscoring the influence of dynamic engineering factors on the model. It may also be attributed to early mutation signals (e.g., a settlement rate >2.0 mm/d around day 50). Despite this outlier, the model overall demonstrates excellent robustness to initial conditions and reliable short-term extrapolation, still satisfying engineering accuracy requirements.
The outstanding prediction results at both monitoring points fully confirm that the established NDGM(1,1) model is highly accurate and trustworthy. It not only closely matches the post-construction settlement characteristics of the high embankment in Section 6 of the Hengzhou-Nanning Expressway in Guangxi but also, by accounting for the region’s unique geological conditions, effectively predicts future post-construction settlement of high embankments in this area, thereby providing strong technical support for related engineering projects.
In summary, the application of grey system theory to predicting post-construction settlement of high embankments highlights both its distinctive strengths and inherent limitations. Its principal advantages lie in its ability to effectively handle incomplete and uncertain information, its suitability for small-sample datasets, its computational efficiency, and its generally high prediction accuracy—especially when the data exhibit monotonic trends. Nevertheless, the theory also suffers from drawbacks such as limited predictive performance for fluctuating or anomalous data, potential degradation of accuracy in medium-to long-term forecasting, and sensitivity to the quality of the original data.
3.4 Analysis of settlement prediction accuracy using BP neural network method
Following the procedure outlined in Section 3.4, this paper developed a post-construction settlement prediction model based on neural networks, which was subsequently trained and validated. The predicted post-construction settlement values for the high embankment are presented in Table 18, and the corresponding prediction curves are shown in Figure 9.

Table 18. Accuracy analysis of the BP neural network prediction model.

Figure 9. BP model prediction plots: (a) G129-1, (b) G129-2.
As shown by the comparison in Table 18 and Figure 9, the BP neural network delivers excellent predictions at the beginning of the forecasting period; however, the model error accumulates markedly over time. By day 255, the predicted settlement at G129-1 deviates −1.21% from the measured value, while the deviation at G129-2 widens to −2.68%. This progressive error growth is closely linked to the soil behavior revealed by the multi-level settlement monitoring data. Beyond soil behavior, the error accumulation highlights a limitation in the network’s extrapolation capability. Its architec ture, optimized for the predominant trends in the training set, struggled to fully adapt to the asymptotic settlement phase, which was less represented in the data. At G129-2, the deep settlement rings (rings 04 and 05) continue to compress, indicating ongoing delayed consolidation of the deeper strata; the BP model is insufficiently sensitive to this nonlinear deformation, resulting in a lagged prediction. In contrast, at G129-1 all soil layers have essentially stabilized (Table 11 shows that after 19 October the changes in rings 01–04 are ≤0.004 mm), so the model achieves higher accuracy at this point. Nevertheless, the overall performance of the BP neural network remains outstanding: for both G129-1 and G129-2, the residuals between predicted and measured settlements are within ±5 mm, and the relative errors are within ±3.0%.
For monitoring point G129-1, the prediction residuals range from −0.7 mm to −2.2 mm, corresponding to relative errors of −0.40% to −1.21%. The BP model thus delivers excellent accuracy, fully meeting the required precision standards. At G129-2, residuals range from −1.2 mm to −5.1 mm, with relative errors from −0.67% to −2.68%. Although the accuracy is slightly lower than at G129-1, it still satisfies the established precision criteria.
Based on the preceding analysis, the BP neural network model demonstrates superior predictive capability for post-construction settlement of the high embankment in Section 6 of the Nanning–Hengxian Expressway, Guangxi. The model accurately reproduces the complex, dynamic characteristics of post-construction settlement in this region. Confronted with Guangxi’s diverse and intricate geological conditions, the BP network’s strength lies in its ability to directly handle highly variable settlement data, deliver high-accuracy forecasts (Liu et al., 2024), and exhibit excellent generalization, adapting readily to different geological settings and construction environments (Shen et al., 2016; Feng and Zhang, 2022). Nevertheless, its limitations must also be recognized: training is time-consuming; the model offers limited interpretability of the results; it imposes stringent requirements on the training dataset; and selection of network architecture and hyper-parameters remains largely empirical.
3.5 Comparison of settlement prediction accuracy and method evaluation
In the preceding sections, the exponential-curve fitting method, grey system theory, and BP neural network were employed—using field monitoring data—to predict the post-construction settlement of a high embankment on an expressway in Guangxi, and the prediction accuracy of each approach was thoroughly analyzed. To provide a more intuitive comparison and objective assessment of these methods, this study adopts the Root Mean Square Error (RMSE) and the mean absolute percentage error (MAPE) as quantitative metrics, while also summarizing the residual and error analyses of the aforementioned prediction methods in Table 19. The calculation formulas are presented in Equations 32, 33.

Table 19. Accuracy comparison of different prediction methods.
In the above formula,
RMSE and MAPE are statistical metrics commonly used to quantify the accuracy of prediction models by measuring the discrepancy between predicted and observed values. As shown in the table above, the BP neural network demonstrates superior nonlinear modeling capability in complex scenarios, delivering overall satisfactory performance under both RMSE and MAPE criteria. Although the exponential-curve method performs well when A = 71 D, its predictive accuracy is highly sensitive to the chosen time interval; when the interval is short, its results become less reliable. While the exponential-curve results illustrate that parameter tuning can significantly improve traditional models, the practical value diminishes as A increases. Consequently, an appropriate time interval must be carefully selected when applying this method.
The data in the table also reveal notable spatial heterogeneity: predictions at monitoring point G129-1 are consistently more accurate than those at G129-2. This discrepancy may stem from differing topographic conditions or from difficulties in ensuring uniform compaction of the subgrade during construction. Despite these site-specific variations, the BP neural network performs well at both locations under the RMSE and MAPE criteria. Across all methods investigated, MAPE remained below 10%, whereas the RMSE for some approaches was relatively large. Among the prediction techniques examined, although grey system theory does not yield the smallest RMSE or MAPE values, the RMSE and MAPE figures it produces for different monitoring points exhibit strong consistency. This suggests that grey system theory is more robust against spatial variability and has considerable practical potential for settlement prediction in engineering applications.
4 Conclusion
In this study, the settlement of a high embankment was calculated using the exponential-curve fitting method, grey system theory, and BP neural network, and the results were compared with field monitoring data. The following conclusions are drawn:
1. The predictive performance of the exponential-curve method is closely tied to the length of the average time interval; extending this interval improves accuracy. The study shows that when the average interval reaches 71 days, the prediction error is confined to the range of 0.20 %–1.16%.
2. Predictions from the NDGM(1,1) model in grey system theory are slightly lower than the observed values. Residuals remain within 6–9 mm, and the relative error stays between 3.55% and 4.02%, demonstrating excellent predictive accuracy. Moreover, compared with other models, the grey-system fitting approach is less affected by spatial variability.
3. The BP neural-network model produced predictions that closely matched the measured data, with residuals confined to ±5 mm and relative errors within ±2.68%, demonstrating superior predictive performance. Compared with other methods, the BP neural network not only delivers higher accuracy but also operates under less restrictive conditions, offering broader applicability for effectively forecasting post-construction settlement of high embankments.
In summary, the practical application of these three settlement prediction methods can be strategically matched according to the data conditions and accuracy requirements of different engineering stages. The exponential curve method is easy to calculate and can serve as an effective tool for quick preliminary evaluation during construction. The grey system theory demonstrates remarkable robustness, especially suitable for the early operation stage when monitoring data is scarce, and it can provide reliable medium and long-term predictions with the minimum data input. After a large amount of settlement data has been accumulated in the operation stage, the BP neural network becomes the most powerful choice, providing the highest prediction accuracy for precise long-term settlement forecasting. Therefore, the selection of the prediction model can be based on the specific project stage, flexibly utilizing the unique advantages of each method.
Future work will focus on developing intelligent prediction models that adequately account for typical geological features of karst areas, including groundwater fluctuations and underlying fissures. The ultimate goal is to advance settlement prediction from post-construction analysis to pre-construction guidance. By deeply integrating predictive outcomes with engineering practices such as dynamic design and ground improvement techniques like optimized drainage and targeted grouting, we aim to directly apply these results to guide construction decisions and risk control, thereby enhancing the precision and safety of engineering projects.
Data availability statement
The original contributions presented in the study are included in the article/supplementary material, further inquiries can be directed to the corresponding author.
Author contributions
JW: Investigation, Writing – original draft, Funding acquisition, Resources, Software. GL: Data curation, Formal Analysis, Funding acquisition, Methodology, Project administration, Resources, Supervision, Validation, Visualization, Writing – original draft. AS: Supervision, Validation, Visualization, Writing – review and editing, Funding acquisition, Resources, Software. SW: Funding acquisition, Resources, Software, Supervision, Validation, Visualization, Writing – review and editing. BL: Conceptualization, Data curation, Formal Analysis, Investigation, Methodology, Supervision, Validation, Visualization, Writing – original draft, Writing – review and editing. TY: Writing – original draft, Writing – review and editing, Conceptualization, Investigation, Software, Supervision, Visualization.
Funding
The author(s) declare that financial support was received for the research and/or publication of this article. This research was supported by the National Natural Science Foundation of China (NO. 52368058).
Conflict of interest
Authors JW and GL were employed by China Railway Communications Investment Group Co., Ltd.
Authors AS and SW were employed by Guangxi China Railway Nanheng Expressway Co., Ltd.
The remaining authors declare that the research was conducted in the absence of any commercial or financial relationships that could be construed as a potential conflict of interest.
Generative AI statement
The author(s) declare that no Generative AI was used in the creation of this manuscript.
Any alternative text (alt text) provided alongside figures in this article has been generated by Frontiers with the support of artificial intelligence and reasonable efforts have been made to ensure accuracy, including review by the authors wherever possible. If you identify any issues, please contact us.
Publisher’s note
All claims expressed in this article are solely those of the authors and do not necessarily represent those of their affiliated organizations, or those of the publisher, the editors and the reviewers. Any product that may be evaluated in this article, or claim that may be made by its manufacturer, is not guaranteed or endorsed by the publisher.
References
Deng, M. X., and Dong, Y. L. (2019). “Application of improved Grey GM (1,1) model in power prediction of wind farm,” in 31st Chinese control and decision conference (CCDC), 3764–3769.
Ding, Y., Hang, D., Wei, Y. J., Zhang, X. L., Ma, S. Y., Liu, Z. X., et al. (2023). Settlement prediction of existing metro induced by new metro construction with machine learning based on SHM data: a comparative study. J. Civ. Struct. Health Monit. 13 (6-7), 1447–1457. doi:10.1007/s13349-023-00714-4
Feng, L., and Zhang, L. (2022). Enhanced prediction intervals of tunnel-induced settlement using the genetic algorithm and neural network. Reliab. Eng. & Syst. Saf. 223, 108439. doi:10.1016/j.ress.2022.108439
Huang, S., Huang, J., Kelly, R., Jonse, M., Wong, P., Yuen, S., et al. (2025). Efficient class C prediction of PVD-Improved soft clay settlements. Eng. Geol. 346, 107903. doi:10.1016/j.enggeo.2024.107903
Ji, H., Zhang, X., Wang, T., Yang, K., Jiang, J., and Xing, Z. (2025). Oil spill area prediction model of submarine pipeline based on BP neural network and convolutional neural network. Process Saf. Environ. Prot. 199, 107264. doi:10.1016/j.psep.2025.107264
Jie, P., Zhou, Y., Zhang, Z., and Wei, F. (2025). Heating energy consumption prediction based on improved GA-BP neural network model. Energy 328, 136392. doi:10.1016/j.energy.2025.136392
Koslanant, S., Sakulsaksri, C., Boonyong, C., and Tanseng, P. (2025). Observational techniques by curve fitting for predicting radial consolidation settlement. Proc. Institution Civ. Eng. - Ground Improv. 178 (2), 163–176. doi:10.1680/jgrim.24.00047
Li, C. (2014). A simplified method for prediction of embankment settlement in clays. J. Rock Mech. Geotechnical Eng. 6 (1), 61–66. doi:10.1016/j.jrmge.2013.12.002
Li, P. P., Li, J. P., Liu, G. Y., and Zhou, P. (2014). “Prediction of dredged soil settlement based on improved BP neural network,” in 5th GeoShanghai international conference.
Li, G. H., Han, C. Y., Mei, H., and Chen, S. (2021). Application of the WNN-based SCG optimization algorithm for predicting soft soil foundation engineering settlement. Sci. Program. Appl. 2021 (11), 1–13. doi:10.1155/2021/9936285
Liu, J., Xiao, X., Guo, J., and Mao, S. (2014). Error and its upper bound estimation between the solutions of GM(1,1) grey forecasting models. Appl. Math. Comput. 246, 648–660. doi:10.1016/j.amc.2014.08.049
Liu, D., Zhang, W., Tang, Y., Xie, B., Shi, Q., and Cao, K. (2024). Evolving support vector regression based on improved grey wolf optimization for predicting settlement during construction of high-filled roadbed. Transp. Geotech. 45, 101233. doi:10.1016/j.trgeo.2024.101233
Mao, X., Hu, Y., Wu, Q., Cai, P., Wang, Y., and Lei, X. (2025). Study on prediction model of cumulative plastic strain of pisha sandstone based on grey systems theory. Soil Dyn. Earthq. Eng. 190, 109205. doi:10.1016/j.soildyn.2024.109205
Müthing, N., Zhao, C., Hölter, R., and Schanz, T. (2018). Settlement prediction for an embankment on soft clay. Comput. Geotechnics 93, 87–103. doi:10.1016/j.compgeo.2017.06.002
Se, H., Song, K., Jiang, J., Sun, C., Hu, Y., Wang, B., et al. (2025). A robust and fast odor detection method with remaining response curve forecasting. Sensors Actuators A Phys. 386, 116302. doi:10.1016/j.sna.2025.116302
Shen, Q., Li, Y., and Peng, C. L. (2016). “Analysis and prediction of soft foundation settlement for expressway based on BP neural network,” in International conference on architectural engineering and civil engineering (AECE), 274–277.
Tao, Y., Sun, H., and Cai, Y. (2020). Predicting soil settlement with quantified uncertainties by using ensemble Kalman filtering. Eng. Geol. 276, 105753. doi:10.1016/j.enggeo.2020.105753
Tian, H., Li, D.-Q., Cao, Z.-J., and Du, W. (2023). Auxiliary Bayesian updating of embankment settlement based on finite element model and response surface method. Eng. Geol. 323, 107244. doi:10.1016/j.enggeo.2023.107244
Wang, Z.-l., Li, Y.-c., and Shen, R. F. (2007). Correction of soil parameters in calculation of embankment settlement using a BP network back-analysis model. Eng. Geol. 91 (2), 168–177. doi:10.1016/j.enggeo.2007.01.007
Wang, Z.-X., Wang, Z.-W., and Li, Q. (2020). Forecasting the industrial solar energy consumption using a novel seasonal GM(1,1) model with dynamic seasonal adjustment factors. Energy 200, 117460. doi:10.1016/j.energy.2020.117460
Wei, L. Y. (2023). Research on settlement prediction of building foundation in smart city based on BP network. Int. J. Adv. Comput. Sci. Appl. 14 (6), 876–884. doi:10.14569/ijacsa.2023.0140693
Xia, B., Zheng, G., Zhou, H., and Diao, Y. (2025). Failure mechanisms and characteristics of high-filled embankments with different types of basal reinforcement. Transp. Geotech. 51, 101528. doi:10.1016/j.trgeo.2025.101528
Xu, Y., Wang, Y., and Pan, Y. (2025). Prediction of China’s unconventional natural gas production based on grey waveform prediction model and non-homogeneous exponential discrete model. Energy Rep. 13, 2829–2843. doi:10.1016/j.egyr.2025.02.012
Yang, E., Wang, K., He, J., Liu, K., Wang, J., Zhang, H., et al. (2025). Settlement prediction of a high embankment based on non-linear regression and neural network algorithm. Transp. Geotech. 50, 101443. doi:10.1016/j.trgeo.2024.101443
Yu, Z., Yang, C., Zhang, Z., and Jiao, J. (2015). Error correction method based on data transformational GM(1,1) and application on tax forecasting. Appl. Soft Comput. 37, 554–560. doi:10.1016/j.asoc.2015.09.001
Yuan, Z., Gao, L., Chen, H. J., and Song, S. (2023). Study on settlement of self-compacting solidified soil in foundation pit backfilling based on GA-BP neural network model. Buildings 13 (8), 2014. doi:10.3390/buildings13082014
Zhang, B., Hou, H., Liu, L., Huang, Z., and Zhao, L. (2023). Spatial prediction and influencing factors identification of potential toxic element contamination in soil of different karst landform regions using integration model. Chemosphere 327, 138404. doi:10.1016/j.chemosphere.2023.138404
Zhang, S., Wang, Y., Zeng, L., Luo, J., Wang, J., Dong, T., et al. (2025). Long-term deformation rules of railway embankments in permafrost regions: classification and prediction. Cold Regions Sci. Technol. 231, 104425. doi:10.1016/j.coldregions.2025.104425
Keywords: high embankment, settlement prediction, curve prediction method, grey system theory, BP neural network
Citation: Wang J, Liao G, Shen A, Wang S, Li B and Yan T (2025) Study on settlement prediction methods for high embankments in mountainous areas. Front. Built Environ. 11:1702533. doi: 10.3389/fbuil.2025.1702533
Received: 10 September 2025; Accepted: 21 October 2025;
Published: 02 December 2025.
Edited by:
Wei Guo, Tianjin University, ChinaReviewed by:
Weibin Chen, University of Macau, ChinaBinhui Ma, Hunan University of Science and Technology, China
Copyright © 2025 Wang, Liao, Shen, Wang, Li and Yan. This is an open-access article distributed under the terms of the Creative Commons Attribution License (CC BY). The use, distribution or reproduction in other forums is permitted, provided the original author(s) and the copyright owner(s) are credited and that the original publication in this journal is cited, in accordance with accepted academic practice. No use, distribution or reproduction is permitted which does not comply with these terms.
*Correspondence: Beite Li, MjQxMDMwMjAyOEBzdC5neHUuZWR1LmNu