 Qiang Qin1*
 Zhiying Yang
- 1Shandong Hi-Speed Road and Bridge International Engineering Co., Ltd., Jinan, Shandong, China
- 2School of Energy and Electrical Engineering, Chang’an University, Xi’an, China
Introduction: Local scour at bridge piers is a primary cause resulting bridge failure, a risk that is significantly exacerbated under extreme hydrodynamic events such as floods.
Methods: This study presents a numerical investigation of the scour behavior around a complex bridge pier, consisting of a pier, pile cap, and pile group, focusing on the effect of pile cap embedment depth on the flow field and scour characteristics. A three-dimensional numerical model was developed based on a railway bridge, simulating scour processes under flow velocities of 4.0 m/s and 6.0 m/s.
Results and discussion: The results reveals that the relative embedment depth of the pile cap significantly influences the scour characteristics. When the pile cap is above the riverbed, the scour area predominantly develops in the longitudinal direction (along the flow), forming an inverted cone shape. Conversely, when the pile cap is embedded in the riverbed, both the scour extent and depth decrease significantly, with the scour predominantly concentrated on either side of the pile cap in a round end distribution. Furthermore, the maximum scour depth follows a nonlinear trend, initially increasing and then decreasing as the pile cap’s elevation decreases. The maximum scour depth occurs when the pile cap is flush with the riverbed, while a significant reduction in scour depth is observed when the cap is fully embedded. The findings of this study provide practical guidance for the anti-scour design of bridge complex piers.
1 Introduction
Scour around bridge foundations is a leading cause of bridge failures (Aashto, 2012; Chavan et al., 2021), with its severity often exacerbated under extreme hydrological conditions, such as floods. A notable historical example occurred in 1956 at the Zhengzhou Yellow River Bridge in China, where the first flood peak caused a local scour depth of 8 m at Pier No. 7. Subsequent flood peaks deepened the scour at Pier No. 11–14 m, ultimately causing severe tilting of the piers (Liu, 2010). Statistical analyses further highlight the importance of scour. Xiong et al. (2021) examined 1,716 bridge collapses worldwide from 1807 to 2021 and found that hydrological disasters were responsible for 46.69% of these failures, with 31.53% directly attributable to scour. Similarly, a study by Montalvo and Cook (2018) of 428 bridge failures in the United States (1992–2014) identified 237 cases related to scour issues at bridge piers. In India, flood-induced scour accounted for 52% of the 2010 recorded bridge collapses from 1977 to 2017 (Tan et al., 2020). As large-span bridges continue to be constructed globally, the majority are supported by complex piers, which include pier, pile cap, and pile groups. As a result, scour at complex piers has become a critical concern, threatening the structural integrity and safety of bridges. Given the complexity of these pier systems and the potential impact of extreme hydrological events, comprehensive research on flood-induced scour at complex piers is essential for advancing bridge design, construction, and maintenance strategies.
Scour around piers is a complex hydrodynamic phenomenon involving intricate interactions among water flow, sediment, and structural elements, governed by coupled hydrodynamic processes and sediment transport mechanisms (Wei et al., 2021a). Extensive experimental and numerical studies on cylindrical pier (Xu, 2018; Han, 2010; Wang, 2020; Zhu and Liu, 2011; Zhao et al., 2010) have been conducted to better understand the scour mechanisms. These studies show that as water flows past a cylindrical pier, it induces complex flow phenomena, including the formation of horseshoe vortices upstream, flow acceleration around the pier, and wake vortices downstream. These intricate flow structures significantly increase local bed shear stress, leading to the entrainment and downstream transport of sediment particles, ultimately resulting in the formation of scour holes around the pier foundation (Zhao, 2023).
Following investigations into the scour mechanisms of cylindrical piers, researchers have also demonstrated that scour behavior exhibits considerable variability across different scenarios, primarily influenced by varying hydrodynamic conditions, riverbed sediment characteristics, and the geometry of the pier itself. To address this complexity, researchers have extensively investigated single piers’ scour under various hydrodynamic regimes, including steady currents (Ma, 2018; Wang, 2020; Wang et al., 2020; Wei et al., 2021b), pure waves (Gong et al., 2024; Cheng et al., 2019), and combined wave-current conditions (Fu et al., 2024; Qi and Gao, 2014; Lyu et al., 2021; Li et al., 2021). In addition, the pivotal role of sediment characteristics has been explored in numerous studies (Breusers et al., 1977; Xiang et al., 2023), focusing on how factors such as sediment particle size distribution, uniformity, and cohesiveness influence local scour processes. In addition, research has also focused on the geometry of the single pier. Studies by Diab et al. (2010), Khan et al. (2017), and Bordbar et al. (2021) have explored the flow field characteristics and local scour morphology for various pier cross-sectional shapes, including square, diamond, and circular configurations. Their findings consistently show that the flow patterns around piers, and consequently the scour morphology, vary significantly with different cross-sectional geometries. Hassanzadeh et al. (2020) demonstrated that the bluntness coefficient of the pier cross-section significantly influences both the upstream flow structure and the resulting scour morphology around the pier.
Despite advances in understanding single-pier scour, research on complex piers—typically composite structures consisting of pier columns, pile caps, and pile groups, which are widely used in practical engineering—remains relatively limited. The intricate geometry of complex piers generates flow patterns and scour mechanisms far more complex than those around single piers, exposing a critical gap in current knowledge and necessitating targeted investigation.
Predicting scour depth at complex bridge piers has prompted the development of empirical models, often adapted from single-pier formulas or simplified approaches (Melville and Coleman, 2000; Coleman, 2005; Moreno et al., 2016; Ataie-Ashtiani et al., 2010; Amini and Mohammad, 2017; Sheppard and Glasser, 2004). Melville and Coleman (2000) introduced an initial method that incorporated equations describing different combinations of pier components. However, this early method did not fully account for the presence of the pile group beneath the pile cap. Coleman (2005) revised this approach by incorporating five pile cap elevations and assuming a linear variation in scour depth. This revised method integrated existing expressions for single piles, caisson foundations, and pile groups. Additionally, Sheppard and Glasser (2004) suggested approximating complex piers as single circular pier with equivalent diameters. While these models offer a starting point, they frequently fail to capture the specific geometric and hydrodynamic nuances of scour around complex piers, limiting their predictive accuracy.
In complex piers, the pile cap, as a critical component, plays a vital role in influencing scour. Its position and geometric characteristics are key factors in determining the severity of scour. Tien Bui et al. (2020) conducted a sensitivity analysis to identify the factors affecting local scour around complex piers, emphasizing the pile cap’s position as a crucial determinant of scour severity. Similarly, Lu and Gao (2013) performed scour experiments on the complex piers of the Sutong Yangtze River Bridge, revealing a relationship between the pile cap’s embedment depth and both the maximum and minimum scour depths. Further experimental investigations by Hou et al. (2017) confirmed that exposing the pile cap above the riverbed significantly increases the surrounding scour depth. Salih and Alomari (2023) explored the effects of pile cap elevation and flow depth on local scour depth around complex piers. Their findings indicated that the maximum scour depth occurs when the pile cap is partially embedded in the sand bed. They also observed that scour depth increases with increasing flow depth, but beyond a certain threshold, the pile cap obstructs the influence of flow vortices on the bed surface, reducing the sensitivity of scour depth to further increases in flow depth. Ferraro et al. (2013) experimentally examined the effect of pile cap thickness on the temporal evolution of maximum scour depth and the development of equilibrium conditions. Their findings suggested that thicker pile caps generally lead to deeper scour holes, with the increase in scour depth strongly correlated to the pile cap’s embedment depth relative to the initial riverbed. Furthermore, their study revealed that pile cap thickness can influence the time-evolution of scour depth by altering the scour rate. Collectively, these studies underscore the critical role of the pile cap in complex piers, where its interaction with the flow fundamentally alters hydrodynamics and significantly affects the extent of scour.
Although existing research has provided theoretical and experimental support for the scouring behavior of complex bridge piers, the complexity and diversity of the geometric forms, and arrangements of bridge piers, caps, and pile groups in actual bridge engineering mean that current results have not fully revealed the scouring mechanisms under extreme hydrological conditions. In particular, the influence of geometric parameters such as the embedment depth of the cap on scouring characteristics remains unclear. To address this, this paper employs a three-dimensional numerical model to investigate the scouring process of a specific railway bridge’s complex pier under flood conditions. The study systematically analyzes how the embedded depth of the pile cap affects the evolution of the flow field, the morphology of the scour, and the final scour depth, aiming to provide more reliable engineering guidance for the anti-scouring design of bridge foundations.
2 Numerical methods
2.1 Control equations
A 3D scour model is constructed using the software Flow-3D. The free surface between water and air is captured using the Volume of Fluid (VOF) method. Water and air in the model are assumed to be incompressible viscous fluids. Their movement is governed by the Reynolds-Averaged Navier-Stokes (RANS) equations, which are expressed as follows:
where the subscripts i and j represent the index notation in tensor notation., ui represents the time-averaged velocity in the xi direction,
where δij is the Kronecker delta, which equals 1 when i = j and 0 when i ≠ j, k is the turbulent kinetic energy, and
Previous studies, such as Salaheldin et al. (2004), compared several turbulence models (k-ε, RNG k-ε, and k-ω) in simulating separated turbulent flow around vertical bridge piers. Their results demonstrated that the RNG k–ε model outperformed the others, especially in accurately predicting velocity distributions and bed shear stresses. Additionally, the RNG k–ε model is computationally more efficient than the k-ω model, as it requires fewer computational cells, making it a suitable choice for large-scale simulations. Therefore, the RNG k−ε turbulence model is selected in current study. The transport equations for the turbulent kinetic energy k and the turbulence dissipation rate ε are given by:
where:
2.2 Model setup
The numerical model of a complex pier is developed based on a rail-way bridge located in China. The bridge consists of a simply supported T-beam structure with span lengths ranging from 32 m to 41 m. The substructure is designed as a composite system comprising a pier, pile cap, and pile group (as shown in Figure 1A). The pier is designed with a round end hollow section, with base dimensions of 13.10 m × 9.10 m. The pile cap has a rectangular cross-section with dimensions of 15.50 m × 12.20 m. The pile group consists of a 4 × 4 pile group arrangement, with each pile having a diameter of 1.25 m. Detailed structural dimensions is provided in Figure 1B.
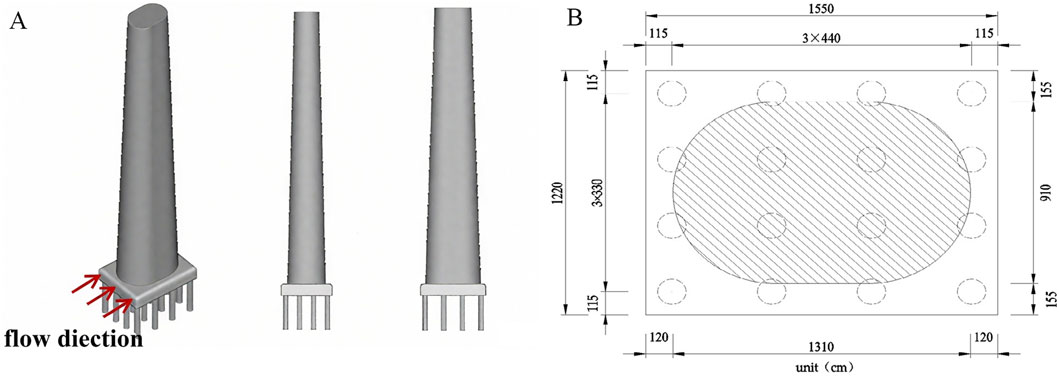
Figure 1. Schematic diagram of the complex pier: (A) 3D view of the complex pier, (B) Detailed dimensions.
A numerical flume is constructed to simulate the scour behavior around the com-plex pier. Based on the dimensions of the complex pier, the flume is set to 200 m in length, 100 m in width, and 20 m in height. The “pier-pile cap-pile group” model is positioned 100 m downstream from the flume’s inlet boundary. To mitigate the influence of water inflow and outflow at both ends of the flow field on sediment scour along the riverbed, a 2.5 m long barrier is placed near the inflow and outflow boundaries of the scour layer. A sandy riverbed, measuring 195 m in length, 100 m in width, and 8 m in height, is placed in the flume. The sediment is considered non-cohesive, with a median particle size of 2 mm, a density of 2,650 kg/m3, and an angle repose
The left boundary of the flume is set as the inflow boundary, where the flow velocity and water depth are specified to simulate uniform flow. The right boundary is defined as an outflow boundary, with free outflow conditions. The bottom boundary is set as a no-slip wall, where the normal velocity of the fluid at the boundary is zero. The top and lateral boundaries are defined as symmetry boundaries, with zero flow flux and zero shear stress at these locations.
To balance computational accuracy and efficiency, the computational domain is divided into two regions: the main computational domain and the secondary computational domain. The main computational domain has dimensions of 50 m in length and 50 m in width, centered around the pier. The secondary computational domain extends further away from the pier. In the main computational domain, a uniform grid size of 0.25 m is applied. In the secondary domain, a gradual grid refinement technique is used, with the grid size at the domain boundary set to 1.00 m. In the vertical direction, a uniform grid size of 0.25 m is used below the riverbed. From the riverbed to the water surface, a gradual grid refinement is applied, with the grid size at the water surface set to 1.00 m. The total number of grid cells in the entire computational domain is nearly 2,040,000. The schematic diagram of the grid is provided in Figure 2.
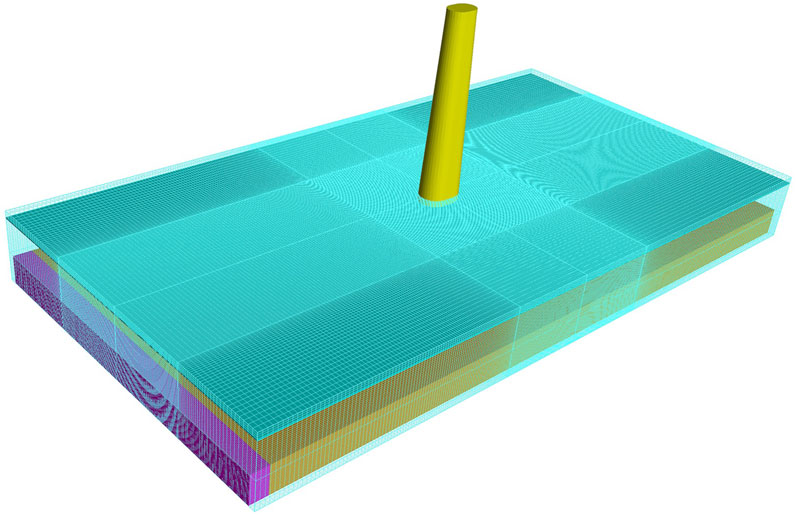
Figure 2. The schematic diagram of the numerical model in current study.
Scour at piers is a continuous process that evolves over time and reaches a state of equilibrium only after a prolonged period. Previous studies on local scour have shown that the scour depth increases rapidly in the initial stages, but the rate of scour decreases as time progresses (Roulund et al., 2005; Vuong et al., 2024). Therefore, the simulation time in this study is set to 1800 s to sufficiently capture the local scour characteristics of the complex pier under realistic conditions. The RNG k–ε turbulence model was employed with the standard wall function treatment. The near-wall dimensionless distance (y+) values were smaller than 300, ensuring that the wall function approach remained valid within its recommended range.
2.3 Model validation
To validate the accuracy of the scour model developed in this study, the experimental results from Roulund et al. (2005) are used for comparative analysis. Roulund et al. (2005) conducted experiments to investigate the flow field characteristics and scour depth evolution around a cylindrical single pier under uniform flow conditions. Their experimental flume had a length of 9.9 m, a width of 3.6 m, a water depth of 0.4 m, and a flow velocity of 0.46 m/s. The cylindrical pier in their experiments had a diameter of 0.10 m and was placed 6.60 m downstream of the flume inlet.
Based on the experimental setup of Roulund et al. (2005), a numerical model was constructed to simulate the scour process. The RNG k- turbulence model was employed to simulate flow dynamics. To balance computational efficiency with accuracy, the numerical flume was designed with dimensions of 3 m × 1 m × 0.7 m, as shown in Figure 3. The inlet and outlet were placed 1.5 m away from the cylindrical pier, while the lateral walls were positioned 0.5 m from the pier.
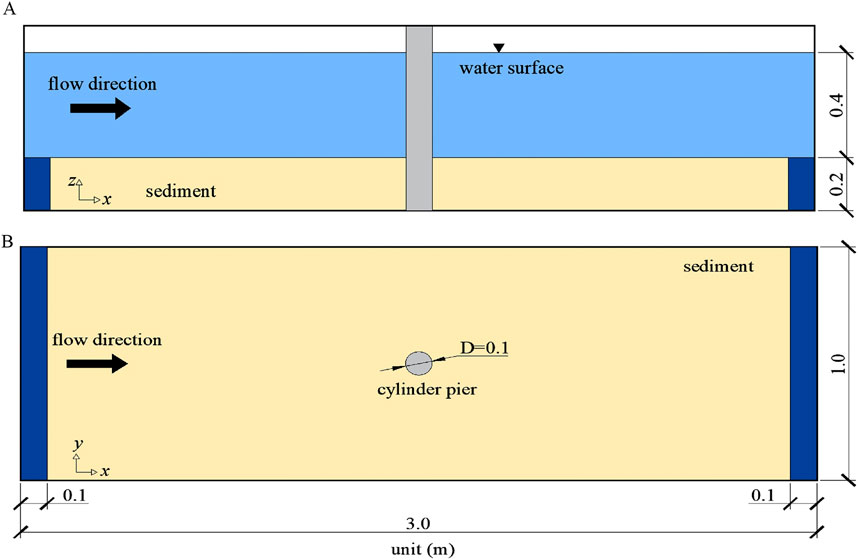
Figure 3. Schematic diagram of the validation model: (A) Front view; (B) Top view.
In the numerical model, sediment was modeled as spherical particles, with a critical packing coefficient
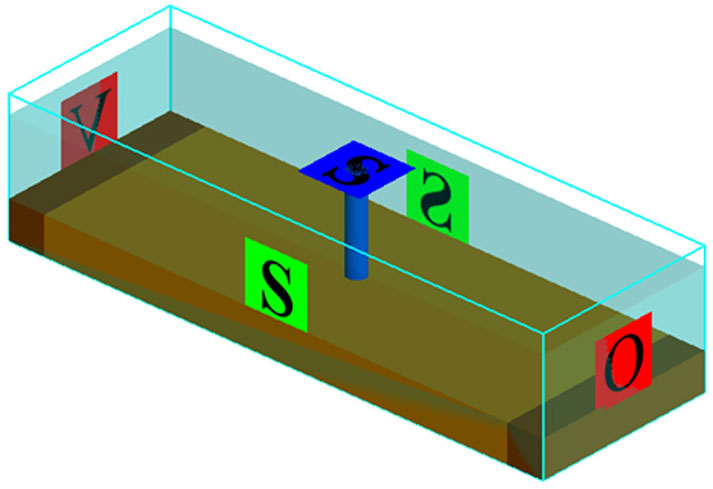
Figure 4. Schematic diagram of boundary conditions used in the validation model.
A refined mesh was used in the core area around the pier, with a mesh size of 0.05D, ensuring high resolution for accurate representation of flow and scour dynamics. In the non-core areas, the mesh size gradually increased from 0.05D to 0.3D. The grid was further refined in the vertical direction (from z = −0.2 m to z = 0.15 m) to better capture the near-bed flow and vortex dynamics, maintaining a mesh size of 0.05Din this region. The total number of computational cells in the domain was 2.76 million, as shown in Figure 5.
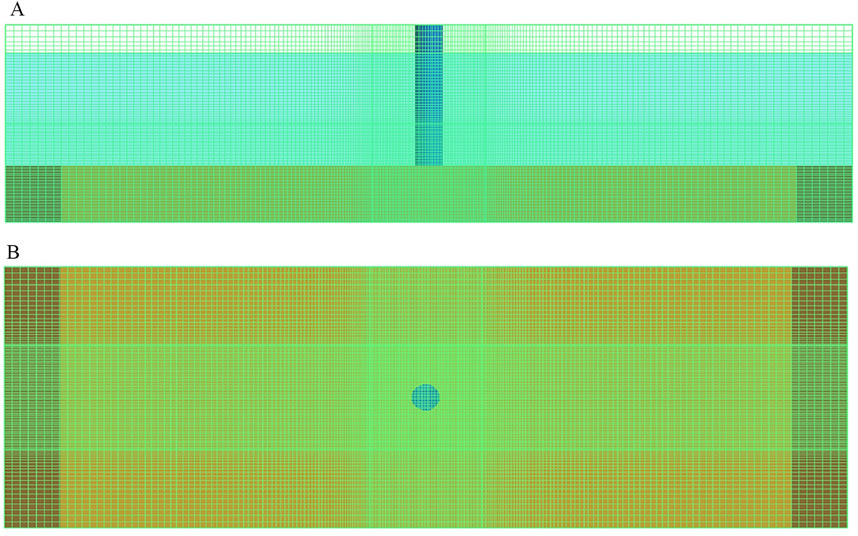
Figure 5. Schematic diagram of mesh configuration for the validation model: (A) Front view; (B) Top view.
Figure 6 presents a comparison between the numerical simulation results and the experimental data from Roulund et al. (2005). As shown in the figure, the scour depth evolution from the numerical model is in excellent agreement with the experimental results. During the initial 200 s of scour, the scour depth in front of the pier in-creases rapidly, and then the scour rate gradually decreases, reaching equilibrium after 1800 s. In contrast, the scour depth behind the pier increases more slowly, and the maximum scour depth is significantly smaller than that in front of the pier. Once equilibrium is reached, the scour depth behind the pier is approximately 52% of the depth in front of the pier. The numerical model developed in this study accurately simulates the development of scour depth around the pier. At equilibrium, the error between the simulated scour depth and the experimental results is less than 10%.
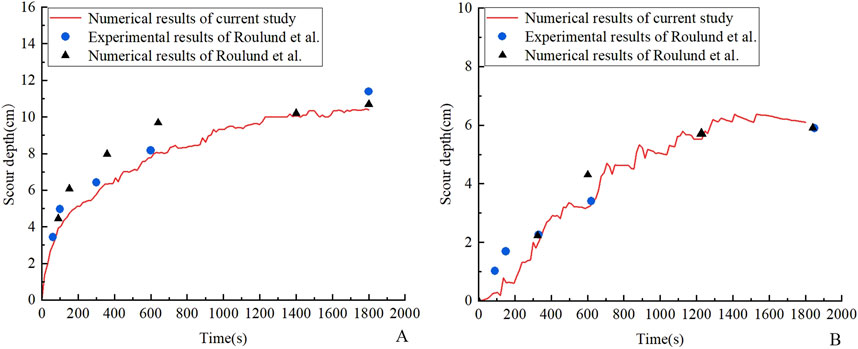
Figure 6. Validation of numerical simulation against experimental data for scour depth at different pier locations: (A) upstream and (B) downstream.
Figure 7 shows the predicted scour profile along the pier’s longitudinal symmetry axis compared to Roulund et al.’s experimental data. The numerical results closely match the experimental data in the upstream region (x/D < −0.5) and accurately capture the maximum scour depth. In the downstream region (x/D > 0.5), while the model slightly underestimates the scour depth, the overall trend and shape of the scour hole are highly consistent with the experimental observations. This indicates that the numerical model developed in this study has high accuracy and reliability in simulating scour around the pier.
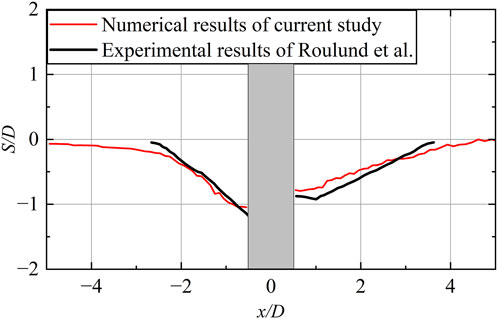
Figure 7. Comparison of predicted scour profile along the pier’s longitudinal axis with experimental data.
To further strengthen the validation of the numerical model, additional comparisons were performed between the simulated and experimental velocity fields from the study of Roulund et al. (2005). Velocities at three representative elevations above the bed (z = 0.10 m, 0.05 m, and 0.005 m) were extracted from both the numerical results and the experimental measurements for direct comparison. As shown in Figure 8, the horizontal velocity gradually decreases as the flow approaches the pier at higher elevations (z = 0.10 m and 0.05 m). Near the bed (z = 0.005 m), the horizontal velocity initially decreases to a minimum value and then slightly increases. The vertical velocity remains close to zero in the far field but becomes increasingly negative near the pier, reaching its maximum downward magnitude at the upstream face of the pier, indicative of the formation of the horseshoe vortex and the downward jet.
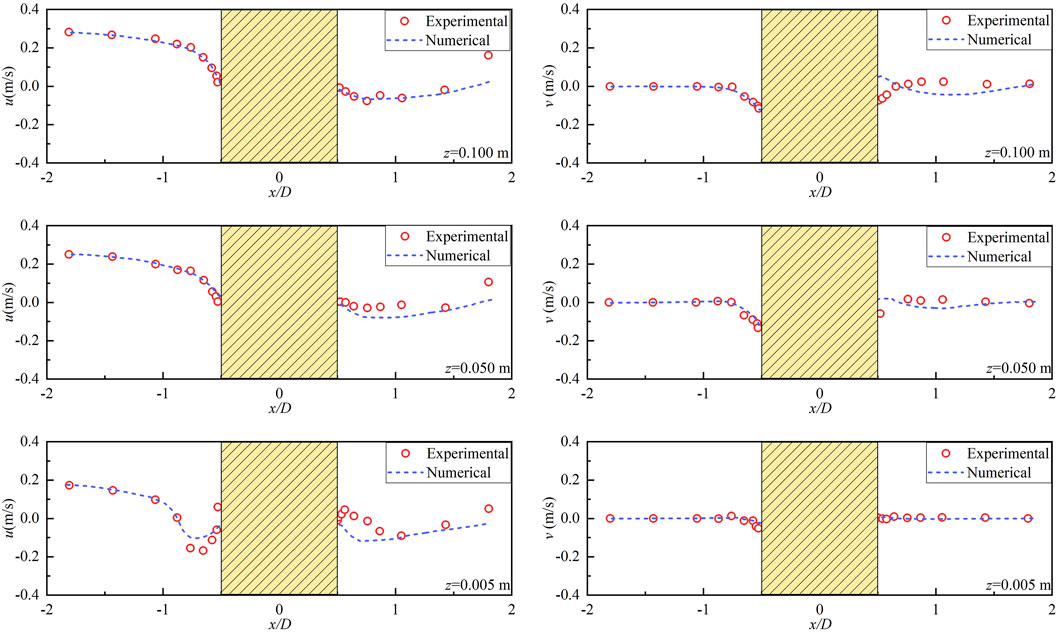
Figure 8. Comparison between numerical and experimental velocities at different elevations above the bed.
Overall, the numerical results show good agreement with the experimental data in the upstream region, successfully reproducing the main flow features associated with the pier-scour process. Some discrepancies appear in the downstream wake region, primarily due to the complex vortex shedding and flow separation that are inherently unsteady in nature. Similar deviations have been reported by Roulund et al. (2005) and Jiang et al. (2019), even when employing finer grids and advanced turbulence models. Therefore, these differences are not specific to the present model but rather reflect the general challenge of accurately capturing highly transient wake dynamics.
3 Results and discussion
The water depth in the flume was set to 10 m, based on the designed water level of the prototype railway bridge under flood conditions. A series of numerical simulations were conducted for a range of pile cap embedment depths. Two typical flow velocities, 4.0 m/s and 6.0 m/s, were selected to represent the hydrodynamic conditions that bridge piers may experience during flood events. Additionally, seven different embedment depths of the pile cap were considered: λ = 1.5, 1.0, 0.5, 0.0, −0.5, −1.0, and −1.5. Here, λ is defined as the ratio of the distance between the bottom surface of the pile cap and the riverbed to the thickness of the pile cap. Specifically, λ > 0 indicates that the pile cap is elevated above the riverbed, λ < −1 indicates that the entire pile cap is embedded within the riverbed, and −1 < λ < 0 represents the pile cap is partially embedded within the riverbed. By varying pile cap embedment depths, this study systematically simulated and analyzed the effects of pile cap embedment depth on flow field and scour characteristics. Thereby providing scientific insights and engineering recommendations for designing scour-resistant bridge piers.
3.1 Flow field
Figures 9, 10 illustrate the distribution of the flow field and vertical velocity characteristics around the complex pier at a flow velocity of v = 6.0 m/s, under varying pile cap embedment depths. When the pile cap has a large embedment depth (e.g., λ = 1.5), the flow on the upstream side of the pier is obstructed by the pile cap, resulting in both upward and downward flow (as shown in Figure 9A). The upward flow rises along the side of the pile cap and bypasses it, flowing downstream, with minimal impact on scour. The downward flow enters the gap between the pile cap bottom and the riverbed, where it intersects with the incoming flow and moves downstream through the gap. Due to the constricting effect of the gap, the flow velocity increases significantly, creating an “acceleration channel” effect. After passing through the gap, the flow gradually diffuses downstream, with the velocity decreasing. As shown in Figure 10A, although the flow velocity in the gap is high, the flow remains primarily horizontal, with minimal vertical velocity components. Only at the front of the gap, influenced by the downward flow, does the flow exhibit a downward vertical velocity component.
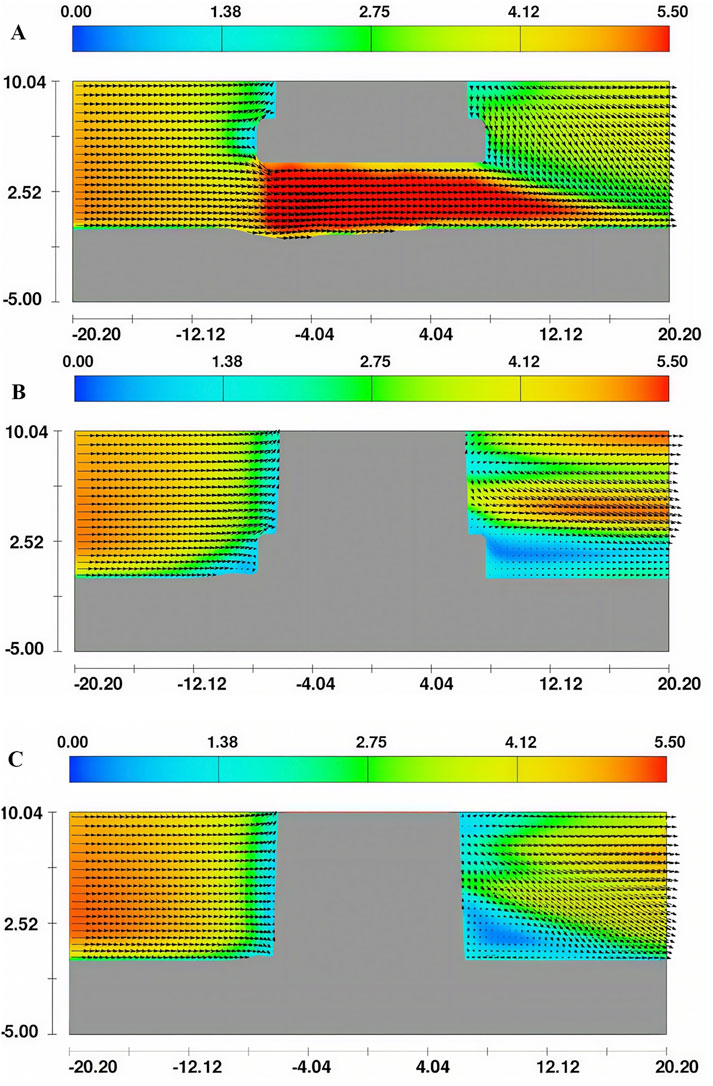
Figure 9. Flow field around the complex pier for pile caps with different relative embedment depths: (A) λ = 1.5 (cap elevated above the bed), (B) λ = 0.0 (cap flush with the bed), and (C) λ = −1.5 (cap embedded below the bed). Flow patterns are shown on the vertical symmetry plane (y = 0), with colors representing the velocity magnitude and arrows indicating the flow direction and strength.
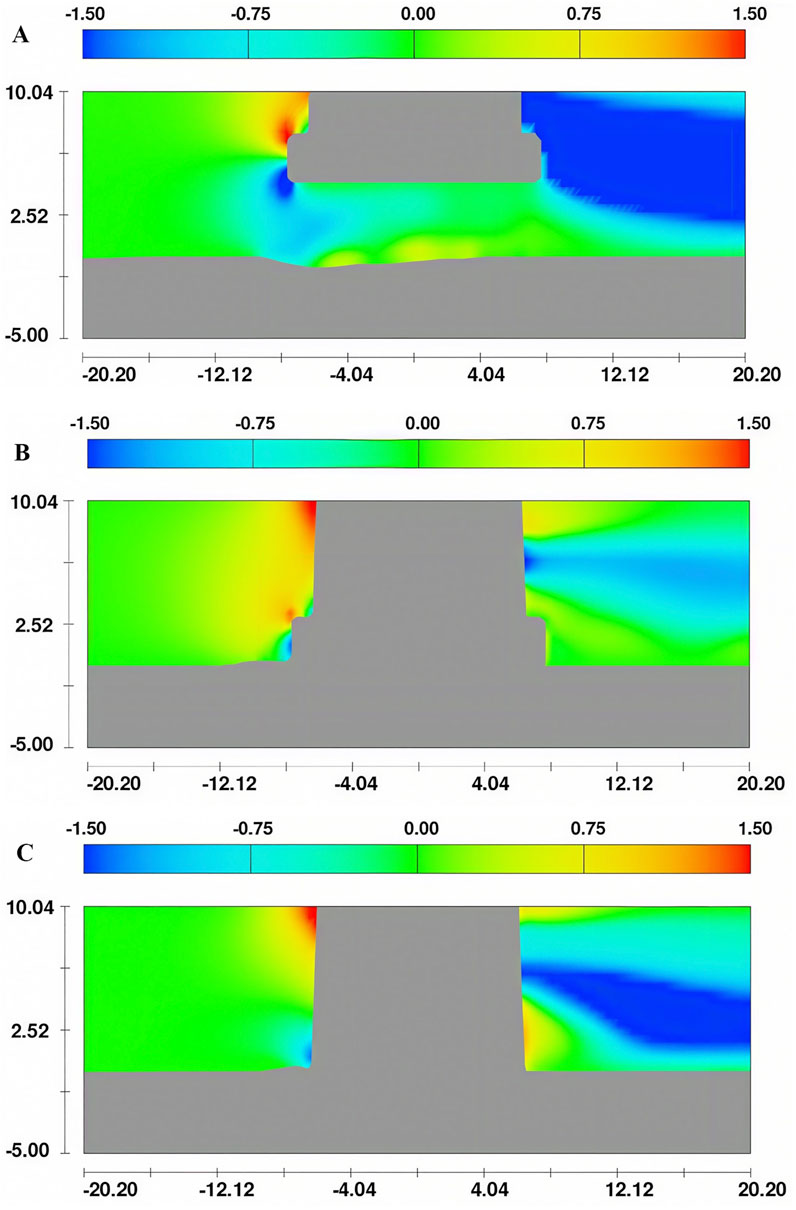
Figure 10. Distribution of vertical velocity around the complex pier for pile caps with different relative embedment depths: (A) λ = 1.5 (cap elevated above the bed), (B) λ = 0.0 (cap flush with the bed), and (C) λ = −1.5 (cap embedded below the bed). Flow patterns are shown on the vertical symmetry plane (y = 0), with colors representing the vertical velocity magnitude.
When the relative embedment depth of the pile cap decreases to λ = 0.0, where the bottom of the pile cap is level with the riverbed, the flow can no longer pass beneath the pile cap, and the downward flow directly impacts the riverbed (as shown in Figures 9B, 10B), thereby increasing the scour risk. Additionally, part of the flow separates as it is obstructed by the pile cap and bypasses it on both sides, further amplifying the scour range. A distinct vortex structure forms in the low-velocity region on the downstream side of the pile cap, generating localized backflow that may cause sediment to be repeatedly suspended and transported.
As the embedment depth of the pile cap continues to decrease and the pile cap becomes fully embedded in the riverbed, its impact on the flow field diminishes (as shown in Figure 9C), leading to a simpler flow structure. On the upstream side of the pier, no significant upward or downward flows are observed, and the water flows horizontally, smoothly bypassing the pier on both sides. However, in the low-velocity region on the downstream side of the pier, vortex structures develop, generating localized backflow that heightens the scour risk on the downstream side.
3.2 Scour characteristics
Figure 11 illustrates the scour characteristics around the complex pier under different pile cap embedment depths at a flow velocity of v = 6.0 m/s. As shown in Figure 11A, when the pile cap is relatively high (λ = 1.5), large and widely distributed scour holes form around the pier. The scour area extends significantly in the flow direction (longitudinally) and exhibits an inverted cone shape. The extended longitudinal development of the scour hole is primarily due to the higher pile cap, which accelerates the flow through the gap between the pile cap bottom and the riverbed, generating strong shear forces that lead to significant sediment erosion. The maximum scour depth occurs along the longitudinal centerline of the structure, between the first and second rows of piles, with a depth of approximately 3.9 m. The scour hole gradually extends downstream, with the depth decreasing, indicating a weakening of the scour intensity as the sediment is continuously transported. In the downstream region, where the flow velocity significantly decreases, sediment gradually accumulates, forming a deposition area with a height of approximately 1.85 m.
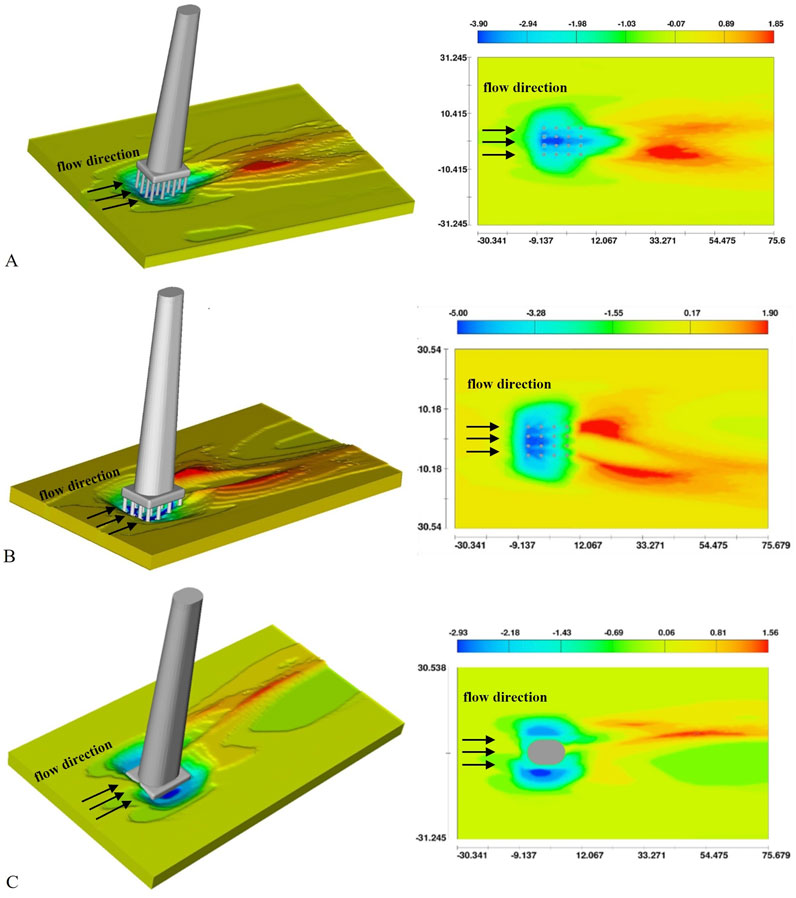
Figure 11. Scour morphology around the complex pier for pile caps with different relative embedment depths: (A) λ = 1.5 (cap elevated above the bed), (B) λ = 0.0 (cap flush with the bed), and (C) λ = −1.5 (cap embedded below the bed). Colors represent the local scour depth, showing the spatial distribution of bed erosion around the pier.
When the relative embedment depth of the pile cap decreases to λ = 0.0, where the pile cap is flush with the riverbed, the continuous scouring action exposes all four rows of piles, and the scour pattern exhibits significant lateral expansion (as shown in Figure 11B). Compared to the case of λ = 1.5, the longitudinal extent of the scour hole is noticeably reduced, with the scour predominantly extending laterally and forming a trapezoidal shape, with a deeper front and a shallower rear. This change occurs because, when the pile cap is level with the riverbed, water cannot flow beneath the pile cap, causing more flow to bypass the pile cap on both sides, which results in a more significant lateral expansion of the scour. Furthermore, due to the downward flow on the upstream side of the pile cap directly impacting the riverbed, a significant scour depth develops from the front of the first row to the rear of the second row of piles, reaching a maximum depth of approximately 4.90 m, which is substantially greater than in the case of λ = 1.5. In the downstream region, a sediment deposition area also forms, with a height of approximately 1.90 m, and the deposition extends widely.
As the pile cap continues to lower and become embedded deeper into the riverbed, significant changes in the scour characteristics occur. As shown in Figure 11C, when the relative embedment depth of the pile cap is λ = −1.5, the upper surface of the pile cap is embedded 1.5 m into the riverbed. However, with continued scouring, the upper surface of the pile cap gradually becomes exposed. Under these conditions, the flow primarily bypasses the structure on both sides, leading to a significant increase in the lateral extent of the scour hole, which now takes on a round end shape. The maximum scour depth is approximately 2.93 m, concentrated around the sides of the pile cap. Compared to cases where the embedment depth of the pile cap is greater than or equal to 0, the maximum scour depth significantly decreases in the case of λ = −1.5, indicating that deep embedment depth of the pile cap effectively reduces sediment erosion on the upstream and lateral sides, providing protective effects. Furthermore, the sediment deposition height on the downstream side significantly decreases, with a maximum height of approximately 1.56 m. Overall, the deep embedment depth of the pile cap effectively reduces scour intensity around the complex pier and results in smoother sediment deposition downstream.
3.3 Maximum scour depth
Figure 12 presents the maximum scour depth under different pile cap embedment depths. The results reveal a distinct nonlinear relationship between embedment depth and scour development. As the relative embedment depth of the pile cap decreases from 1.5 to −1.5, the scour depth exhibits a “first increases, then decreases” pattern. When the pile cap is above the riverbed, the scour depth gradually increases as the cap lowers and approaches the bed surface. This occurs because the reduced clearance enhances flow obstruction and disturbance, intensifying bed shear stress and promoting sediment erosion. When the relative embedment depth reaches λ = 0.0 (the bottom surface of the pile cap is flush with the bed), the scour depth attains its maximum value.
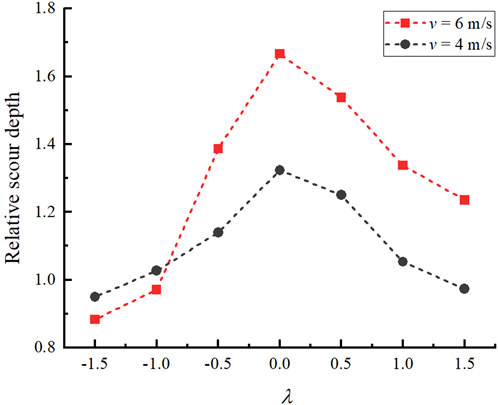
Figure 12. Influence of pile cap relative embedment depth on the maximum scour depth.
As the pile cap continues to submerge into the riverbed (λ decreasing from 0.0 to −1.5), the scour depth decreases markedly. In these cases, the upper surface of the pile cap becomes progressively buried, reducing its direct interaction with the flow. The cap thus acts as a protective barrier, diminishing local shear stress and effectively mitigating further erosion.
The overall trend observed in this study is consistent with previous research findings (e.g., Du et al., 2022; Yan and Xu, 2023). Similar to those studies, the scour depth around a complex pier increases as the pile cap approaches the bed, then decreases once the cap becomes embedded. This behavior reflects the combined influence of flow contraction and sediment shielding: the pile cap first enhances flow disturbance near the bed and later provides protection once buried.
However, our study reveals some notable quantitative differences, particularly in the positions of the pile cap corresponding to the maximum and minimum scour depths. Du et al. (2022), who investigated a complex pier with a circular pier, square pile cap, and a 2 × 2 pile group, observed a “saddle-shaped” variation in scour depth. In their study, the maximum scour occurred at λ = 1.5—more than twice that at λ = 0.0—while the minimum scour was observed at λ = −1.0. In contrast, our study identified the maximum scour at λ = 0.0 and the minimum at λ = −1.5. These discrepancies are likely due to differences in the structural configuration of the pier, such as the arrangement of the pile group, the geometry of the cap, and the interaction between the pile cap and the surrounding flow field.
The results of Yan and Xu (2023), who examined rectangular and trapezoidal pile caps at λ = 0.5 and λ = 0.0, are more consistent with the findings of the current study. Their data indicated that the scour depth at λ = 0.0 was more than 1.6 times greater than at λ = 0.5. These comparisons highlight that the positions of maximum and minimum scour are not fixed but are highly dependent on the specific pier geometry and flow conditions. In our study, even though the flow velocity beneath the elevated cap (λ = 1.5) increased due to the contraction between the cap and the bed, the flow remained predominantly horizontal with limited vertical components, which explains why it did not result in the deepest local scour.
From the combined evidence in this study and from previous works (Du et al., 2022; Yan and Xu, 2023), an important engineering implication emerges: to minimize local scour and enhance structural safety, bridge designs should avoid configurations where the pile cap is positioned too close to the bed (λ ≈ 0.0–1.5). Instead, embedding the pile cap below the bed surface allows it to act as an effective protective layer, reducing sediment erosion and enhancing the stability of the pier foundation.
4 Conclusion
This study analyzes the effects of pile cap embedment depth on the flow field characteristics and scour behavior around a complex pier using numerical simulations. The key conclusions are as follows:
1. When the pile cap is above the riverbed (e.g., λ = 1.5), the flow accelerates through the gap between the pile cap bottom and the riverbed, generating downward flows. When the pile cap is flush with the riverbed (λ = 0.0), downward flow directly impacts the riverbed, significantly increasing the scour risk. When the pile cap is fully embedded in the riverbed, its disturbance to the flow weakens significantly, and the flow becomes steady, bypassing the structure.
2. Scour patterns vary significantly with changes in pile cap embedment dmepth. When the pile cap is elevated above the riverbed, the scour hole develops primarily in the longitudinal direction, resembling an inverted cone shape, with scour concentrated on the upstream side. When the pile cap is flush with the riverbed (λ = 0.0), the scour depth reaches its maximum, and the scour hole expands laterally, taking on a trapezoidal shape, with scour mainly concentrated on the upstream side. When the pile cap is fully embedded, both the scour depth and extent decrease significantly, with the scour hole adopting a round end shape and sediment accumulation occurring more evenly on both sides of the pile cap.
3. The maximum scour depth exhibits a nonlinear trend of “first increasing, then decreasing” as the pile cap height decreases. When the pile cap is flush with the riverbed (λ = 0.0), the scour depth reaches its maximum. As the pile cap submerges further into the riverbed, the scour depth decreases significantly. Therefore, increasing the embedment depth of the pile cap is an effective measure for controlling scour and ensuring the safety of bridge foundations.
This study provides insights into the influence of pile-cap embedment depth on scour behavior around bridge piers, but several limitations should be noted. First, the analysis focused on a single sediment type (2 mm, non-cohesive), which limits the generalizability to other sediment types and flow conditions. Variations in sediment characteristics, such as grain size or cohesion, could lead to different scour patterns. Additionally, the two flow velocities considered may not capture the full range of real-world flow conditions. Future studies could expand the scope to include a wider range of sediment types and flow velocities to strengthen the robustness of the findings.
Data availability statement
The datasets generated and/or analyzed during the current study are available from the corresponding author upon reasonable request.
Author contributions
QQ: Methodology, Validation, Visualization, Writing – original draft. LS: Methodology, Writing – review and editing. YfL: Formal Analysis, Investigation, Writing – review and editing. YjL: Data curation, Writing – review and editing. HQ: Validation, Writing – review and editing. GR: Supervision, Writing – review and editing. ZY: Writing – review and editing, Conceptualization.
Funding
The authors declare that financial support was received for the research and/or publication of this article. This analysis was funded by the National Natural Science Foundation of China (52008065).
Acknowledgements
ZY expresses sincere gratitude to Professor Wei Wang for his invaluable guidance, and acknowledges the support provided by Chang’an University.
Conflict of interest
Authors QQ, LS, YfL, YjL, HQ, and GR were employed by Shandong Hi-Speed Road and Bridge International Engineering Co., Ltd.
The remaining author declares that the research was conducted in the absence of any commercial or financial relationships that could be construed as a potential conflict of interest.
Generative AI statement
The authors declare that no Generative AI was used in the creation of this manuscript.
Any alternative text (alt text) provided alongside figures in this article has been generated by Frontiers with the support of artificial intelligence and reasonable efforts have been made to ensure accuracy, including review by the authors wherever possible. If you identify any issues, please contact us.
Publisher’s note
All claims expressed in this article are solely those of the authors and do not necessarily represent those of their affiliated organizations, or those of the publisher, the editors and the reviewers. Any product that may be evaluated in this article, or claim that may be made by its manufacturer, is not guaranteed or endorsed by the publisher.
References
AASHTO (2012). AASHTO LRFD bridge design specifications. Washington, DC, USA: American Association of State Highway and Transportation Officials.
Amini, A., and Mohammad, T. A. (2017). Local scour prediction around piers with complex geometry. Mar. Georesources & Geotechnol. 35 (6), 857–864. doi:10.1080/1064119x.2016.1256923
Ataie-Ashtiani, B., Baratian-Ghorghi, Z., and Beheshti, A. A. (2010). Experimental investigation of clear-water local scour of compound piers. J. Hydraulic Eng. 136 (6), 343–351. doi:10.1061/(asce)0733-9429(2010)136:6(343)
Bordbar, A., Sharifi, S., and Hemida, H. (2021). Investigation of the flow behaviour and local scour around single square-shaped cylinders at different positions in live-bed. Ocean. Eng. 238, 109772. doi:10.1016/j.oceaneng.2021.109772
Breusers, H., Nicollet, G., and Shen, H. W. (1977). Local scour around cylindrical piers. J. Hydraulic Res. 15 (3), 211–252. doi:10.1080/00221687709499645
Chavan, V. S., Chen, S. E., Shanmugam, N. S., Tang, W., Diemer, J., and Allan, C. (2021). An analysis of local and combined (global) scours on piers-on-bank bridges. CivilEng 3 (1), 1–20. doi:10.3390/civileng3010001
Cheng, Y. Z., Jiang, S., Gong, W. L., Tang, W., Huang, X. Y., and Xia, B. (2019). Experimental study on local scour around vertical circular cylinder under solitary wave action. Adv. Water Sci. 30 (02), 255–263.
Coleman, S. E. (2005). Clearwater local scour at complex piers. J. Hydraulic Eng. 131 (4), 330–334. doi:10.1061/(asce)0733-9429(2005)131:4(330)
Diab, R., Link, O., and Zanke, U. (2010). Geometry of developing and equilibrium scour holes at bridge piers in gravel. Can. J. Civ. Eng. 37 (4), 544–552. doi:10.1139/l09-176
Du, D., Yue, S., Zhou, H., Htay, H. A., and Yu, G. (2022). Influence of relative buried depth of cap on local hydrodynamic and scour of complex pier in uniform flows. Ocean Eng. Equip. Technol. 09 (02), 64–75. doi:10.12087/oeet.2095-7297.2022.02.12
Ferraro, D., Tafarojnoruz, A., Gaudio, R., and Cardoso, A. H. (2013). Effects of pile cap thickness on the maximum scour depth at a complex pier. J. Hydraulic Eng. 139 (5), 482–491. doi:10.1061/(asce)hy.1943-7900.0000704
Fu, Y. P., Zhu, C. H., Sun, Y., Wang, R. G., Li, Q. H., and Wu, W. Y. (2024). Experimental study on seabed scour around submerged single and Pile group foundations under combined wave and current action. Ocean Eng. doi:10.16483/j.issn.1005-9865.2024.06.008
Gong, E. Y., Chen, S. G., Chen, X., Zhang, K. H., Guang, D. W., and Zheng, J. H. (2024). Large-scale experimental study on scour around monopile under the action of waves. J. Tsinghua Univ. 64 (04), 619–625. doi:10.16511/j.cnki.qhdxxb.2023.27.003
Han, M. (2010). Experimental study on turbulence characteristics of circling flow around a cylinder pier. Xianyang, China: Master’s thesis, Northwest A&F University.
Hassanzadeh, Y., Khosravi, M., and Kardan, N. (2020). Numerical investigation on the effect of bluntness factor on scouring mechanism by using lenticular geometry piers. Can. J. Civ. Eng. 47 (3), 279–290. doi:10.1139/cjce-2017-0658
Hou, Z. J., Yi, X. Y., Sun, Y., and Li, L. (2017). Experimental study on the high-voltage transmission tower base erosion in sediment river. Yellow River 39 (07), 55–60.
Jiang, S., Zhang, Z., Cheng, Y., Ge, Y., and Gong, W. (2019). Numerical simulation on reducing the local scour around a vertical pile by using a protective pile. Chin. J. Hydrodynamics 34 (01), 122–130. doi:10.16076/j.cnki.cjhd.2019.01.016
Khan, M., Tufail, M., Ajmal, M., Haq, Z. U., and Kim, T. W. (2017). Experimental analysis of the scour pattern modeling of scour depth around bridge piers. Arabian J. Sci. Eng. 42, 4111–4130. doi:10.1007/s13369-017-2599-7
Li, J., Zhang, B., Shen, C., Fu, X., and Li, W. (2021). Experimental study on local scour depth around monopile foundation in combined waves and current. Sustainability 13 (24), 13614. doi:10.3390/su132413614
Liu, Z. Q. (2010). Numerical simulation for local scour around bridge piers and abutments. Master’s thesis. Hu-nan, China: Hunan University.
Lu, Z. Y., and Gao, Z. R. (2013). Experimental study on influence of different submersed-elevation of pile-cushion capping on local scouring. China Harb. Eng. (2), 44–49.
Lyu, X., Cheng, Y., Wang, W., An, H., and Li, Y. (2021). Experimental study on local scour around submerged monopile under combined waves and current. Ocean. Eng. 240, 109929. doi:10.1016/j.oceaneng.2021.109929
Ma, L. L. (2018). Experimental investigation on scour development around the pile foundation of the sea-crossing bridge. Zhejiang, China: Zhejiang University.
Melville, B. W., and Coleman, S. E. (2000). Bridge scour[M]. Highlands Ranch, CO, United States: Water Resources Publication.
Montalvo, C., and Cook, W. (2018). A concise analysis of hydraulic bridge collapse. J. Civ. Eng. Archit. 12, 810–815. doi:10.17265/1934-7359/2018.11.004
Moreno, M., Maia, R., and Couto, L. (2016). Prediction of equilibrium local scour depth at complex bridge piers. J. Hydraulic Eng. 142 (11), 04016045. doi:10.1061/(asce)hy.1943-7900.0001153
Qi, W. G., and Gao, F. P. (2014). Physical modeling of local scour development around a large-diameter monopile in combined waves and current. Coast. Eng. 83, 72–81. doi:10.1016/j.coastaleng.2013.10.007
Roulund, A., Sumer, B. M., Fredsøe, J., and Michelsen, J. (2005). Numerical and experimental investigation of flow and scour around a circular pile. J. Fluid Mech. 534, 351–401. doi:10.1017/s0022112005004507
Salaheldin, T. M., Imran, J., and Chaudhry, M. H. (2004). Numerical modeling of three-dimensional flow field around circular piers. J. Hydraulic Eng. 130 (2), 91–100. doi:10.1061/(asce)0733-9429(2004)130:2(91)
Salih, I., and Alomari, N. (2023). The effect of the piles cap elevation on local scour around complex bridge piers. Al-Rafidain Eng. J. 28 (2), 199–208. doi:10.33899/rengj.2023.139205.1245
Sheppard, D. M., and Glasser, T. (2004). “Sediment scour at piers with complex geometries,” in Proceedings 2nd International Conference on Scour and Erosion. Singapore: World Scientific, 1–14. Available online at: https://henry.baw.de/server/api/core/bitstreams/979366c5-5374-4346-ae09-441928b277a3/content.
Tan, J. S., Elbaz, K., Wang, Z. F., Shen, J. S., and Chen, J. (2020). Lessons learnt from bridge collapse: a view of sustainable management. Sustainability 12 (3), 1205. doi:10.3390/su12031205
Tien Bui, D., Shirzadi, A., Amini, A., Shahabi, H., Al-Ansari, N., Hamidi, S., et al. (2020). A hybrid intelligence approach to enhance the prediction accuracy of local scour depth at complex bridge piers. Sustainability 12 (3), 1063. doi:10.3390/su12031063
Vuong, T. H. N., Wu, T. R., Huang, Y. X., Chu, C. R., Wang, C. Y., and Le, T. L. (2024). Numerical study of local scour and hydrodynamic pressure of complex bridge piers. Results in Engineering 24, 103533. doi:10.1016/j.rineng.2024.103533
Wang, S. Y. (2020). Study on local scour characteristics and protective measures of cylindrical pier under the action of water flow. Chengdu, China: Southwest Jiaotong University. Master’s thesis. doi:10.27414/d.cnki.gxnju.2020.000501
Wang, S. Y., Mou, L., Wei, K., Qin, L., and Xiang, Q. (2020). Experimental study on local scour of cylindrical pier under different hydraulic conditions. J. Disaster Prev. Mitig. Eng. 40 (03), 425–431. doi:10.13409/j.cnki.jdpme.2020.03.014
Wei, K., Qin, S. Q., Zhao, W. Y., Zhu, B., and Xu, G. J. (2021a). State-of-the-art review of bridge hydrodynamic in 2020. J. Civ. Environ-mental Eng. 43 (S1), 31–42.
Wei, K., Wang, S. Y., Qiu, F., Xiang, Q. Q., and Shen, Z. H. (2021b). Experimental study on local scour and its protection of offshore wind turbine monopile under ocean current. Acta Energiae Solaris Sin. 42 (09), 338–343.
Xiang, Q. Q., Wang, S. Y., Guo, H., and Qiu, F. (2023). Simulation analysis of influencing factors on local scour around single pile under steady flow. Railw. Eng. 63 (08), 82–86.
Xiong, W., Cai, C. S., and Zhang, R. Z. (2021). Review of hydraulic bridge failure. China J. Highw. Transp. 34 (11), 10–28. doi:10.19721/j.cnki.1001-7372.2021.11.002
Xu, Y. Y. (2018). Experimental investigation of scour around vertical piels in steady currents. Dalian, China: Dalian University of Technology. Master’s thesis.
Yan, J., and Xu, H. (2023). Numerical simulation research on local scour against abutment foundation of pile cap. Port. Waterw. Offshore Eng. 60 (06), 1–6. doi:10.16403/j.cnki.ggjs20230601
Zhao, H. Y. (2023). Local scour and protection of offshore three-pile foundation under constant current conditions. Xi'an, China: Chang'an University. Master’s thesis.
Zhao, M., Cheng, L., and Zang, Z. (2010). Experimental and numerical investigation of local scour around a submerged vertical circular cylinder in steady currents. Coast. Eng. 57 (8), 709–721. doi:10.1016/j.coastaleng.2010.03.002
Keywords: bridge engineering, local scour, numerical simulation, complex bridge pier, embedment depth of pile cap
Citation: Qin Q, Shi L, Li Y, Li Y, Qin H, Ren G and Yang Z (2025) Numerical investigation of scour behavior around complex piers under flood conditions. Front. Built Environ. 11:1703330. doi: 10.3389/fbuil.2025.1703330
Received: 11 September 2025; Accepted: 05 November 2025;
Published: 28 November 2025.
Edited by:
Teng Wu, University at Buffalo, United StatesReviewed by:
Noor Saadi, University of Babylon, IraqVolkan Kiricci, Eskisehir Technical University, Türkiye
Copyright © 2025 Qin, Shi, Li, Li, Qin, Ren and Yang. This is an open-access article distributed under the terms of the Creative Commons Attribution License (CC BY). The use, distribution or reproduction in other forums is permitted, provided the original author(s) and the copyright owner(s) are credited and that the original publication in this journal is cited, in accordance with accepted academic practice. No use, distribution or reproduction is permitted which does not comply with these terms.
*Correspondence: Qiang Qin, NDk4NTQ4MzgzQHFxLmNvbQ==