 Rohit Kumar
 Debayan Dhar
 Palash Ghosh
 Keyur Sorathia
- 1Department of Design, Manipal School of Architecture and Planning, Manipal Academy of Higher Education, Manipal, India
- 2Department of Design, Indian Institute of Technology Guwahati, Guwahati, India
- 3Department of Mathematics, Indian Institute of Technology Guwahati, Guwahati, India
Virtual reality (VR) offers transformative potential for human behavioral studies by enabling controlled simulations of complex environments. Accurate replication of real-world conditions, however, remains critical, particularly for lighting studies that require high precision and reliable data extraction. This study investigates discrepancies in light distribution across typical lighting configurations and develops predictive models to mitigate these variations while identifying practical constraints. Illumination differences between real-world measurements, DIALux evo simulations, and VR environments were examined empirically. Multiple linear regression with interaction terms was then used to develop predictive models for one-, two-, and four-luminaire configurations on horizontal and vertical planes, based on 100 test points per plane in a controlled room. Model validation included cross-space application and residual analysis using an additional dataset of 60 test points per plane collected in a separate room with a similar lighting setup. Statistical analysis revealed 53%–88% differences in illumination intensity across configurations. The predictive models effectively reduced discrepancies on the horizontal plane and were optimized for linear, low-intensity lighting, while highlighting the need for further investigation into vertical illumination and complex luminaire arrangements. Future work involving non-linear or advanced computational approaches could enhance model accuracy for irregular lighting distributions in VR. These findings have practical implications for VR-based lighting studies, building performance simulations, and virtual illumination design.
1 Introduction
Virtual Reality (VR) technology possesses considerable potential for precise assessment of environmental interventions, as reflected in the growing body of research within the built environment domain (Kuliga et al., 2015; Newman et al., 2022; Fathi et al., 2025; Liu and Liu, 2025). Many of these studies aim to replicate real-world scenarios to map human activities with precision. However, achieving an exact replica of real-world test environments remains a critical challenge. Consequently, researchers have pursued two primary directions: one involves the direct comparison of human activities across matched physical and virtual environments, while the other focuses on the calibration or improvement of VR systems to enhance fidelity or impressiveness. Notably, improvements in experimental methodologies for VR calibration have been observed in scholarly work dating back to 1993 (Nemire and Ellis, 1993). Though, it is evident that calibration specifically for lighting is essential for creating a real-world-like experience within virtual environments, enabling researchers to collect reliable and valid data. This need becomes particularly significant given that VR modeling tools were originally developed for game design and visual representation, with scene controls resembling camera settings—features not inherently suited for scientific investigations in built environment. Despite these limitations, a growing number of scientific inquiries in recent years have begun to adapt VR modeling tools for quantitative research purposes, moving beyond their traditional qualitative or behavioral applications. Moreover, research in this domain is increasingly leveraging advanced VR tools for diverse scientific applications. These include energy simulation (Hou et al., 2022), investigations into occupant comfort and behavioral responses (Gan et al., 2022; Somarathna et al., 2022), studies of lighting environments (Mohammadrezaei et al., 2024), emergency evacuation modeling (Liu and Liu, 2025), as well as architectural and urban design research (Portman et al., 2015; Jamei et al., 2017).
Recent advancements in Virtual Reality (VR) calibration focus on lighting, color fidelity, and HMD performance, with lighting being crucial for spatial realism (Kumar and Dhar, 2023). Although VR tools employ Physically Based Rendering, Global Illumination, and reflection techniques, they optimize perceptual realism rather than replicating real-world lighting quantitatively. Consequently, VR environments appear convincing but often fail to deliver reliable illumination data, such as lux levels on surfaces. Despite this, researchers in architecture and the built environment increasingly use VR to study perception and lighting. This highlights the need for a robust model to predict lighting intensity from luminaire configurations. This study addresses the perceptual-empirical gap by calibrating VR lighting for lux accuracy, distinguishing subjective brightness from measurable illuminance (Panahiazar and Matkan, 2018).
This research addresses the critical gap between perceptual realism and quantitative accuracy in VR lighting calibration. While most VR research emphasize visually convincing environments, they rarely ensure empirically reliable illumination data. To bridge this divide, the study developed a virtual replica of a real discussion room, recreating its lighting to design six paired test scenarios across three setups. Lux measurements at 100 horizontal and vertical points enabled rigorous comparison between real and virtual conditions. Using multiple linear regression with interaction terms, predictive equations for lux levels were created and validated. Even though discrepancies exceeded 82% overall and 53% for horizontal surfaces, the models demonstrated strong predictive capability, marking a novel step in quantifying VR illumination accuracy. Unlike prior work, this research proposes a calibration framework that translates VR lighting into reliable, physical metrics, ensuring surfaces in virtual scenes can be analyzed with scientific consistency. Beyond methodological innovation, the study contributes a foundation for integrating predictive calibration tools into VR platforms, expanding their role in artificial lighting simulations and establishing VR as a credible instrument for evidence-based built-environmental research.
2 Related work
A comprehensive state-of-the-art literature review, substantiated by bibliometric analysis, was performed to address the key research enquiries of this study. The review process emphasized eight key research articles, selected through a systematic screening procedure. Particular emphasis was placed on eight research articles shortlisted through a systematic screening process. However, findings from all reviewed works with relevant contributions were documented in chronological order. The review is organized into two main stages: first, a comparative analysis of existing approaches (Section 2.1), and second, an examination of calibration methodologies along with the identification of limitations in current models (Section 2.2).
2.1 Comparing physical and virtual lighting environments
Early research on Virtual Reality (VR) from 1995 to 2000 primarily examined the limitations of head-mounted displays (HMDs), the representation of complex spatial layouts, and the challenges of multi-user interaction (Rolland et al., 1995; Arthur et al., 1997; Schroeder et al., 1998; Jayaram et al., 1999). During this period, lighting was not a central focus. The first studies addressing virtual lighting directly emerged in the early 2000s. Mania, (2001) compared real and virtual lighting visualizations, while Mania and Robinson, (2005) confirmed perceptual parity in such comparisons. Between 2002 and 2008, VR studies expanded into fields like medicine, vehicle design, and multisensory training (Taylor et al., 2002; Jichlinski, 2003; Reuding and Meil, 2004; Spottiswood and Bishop, 2005; Rothbaum et al., 2006; Lee et al., 2007; Jones et al., 2008). However, lighting remained secondary, with the majority of research focusing either on interactional or experiential qualities rather than illumination. After 2011, VR research shifted toward behavioral analysis and disability support, continuing to prioritize application over lighting accuracy (Fornasari et al., 2013; Gade et al., 2013; Picinali et al., 2014).
The first systematic effort to directly compare lighting in physical and virtual settings was undertaken by Heydarian et al. (2015b), who studied end-user preferences for lighting during reading tasks. Participants interacted with virtual environments that replicated real-world spaces and could adjust blinds or artificial lights. Their work extended into a broader study on natural versus artificial light usage Heydarian et al. (2015a) Results revealed a strong preference for daylight under certain control conditions, but less reliance on natural light when both artificial lighting and blinds were adjustable. These findings demonstrated that virtual platforms could simulate human lighting behavior in detail, though accuracy of simulated illumination data was not the focus. Hong and Michalatos, (2016), advanced this discussion by replicating real-world lighting in VR, addressing limitations such as screen-based light intensity and visual adaptation. They concluded that Bloom and HDR rendering techniques could improve realism compared to conventional Building Information Modeling (BIM) software. Chokwitthaya et al. (2017) extended this work by exploring performance thresholds, revealing that discrepancies around 300–400 lumens impacted task performance. However, results were inconclusive since discrepancies were not measured in lux—the standard illuminance unit recommended by the Illuminating Engineering Society (IES).
Perceptual approaches continued to dominate. Chamilothori et al. (2019) compared perceptual daylighting factors—pleasantness, interest, and satisfaction—finding no major differences between real and virtual conditions, thus validating VR for perceptual daylight research (Mahmoudzadeh et al., 2021). further compared user satisfaction with interactive versus automated lighting systems and observed that lighting systems offering control were preferred and imposed lower cognitive loads for reading tasks compared to automated systems. Hegazy et al. (2021) however, pointedly highlighted the need for VR-based studies to benchmark illumination against real-world standards to improve scientific validity.
Recent reviews (Luo and Zhang, 2023) reaffirm that most VR-lighting research emphasizes perceptual responses that enrich different domains but rarely prioritizes quantitative rigor. Consequently, while VR has positioned itself as a powerful tool for cost-effective, scalable lighting studies, it remains limited in capturing and reproducing illumination data with measurable accuracy.
2.2 Calibration studies
Efforts to improve realism in VR lighting environments have generally followed two routes: (1) HMD visual calibration—ensuring proper reproduction of light within headsets, and (2) light source calibration—adjusting digital light settings to mirror real-world illumination values. The first approach typically involves subjective user studies within immersive VR, while the second incorporates 3D modeling, rendering engines, and direct illuminance measurement tools.
Research specifically addressing lighting calibration is relatively recent and limited. The earliest significant attempt was Jia et al. (2014), who created an interactive framework combining photorealistic simulation with lighting control algorithms. However, this work focused primarily on computer graphics rather than real-world validation. Hegazy et al. (2021) conducted one of the first daylight-focused calibration studies using Unreal Engine. They examined illuminance accuracy in two daylit case studies with varying spatial complexity. Three rendering techniques were tested, with ray tracing achieving the closest results to benchmark lighting simulation tools. While this study demonstrated promise for real-time ray tracing, it emphasized caution, given the inability of VR engines to fully replicate the multifaceted nature of real-world lighting.
Subsequent studies concentrated on HMD calibration. Murray et al. (2022), developed a framework for calibrating headset luminance via color grading in Unity but restricted their analysis to achromatic RGB values without addressing hardware constraints. Gil Rodríguez et al. (2022), employed imaging colorimeters to validate HMD output, finding a linear relationship between surface reflectance and visual stimuli, while also investigating color constancy effects. Though valuable, these studies focused on luminance and display performance rather than illumination accuracy. A technically significant but narrow approach was proposed by Scorpio et al. (2022). who calibrated single-point lighting in Unreal Engine 4 (UE4). By adjusting cone angles of artificial lights, they compared simulated luminance with DIALux Evo, though their results remained software-centric and lacked physical validation. Kong et al. (2023) contributed by examining thresholds for brightness perception of luminous surfaces, offering useful behavioral insights but leaving illumination (lux) calibration unaddressed.
These efforts illustrate that most calibration studies stop short of offering practical, replicable methodologies for translating real-world lighting conditions into virtual spaces. Although VR has proven its utility in human perception and behavioral modeling, robust approaches for quantitative validation in lighting simulations remain undeveloped. The synthesis of the literature reveals several critical limitations:
Comparative studies predominantly emphasize qualitative aspects—such as behavioral or perceptual observations—rather than quantitative assessments. These studies often lack standardized measurement protocols across both real and virtual environments, limiting their utility in developing generalized calibration models.
There is a notable scarcity of non-perceptual, parametric studies focused on lighting intensity, particularly in the context of calibrating light levels outside controlled dark-room environments. Existing findings remain inconclusive, underscoring the need for future research aimed at advancing reliable calibration methodologies. It is important to note that existing studies primarily examine luminance—what a surface emits (quantitative)—or brightness (qualitative), while illumination—what a surface receives (quantitative)—is often overlooked.
Moreover, there is a significant gap in the literature concerning practical, replicable methods for calibrating complex lighting scenarios across varied real-world settings. Therefore, this study aims to develop a practical calibration model by systematically comparing real-world and UE5 lighting conditions on horizontal and vertical surfaces. It uniquely contributes a methodological framework for enhancing digital illumination fidelity across varied lighting scenarios, advancing accuracy in architectural lighting simulations and supporting more precise illumination data generation. Therefore, to achieve these objectives, this study seeks to address the following research inquiries:
RQ1: What is the degree of disparity in lighting intensity measurements between VR and physical environments?
RQ2: What can be the optimized and practical approach to minimize quantitative discrepancies between virtual and physical environments’ illumination distribution?
The outcomes of this study are expected to advance the application of virtual environments in sustainable architecture, human-centered design, and predictive modelling, ultimately fostering more accurate and reliable VR tools for design, research and construction industry.
3 Methodology
The experimental procedure involved creating a virtual replica of a real-world room under comparable lighting conditions to investigate illumination discrepancies and develop a calibration model. Three distinct lighting arrangements were implemented to assess light distribution across both horizontal and vertical surfaces. A total of 100 test points was recorded on the horizontal surface and 100 on the vertical surface. Lux levels from both environments were compared to identify variations in lighting intensity. Subsequently, predictive models were developed using Multiple Linear Regression (MLR) with interaction terms. While MLR is a commonly used statistical method, its application for calibrating VR illumination represents a novel methodological contribution, addressing a significant gap in current research. Although no living subjects were involved, the study was reviewed and approved by the Kasturba Medical College and Kasturba Hospital Institutional Ethics Committee (Approval No. IEC1: 373/2024), ensuring adherence to ethical standards.
3.1 Physical environment setup
3.1.1 Test room configuration
A small discussion room measuring 2.75 m in width and 3.1 m in length, featuring a centrally positioned table, was selected for its flexible environmental control. The table (1,500 mm × 750 mm × 750 mm) was covered with a white paper sheet marked with a 100 mm grid, yielding 128 test points for horizontal measurements. For vertical surface measurements, 144 test points were marked on the front wall using the same grid size. The room has a false ceiling at a height of 2.48 m, equipped with four luminaires of identical technical specifications, each positioned 600 mm from the adjacent walls (Figure 1). The room is isolated from daylight and external artificial light sources. To maintain consistency in reflection properties, color, and texture, RGB values were recorded for each surface, and materials with matching properties were replicated in the VR environment.
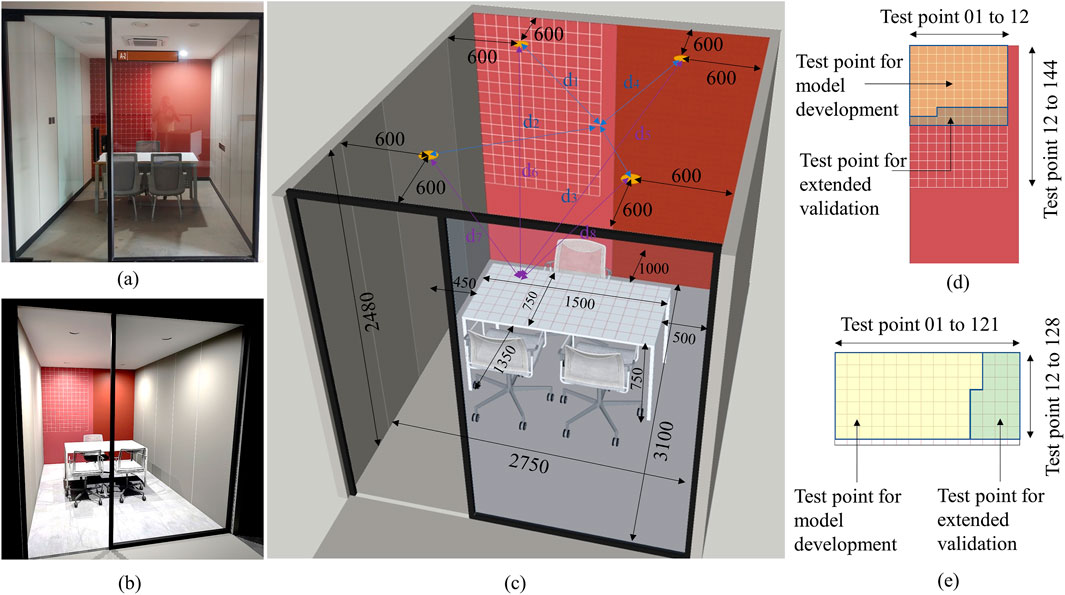
Figure 1. Test room attributes. (a) real world test room settings, (b) VR environment test room settings, (c) Dimensioning and positing of lighting and data collection points, (d) Test points on vertical surface, (e) Test points on horizontal surface (source: author).
3.1.2 Instruments, measurement protocols and real-world data collection
A lux meter (make - LT Lutron LX 101A) has been used to collect the lighting intensity readings from the table top and wall surface grid points. The collected illuminance data were recoded digitally in lux and rechecked again at some random points to minimize error. However, the readings were varying between 1 lux and 5 lux at some points. Illumination measurements were recorded using the lux meter, which has a specified accuracy of ±5% of the reading ±10 digits, though it is widely regarded as sufficiently precise for architectural and environmental lighting studies. For correct reading of RGB values shade cards from Asian Paints were used to determine accurate RGB values (Table 1).
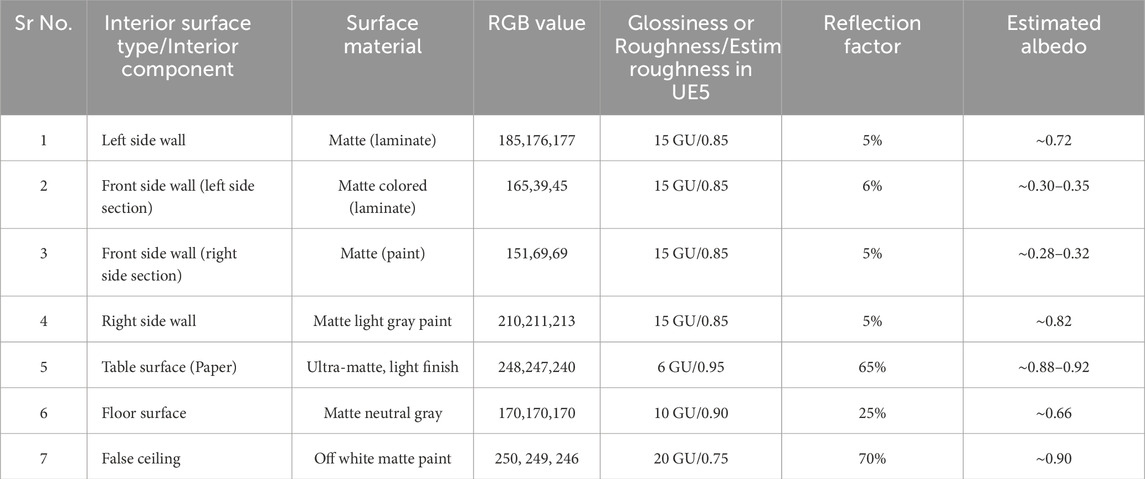
Table 1. Indoor materials and components surface physical properties.
Additionally, glossiness and surface roughness were estimated based on gloss unit (GU) values provided by material manufacturers (e.g., Asian Paints for painted surfaces, laminate suppliers for finishes). For some materials such as papers or specialty finishes, gloss levels were assessed visually under controlled illumination conditions to categorize them as matte, semi-gloss, or glossy. These gloss assessments were then translated into roughness values for the virtual materials in UE5 (Wotton, 2000; Decrolux, 2023).
Reflection factors (approximate diffuse reflectance) for materials were estimated using published literature values for typical surface types (e.g., matte paints ∼5–6%, white paper ∼65%, ceilings ∼70%) and cross-checked visually by comparing the brightness and reflectance under uniform lighting (Jakubiec, 2023). Albedo values were approximated from the measured RGB readings under controlled light conditions and converted into normalized reflectance values to guide Base Color settings in the virtual environment. These surface property estimations ensured consistency between real-world materials and their virtual counterparts (Games, 2024).
3.1.3 Light source specifications
Four ceiling-mounted luminaires (Havells brand) were utilized, each requiring 15 W of system power and providing an output of 1,550 (≥1,500) lumens. These luminaires have a color rendering index (CRI) exceeding 80. The correlated color temperature (CCT) is specified at 5700 K. Each luminaire is designed with an inner beam angle of zero degree and an outer beam angle of 120°, ensuring broad, uniform light distribution (Supplementary Appendix A).
3.2 VR environment setup
3.2.1 3D modelling and virtual environment configuration
A three-dimensional model of the test spaces was developed in SketchUp, using precise measurements from the real-world environment. This model was then imported into Unreal Engine 5.3.2 (UE5) via the Datasmith Direct Link tool. Within UE5, materials were applied based on previously collected RGB values and textures derived from photographs of the physical environment. Test grids were created by applying an image of the grid pattern as a material texture sample. All indoor surface properties, including material type, texture, color, reflectance percentage, and albedo, were matched with real-world values as detailed in Table 1. To eliminate external illumination sources, both the SunSky and Volumetric Cloud settings were disabled.
The virtual lighting setup in UE5 used spotlights with a lumen output of 1,550, matching the real-world luminaires in terms of beam angles and color temperature. Additional settings in UE5 were configured with Indirect Lighting Intensity and Volumetric Scattering set to 1.0, and PostProcess Volume, Global Illumination, and Reflection Method set to Lumen Only. Ray Tracing Reflections remained at default values. Light placement was executed to replicate the exact positioning and parameters of the physical setup, thus mimicking the real-world lighting environment.
3.2.2 Data collection protocol in VR
The data collection procedure in this experiment follows a two-step approach to measure lux levels under virtual lighting conditions. In the first step, lux measurements for each data point in UE5 are obtained through a systematic process. This involves navigating to the Show menu, selecting Visualize, and enabling HDR Eye Adaptation. The cursor is then positioned precisely on each designated test point on the virtual test surface within the VR environment to record lux values. This procedure is repeated for all three lighting arrangements. Measurements are taken separately for horizontal and vertical test surfaces, resulting in a total of six iterations (Figure 2). In the second step, the distance of each data point from the light sources is measured. The Euclidean distance of each data point is calculated using the Pythagorean theorem. This distance will serve as an independent variable in predictive analysis.
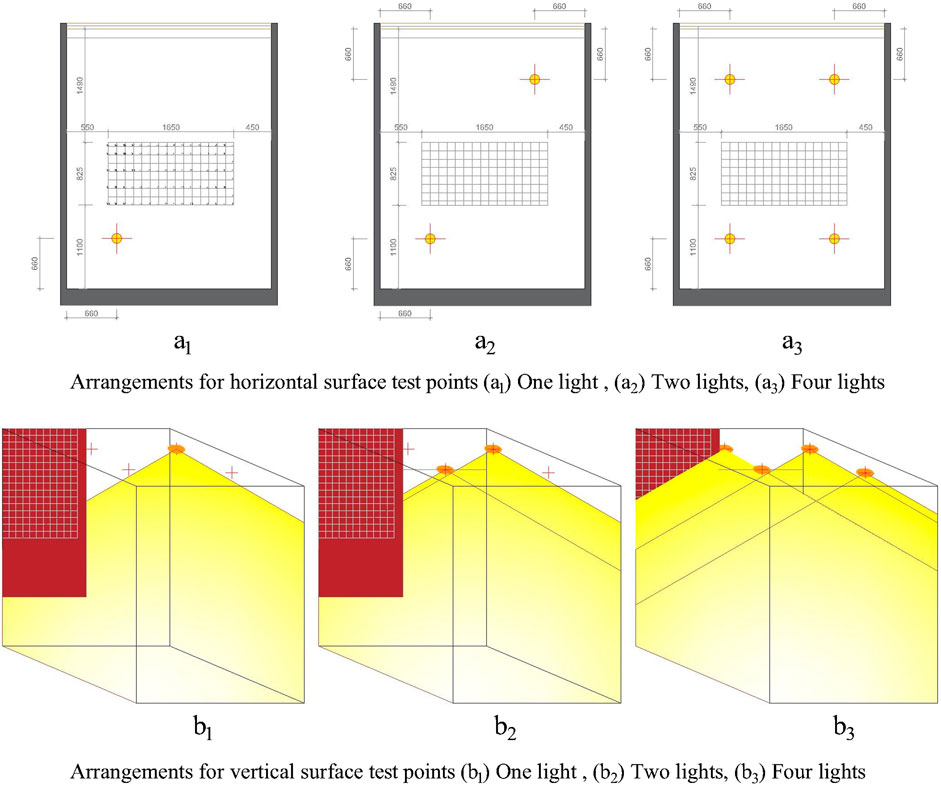
Figure 2. Lighting configuration for experimental setups.
With respect to computer display effect, the HDR Eye Adaptation tool in Unreal Engine dynamically adjusts exposure in response to scene lighting, simulating the adaptive response of human vision to variations in brightness. However, in this study, lux readings were obtained from the UE5 lighting engine computations, which are independent of the monitor’s brightness or contrast settings. While variations in monitor brightness may affect the visual perception of the scene, they do not influence the lux values computed by Unreal Engine. Thus, display settings did not impact the illumination readings during the data collection process.
3.3 Calibration and analysis procedure
The calibration procedure consists of three steps: Data collection from both the environments and comparison including descriptive statistical analysis, regression analysis to identify adjusted VR value for calibration for different lighting arrangements and lastly validation and accuracy assessment by comparing the adjusted VR data with the real-world data. Figure 3 represents the step by step data collection, analysis and reporting procedure.
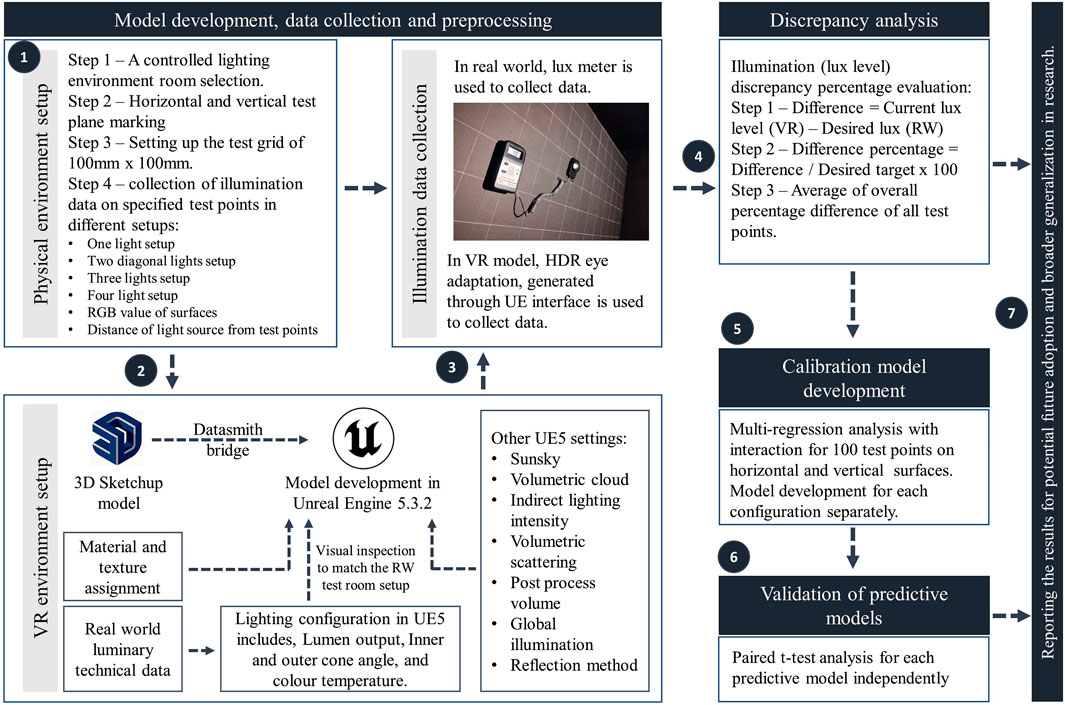
Figure 3. Brief experiment procedure depicting steps from test space selection to result reporting (source: author).
3.3.1 Data comparison and pre-processing
In the first step, the difference between the lux level (measured in the VR environment) and the desired lux level (targeted real-world measurement) on all test points were calculated. Thereafter, to understand the relative magnitude of the discrepancy, the difference was further expressed as a percentage of the desired target lux level. This calculation provided a standardized measure to assess the intensity of adjustment needed across different lighting scenarios. This percentage metric allows for a clear interpretation of how much the current lux level in the VR environment deviates from the real-world target. The results of this comparison indicated that in most cases, an increment in lighting intensity is required within the VR environment to match the real-world lux levels. This adjustment is essential for achieving a closer alignment between VR simulations and real-world conditions, thereby enhancing the illumination accuracy of the virtual setup for further analysis (reported in Section 4.1).
3.3.2 Calibration strategy
Following the initial assessment of intensity discrepancies, the primary objective is to determine adjusted VR illuminance values. Therefore, regression analysis was performed to enable the quantification of relationships among variables (Marill, 2004; Uyanık and Güler, 2013). In this study, the dependent variable is the illuminance level (lux) in the VR environment, while the independent variables include real-world illuminance readings (lux) and the Euclidean distance of each test point from the luminaires. Regression analysis also facilitates the identification of statistically significant factors, the incorporation of interaction effects (such as distances from light sources), and ultimately the development of a predictive VR calibration model. To maintain the model’s practicality and manage complexity, variables such as reflection percentage and color rendering index were excluded.
3.3.3 Validation and accuracy assessment
To evaluate the accuracy of the predictive VR calibration model, this study conducted a validation using a new set of test points on both horizontal and vertical surfaces. The predictive models were initially developed using 100 test points collected across various setups. The additional 28 and 20 points were then used to compare the predicted illumination values with the actual values obtained from the VR and real-world environments. Subsequently, the predictive models were assessed in cross-space application using residual analysis to assess consistency and robustness under diverse conditions, thereby demonstrating the model’s adaptability (Verran and Ferketich, 1987; Santos Nobre and da Motta Singer, 2007). Similar validation approaches have been widely applied in research for predictive models, including those for annual energy consumption and monthly heating demand predictions (Catalina et al., 2008; Mottahedi et al., 2015).
4 Data analysis
4.1 Discrepancy evaluation
Discrepancy in real and VR environment is checked using two different approaches. In first, the variability in illumination level has been screened using a comparative analysis approach involving real-world, DIALux, and Unreal Engine data. This method not only helps in identifying the fidelity of lighting simulation tools but also validates the accuracy of modeling. The first step checks whether real-world data aligns more closely with DIALux while diverging from UE5, which would suggest that the issue lies primarily with UE’s illumination algorithms. Alternatively, if both DIALux and UE5 deviate from real-world data, the discrepancies may originate from inaccuracies in 3D modeling or material properties.
To examine this issue, illumination data were collected from 16 points on horizontal surfaces and 11 points on vertical surfaces, arranged along two imaginary cross-diagonal lines (Figure 4). The percentage error between real-world and DIALux values on horizontal surfaces was minimal—0% with one light, −4% with two lights, and −5% with four lights—indicating that DIALux accurately replicates real-world lighting conditions on flat horizontal planes. In contrast, DIALux overestimated illumination by approximately 20% on vertical surfaces under one- and two-light scenarios and underestimated it by 10% under the four-light condition (Refer Supplementary Appendix B). The VR environment created in Unreal Engine (UE), however, showed substantial underestimation across all scenarios. On horizontal surfaces, the error ranged from 52% to 61%, while vertical surfaces exhibited even greater discrepancies, with errors between 84% and 92%. These findings reveal a significant gap in UE’s ability to simulate real-world lighting, particularly on vertical planes. Thus, this analysis confirms that while DIALux offers reliable alignment with real-world lighting on most surfaces, Unreal Engine’s lighting setup may require further calibration or modification to improve simulation accuracy (Figure 5).
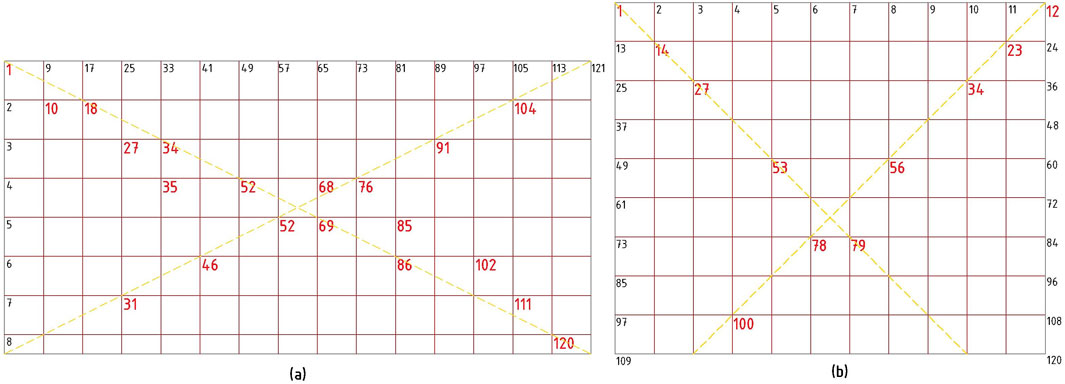
Figure 4. Selected test points (red color) for discrepancy evaluation, (a) horizontal surface, (b) vertical surface.
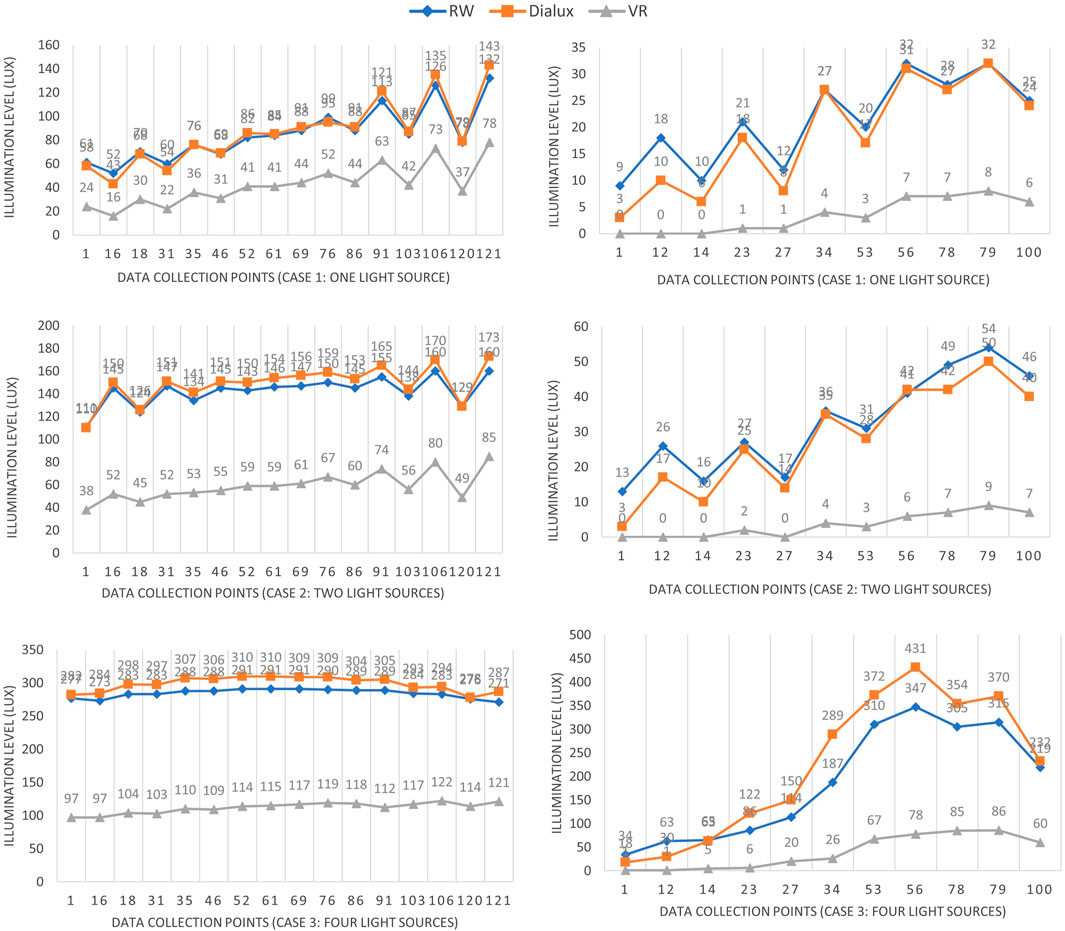
Figure 5. Illumination variation in real-world, dialux evo and VR environment of UE5, left-side graphs representing horizontal plane and right-side graphs representing vertical plane.
The second approach for discrepancy evaluation involved a descriptive statistical analysis conducted across horizontal and vertical surfaces, with measurements taken at 100 test points for each lighting scenario. In the one-light source condition, the horizontal surface exhibited an average deviation of 41.34 lux, indicating the need for a 53.49% increase in light intensity within the VR environment to align with real-world conditions. Conversely, the vertical surface showed a deviation of 21.2 lux, necessitating 82.78% adjustment. Under the two-light source scenario, the horizontal surface showed an average difference of 84.12 lux requiring a 59.69% increase, while the vertical surface recorded a deviation of 32.12 lux requiring 88.19% increase. Finally, in the four-light source scenario, the horizontal and vertical surfaces showed differences of 174.23 lux requiring 61.05% increase and 164.76 lux requiring an 82.35% increase, respectively (Table 2).
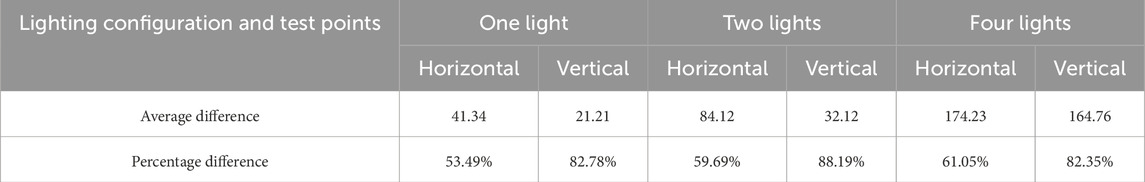
Table 2. Illumination variation presentation through average difference.
Both the analysis indicates that DIALux closely replicates real-world lighting with minimal error (0% to −5% on horizontal and ±20% on vertical surfaces), Unreal Engine underestimates illumination significantly, requiring 53%–82% correction on horizontal and 83%–88% on vertical surfaces. This confirms that UE’s lighting simulation, particularly on vertical planes, needs substantial calibration for accuracy.
4.2 Lighting calibration for scientific illumination accuracy
In order to frame calibration model of each scenario and to assess the relationship between real-world and VR lighting intensities, multiple linear regression with interaction terms analysis were adopted. Accordingly, 100 test points on a horizontal surface and 100 test points on a vertical surface were analyzed as per the predefined methodology to build multiple regression model. In the study, predictive models for varying light source configurations are developed by analyzing interactions between lux levels at test points and their respective distances from light sources. For a single light source, the interaction is defined as the product of the lux level at the test point (real-world data) and the distance from the light source. For two light sources, two interactions are considered: (1) the lux level contributed by both sources at the test point multiplied by the distance from the first light source, and (2) the same lux level multiplied by the distance from the second light source. Similarly, for four light sources, four interactions are defined, following the same pattern of lux level contribution at the test point multiplied by distances from each of the four light sources. These interactions form the basis for generating predictive models for multi-source lighting scenarios.
4.2.1 For horizontal test surface
In case of single light source, the regression model shows excellent fit (R2 = 0.998), explaining 99.76% of the variance. Lux level by one light source (β = 1.60, p < 0.0001) and the interaction term (β = −0.00061, p < 0.000001) significantly influence the dependent variable. Distance alone was not statistically significant (p = 0.127) (Figure 6). Predictive formula,
Where X1 is Illumination level (Lux) in real world, X2 is distance from the light source, X1X2 (illumination intensity in real-world multiply with distance from the light source) presents interaction term. Model validation for the one-light condition on the horizontal plane showed excellent predictive accuracy (R2 = 0.997) with low prediction errors (RMSE = 0.75 lx, MAE = 0.59 lx, SE = 0.77 lx). Although formal normality tests (Kolmogorov–Smirnov, p = 0.014; Shapiro–Wilk, p = 0.001) indicated slight deviations from normality, the Q–Q plot exhibited near-linear alignment, suggesting that the residuals are approximately normal and thus suitable for parametric analysis.
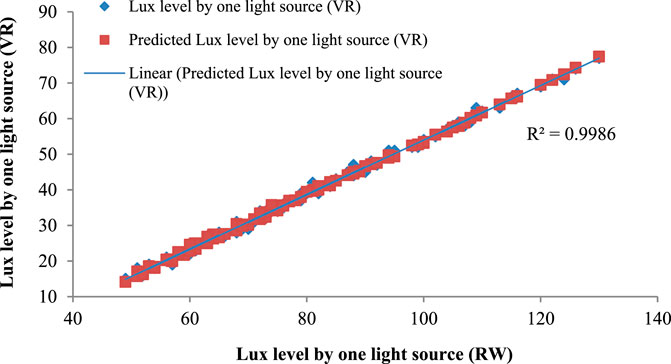
Figure 6. Regression fit for horizontal plane: VR illumination vs. predicted illumination (one light).
High multicollinearity (VIF >10) was observed due to the interaction term; however, this is acceptable given the model’s predictive (rather than causal) intent.
In case of two light setup, the regression analysis reveals that (R2 = 0.993) explains 99.3% of the variance in the dependent variable. Lux level (β = −1.31, p = 0.0035) and distance from the first light source (β = −0.073, p < 0.00001) significantly affect the outcome. Interaction terms 1 and 2 are also statistically significant (p < 0.001), (Figure 7). Prediction Formula,
WhereX1 is Illumination intensity (Lux) by two light sources, X2 is distance from first light source, X3 is distance from second light source and X4 is interaction one (illumination intensity in real-world multiply with distance from first light source) X5 is interaction two (illumination intensity in real-world multiply with distance from second light source). Model validation demonstrated excellent predictive performance, with a high coefficient of determination (R2 = 0.992) and low prediction errors (RMSE = 0.90 lx, MAE = 0.71 lx, SE = 0.92 lx). Residual analysis indicated minor deviations from normality: although the Kolmogorov–Smirnov (p = 0.001) and Shapiro–Wilk (p = 0.010) tests suggested slight departures, the Q–Q plot exhibited near-linear alignment, implying that the residuals were approximately normally distributed and thus appropriate for parametric analyses. Multicollinearity was elevated (VIF >10) owing to the interaction term; however, this was considered acceptable given the model’s exploratory and predictive focus.
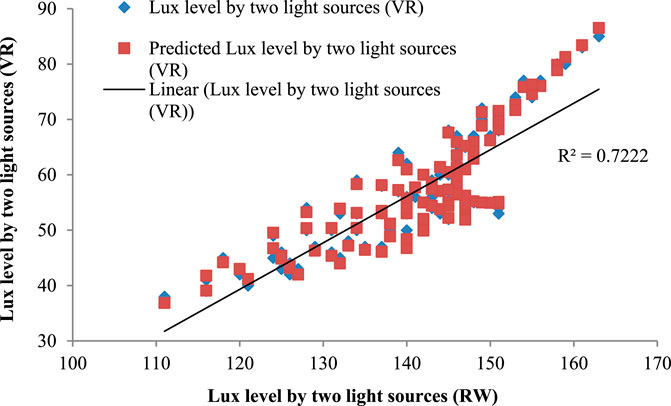
Figure 7. Regression fit for horizontal plane: VR illumination vs. predicted illumination (two lights).
In case of four lights setup, the regression model explains the R2 = 0.986 or 98.6% of the variance in the dependent variable using lux levels, distances from light sources, and interaction terms. The lux level (β = −4.81, p = 0.038) and distance from the second light (β = −0.998, p = 0.033) significantly influence the outcome. Interaction 2 is also significant (β = 0.0035, p = 0.031), indicating a combined effect of variables. The model is statistically robust (F = 696.52, p < 0.00001) (Figure 8). Prediction formula,
Where X1 is illumination intensity (lux) by four light sources in real-world, X2 is distance from first light source, X3 is distance from second light source, X4 is distance from third light source, X5 is distance from fourth light source, X6 is interaction one (illumination intensity in real-world multiply with distance from first light source), X7 is interaction two (illumination intensity in real-world multiply with distance from second light source), and X8 is interaction three (illumination intensity in real-world multiply with distance from third light source) and X9 is interaction four (illumination intensity in real-world multiply with distance from fourth light source). The model showed strong predictive performance (R2 = 0.985; RMSE = 1.161 lx; MAE = 0.879 lx; SE = 1.224 lx). Residuals exhibited minor deviations from normality (Shapiro–Wilk p = 0.001) but Q–Q plots indicate near-linear alignment, supporting approximate normality for parametric analyses. High multicollinearity (VIF 14,467–443,788) reflects inherent geometric and photometric dependencies of multiple sources, consistent with the inverse-square law, and does not compromise predictive accuracy (Refer to Supplementary Appendix C for multicollinearity diagnostics, Supplementary Appendix D for residual normality analysis, and Supplementary Appendix E for homoscedasticity examination).
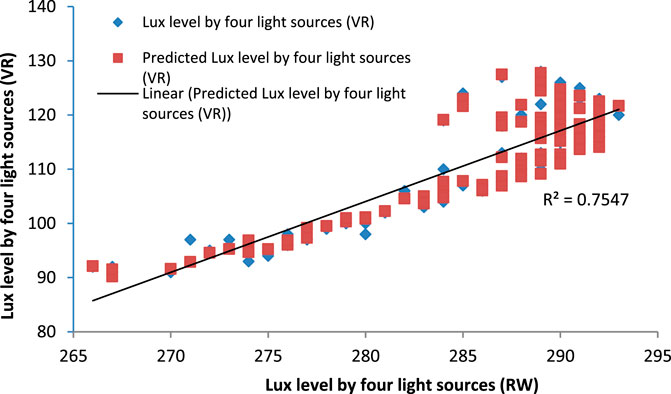
Figure 8. Regression fit for horizontal plane: VR illumination vs. predicted illumination (four lights).
4.2.2 For vertical test surface
In the case of one light source, the regression model (R2 = 0.9874) explains 98.74% of the variance in VR lux levels. Lux level by one light (β = −0.1657, p = 0.0008), distance from the first light (β = −0.0083, p < 1.6 × 10⁻⁸), and their interaction (β = 0.00065, p < 2.3 × 10⁻²¹) are statistically significant predictors. Therefore, the prediction model for one luminary is,
Where X1 is illumination level (lux) by one light source in real-world, X2 is distance from first light source, and X3 is interaction term (real-world lux level multiply with distance from the light source). For the one-light vertical condition, the model showed strong fit (R2 = 0.987; RMSE = 0.916 lx; MAE = 0.649 lx; SE = 0.935 lx). However, residuals significantly deviate from normality (Kolmogorov–Smirnov and Shapiro–Wilk p = 0.000), exhibiting right skewness (≈2.0) and leptokurtosis (≈3.9), with Q–Q plots deviating from linearity. VIF values (3.72–103.41) indicate moderate to high multicollinearity, especially between lux and the interaction term. These violations of normality and multicollinearity compromise the validity of parametric inferences, preventing reliable use of the derived prediction formula for vertical illuminance.
In case of two light sources, the multiple regression model (R2 = 0.9878, p < 0.0001) significantly predicts VR lux values using real-world lux, distances, and interactions. Lux (β = 0.3039), distance 1 (β = −0.0135), distance 2 (β = 0.0086), interaction 1 (β = 0.00039), and interaction 2 (β = −0.00021) are all statistically significant (p < 0.001). Therefore, the prediction model for two luminaries,
Where X1 is real-world lux level by two light sources, X2 and X3 are the distances from light sources, X4 and X5 are interaction. The model exhibited strong fit (R2 = 0.987; RMSE = 0.907 lx; MAE = 0.657 lx; SE = 0.936 lx). Residuals significantly deviate from normality (Kolmogorov–Smirnov and Shapiro–Wilk p < 0.05), showing positive skewness (≈1.9) and leptokurtosis (≈3.4), with histograms and Q–Q plots confirming non-normality. VIF values (7.02–147.15) indicate moderate to high multicollinearity, especially between total lux and interaction terms, arising naturally from the additive effects of dual sources. These violations undermine parametric assumptions, limiting reliable use of the derived prediction formula.
In case of four lights source, the regression analysis demonstrates (R2 = 0.9842, p < 0.0001) shows a strong predictive relationship between VR lux values and real-world lux, distances from four light sources, and interaction terms. Notably, lux by RW lights (β = 41.27, p < 0.000001), Distance 4 (β = 2.30), and Interaction 1 (β = 0.0049) significantly impact VR readings. Therefore, the prediction model for one luminary,
Where, X1 is illumination level (lux) by four light sources in real-world, X2 to X5 are distances from first to fourth light sources, and X6 to X8 are interaction terms for each light. Moreover, the figures of regression fit for vertical test plane are presented in supplementary file. For the four-light condition, the model showed strong fit (R2 = 0.984; RMSE = 3.538 lx; MAE = 2.746 lx; SE = 3.709 lx). Residuals deviate significantly from normality (Kolmogorov–Smirnov and Shapiro–Wilk p < 0.05), with slight negative skewness (≈−0.08) and platykurtic distributions (≈−1.35), indicating flatter tails. VIF values are extremely high (91.99 to >3.2 × 10⁶), reflecting near-perfect multicollinearity due to additive and spatially coupled light interactions. These violations of normality and collinearity limit reliability of the predictive formula for extreme illumination values. Table 3 presents an overview of the standard error metrics for all configurations.
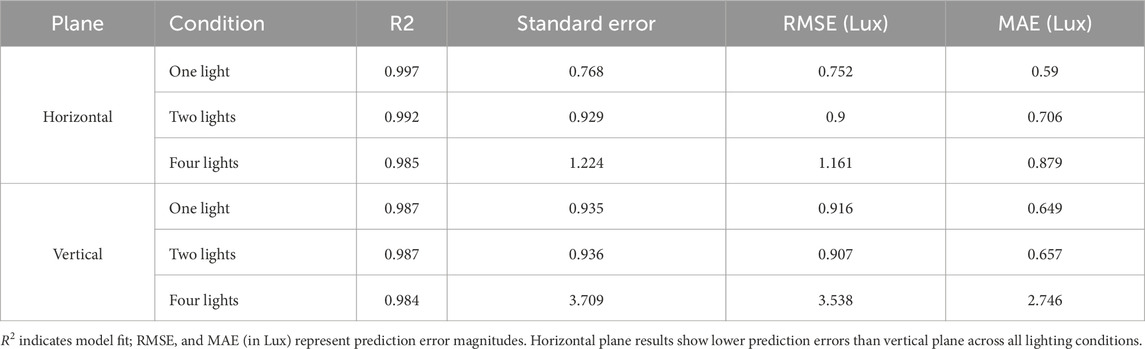
Table 3. Standard error summary of Multiple Linear Regression models for Lux prediction under one-, two-, and four-light-source conditions across horizontal and vertical planes.
It is to note that the results of residual normality analysis of MLR models revealed significant deviation from normality for all the cases of vertical plane scenarios, as evidenced by p-values below 0.05 in both the Kolmogorov-Smirnov and Shapiro-Wilk tests, supported by skewed histograms and non-linear Q-Q plots. Consequently, the model predictions may deviate from the actual responses, potentially affecting the accuracy and reliability of statistical inferences derived from the proposed MLR models.
4.3 Validation analysis for predictive models on extended test points
In order to validate the predictive models, a comparison between VR data and predictive VR data generated through predictive models were analyzed for both horizontal and vertical surfaces on the same surfaces. It was the same surface on which were used to generate the predictive formulas. An extended 28 test points and 20 extended test points, were taken from the same grid for horizontal and vertical surfaces respectively. For horizontal test surface considering one, two and four light source configurations, the plot shows that the VR predicted values closely follow the VR data trend, with minor deviations. Peaks and slopes are well captured, indicating a good prediction model alignment overall. Though, specifically for four light sources, it is to note that beyond 107 lux (VR illumination value) the predictive model needs more refinement for precise prediction.
Similarly, generated data from predictive models for vertical test points represents that predicted VR values closely follow the real VR data across the rise and sharp dip. The maximum difference near the peak shows high prediction accuracy. Post-dip, both curves align tightly, suggesting that the model captures the trend and magnitude of change effectively (Figure 9).
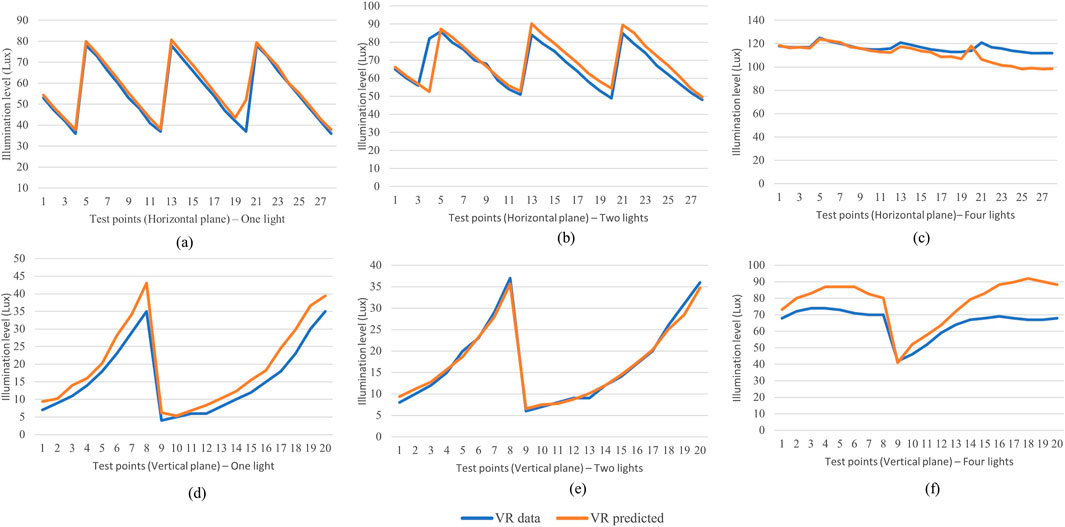
Figure 9. Comparative Plot: VR vs. VR predicted illumination level. Horizontal plane: (a) one light, (b) two lights, (c) four lights; Vertical plane: (d) one light, (e) two lights, (f) four lights.
5 Validation through cross-space application
To evaluate the applicability of the proposed predictive models within a specific context, a moderately complex lighting configuration was selected for analysis, featuring a grid-iron arrangement of multiple luminaires, representing a realistic yet scenario-specific lighting setup. For this purpose, a detailed office setup located in Manipal (Latitude: 13.340681, Longitude: 74.794826) was modeled. Comprehensive data on physical surface properties were collected, including RGB values, glossiness, reflection factors, and illumination levels. Illuminance (in Lux) measurements were recorded on both horizontal and vertical surfaces at 60 designated test points using a lux meter. The testing grids were carefully located the model, thereby validating its potential for broader application—specifically, its adaptability across lighting schemes ranging from single to multiple luminaire configurations. All the readings were taken during night time (Figure 10).
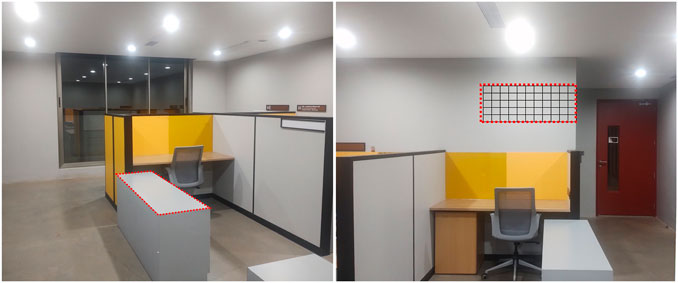
Figure 10. Test grids on horizontal and vertical planes for cross space evaluation.
Secondly, a detailed VR model was developed to closely replicate the real-world environment, incorporating similar surface and photometric properties. To achieve this, the interior surface characteristics in the VR model were carefully adjusted—this included setting the specular map for reflection percentage, modifying roughness, and configuring diffuse scattering with high albedo for soft light diffusion. The lighting setup involved placing luminaires with a cone angle adjustment to 120°, a lumen output of 1175 lumens, and a color temperature of 5700K. Additionally, a Post-Processing Volume was adjusted to enhance visual accuracy. Illumination intensity values (in lux) were then recorded using the HDR adaptation tool for subsequent comparative analysis. Then predictive models were used to generate the illumination intensities using “Y = 1,382.46 - 4.81X1 - 0.59X2 - 0.998X3 + 0.346X4 + 0.512X5 + 0.002X6 + 0.0035X7 - 0.0011X8 - 0.0017X9” and “Y = 2.424-0.1657X1-0.0083X2+0.00065X3” for horizontal and vertical test surfaces respectively. This collected data of real word analysis was further evaluated statistically using residual analysis to determine how effectively the model captured the differences between observed (real-world) and predicted (VR) values.
Residual analysis over the horizontal surface (storage unit) indicates that VR illumination predictions are closely aligned with real-world values, with no significant systematic bias. Residuals range from −12 to +18 lux, corresponding to minor errors of approximately 4.4% underprediction and 6.6% overprediction (Figure 11). However, when evaluating predictions across multiple spatial settings, a consistent underestimation of real-world illuminance by the VR-based model was observed. To correct this bias, a constant offset of +145 lux was applied, which improved residual alignment around the zero line and enhanced overall model accuracy. This offset remained consistent across various lighting and spatial conditions, supporting its validity as a calibration adjustment within empirical validation practices.
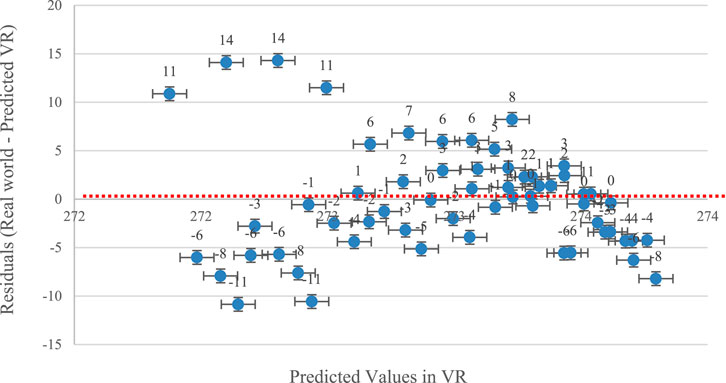
Figure 11. Residual plots demonstrating minimal deviation from zero for test horizontal surface data.
For the vertical surface (wall in the office space), residual analysis of vertical surfaces showed inconsistent underprediction of real-world illuminance by the VR-based model, with correction values ranging from +60 to +110 lux across different data points. This contrasts with the consistent +145 lux offset applied for horizontal surfaces. The variability in required correction indicates that the current model does not adequately account for vertical orientation-specific lighting behavior. Factors influencing this might include spatial occlusion, and or limitations in simulating lighting within the VR environment. Due to this inconsistency, a uniform offset was not applied. These results indicate the need for a context-specific calibration approach, supported by advanced and computationally robust methods, to develop an improved predictive model for cross-space application, specifically addressing vertical lighting distribution.
6 Discussion
The study reviews and examines the discrepancies and potential calibration models for lighting in virtual reality (VR) environments across four distinct artificial lighting configurations. This research is unique in its specific focus on replicating and aligning real-world lighting setups with their VR counterparts, emphasizing accurate lighting distribution. Initially, the study adopts a broad perspective to explore and understand discrepancies between real-world and VR lighting scenarios, while reviewing related studies to identify suitable calibration approaches. Following the reporting of findings from the initial inquiries in the literature review, the study advances through an experimental framework designed to address the key research questions as follows.
6.1 Degree of disparity in lighting intensity
Currently, available research on lighting in VR environments presents the rigorous efforts taken by the researchers to report the difference with real-world attributes. The researchers reported the variability in both qualitative and quantitative aspects (Abd-Alhamid et al., 2019). Specifically, in subjective research the responses are based on participants perception on a given scale (low to high brightness, visual comfort - cozy to desolate, warm to cold, sense of presence, etc.) (Chen et al., 2019; Mirdamadi et al., 2023; Scorpio et al., 2023), which can only provide basic understanding of illumination intensity. However, these studies supports VR as a promising technology to map human behavior or task performance (Bellazzi et al., 2022). Yet, it cannot fully replicate the complex and multifaceted experience of light in real environments, and results should therefore be interpreted with caution. On the other hand, quantitative researches are highly limited, which could provide précised lighting discrepancy for different illuminance levels with different lighting configurations. None the less, reporting is also required for different task-based lighting intensities to replicate more complex lighting setups. Only one study specifically addresses lighting distribution on the working plane based on participants’ responses to varying lighting intensity levels. It reports that task performance is affected at 300 and 400 lumens but does not account for illumination differences in comparison to in-situ conditions (Chokwitthaya et al., 2017). In contrast, this research highlights a pronounced disparity in empirical values, reporting a 53%–61% difference in lux levels between real-world and VR environments on horizontal surfaces under various lighting configurations. Additionally, the study identified an even greater difference of 82%–88% on vertical surfaces. These higher discrepancies on vertical surfaces are likely influenced by factors such as occlusion effects from nearby geometry and inaccurate reflectance representation of material surfaces in Unreal Engine. These conditions often lead to insufficient indirect lighting and exaggerated shadowing on non-horizontal planes. Future calibration strategies could involve refining reflectance parameters, improving global illumination sampling, or employing ray-traced lighting methods to enhance vertical surface accuracy. Furthermore, these findings demonstrate a significant variation in lighting distribution between real-world and VR environments. This section of the study also provides a foundation for future research to explore light source calibration, guided by the percentage differences reported here, and to analyze strategies for enhancing visual fidelity.
6.2 Optimized and practical calibration approach
In the context of lighting calibration studies, various aspects such as display brightness (Omidfar Sawyer and Chamilothori, 2019; Kong et al., 2023), color accuracy (Murray et al., 2022), head-mounted display (HMD) calibration (Gil Rodríguez et al., 2022), and light source and color temperature calibration (Billger et al., 2004) have been meaningfully explored. Many of these studies adopt a subjective approach, offering important insights into user perception and visual fidelity. Foundational work by Scorpio focuses on calibration under a single light source and provides valuable directional understanding. However, opportunities remain to further advance this area by introducing contextualized, percentage-based metrics and standardized unit-based reporting for broader applicability. The present study contributes to this progression by recommending and evaluating practical calibration models for distinct lighting configurations in virtual environments and proves applicability on horizontal working planes. These models exhibit strong performance, particularly under lower lux levels, with systematic residual patterns that can be effectively corrected. Furthermore, the study proposes predictive models suited to linear and grid-based lighting arrangements, while establishing the need for more advanced approaches to address the complexity of non-linear or random lighting scenarios. This research thus extends existing literature by offering structured, data-driven calibration strategies applicable to scientific studies involving real-world and virtual lighting comparisons.
6.3 Practical implications
Virtual reality (VR) is rapidly becoming a transformative tool for lighting research in built environments, enabling predictive analyses that inform sustainable architectural design (Saeidi et al., 2015; Fathy et al., 2023; Fathi et al., 2025). When properly calibrated, VR can faithfully replicate real-world lighting conditions, which is essential as lighting requirements vary widely with different activities—ranging from walking to surgery—each demanding precise illumination levels (Whyte, 2007; Khor et al., 2016; Konstantzos et al., 2020). This research provides built-space designers and lighting professionals a robust methodology to bridge the gap between virtual and actual illumination, ensuring more accurate horizontal lighting distribution and supporting evidence-based design decisions. By introducing a systematic calibration framework and validated prediction models, the study enhances the realism and reliability of VR lighting simulations for research and practical applications (Augenbroe, 2004). The outcomes contribute significantly to SDG 7 (Affordable and Clean Energy) and SDG 11 (Sustainable Cities and Communities), promoting sustainable, human-centric built environments.
7 Limitations and future research
A primary strength and limitation of this study is its focus on quantitative illumination outcomes without incorporating perceptual observations. Future research could benefit from integrating both aspects to achieve a more comprehensive understanding of lighting accuracy in virtual environments. Secondly, the study provides reliable results for low-intensity linear light distributions but shows limitations in modeling high-intensity lighting with the same precision. Complex luminaire arrangements, which are common in specialized environments, were not explored in depth and remain an area for further study. Machine learning or other advanced modeling techniques could be employed to enhance the predictive capabilities of future models. Thirdly, due to the unavailability of high-precision spectrophotometers, surface reflectance was estimated using a lux meter by calculating the ratio of reflected to incident light, a method commonly used in daylighting and built-environment studies (Makaremi et al., 2017). Color differences were analyzed using a calibrated camera with controlled white balance. Results were validated by cross-checking known material properties and adjusting the VR model accordingly. Although these indirect methods may introduce minor inaccuracies in reflectance and albedo estimation, their influence on the overall illumination output is expected to be minimal, given the model’s strong predictive agreement with empirical data. Fourth, the study developed separate regression models for 1-, 2-, and 4-light configurations but did not tested their cross-application. The negligible coefficients (e.g., X6 onward in the 4-light model) suggest simpler configurations may perform equally well, highlighting a need for comparative validation to determine optimal model complexity, which can be considered for further research.
Lastly, the need for scenario-specific predictive models remains a limitation. Future research should aim to develop a unified framework that integrates both horizontal and vertical predictions for broader practical applicability.
8 Conclusion
This study reveals that visual fidelity in VR cannot reliably represent accurate illumination levels, as most VR software is primarily developed for gaming rather than scientific lighting analysis. It distinguishes between visually oriented applications and those requiring precise, data-driven illumination modeling. The research introduces a novel calibration method for multi-light configurations, enabling more accurate lighting simulations essential for scientific investigations in the built environment specifically for horizontal working plane. The findings highlight key considerations for applying the model in research-oriented VR applications:
For illumination difference, both cross-diagonal and statistical analyses confirm that DIALux reliably replicates real-world illumination across surfaces, while Unreal Engine significantly underestimates lighting—particularly on vertical planes—requiring correction factors ranging from 53% to 88%. These results underscore the necessity of calibrating UE’s lighting engine to enhance accuracy in virtual simulations of built environments.
The VR calibration model effectively replicates real-world lux values on horizontal surfaces. However, for vertical surfaces, a more advanced and context-specific calibration approach is required. The predictive models developed in this study exhibit strong linear relationships and statistical significance in estimating illumination levels. Nonetheless, further refinement is necessary, particularly under higher intensity conditions and scenarios involving multiple luminaires.
Cross-space validation shows the strong agreement with real-world horizontal surface measurements (residuals: –12 to +18 lux, errors ≤6.6%), but a consistent −145 lux bias was corrected via calibration. Vertical surface predictions, however, exhibited variable underprediction (+60 to +110 lux), highlighting orientation-dependent limitations and the need for context-specific model refinements. These minimal, unbiased errors confirm the model’s robustness and suitability for accurate VR-based lighting simulations across varied spatial conditions.
Overall, the study underscores the model’s adaptability while identifying areas for improvement to enhance its broader applicability. Nonetheless, this study identifies critical areas requiring attention for complex lighting configurations in VR environments and offers robust predictive models for standard or grid-pattern luminaire arrangements, which are commonly practiced.
Data availability statement
The raw data supporting the conclusions of this article will be made available by the authors, without undue reservation.
Author contributions
RK: Conceptualization, Data curation, Writing – original draft, Writing – review and editing. DD: Supervision, Writing – original draft, Writing – review and editing. PG: Formal Analysis, Methodology, Writing – review and editing. KS: Investigation, Validation, Visualization, Writing – review and editing.
Funding
The author(s) declare that no financial support was received for the research and/or publication of this article.
Acknowledgments
The author sincerely thanks Ramaswamy RN from MSDC, Manipal, for his invaluable support during the development and examination of the VR environment. The author also gratefully acknowledges Havells Lighting for generously providing luminaries for experimental purposes. Their support greatly contributed to the progress and quality of this work.
Conflict of interest
The authors declare that the research was conducted in the absence of any commercial or financial relationships that could be construed as a potential conflict of interest.
Generative AI statement
The author(s) declare that no Generative AI was used in the creation of this manuscript.
Any alternative text (alt text) provided alongside figures in this article has been generated by Frontiers with the support of artificial intelligence and reasonable efforts have been made to ensure accuracy, including review by the authors wherever possible. If you identify any issues, please contact us.
Publisher’s note
All claims expressed in this article are solely those of the authors and do not necessarily represent those of their affiliated organizations, or those of the publisher, the editors and the reviewers. Any product that may be evaluated in this article, or claim that may be made by its manufacturer, is not guaranteed or endorsed by the publisher.
Supplementary material
The Supplementary Material for this article can be found online at: https://www.frontiersin.org/articles/10.3389/fbuil.2025.1707371/full#supplementary-material
References
Abd-Alhamid, F., Kent, M., Bennett, C., Calautit, J., and Wu, Y. (2019). Developing an innovative method for visual perception evaluation in a physical-based virtual environment. Build. Environ. 162, 106278. doi:10.1016/j.buildenv.2019.106278
Arthur, E., Hancock, P., and Chrysler, S. (1997). The perception of spatial layout in real and virtual worlds. Ergonomics 40, 69–77. doi:10.1080/001401397188387
Augenbroe, G. (2004). “Trends in building simulation,” in Advanced building simulation (London: Routledge), 18–38. doi:10.4324/9780203073674
Bellazzi, A., Bellia, L., Chinazzo, G., Corbisiero, F., D’Agostino, P., Devitofrancesco, A., et al. (2022). Virtual reality for assessing visual quality and lighting perception: a systematic review. Build. Environ. 209, 108674. doi:10.1016/j.buildenv.2021.108674
Billger, M., Heldal, I., Stahre, B., and Renstrom, K. (2004). “Perception of color and space in virtual reality: a comparison between a real room and virtual reality models,” in Human vision and electronic imaging IX, (SPIE), 90–98.
Catalina, T., Virgone, J., and Blanco, E. (2008). Development and validation of regression models to predict monthly heating demand for residential buildings. Energy Build. 40, 1825–1832. doi:10.1016/j.enbuild.2008.04.001
Chamilothori, K., Wienold, J., and Andersen, M. (2019). Adequacy of immersive virtual reality for the perception of daylit spaces: comparison of real and virtual environments. Leukos 15, 203–226. doi:10.1080/15502724.2017.1404918
Chen, Y., Cui, Z., and Hao, L. (2019). Virtual reality in lighting research: comparing physical and virtual lighting environments. Light. Res. and Technol. 51, 820–837. doi:10.1177/1477153518825387
Chokwitthaya, C., Saeidi, S., Zhu, Y., and Kooima, R. (2017). “The impact of lighting simulation discrepancies on human visual perception and energy behavior simulations in immersive virtual environment,” in Computing in civil engineering 2017 (Seattle, Washington: American Society of Civil Engineers), 390–398. doi:10.1061/9780784480830.048
Decrolux (2023). Approximate reflectance values of typical building finishes. Decrolux. Available online at: https://decrolux.com.au/learning-centre/2018/approximate-reflectance-values-of-typical-building-finishes.
Fathi, S., Sabeti, S., Shoghli, O., Heydarian, A., and Balali, V. (2025). Adoption of virtual and augmented reality in the architecture, engineering, construction, and facilities management (AEC-FM): mixed method analysis of trends, gaps, and solutions. Front. Built Environ. 11, 1580639. doi:10.3389/fbuil.2025.1580639
Fathy, F., Mansour, Y., Sabry, H., Refat, M., and Wagdy, A. (2023). Virtual reality and machine learning for predicting visual attention in a daylit exhibition space: a proof of concept. Ain Shams Eng. J. 14, 102098. doi:10.1016/j.asej.2022.102098
Fornasari, L., Chittaro, L., Ieronutti, L., Cottini, L., Dassi, S., Cremaschi, S., et al. (2013). Navigation and exploration of an urban virtual environment by children with autism spectrum disorder compared to children with typical development. Res. Autism Spectr. Disord. 7, 956–965. doi:10.1016/j.rasd.2013.04.007
Gade, V., Gallagher, R., and Deutsch, I. (2013). “Path width, path difficulty and optic flow differentially affect young, older adults and individuals post-stroke in a virtual cycling environment,” in 2013 international conference on virtual rehabilitation (ICVR), 177–182.
Games, E. (2024). Unreal engine 5.4 documentation. Unreal Engine 5.4 Doc. Available online at: https://dev.epicgames.com/documentation/en-us/unreal-engine/unreal-engine-5-4-documentation?application_version=5.4.
Gan, V. J. L., Liu, T., and Li, K. (2022). Integrated BIM and VR for interactive aerodynamic design and wind comfort analysis of modular buildings. Buildings 12, 333. doi:10.3390/buildings12030333
Gil Rodríguez, R., Bayer, F., Toscani, M., Guarnera, D., Guarnera, G. C., and Gegenfurtner, K. R. (2022). Colour calibration of a head mounted display for colour vision research using virtual reality. SN Comput. Sci. 3, 22. doi:10.1007/s42979-021-00855-7
Hegazy, M., Yasufuku, K., and Abe, H. (2021). Validating game engines as a quantitative daylighting simulation tool. Hong Kong 2, 285–294. doi:10.52842/conf.caadria.2021.2.285
Heydarian, A., Carneiro, J. P., Gerber, D., Becerik-Gerber, B., Hayes, T., and Wood, W. (2015a). Immersive virtual environments versus physical built environments: a benchmarking study for building design and user-built environment explorations. Automation Constr. 54, 116–126. doi:10.1016/j.autcon.2015.03.020
Heydarian, A., Pantazis, E., Carneiro, J. P., Gerber, D., and Becerik-Gerber, B. (2015b). “Towards understanding end-user lighting preferences in office spaces by using immersive virtual environments,” in Computing in civil engineering 2015 (Austin, Texas: American Society of Civil Engineers), 475–482. doi:10.1061/9780784479247.059
Hong, Y., and Michalatos, P. (2016). “LumiSpace: a VR architectural daylighting design system,” in SIGGRAPH ASIA 2016 virtual reality meets physical reality: modelling and simulating virtual humans and environments, 1–2.
Hou, L., Tan, Y., Luo, W., Xu, S., Mao, C., and Moon, S. (2022). Towards a more extensive application of off-site construction: a technological review. Int. J. Constr. Manag. 22, 2154–2165. doi:10.1080/15623599.2020.1768463
Jakubiec, J. A. (2023). Data-driven selection of typical opaque material reflectances for lighting simulation. Leukos 19, 176–189. doi:10.1080/15502724.2022.2100788
Jamei, E., Mortimer, M., Seyedmahmoudian, M., Horan, B., and Stojcevski, A. (2017). Investigating the role of virtual reality in planning for sustainable smart cities. Sustainability 9, 2006. doi:10.3390/su9112006
Jayaram, S., Jayaram, U., Wang, Y., Tirumali, H., Lyons, K., and Hart, P. (1999). VADE: a virtual assembly design environment. IEEE Comput. Graph. Appl. 19, 44–50. doi:10.1109/38.799739
Jia, L., Afshari, S., Mishra, S., and Radke, R. J. (2014). Simulation for pre-visualizing and tuning lighting controller behavior. Energy Build. 70, 287–302. doi:10.1016/j.enbuild.2013.11.063
Jichlinski, P. (2003). New diagnostic strategies in the detection and staging of bladder cancer. Curr. Opin. urology 13, 351–355. doi:10.1097/00042307-200309000-00001
Jones, J. A., Swan, J. E., Singh, G., Kolstad, E., and Ellis, S. R. (2008). “The effects of virtual reality, augmented reality, and motion parallax on egocentric depth perception,” in Proceedings of the 5th symposium on applied perception in graphics and visualization, 9–14.
Khor, W. S., Baker, B., Amin, K., Chan, A., Patel, K., and Wong, J. (2016). Augmented and virtual reality in Surgery—The digital surgical environment: applications, limitations and legal pitfalls. Ann. Transl. Med. 4, 454. doi:10.21037/atm.2016.12.23
Kong, G., Chen, P., Wang, L., Chen, S., Yu, J., and Chen, Z. (2023). Calibration of brightness of virtual reality light sources based on user perception in the real environment. J. Build. Eng. 78, 107702. doi:10.1016/j.jobe.2023.107702
Konstantzos, I., Sadeghi, S. A., Kim, M., Xiong, J., and Tzempelikos, A. (2020). The effect of lighting environment on task performance in buildings–A review. Energy Build. 226, 110394. doi:10.1016/j.enbuild.2020.110394
Kuliga, S. F., Thrash, T., Dalton, R. C., and Hölscher, C. (2015). Virtual reality as an empirical research tool—Exploring user experience in a real building and a corresponding virtual model. Comput. Environ. urban Syst. 54, 363–375. doi:10.1016/j.compenvurbsys.2015.09.006
Kumar, R., and Dhar, D. (2023). Unraveling the potential of immersive virtual environments for behavior mapping in the built environment: a mapping review. Hum. Behav. Emerg. Technol. 2023, 1–19. doi:10.1155/2023/8871834
Lee, J., Nam, Y., Cui, M. H., Choi, K. M., and Choi, Y. L. (2007). “Fit evaluation of 3D virtual garment,” in Usability and internationalization. HCI and culture: second international conference on usability and internationalization, UI-HCII 2007, held as part of HCI international 2007, beijing, China, July 22-27, 2007, proceedings, part I 2 (Springer), 550–558.
Liu, Q., and Liu, R. (2025). Virtual reality for indoor emergency evacuation studies: design, development, and implementation review. Saf. Sci. 181, 106678. doi:10.1016/j.ssci.2024.106678
Luo, Y., and Zhang, H. (2023). “Assessing lighting experience using physiological measures: a review,” in International conference on human-computer interaction (Springer), 213–228.
Mahmoudzadeh, P., Afacan, Y., and Adi, M. N. (2021). Analyzing occupants’ control over lighting systems in office settings using immersive virtual environments. Build. Environ. 196, 107823. doi:10.1016/j.buildenv.2021.107823
Makaremi, N., Schiavoni, S., Pisello, A. L., Asdrubali, F., and Cotana, F. (2017). Quantifying the effects of interior surface reflectance on indoor lighting. Energy Procedia 134, 306–316. doi:10.1016/j.egypro.2017.09.531
Mania, K. (2001). “Connections between lighting impressions and presence in real and virtual environments: an experimental study,” in Proceedings of the 1st international conference on computer graphics, virtual reality and visualisation, 119–123.
Mania, K., and Robinson, A. (2005). An experimental exploration of the relationship between subjective impressions of illumination and physical fidelity. Comput. and Graph. 29, 49–56. doi:10.1016/j.cag.2004.11.007
Marill, K. A. (2004). Advanced statistics: linear regression, part II: multiple linear regression. Acad. Emerg. Med. 11, 94–102. doi:10.1111/j.1553-2712.2004.tb01379.x
Mirdamadi, M. S., Zomorodian, Z. S., and Tahsildoost, M. (2023). Evaluation of occupants’ visual perception in day lit scenes: a virtual reality experiment. J. Daylighting 10, 45–59. doi:10.15627/jd.2023.4
Mohammadrezaei, E., Ghasemi, S., Dongre, P., Gračanin, D., and Zhang, H. (2024). Systematic review of extended reality for smart built environments lighting design simulations. IEEE Access 12, 17058–17089. doi:10.1109/access.2024.3359167
Mottahedi, M., Mohammadpour, A., Amiri, S. S., Riley, D., and Asadi, S. (2015). Multi-linear regression models to predict the annual energy consumption of an office building with different shapes. Procedia Eng. 118, 622–629. doi:10.1016/j.proeng.2015.08.495
Murray, R. F., Patel, K. Y., and Wiedenmann, E. S. (2022). Luminance calibration of virtual reality displays in Unity. J. Vis. 22, 1. doi:10.1167/jov.22.13.1
Nemire, K., and Ellis, S. R. (1993). “Calibration and evaluation of virtual environment displays,” in Proceedings of 1993 IEEE research properties in virtual reality symposium (IEEE), 33–40.
Newman, M., Gatersleben, B., Wyles, K., and Ratcliffe, E. (2022). The use of virtual reality in environment experiences and the importance of realism. J. Environ. Psychol. 79, 101733. doi:10.1016/j.jenvp.2021.101733
Omidfar Sawyer, A., and Chamilothori, K. (2019). “Influence of subjective impressions of a space on brightness satisfaction: an experimental study in virtual reality,” in Proceedings of symposium on simulation for architecture and urban design 2019.
Panahiazar, S., and Matkan, M. (2018). Qualitative and quantitative analysis of natural light in the dome of san lorenzo, turin. Front. Archit. Res. 7, 25–36. doi:10.1016/j.foar.2017.11.005
Picinali, L., Afonso, A., Denis, M., and Katz, B. F. (2014). Exploration of architectural spaces by blind people using auditory virtual reality for the construction of spatial knowledge. Int. J. Human-Computer Stud. 72, 393–407. doi:10.1016/j.ijhcs.2013.12.008
Portman, M. E., Natapov, A., and Fisher-Gewirtzman, D. (2015). To go where no man has gone before: virtual reality in architecture, landscape architecture and environmental planning. Comput. Environ. Urban Syst. 54, 376–384. doi:10.1016/j.compenvurbsys.2015.05.001
Reuding, T., and Meil, P. (2004). Predictive value of assessing vehicle interior design ergonomics in a virtual environment. J. Comput. Inf. Sci. Eng. 4, 109–113. doi:10.1115/1.1710867
Rolland, J. P., Holloway, R. L., and Fuchs, H. (1995). “Comparison of optical and video see-through, head-mounted displays,” in Telemanipulator and telepresence technologies, 293–307.
Rothbaum, B. O., Anderson, P., Zimand, E., Hodges, L., Lang, D., and Wilson, J. (2006). Virtual reality exposure therapy and standard (in vivo) exposure therapy in the treatment of fear of flying. Behav. Ther. 37, 80–90. doi:10.1016/j.beth.2005.04.004
Saeidi, S., Rizzuto, T., Zhu, Y., and Kooima, R. (2015). “Measuring the effectiveness of an immersive virtual environment for the modeling and prediction of occupant behavior,” in Sustainable human–building ecosystems, 159–167.
Santos Nobre, J., and da Motta Singer, J. (2007). Residual analysis for linear mixed models. Biometrical J. J. Math. Methods Biosci. 49, 863–875. doi:10.1002/bimj.200610341
Schroeder, R., Heather, N., and Lee, R. M. (1998). The sacred and the virtual: religion in multi-user virtual reality. J. Computer-Mediated Commun. 4, 0. doi:10.1111/j.1083-6101.1998.tb00092.x
Scorpio, M., Laffi, R., Teimoorzadeh, A., Ciampi, G., Masullo, M., and Sibilio, S. (2022). A calibration methodology for light sources aimed at using immersive virtual reality game engine as a tool for lighting design in buildings. J. Build. Eng. 48, 103998. doi:10.1016/j.jobe.2022.103998
Scorpio, M., Carleo, D., Gargiulo, M., Navarro, P. C., Spanodimitriou, Y., Sabet, P., et al. (2023). A review of subjective assessments in virtual reality for lighting research. Sustainability 15, 7491. doi:10.3390/su15097491
Somarathna, R., Bednarz, T., and Mohammadi, G. (2022). Virtual reality for emotion Elicitation–A review. IEEE Trans. Affect. Comput. 14, 2626–2645. doi:10.1109/taffc.2022.3181053
Spottiswood, L., and Bishop, I. (2005). “An agent-driven virtual environment for the simulation of land use decision making,” in International congress on.
Taylor, F., Jayaram, S., Jayaram, U., and Mitsui, T. (2002). “Validation of virtual crane behavior through comparison with a real crane,” in International design engineering technical conferences and computers and information in engineering conference, 67–75.
Uyanık, G. K., and Güler, N. (2013). A study on multiple linear regression analysis. Procedia-Social Behav. Sci. 106, 234–240. doi:10.1016/j.sbspro.2013.12.027
Verran, J. A., and Ferketich, S. L. (1987). Testing linear model assumptions: residual analysis. Nurs. Res. 36, 127–129. doi:10.1097/00006199-198703000-00014
Whyte, J. (2007). Virtual reality and the built environment. 1st edition. London: Routledge. doi:10.4324/9780080520667
Keywords: virtual reality, lighting simulation, empirical validation, built-environment, predictive mode, illumination discripency, cross-environment evaluation
Citation: Kumar R, Dhar D, Ghosh P and Sorathia K (2025) Investigating lighting calibration opportunities in virtual reality for real-world illumination fidelity: an empirical study of variable lighting arrangements. Front. Built Environ. 11:1707371. doi: 10.3389/fbuil.2025.1707371
Received: 17 September 2025; Accepted: 13 October 2025;
Published: 28 October 2025.
Edited by:
Hasim Altan, United Arab Emirates University, United Arab EmiratesReviewed by:
Naglaa Sami Abdelaziz Mahmoud, Ajman University, United Arab EmiratesYicheng Wang, Polytechnic University of Turin, Italy
Copyright © 2025 Kumar, Dhar, Ghosh and Sorathia. This is an open-access article distributed under the terms of the Creative Commons Attribution License (CC BY). The use, distribution or reproduction in other forums is permitted, provided the original author(s) and the copyright owner(s) are credited and that the original publication in this journal is cited, in accordance with accepted academic practice. No use, distribution or reproduction is permitted which does not comply with these terms.
*Correspondence: Rohit Kumar, a3VtYXIucm9oaXRAbWFuaXBhbC5lZHU=; Debayan Dhar, ZGViYXlhbkBpaXRnLmFjLmlu