 Paul J. Haverkamp
 Inga Bysykatova-Harmey
 Nikolai Germogenov2
 Gabriela Schaepman-Strub
- 1Spatial Ecology and Remote Sensing, Department of Evolutionary Biology and Environmental Studies, University of Zurich, Zurich, Switzerland
- 2Institute for Biological Problems of the Cryolithozone, Siberian Branch of the Russian Academy of Sciences, Yakutsk, Russia
- 3Department of Ecology and Geography, North-Eastern Federal University, Yakutsk, Russia
Climate change is causing Arctic temperatures to increase at least twice as fast as the planet on average. Temperature and precipitation are predicted to continue increasing, such that flooding might become more prevalent in the new Arctic. Increased flooding frequency and extreme flooding events may pose new threats to Arctic biodiversity through habitat disturbance and decreased survival. We used the Siberian crane (Grus leucogeranus) as a model organism to investigate how flooding influences nesting habitat availability and juvenile counts. When spring flooding destroys eggs, adults either do not raise any chicks or have reduced time to prepare them for their long migration to China, thus years with extensive flooding could negatively impact future crane generations. We used nest site observation data from 14 surveys between 1995 and 2019, habitat mapping based on Landsat 8 imagery, and species distribution modeling to predict Siberian crane potential nesting habitat. Nesting habitat loss due to extreme flooding was calculated by overlaying this potential nesting habitat with Global Surface Water data. The percent of potential flooded nest sites varied between 6.7–55% across years, with a significant increase between 2001 and 2018. Extreme flood events, as experienced in 2017 and 2018, eliminated almost half of the potential nesting habitat. Importantly, we found that the percentage of flooded nest sites across years was negatively correlated with the number of observed juveniles. The Arctic lowlands are exposed to seasonal water level fluctuations that species have evolved with and adapted to. Siberian cranes and other species depending on Arctic ecosystems are expected to continue adapting to changing flood conditions, but extreme flood events further threaten the long-term survival of critically endangered species. It is imperative to assess how ecosystems and species respond to climatic extremes to support Arctic conservation strategies.
Introduction
Around the world, extreme weather events such as storms, droughts, fires, and floods are increasing in frequency, a trend that has been attributed to climate change (Easterling et al., 2000; Cai et al., 2014). The Arctic is at heightened risk for such changes as air temperature in this region is increasing at least twice as fast as the rest of the planet on average, rising by 0.75°C in the past decade alone (Post et al., 2019). We are only recently beginning to monitor and understand how climate change in the Arctic is impacting species and biodiversity through shifting seasonality (Pastick et al., 2019; Mallory et al., 2020), changes in sea ice cover (Hunter et al., 2010; Peeters et al., 2020), and shifting plant and animal ranges to higher latitudes and associated displacement of endemic species (Sturm et al., 2001; Killengreen et al., 2007; Ksenofontov et al., 2019; Berner et al., 2020; Aronsson et al., 2021; Kubelka et al., 2022). However, it remains unexplored how changes in flooding will affect Arctic species.
Short- and long-term changes to flood regimes can impact wildlife population dynamics through habitat loss (Perotto-Baldivieso et al., 2011), changes in body condition (Jones et al., 2019), and breeding success (Van De Pol et al., 2010). As species adapt to an increasing frequency and extent of floods, many will rely on changing behavior, distribution, and habitat selection (Korosi et al., 2017; Bailey et al., 2019). However, phenotypic plasticity, for example in the timing or behavior of migration or breeding, can affect fitness (Przybylo et al., 2000; Réale et al., 2003; Charmantier et al., 2008). Further, changes in distribution can complicate survival if individuals expose themselves to novel conditions, including greater predation pressure (Ma et al., 2019).
Spring flooding in the Arctic coastal plains occurs mostly due to rapid snowmelt hundreds of kilometers away in combination with continuous permafrost, which is a poor buffer for hydrological variation (Kane et al., 2008). Greater snowfall in the Arctic is already leading to increased flooding (Woo, 2012) and a greater snow water equivalent is predicted by 2050 (Callaghan et al., 2011). With increasing temperatures, warm spells and rain-on-snow events, and an increasingly rain-dominated precipitation regime, increased flooding (Rennert et al., 2009; Bintanja and Andry, 2017; McCrystall et al., 2021), as well as extreme events such as 100 year floods (Hirabayashi et al., 2008, 2013; Shevnina et al., 2017) are expected. Recent changes in Siberian Arctic weather regimes suggest this area will face some of the largest impacts of ecosystem disturbance in the world (Tei et al., 2020).
Spring flooding is a normal occurrence in some areas of the Arctic that species here have evolved with. Meltwater causes flooding of the interconnected channel systems and wetlands between lakes every spring, with flooding intensity depending on snow abundance, thawing intensity, and distance to nearest water body (Germogenov et al., 2013). Ground-nesting birds, such as the Siberian crane (Grus leucogeranus Pallas, 1773) whose nests are located in wetlands along lake shores, are susceptible to egg destruction, while chicks are able to swim and thus avoid drowning (Germogenov et al., 2013). Siberian cranes have adapted to flooding by building nests up to 15 cm above the water surface (Meine and Archibald, 1996) to allow for rising waters as snow melts, but this might not be enough with increasing flood height. The majority of the critically endangered Siberian crane population breeds in eastern Yakutia, Siberia, every summer before migrating about 5,000 km to lakes in eastern China (mostly Poyang Lake) for the winter (Harris et al., 1995). Siberian cranes typically arrive in Siberia in mid- to late-May, while snow is still on the ground and lakes are frozen, and remain until mid- to late-September, when snow begins to fall after the summer (Perfiliev, 1965; Johnsgard, 1983; Potapov and Flint, 1987). Pairs, and even individuals whose mates have died, are highly territorial and return to the same area each year, either using old nests, or building new ones (Germogenov et al., 2013). During late springs, snow melt and flooding occur during ideal nesting periods, when preferred nesting habitat and previous nest sites may already be flooded. In this case, cranes will build nests in higher locations within the microtopography of the wetlands (Flint and Sorokin, 1981; Johnsgard, 1983; Harris et al., 1995). Similarly, if nests are already built when flooding occurs, cranes will rebuild nests in other areas (Germogenov et al., 2013). Chicks are born in late-May to early-June but only have about 4 months to grow and gain enough strength for the long migration. If floods occur and new eggs are laid, chicks are born late and may not have enough time to mature for the migration, impacting reproduction success and hence population size of this already critically endangered species.
The aim of this study was to identify yearly flooding occurrence around previously identified Siberian crane nesting sites and examine flooding correlation with existing juvenile survival data in China. We also assess how extreme flooding decreases nesting habitat availability in their breeding grounds in the subarctic tundra in northeastern Yakutia, Siberia. The Siberian crane is used as a model organism for studying effects of changing environmental conditions and extreme flooding events on species that critically rely on Arctic ecosystems for their survival and reproduction.
Materials and Methods
We use locations of observed Siberian crane nests and Global Surface Water (GSW) extent data (Pekel et al., 2016) to understand how yearly surface water is impacting nesting sites. We then used Siberian crane nest site locations, in combination with environmental variables and a maximum entropy (MaxEnt) species distribution model (Phillips and Dudík, 2008) to predict potential nesting habitat within the extent of their known breeding range in Siberia. Autumn juvenile counts at a migration stopover in China are then correlated to flooded nest sites to identify possible impacts on the population. Extreme flooding events are predicted to become more common, so we use the GSW maximum extent of surface water to represent an extreme flood event and examine how this would affect observed nest site locations and reduce potential nesting habitat. All statistics were run in R (R Core Team, 2021) using RStudio (RStudio Team, 2022) unless noted otherwise.
Study Species and Area
Siberian cranes are critically endangered with only 3,500–4,000 individuals remaining in the wild (Birdlife International, 2018). While their biggest threat is reported to be decreasing wintering grounds due to habitat flooding from the Three Gorges Dam and damming of the outlet of Poyang Lake in China (Jiang et al., 2014; Birdlife International, 2018), increasing flooding due to climate change could reduce the availability of suitable summer nesting grounds, and reduce nesting success and juvenile survival. Aerial surveys from the 1960s to 1980s identified three core sites in northern Siberia with high densities of nesting Siberian cranes: the westernmost population around the Khroma River; the central, and most dense population around the Indigirka River; and the eastern population around the Alazeya River (Figure 1; Degtyarev and Labutin, 1991). Optimal habitat includes wetlands along lakes and depressions between lakes, with cranes spending most time adjacent to large and medium lakes (Germogenov et al., 2013). This study applies to the area containing the majority of the breeding grounds in the open tundra wetlands in Yakutia (128,718 km2) as identified in previous studies (Figure 1). Within the study area, the Kytalyk Nature Reserve, containing the Indigirka breeding core area, was established in 1995 to protect Siberian cranes nesting grounds, and was elevated to Russian federal protection in 2019.
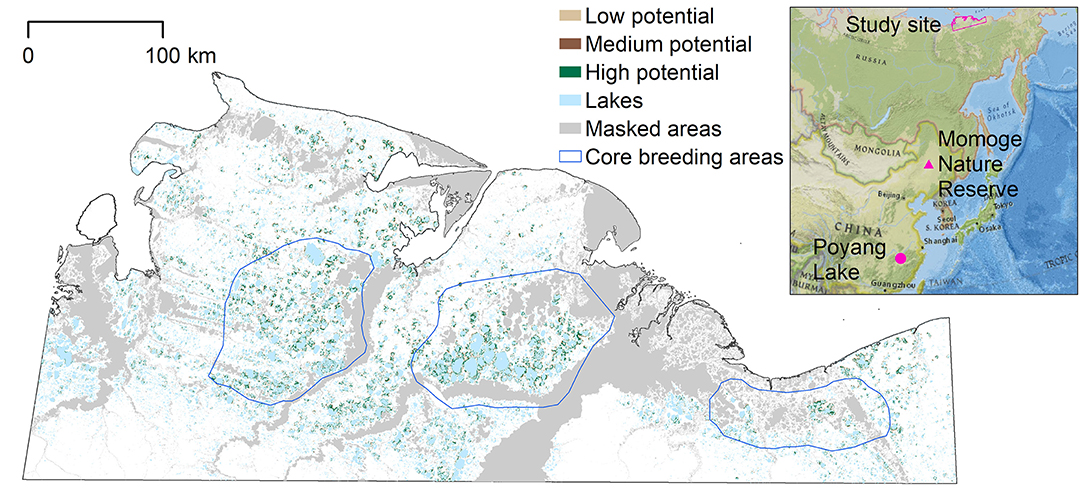
Figure 1. Potential nesting habitat map for entire study area, based on the MaxEnt model. Masked areas along the coast, rivers, and their floodplains were not included in the model as Siberian crane nests have not been observed in these areas. The blue polygons represent the three core breeding areas identified in earlier studies; the westernmost around the Khroma River; the central, and most dense around the Indigirka River; and the eastern around the Alazeya River (Degtyarev and Labutin, 1991). The inset shows the location of the study area in northeastern Siberia, and locations of the migration stopover site (Momoge Nature Reserve) and winter feeding grounds (Poyang Lake) in China. Inset credit: National Geographic, Esri, Garmin, HERE, UNEP-WCMC, USGS, NASA, ESA, METI, NRCAN, GEBCO, NOAA, increment P Corp.
Observations of Nesting Sites and Juvenile Counts
Ornithologists have been researching rare and endangered birds in this area since the early 1990s, focusing on identifying the territorial distribution of Siberian cranes, searching for new and previously identified pairs, and mapping their nesting sites (Germogenov et al., 2013). 14 surveys were conducted in the Indigirka breeding range in northeastern Yakutia, Russia, between 1995 and 2019, with 37 Siberian crane nests identified in this time. Point surveys and transect surveys were done by boat, foot, and swamp-vehicle in the Yana and Indigirka interfluve. Point surveys were performed from high hill peaks and from high river banks using 12–20x binoculars and a 60x telescope. Locations of nests and birds were recorded in the field, and nesting reliability was established in accordance with the criteria recommended by the European Ornithological Atlas Committee - EOAC (Hagemeijer and Blair, 1997). Nesting was considered confirmed after visiting nest sites and seeing nests, eggs, broods, or adults bringing food to chicks, and GPS coordinates of nest sites were taken. Nests were found at a range of elevations, 8–18 m [based on overlays of the Arctic DEM (Porter et al., 2018)], while the main habitats are located between 14–19 m above the Eastern Siberian Sea level (based on overlays of location data on topographic maps), as areas below 10 m are frequently flooded in the spring (Germogenov et al., 2013). We used these nest locations provided from stock materials of the Institute for Biological Problems of the Cryolithozone, Siberian Branch of Russian Academy of Sciences, Yakutsk.
Siberian crane juveniles were counted at the Momoge Nature Reserve, China, from 2007 to 2012 (Bysykatova, 2012; Hongxing, 2013), and 2017–2018 (Bysykatova, unpublished data). Momoge Nature Reserve, in northeastern China (Jilin Province), is an important spring and autumn migration stop for Siberian cranes, where researchers are able to observe adults and juveniles (Bysykatova, 2012; Germogenov et al., 2013). We used autumn juvenile counts at Momoge Nature Reserve as a proxy for the reproductive success of the previous breeding season. This is only one possible spot for Siberian cranes to rest during migration and hence these numbers do not cover the entire Siberian crane population. However, the majority of the eastern population (up to 3,750 individuals) has been observed here, and it represents one of the highest concentrations of resting Siberian cranes in autumn (Bysykatova, 2012). Juveniles fly with the adults, and counts at this stopover can indicate population trends as this is a more compact area to count birds than Poyang Lake feeding grounds.
Environmental Variables of Nesting Habitat
We identified three environmental variables to predict nesting habitat based on multiannual observational expertise of nesting locations of Siberian cranes in this area in combination with a review of the literature. The three identified environmental variables were landcover type, maximum topographical slope within 150 m, and distance to lakes. All variables were based on satellite data accessed and processed in Google Earth Engine (GEE; Gorelick et al., 2017) except where noted. Raster layers were exported from GEE to TIFF format at 30 m pixel resolution in the North Pole Lambert Azimuthal Equal Area projection to eliminate latitudinal land area bias.
Landcover Type
Siberian cranes prefer to nest in damp tidal flats around lakes with polygonal swamp vegetation dominated by the sedge species Carex aquatilis ssp. stans (Drejer) Hulténare, and occasionally by cottongrass Eriophorum angustifolium Honck., forming short, sparse stands (Johnsgard, 1983). A landcover map was developed based on spectral characteristics of wetlands, other vegetation, clear water, turbid water, and ice (as not all ice has typically melted in June, especially on larger lakes), using Landsat 8 surface reflectance (Bands 1–7) imagery with 30 m resolution as available in GEE and a random forest classifier (see Supplementary Material A for detailed methods).
Topographical Slope Within 150 m
Siberian cranes are fierce nest protectors, but when away from the nest can face nest predation pressure from arctic foxes (Vulpes lagopus), jaegers (Stercorarius spp.), glaucous gulls (Larus hyperboreus), and herring gulls (Larus argentatus) (Perfiliev, 1965). Thus, visibility around the nest (Flint and Sorokin, 1981) could be important to identify when predators are near and adults should not leave eggs unattended (Flint and Kischinski, 1975). To understand how topography affects visibility, we used the ArcticDEM 2 m mosaic dataset (Porter et al., 2018) from the Polar Geospatial Center downloaded from GEE to calculate the slope of each pixel, and then determined the maximum slope within 150 m of each pixel using the Focal Statistics tool in ArcMap 10.5 (Environmental Systems Research Institute, Redlands, CA), where steep slopes indicate reduced nest visibility.
Distance to Lakes
Surface water is important for shaping the tundra landscape and distribution of Siberian crane nesting sites. Previous research has highlighted the importance of distance to lakes for nest location (Bysykatova, 2012, 2016). Adult cranes rely on medium to large (minimum size of 0.35 km2), shallow (typically no deeper than 0.5 m) lakes surrounded by flat terrain for increased visibility and food resources, while nests are located in wetlands a mean of 300 m from the lake shore (Flint and Kischinski, 1975; Bysykatova, 2012, 2016). While Siberian crane nests are often built over shallow water (del Hoyo et al., 1996), they were rarely located in pixels classified as water in the habitat type map (see Section Landcover Type).
We used two layers from the Global Surface Water Explorer (Pekel et al., 2016) to develop environmental variables related to surface water. The Global Surface Water (GSW) layers are based on Landsat images (30 m resolution) obtained over more than 30 years. However, over the study site, Landsat imagery only exists since 2001. In May 2003, the Landsat 7 sensor experienced a permanent failure of the scan-line corrector (SLC-off images), resulting in a loss of ~22% of all data from this time forward (Arvidson et al., 2006; Chen et al., 2011). Thus, some data gaps exist in the GSW layers as well.
To identify typical June surface water extent, we used the GSW “monthly recurrence layer” for June (Pekel et al., 2016). This layer represents the frequency (in percent) at which each pixel has been identified as water in June between 2001 and 2018. We created a binary image with pixels with values ≥ 50% = 1, indicating pixels that have been identified as water in June in more than 50% of the observations, and pixels with values <50% = 0, indicating areas identified as water in June in <50% of the observations (June surface water map). Hence, the resulting map identifies all pixels that GSW identified as water in June in at least half of the years with observations, including river areas.
Shrubs form thickets on temporarily flooded river banks in the tundra. These shrubs are the tallest vegetation throughout the study site and can grow up to 2 m, restricting local visibility. To avoid flooding and tall shrubs, nests are located on average 2,938 m from river banks (Bysykatova, 2012, 2016). Consequently, to account for the fact that crane nesting site selection differs between lakes and rivers, we needed to exclude the river areas from the June surface water map. The GSW “maximum extent layer” shows all pixels that have ever been identified as water between 2001 and 2018, including river floodplains. We converted the GSW maximum extent to a vector file and selected and exported the river areas, which were mostly connected as polygons. The river polygons were then subtracted from the June surface water map, leaving the extent of lakes in June. To reduce noise in the analysis, we calculated the area of the polygons in the lakes layer, and deleted lakes smaller than 0.35 km2, since cranes do not nest at lakes smaller than this.
We finally created the distance to lakes variable by converting the June lake vector map to raster format and calculating the Euclidean Distance (Spatial Analyst toolbox, ArcMap) to the closest lake for each pixel of the study area.
Modeling Potential Nesting Habitat
Maximum entropy species distribution modeling (MaxEnt) is a machine learning algorithm used for predicting potential species distributions using presence-only observations and a set of environmental variables (Phillips et al., 2006; Morales et al., 2017). MaxEnt was used to identify potential nesting habitat given it has high accuracy under two restrictions of our field observational data, i.e., low sample numbers (Pearson et al., 2007; Thibaud et al., 2014; Guisan et al., 2017) and presence only data (Phillips et al., 2006; Wisz et al., 2008; Elith et al., 2011). We followed several measures to reduce overfitting and bias, and optimize our MaxEnt models, including masking areas where cranes are not expected to nest (see Supplementary Material B for detailed explanations). To reduce the influence of spatial autocorrelation at nest sites (Wisz et al., 2008; Phillips et al., 2017), we thinned observed nest sites used to train our MaxEnt model by only choosing one nest per known breeding pair, unless nests from different years were located at least 2 km away from other nest sites of that pair. This left us with 20 of 37 observed nest locations to use in our final models. We used this subset of 20 observed nest locations as input to the MaxEnt model.
We imported the nest location and environmental variables into R version 3.6.0 (R Core Team, 2021) and evaluated several model tuning runs using the ENMeval package (Kass et al., 2021). We applied different regularization multipliers (0.75, 1.00, 1.25), which penalize more complex models, in order to optimize model performance and limit the effects of overfitting (Radosavljevic and Anderson, 2014). We chose 10,000 random background points as input to the model. We did not constrain features to remain within values in the training data (clamping), and only used values at presence and background points, instead of the entire rasters. We used the “ENMevaluate” function in ENMeval to run models with four different combinations of the three selected variables (all combinations with at least two variables) to allow us to compare results and choose the best model (Kass et al., 2021), with only linear and quadratic features since there were few sample points.
We used “jackknife” partitioning to validate the training and validation data, which used k-fold cross validation where k (the number of bins) is equal to the number of samples in the data, which is 20 here. This validation method is recommended for occurrence datasets with <25 observations (Pearson et al., 2007; Shcheglovitova et al., 2013). This method uses each occurrence as a testing point once, while it uses the remaining occurrence points as training data for each iteration. A total of 20 cross validation models were run for each model, with evaluation metrics calculated based on all iterations.
All models were evaluated using Akaike information criterion corrected for small sample sizes (AICc; Akaike, 1974; Burnham and Anderson, 2004; Warren and Seifert, 2011). AICc is a measure of model goodness-of-fit and complexity. The model with the lowest AICc is considered the best model and all models with ΔAICc <2 are considered to be statistically equal. In ENMevaluate, when rasters are not used AICc is calculated using the predicted background occurrences, compared to the original data, with the assumption that background records have adequately represented presence records (Kass et al., 2021). We also examined the area under the curve of the receiver operating characteristic plot (AUC), which was calculated using both training and validation background data based on the jackknife cross validation data partitions (Radosavljevic and Anderson, 2014). The AUC measures how well the model predicts output compared to a random model on a scale from 0 to 1, with values close to 1 considered highly accurate, and values around 0.5 considered to be no better than random, and values <0.5 considered to be worse than random (Elith et al., 2006; Phillips et al., 2006). MaxEnt models selected by AICc have been found more accurate than AUC at estimating the relative importance of variables and habitat suitability in training and predicted models, when samples sizes are low (Warren and Seifert, 2011). Jackknife tests were used to determine variable percent contribution and permutation importance and to develop variable response curves. High values of percent contribution indicate the variable adds more to fitting the final model, while high values of permutation importance (%) indicate that the variable influences the final model AUC more (Phillips, 2005). We checked for overfitting by examining the absolute difference in AUC (AUCdiff) between the training and validation data, given in the output of the ENMevaluate command.We used the AUC to choose between model groupings, and used AICc to evaluate models and choose our final model. The final model was used to create a map of potential nesting habitat using the “predict” function in ENMeval with a complementary log-log output, which is more appropriate for estimating probability of presence (Phillips et al., 2017). This created a raster map with output probability values between 0 and 1 (Phillips et al., 2017). The mapped probabilities were classified to represent no nesting potential (probability <0.50), low nesting potential (0.5 ≤ probability <0.66), medium nesting potential (0.66 ≤ probability <0.75), and high nesting potential (0.75 ≤ probability). Neighboring pixel areas belonging to the same class were converted to polygons in ArcMap. To get an understanding of average nesting habitat availability in most years, we erased the June surface water map (Section Distance to Lakes) from the predicted map to remove areas covered by water in June more than 50% of the time. Land surface areas were then calculated for low, medium, and high nesting potential. Nest locations were overlaid on the map, and all nests found within suitable habitat were counted and divided by total number of nests to get a measure of the predicted map accuracy.
Impacts of Yearly Flooding on Siberian Cranes
Flooded Nest Sites
We first aggregated observed nest sites across all surveys into a single layer, representing all known used nest sites for all years. To estimate how many of these used nest sites were affected by flooding in a given year, we overlaid these observed nest sites on the GSW monthly history (Pekel et al., 2016) extent in June and determined if each nest was located within a pixel of water, non-water, or had no observation. We calculated the percent of flooded nest sites per year based on the number of nest sites that had a water observation divided by the total number of observations. Nest sites with no GSW observation could have been located in ice or snow (which are not indicated in GSW layers), behind a cloud, or within a Landsat 7 SLC-off data gap, and were thus excluded from calculating the percent of flooded nest sites. If a nest site was located within a water observation of the GSW monthly history layer, there is a high potential that the nest was flooded that year. However, it has to be noted that nests can be built on small outcroppings higher than the surrounding areas. Depending on the microtopography of the wetland and the level of the flood, there is a chance that the nest and eggs survive even if the nest site is flooded. We determined if there was a significant relationship between flooded nest sites and year from 2001 to 2018 using the “lm” function in the stats package of R (R Core Team, 2021) and plotted in ggplot2 (Wickham, 2016). We used the “grubbs.test” function in the outliers package (Komsta, 2011) to check for outliers.
Flooding Impact on Juvenile Counts
To examine the relationship between juvenile survival and flooding, we calculated the Pearson correlation between the percent of nest sites in flooded areas and the juvenile counts at Momoge Nature Reserve in the same year using the “cor.test” function in the stats package of R (R Core Team, 2021). To verify normality of variables, we examined the residuals of a linear model with numbers of juveniles as the dependent variable and the percent of flooded nest sites as the independent variable, using the “qqnorm” function in the stats package of R (R Core Team, 2021), and plotted the relationship using ggplot with a “lm” smoothing line from the ggplot2 package (Wickham, 2016).
Impacts of Extreme Flooding on Observed Nest Sites and Potential Nesting Habitat
We used the GWS maximum extent layer (Pekel et al., 2016) to represent an extreme flooding event across the study area. The maximum extent layer shows all pixels that have ever been identified as water by GSW between 2001 and 2018.
We overlaid the observed nest locations on the GSW maximum extent layer in ArcMap to determine which nest sites might be affected during an extreme flood. We subtracted the GSW maximum extent from the predicted nesting habitat map for the study area to get an estimate of how extreme flooding would reduce potential nesting habitat (see Section Modeling Potential Nesting Habitat).
Results
Potential Nesting Habitat
We chose the MaxEnt model with the second lowest AICc. This model included all three environmental variables, as this model grouping had the highest average AUC values (Supplementary Table C.1).The linear models had the lowest AICc values, all within ΔAICc <2 suggesting they are statistically equivalent, while the lowest AICc had a regularization multiplier of 0.75, allowing more complex models (Elith et al., 2010, 2011). However, AUC values (average AUC = 0.96) within this grouping were approximately equal in the linear and linear-quadratic models (Supplementary Table C.1). We chose the model with a regularization multiplier of 1 as we chose to use the least complex model. All models had an AUCdiff of 0.03, suggesting the model was not overfit. Response curves for the predictor variables of the chosen model are shown in Supplementary Figure C.1.
The final model showed the three variables to contribute to both model fitting (percent contribution) and model accuracy (permutation importance): landcover type (highest probability associated with the wetland class, percent contribution = 66.9, permutation importance = 14.6), distance to lakes (highest probability associated with shorter distances, percent contribution = 27.3, permutation importance = 45.0), and maximum slope within 150 m (highest probability associated with lower slopes, percent contribution = 5.9, permutation importance = 40.4; Supplementary Table C.1).
The potential nesting habitat map (Figure 1) shows the area of high nesting potential (1970.8 km2) was found to contribute most to the total suitable area, more than low (1,169.9 km2) and medium (666.7 km2) suitability combined (Table 1). In general, high potential habitat was identified closest to large lakes, with lower potential habitat further away. Unsuitable areas (124,910.6 km2) include the areas masked from the analysis where cranes are not expected to nest.
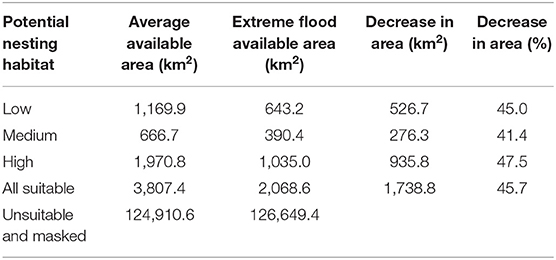
Table 1. Average area of nesting habitat suitability and reduced area due to extreme flooding within the study area.
We overlaid the 37 observed nest sites on the potential nesting habitat map to determine in which potential habitat they were located: two were found in predicted areas of low potential habitat, three in medium potential habitat, and 26 nests were located in high nesting potential habitat. Six nest sites were not located within potential nesting territory, but within 485 m of at least low potential habitat. Thus, the accuracy of the predicted map, based on the number of nest locations found in predicted suitable nesting habitat, was 84%.
Impacts of Yearly Flooding on Siberian Cranes
Flooded Nest Sites
We examined the extent of surface water in June each year from 2001 to 2018 (except 2003) to determine how many observed nest sites were potentially affected by flooding (Figure 2; Supplementary Table C.2). 30.2% (s.d. = 13.9) of the nest sites were flooded on average across years, with a significant positive relationship from 2001 to 2018 (F-statistic = 9.21, p-value = 0.008). The peak of flooded nest sites (55.0%) was reached in 2017, but also in 2018 54.8% of the nest sites were located within water-covered pixels. 2012 was the year with the lowest percent of nest sites flooded (6.7%).
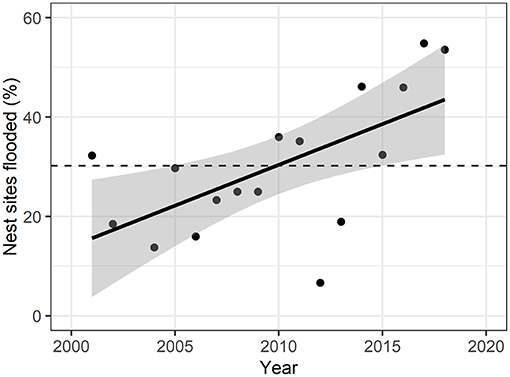
Figure 2. Yearly percent of flooded nest sites over the study period. Solid line represents linear fit of points (adjusted R2 = 0.34), with gray areas representing 95% confidence intervals. Dashed line represents mean percent of nest sites flooded over the years (30.2% ± 13.9). Nest flooding was significantly increasing over the study period (F-statistic = 10.9, p = 0.008).
Flooding Impact on Juvenile Counts
We examined the relationship between the number of juveniles counted at Momoge Nature Reserve and the percent of flooded nest sites for 8 years during the study (Figure 3; Supplementary Table C.2). We found a significant negative correlation (R = −0.80, t-value = −3.27, p-value = 0.02) indicating lower numbers of observed juveniles in years with a greater percentage of nest sites flooded (Figure 2). In 2017, which had extreme flooding conditions (Tei et al., 2020), 55% of the nest sites were flooded, and the lowest number of juveniles were counted in Momoge Nature Reserve (29). The greatest numbers of juveniles counted (579) occurred in 2012, which also had the lowest percent of flooded nest sites (6.67%).
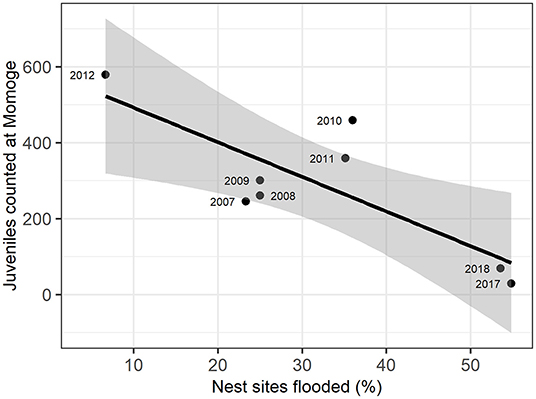
Figure 3. Relation of flooded nest sites and juvenile Siberian cranes counted at Momoge Nature Reserve in the fall of the same year (as indicated in point labels). The solid line represents a linear regression (adjusted R2 = 0.58), with gray areas representing 95% confidence intervals.
Impacts of Extreme Flooding on Observed Nest Sites and Potential Nesting Habitat
We used the GSW maximum extent layer to determine how extreme flooding could impact observed Siberian crane nest sites and potential nesting habitat. We found 17 nest sites to be flooded under maximum water extent. Only two of the six nests located outside of the predicted potential habitat would be flooded at this level, while 12 nests located in high potential habitat would be flooded. This extreme flooding situation affects almost half of all suitable nesting habitat, eliminating over 1,700 km2 and reducing high potential nesting habitat by more than 47%, to just over 2,000 km2 (Table 1).
During extreme flooding, lake boundaries expand and can merge to form larger lakes (Figure 4C). These larger lakes often expand into the high potential nesting habitat that are surrounding the lakes, making much of the area unsafe for nesting. However, some large lakes maintain their shores (see large lake in the center of Figure 4), due to higher banks surrounding them, which at the same time make these areas less suitable for crane nesting due to reduced visibility related to steep slopes.
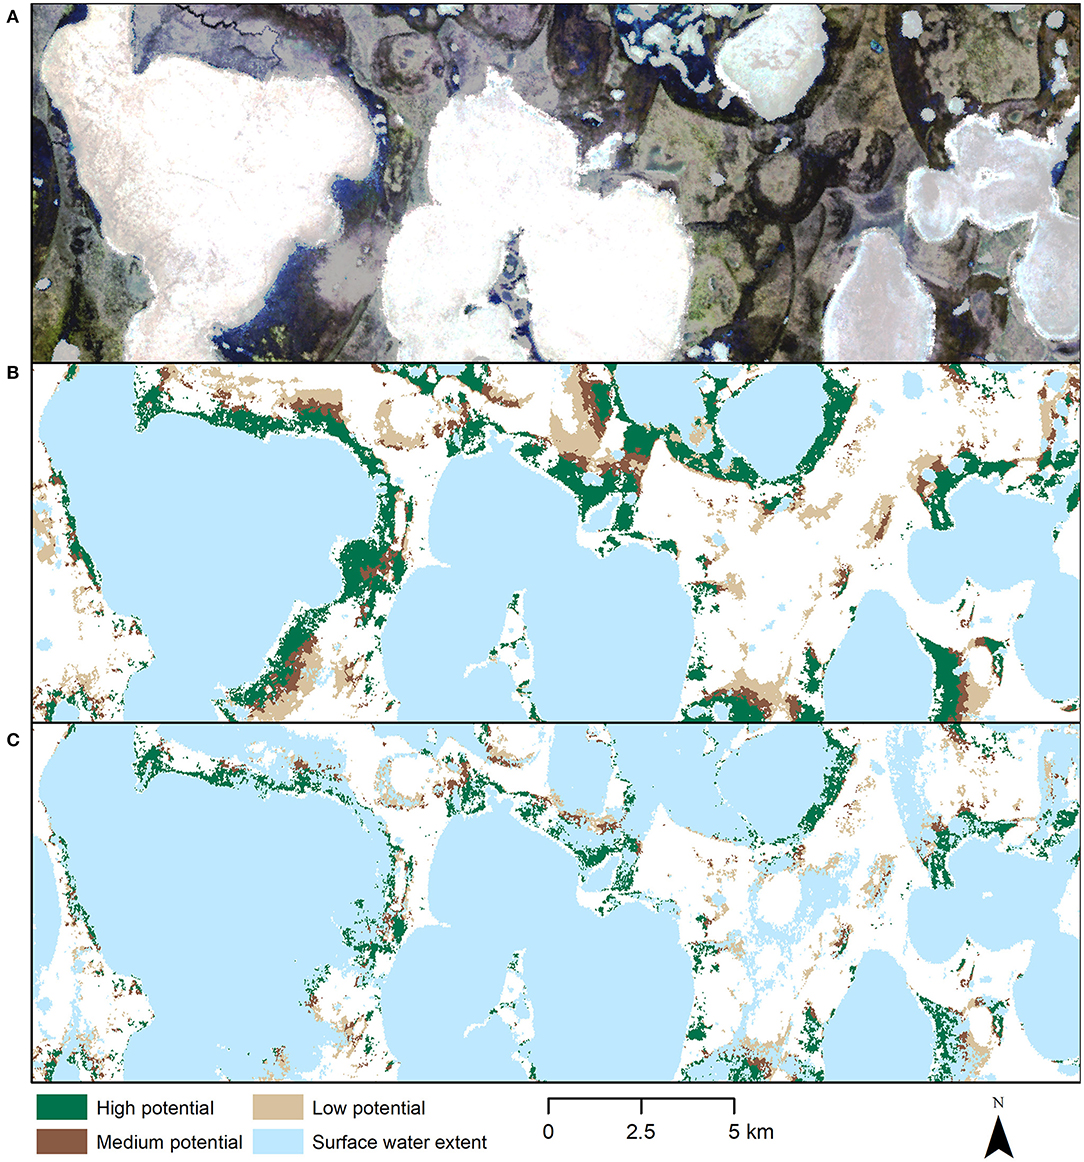
Figure 4. (A) Subset of the Indigirka Siberian crane core breeding area (true color Landsat 8 median composite June 2013-2018). Large white areas are snow or ice covered lakes, darker areas are typical of wetlands, lighter areas are typical of other vegetation types. (B) Potential nesting habitat at multiannual average June surface water extent. (C) Potential nesting habitat at maximum flood extent. Over the entire study area, suitable nesting habitat availability decreases by about 53% during an extreme flooding event.
Discussion
The occurrence of extreme flooding in Arctic lowlands in recent years (Kane et al., 2003; Tei et al., 2020) highlights the importance of conservation planning for extreme weather impacts on threatened and endangered species (Maxwell et al., 2019). This study investigates how flooding events might impact critical wildlife habitat in the Arctic, i.e., potential nesting habitat of the critically endangered Siberian crane. We found that extreme flooding causes a strong decrease in availability of vital habitat, showing a correlated decrease in reproductive success. Based on our modeling results, Siberian cranes can only utilize nesting areas in a small fraction (2.96%; Table 1) of the landscape during years with average surface water extent. Yearly flooding of previously observed nest sites significantly increased over the past 18 years, with more than 50% of sites flooded in the last 2 years of the study (Supplementary Table C.2). We found autumn counts of juvenile cranes to significantly decrease with increasing percent of flooded nest sites, suggesting that the increasing frequency of flood events could have important long-term effects on population viability. Depending on the microtopography and flood level, nests and eggs may not necessarily be destroyed even if a nest location is indicated as flooded by the GSW data. But, when nests do flood, eggs can be destroyed. If adults try to build a new nest and have a successful hatching, surviving chicks have less time to develop and gain strength before their migration to China, and shortened development periods could lead to reduced juvenile survival and consequently decreasing population size. During times of extreme flooding, as was seen in 2017, almost half of all high nesting potential areas could flood, forcing cranes to choose medium or low potential nesting habitat instead, which can result in lower numbers of surviving juveniles.
Our model confirmed the importance of wetlands along lakes for Siberian crane nesting. These swampy tidal flats in water up to 0.5 m deep provide easy access to lake resources, along with added protection from predators due to high visibility and tall grasses to hide nests (Vorobyov, 1963; Flint and Kischinski, 1975; Flint and Sorokin, 1981; Johnsgard, 1983; del Hoyo et al., 1996; Bysykatova et al., 2014). Although no nests have been directly observed in the western region of the study site, cranes here are also typically seen in shallow wetlands along lakes, with extensive pendant grass (Arctophila fulva) and surrounded by sedges (Bysykatova et al., 2014). Similarly, temporary wetland habitats are avoided, further highlighting the importance of being close to lakes (Germogenov et al., 2013; Bysykatova et al., 2014).
Some high potential nesting habitat was identified along small river channels, which is expected to actually be surrounded by tall shrubs. Nesting habitat has a similar spectral signal to shrubs along rivers in the Landsat 8 imagery due to a high amount of green vegetation in close proximity to water, and thus the shrubs were misclassified as nesting habitat. While we were able to mask out large rivers, we were not able to mask the smaller channels, as the width of these channels is often smaller than the resolution of the GSW layers. We expect that this is a very small fraction of the overall area and the high nesting potential area. Another possible source of uncertainty was in masking where cranes are not known to nest. Using the GSW maximum extent layer to remove coasts, rivers, and their floodplains, some rivers were connected to larger wetlands and coastal areas along the East Siberian Sea and Laptev Sea that flood extensively. These areas were not analyzed, but nest sites might be located here. Previous research found breeding pairs in coastal wetlands and wetlands located on river floodplains near the sea (Germogenov et al., 2013; Bysykatova et al., 2014), and thus the total potential nesting habitat might be slightly underestimated, but might also be subject to frequent flooding.
Species will have to adapt their behavior or disperse to better habitat to survive rapidly changing climate conditions (Gilg et al., 2012; Beever et al., 2017; Descamps et al., 2017; Noonan et al., 2018). In the Arctic, there are few studies examining extreme flooding impacts on wildlife, but increasing temperatures, changing precipitation dynamics and landscape phenology, more frequent rain-on-snow events, and melting sea ice are affecting trophic dynamics (Rockwell et al., 2011; Hansen et al., 2013), breeding (Descamps et al., 2017; Mallory et al., 2020), and population genetics (Peeters et al., 2020). Extreme weather events are predicted to increase in extent and frequency worldwide (Cai et al., 2014), and flooding has been linked with local extinctions (Maxwell et al., 2019), impacts to population and community structure (Thibault and Brown, 2008), and greatly decreased survival (Korslund and Steen, 2006; Tryjanowski et al., 2009). Previous studies have highlighted the impacts of extreme floods on coastal birds, which are generally threatened from sea level rise and increasing salinity (Van De Pol et al., 2010). While some birds shift habitat selection from traditional areas in response to long-term changes in flood extent (Bailey et al., 2017, 2019), shifts right after extreme flooding can also lead to increased nest predation (Ma et al., 2019), further threatening breeding success. Thus, it will be important to monitor Siberian cranes', and other Arctic species', responses to continued flooding, as there is little research investigating the effects of extreme flooding in the tundra.
During the study period, maximum snow depth increased significantly and was correlated with the percent of nests in flooded areas (see Supplementary Figures B.2, C.1, C.2), suggesting that precipitation and flooding patterns are already changing and disturbing Siberian crane nesting. Heavy snowfall caused the extreme flooding in 2017 (Tei et al., 2020), which was also the year with the fewest juveniles at Momoge Nature Reserve. Siberian cranes may be well suited to adapting distribution to changing climate conditions. Since the 1950s, lake extents within the study site have experienced significant change, including flooding of islands, peninsulas and isthmuses, and destroying high potential nesting habitat along lake shores (Pshennikov and Germogenov, 2008; Germogenov et al., 2013). As temperatures have increased over the past 40 years, population numbers have increased with higher reproductive success in warmer years (Germogenov et al., 2013; Birdlife International, 2018), and Siberian cranes in the western extent of their breeding range have moved closer to the sea (Bysykatova et al., 2014). With increased flooding, cranes may begin shifting nesting habitat to lower potential areas with higher microtopography or further from lake shores to limit flooding risk. However, these adaptations might expose chicks to higher predation. Future monitoring of habitat, snowfall, flooding, nesting, and juvenile counts may hint at further modifications, as Siberian cranes have proven very adaptable to living in this highly dynamic system, where surface water extent can change at a yearly scale (Vladimirtseva et al., 2012).
Siberian cranes are critically endangered, with their current greatest perceived threat being loss of winter habitat, mostly due to changing landscapes caused by the Three Gorges Dam along the Yangtze River in China, and potential habitat loss through a proposed dam at the outlet of Poyang lake, their largest wintering grounds (Birdlife International, 2018). Flooding in their wintering lakes has already caused cranes to feed outside of normal habitats (Jia et al., 2013; Burnham et al., 2017). Additionally, as climate change reduces tundra permafrost, and changes precipitation dynamics and ice cover, increased opportunities for natural resources exploration and extraction will lead to increasing pressure for development in the Arctic (Kumpula et al., 2011). With threats to important habitat in both breeding and wintering grounds, it will be vital to coordinate conservation and research efforts for Siberian cranes in their breeding range in Siberia and their winter feeding habitats in China, and understand how their changing habitats are affecting population dynamics.
Data Availability Statement
The nest GPS locations will not be made available to protect the locations of these critically endangered species, but the environmental variable values determined from the nest sites, and R code, are available at 10.17605/OSF.IO/B7328. Requests for further access should be directed to cGpoYXYxN0BnbWFpbC5jb20=.
Ethics Statement
Ethical review and approval was not required for the animal study because research involved only observations and counts of individuals in the field.
Author Contributions
PH: conceptualization, methodology, formal analysis, investigation, data curation, data interpretation, writing—original draft, and writing—reviewing and editing. IB-H: conceptualization, investigation, data curation, data interpretation, writing—reviewing and editing, supervision, and funding acquisition. NG: investigation, data curation, data interpretation, writing—reviewing and editing, and funding acquisition. GS-S: conceptualization, methodology, investigation, data interpretation, writing—reviewing and editing, supervision, and funding acquisition. All authors contributed to the article and approved the submitted version.
Funding
All funding was provided by the University of Zurich, Department of Evolutionary Biology and Environmental Studies, and the Institute for Biological Problems of the Cryolithozone, Siberian Branch of the Russian Academy of Sciences.
Conflict of Interest
The authors declare that the research was conducted in the absence of any commercial or financial relationships that could be construed as a potential conflict of interest.
Publisher's Note
All claims expressed in this article are solely those of the authors and do not necessarily represent those of their affiliated organizations, or those of the publisher, the editors and the reviewers. Any product that may be evaluated in this article, or claim that may be made by its manufacturer, is not guaranteed or endorsed by the publisher.
Acknowledgments
The authors would like to thank Mr. Zhow Chanling and Chan Fawen for Siberian crane juvenile count data at Momoge Nature Reserve. We appreciate the Polar Geospatial Center for freely available access to the ArcticDEM. The contribution by GS-S was supported by the University of Zurich Research Priority Programme on Global Change and Biodiversity.
Supplementary Material
The Supplementary Material for this article can be found online at: https://www.frontiersin.org/articles/10.3389/fcosc.2022.799998/full#supplementary-material
References
Akaike, H (1974). A new look at the statistical model identification. IEEE Trans. Automat. Contr. 19, 716–723. doi: 10.1109/TAC.1974.1100705
Aronsson, M., Heið*marsson, S., Jóhannesdóttir, H., Barry, T., Braa, J., Burns, C., et al (2021). State of the Arctic Terrestrial Biodiversity Report. Akureyri, Iceland. Available online at: https://caff.is/monitoring-series/all-monitoring-documents/557-state-of-the-arctic-terrestrial-biodiversity-report-start
Arvidson, T., Goward, S., Gasch, J., and Williams, D. (2006). Landsat 7 long-term acquisition plan: development and validation. Photogramm. Eng. Remote Sensing 72, 1137–1146. doi: 10.14358/PERS.72.10.1137
Bailey, L. D., Ens, B. J., Both, C., Heg, D., Oosterbeek, K., and van de Pol, M. (2017). No phenotypic plasticity in nest-site selection in response to extreme flooding events. Philos. Trans. R. Soc. B Biol. Sci. 372, 20160139. doi: 10.1098/rstb.2016.0139
Bailey, L. D., Ens, B. J., Both, C., Heg, D., Oosterbeek, K., and van de Pol, M. (2019). Habitat selection can reduce effects of extreme climatic events in a long-lived shorebird. J. Anim. Ecol. 88, 1474–1485. doi: 10.1111/1365-2656.13041
Beever, E. A., Hall, L. E., Varner, J., Loosen, A. E., Dunham, J. B., Gahl, M. K., et al. (2017). Behavioral flexibility as a mechanism for coping with climate change. Front. Ecol. Environ. 15, 299–308. doi: 10.1002/fee.1502
Berner, L. T., Massey, R., Jantz, P., Forbes, B. C., Macias-Fauria, M., Myers-Smith, I., et al. (2020). Summer warming explains widespread but not uniform greening in the Arctic tundra biome. Nat. Commun. 11, 4621. doi: 10.1038/s41467-020-18479-5
Bintanja, R., and Andry, O. (2017). Towards a rain-dominated Arctic. Nat. Clim. Chang. 7, 263–267. doi: 10.1038/nclimate3240
Birdlife International (2018). “Leucogeranus leucogeranus,” in IUCN Red List Threat. Species 2018. Cambridge. doi: 10.2305/IUCN.UK.2018-2.RLTS.T22692053A134180990.en
Burnham, J., Barzen, J., Pidgeon, A. M., Sun, B., Wu, J., Liu, G., et al. (2017). Novel foraging by wintering Siberian Cranes Leucogeranus leucogeranus at China's Poyang Lake indicates broader changes in the ecosystem and raises new challenges for a critically endangered species. Bird Conserv. Int. 27, 204–223. doi: 10.1017/S0959270916000150
Burnham, K. P., and Anderson, D. R. (2004). Multimodel Inference: Understanding AIC and BIC in Model Selection, 33, 261–304.
Bysykatova, I. P (2012). The Current State of the Yakutian Populations of the Siberian Crane Grus leucogeranus (Pallas, 1773) and the Sandhill Crane Grus canadensis canadensis (Linnaeus, 1758). Abstract. diss.
Bysykatova, I. P (2016). The Current State of the Yakutian Populations of Tundra Species of Cranes. Chisinau: Lap Lambert Academic Publishing. Available online at: https://www.iucnredlist.org/species/22692053/134180990
Bysykatova, I. P., Krapu, G. L., Germogenov, N. I., and Buhl, D. A. (2014). Distribution, densities, and ecology of Siberian cranes in the Khroma River Region of northern Yakutia in northern Russia. Proc. North Am. Crane Work. 12, 51–64. Available online at: https://digitalcommons.unl.edu/nacwgproc/381
Cai, W., Borlace, S., Lengaigne, M., Van Rensch, P., Collins, M., Vecchi, G., et al. (2014). Increasing frequency of extreme El Niño events due to greenhouse warming. Nat. Clim. Chang. 4, 111–116. doi: 10.1038/nclimate2100
Callaghan, T. V., Johansson, M., Brown, R. D., Groisman, P. Y., Labba, N., Radionov, V., et al. (2011). The changing face of arctic snow cover: a synthesis of observed and projected changes. Ambio 40, 17–31. doi: 10.1007/s13280-011-0212-y
Charmantier, A., McCleery, R. H., Cole, L. R., Perrins, C., Kruuk, L. E. B., and Sheldon, B. C. (2008). Adaptive phenotypic plasticity in response to climate change in a wild bird population. Science 320, 800–803. doi: 10.1126/science.1157174
Chen, J., Zhu, X., Vogelmann, J. E., Gao, F., and Jin, S. (2011). A simple and effective method for filling gaps in Landsat ETM+ SLC-off images. Remote Sens. Environ. 115, 1053–1064. doi: 10.1016/j.rse.2010.12.010
Degtyarev, A. G., and Labutin, Y. V. (1991). Siberian crane in Yakutia: range, migration, and numbers. Zool. J. 70, 63–74.
del Hoyo, J., Elliott, A., and Sargatal, J. (1996). Handbook of the Birds of the World, vol. 3: Hoatzin to Auks. Barcelona, Spain: Lynx Edicions.
Descamps, S., Aars, J., Fuglei, E., Kovacs, K. M., Lydersen, C., Pavlova, O., et al. (2017). Climate change impacts on wildlife in a High Arctic archipelago – Svalbard, Norway. Glob. Chang. Biol. 23, 490–502. doi: 10.1111/gcb.13381
Easterling, D. R., Meehl, G. A., Parmesan, C., Changnon, S. A., Karl, T. R., and Mearns, L. O. (2000). Climate extremes: observations, modeling, and impacts. Science 289, 2068–2074. doi: 10.1126/science.289.5487.2068
Elith, J., Graham, C.P, Anderson, R., Dudík, M., et al. (2006). Novel methods improve prediction of species' distributions from occurrence data. Ecography 29, 129–151. doi: 10.1111/j.2006.0906-7590.04596.x
Elith, J., Kearney, M., and Phillips, S. (2010). The art of modelling range-shifting species. Methods Ecol. Evol. 1, 330–342. doi: 10.1111/j.2041-210X.2010.00036.x
Elith, J., Phillips, S. J., Hastie, T., Dudík, M., Chee, Y. E., and Yates, C. J. (2011). A statistical explanation of MaxEnt for ecologists. Divers. Distrib. 17, 43–57. doi: 10.1111/j.1472-4642.2010.00725.x
Flint, V. E., and Kischinski, A. A. (1975). Siberian crane (Grus leucogeranus Pallas, 1773) in Yakutia. Zool. J. 44, 1197–1212.
Flint, V. E., and Sorokin, A. G. (1981). “The biology of the Siberian crane (sterkh) in Yakutia,” in Cranes of East Asia, editors N. M. Litvinenko and I. A. Neufeldt (Vladivostok, Russia: Academy of Sciences of the USSR), 60–65.
Germogenov, N. I., Solomonov, N. G., Pshennikov, A. E., Degtyarev, A. G., Sleptsov, S. M., Egorov, N. N., et al. (2013). The ecology of the habitats, nesting, and migration of the eastern population of the siberian crane (Grus leucogeranus Pallas, 1773). Contemp. Probl. Ecol. 6, 65–76. doi: 10.1134/S1995425513010071
Gilg, O., Kovacs, K. M., Aars, J., Fort, J., Gauthier, G., Grémillet, D., et al. (2012). Climate change and the ecology and evolution of Arctic vertebrates. Ann. N. Y. Acad. Sci. 1249, 166–190. doi: 10.1111/j.1749-6632.2011.06412.x
Gorelick, N., Hancher, M., Dixon, M., Ilyushchenko, S., Thau, D., and Moore, R. (2017). Google earth engine: planetary-scale geospatial analysis for everyone. Remote Sens. Environ. 202, 18–27. doi: 10.1016/j.rse.2017.06.031
Guisan, A., Thuiller, W., and Zimmermann, N. E. (2017). Habitat Suitability and Distribution Models. New York, NY: Cambridge University Press.
Hagemeijer, W. J. M., and Blair, M. J. (1997). The EBCC Atlas of European Breeding Birds: Their Distribution and Abundance. London: T & AD Poyser.
Hansen, B. B., Grøtan, V., Aanes, R., Sæther, B. E., Stien, A., Fuglei, E., et al. (2013). Climate events synchronize the dynamics of a resident vertebrate community in the high arctic. Science 339, 313–315. doi: 10.1126/science.1226766
Harris, J. T., Goroshko, O., Labutin, Y., Degtuarev, A., Germogenov, N., Jungsheng, Z., et al. (1995). “Results of Chinese–Russian–American investigation of Cranes wintering at Poyang Lake Nature Reserve, China,” in Cranes and Storks of the Amur River. The Proceedings of the International Workshop Khabarovsk-Poyarkovo-Khabarovsk July 3–12, 1992 (Moscow: Arts Literature Publishers), 57–72.
Hirabayashi, Y., Kanae, S., Emori, S., Oki, T., and Kimoto, M. (2008). Global projections of changing risks of floods and droughts in a changing climate. Hydrol. Sci. J. 53, 754–772. doi: 10.1623/hysj.53.4.754
Hirabayashi, Y., Mahendran, R., Koirala, S., Konoshima, L., Yamazaki, D., Watanabe, S., et al. (2013). Global flood risk under climate change. Nat. Clim. Chang. 3, 816–821. doi: 10.1038/nclimate1911
Hongxing, J (2013). Migratory Siberian Cranes at Momoge National Nature Reserve, Northeastern China, in 2012. Sib. Crane Flyw. News 10, 10.
Hunter, C. M., Caswell, H., Runge, M. C., Regehr, E. V., Amstrup, S. C., and Stirling, I. (2010). Climate change threatens polar bear populations: a stochastic demographic analysis. Ecology 91, 2883–2897. doi: 10.1890/09-1641.1
Jia, Y., Jiao, S., Zhang, Y., Zhou, Y., Lei, G., and Liu, G. (2013). Diet shift and its impact on foraging behavior of Siberian crane (Grus Leucogeranus) in Poyang Lake. PLoS ONE 8, e65843. doi: 10.1371/journal.pone.0065843
Jiang, F., Qi, S., Liao, F., Ding, M., and Wang, Y. (2014). Vulnerability of Siberian crane habitat to water level in Poyang Lake wetland, China. GIScience Remote Sens. 51, 662–676. doi: 10.1080/15481603.2014.978126
Johnsgard, P. A (1983). “Cranes of the world: Siberian crane (Bugeranus leucogeranus),” in Cranes of the World (Lincoln: DigitalCommons@University of Nebraska - Lincoln), 131–139.
Jones, P. D., Strickland, B. K., Demarais, S., McKinley, W. T., Ernst, J. R., and Klassen, J. A. (2019). Seasonal flooding effects on deer in the Mississippi river batture. J. Wildl. Manage. 83, 1117–1130. doi: 10.1002/jwmg.21680
Kane, D. L., Hinzman, L. D., Gieck, R. E., McNamara, J. P., Youcha, E. K., and Oatley, J. A. (2008). Contrasting extreme runoff events in areas of continuous permafrost, Arctic Alaska. Hydrol. Res. 39, 287–298. doi: 10.2166/nh.2008.005
Kane, D. L., McNamara, J. P., Yang, D., Olsson, P. Q., and Gieck, R. E. (2003). An extreme rainfall/runoff event in Arctic Alaska. J. Hydrometeorol. 4, 1220–1228. doi: 10.1175/1525-7541(2003)004<1220:AEREIA>2.0.CO;2
Kass, J. M., Muscarella, R., Galante, P. J., Bohl, C. L., Pinilla-Buitrago, G. E., Boria, R. A., et al. (2021). ENMeval 2.0: redisigned for customizable and reproducible modeling of species' niches and distributions. Methods Ecol. Evol. 12, 1602–1608 doi: 10.1111/2041-210X.13628
Killengreen, S. T., Ims, R. A., Yoccoz, N. G., Bråthen, K. A., Henden, J. A., and Schott, T. (2007). Structural characteristics of a low Arctic tundra ecosystem and the retreat of the Arctic fox. Biol. Conserv. 135, 459–472. doi: 10.1016/j.biocon.2006.10.039
Komsta, L (2011). Outliers: Tests for Outliers. R package version 0.14. Available online at: https://cran.r-project.org/package=outliers (accessed May 15, 2021).
Korosi, J. B., Thienpont, J. R., Pisaric, M. F. J., Demontigny, P., Perreault, J. T., McDonald, J., et al. (2017). Broad-scale lake expansion and flooding inundates essential wood bison habitat. Nat. Commun. 8, 1–8. doi: 10.1038/ncomms14510
Korslund, L., and Steen, H. (2006). Small rodent winter survival: snow conditions limit access to food resources. J. Anim. Ecol. 75, 156–166. doi: 10.1111/j.1365-2656.2005.01031.x
Ksenofontov, S. N., Backhaus, N., and Schaepman-Strub, G. (2019). “There are new species”: indigenous knowledge of biodiversity changes in Arctic Yakutia. Polar Geogr. 42, 34–57. doi: 10.1080/1088937X.2018.1547326
Kubelka, V., Sandercock, B. K., Székely, T., and Freckleton, R. P. (2022). Animal migration to northern latitudes: environmental changes and increasing threats. Trends Ecol. Evol. 37, 30–41. doi: 10.1016/j.tree.2021.08.010
Kumpula, T., Pajunen, A., Kaarlejärvi, E., Forbes, B. C., and Stammler, F. (2011). Land use and land cover change in Arctic Russia: ecological and social implications of industrial development. Glob. Environ. Chang. 21, 550–562. doi: 10.1016/j.gloenvcha.2010.12.010
Ma, L., Zhang, J., Liu, J., Yang, C., Liang, W., and Møller, A. P. (2019). Adaptation or ecological trap? Altered nest-site selection by Reed Parrotbills after an extreme flood. Avian Res. 10, 1–8. doi: 10.1186/s40657-019-0141-1
Mallory, C. D., Williamson, S. N., Campbell, M. W., and Boyce, M. S. (2020). Response of barren-ground caribou to advancing spring phenology. Oecologia 192, 837–852. doi: 10.1007/s00442-020-04604-0
Maxwell, S. L., Butt, N., Maron, M., McAlpine, C. A., Chapman, S., Ullmann, A., et al. (2019). Conservation implications of ecological responses to extreme weather and climate events. Divers. Distrib. 25, 613–625. doi: 10.1111/ddi.12878
McCrystall, M. R., Stroeve, J., Serreze, M., Forbes, B. C., and Screen, J. A. (2021). New climate models reveal faster and larger increases in Arctic precipitation than previously projected. Nat. Commun. 12, 1–12. doi: 10.1038/s41467-021-27031-y
Meine, C. D., and Archibald, G. W. (1996). The Cranes: Status Survey and Conservation Action Plan. Gland, Switzerland: IUCN.
Morales, N. S., Fernández, I. C., and Baca-González, V. (2017). MaxEnt's parameter configuration and small samples: are we paying attention to recommendations? A systematic review. PeerJ 5, e3093. doi: 10.7717/peerj.3093
Noonan, M. J., Newman, C., Markham, A., Bilham, K., Buesching, C. D., and Macdonald, D. W. (2018). In situ behavioral plasticity as compensation for weather variability: implications for future climate change. Clim. Change 149, 457–471. doi: 10.1007/s10584-018-2248-5
Pastick, N. J., Jorgenson, M. T., Goetz, S. J., Jones, B. M., Wylie, B. K., Minsley, B. J., et al. (2019). Spatiotemporal remote sensing of ecosystem change and causation across Alaska. Glob. Chang. Biol. 25, 1171–1189. doi: 10.1111/gcb.14279
Pearson, R. G., Raxworthy, C. J., Nakamura, M., and Peterson, A. T. (2007). Predicting species distributions from small numbers of occurrence records: a test case using cryptic geckos in Madagascar. J. Biogeogr. 34, 102–117. doi: 10.1111/j.1365-2699.2006.01594.x
Peeters, B., Le Moullec, M., Raeymaekers, J. A. M., Marquez, J. F., Røed, K. H., Pedersen, Å. Ø., et al. (2020). Sea ice loss increases genetic isolation in a high Arctic ungulate metapopulation. Glob. Chang. Biol. 26, 2028–2041. doi: 10.1111/gcb.14965
Pekel, J. F., Cottam, A., Gorelick, N., and Belward, A. S. (2016). High-resolution mapping of global surface water and its long-term changes. Nature 540, 418–422. doi: 10.1038/nature20584
Perfiliev, V. I (1965). The white crane and its preservation in Yakutia. Yakutia's Nat. its Preserv. Yakutsk B. Publ. Yakutsk. Russ. 1965, 99–112.
Perotto-Baldivieso, H. L., Ben Wu, X., Peterson, M. J., Smeins, F. E., Silvy, N. J., and Wayne Schwertner, T. (2011). Flooding-induced landscape changes along dendritic stream networks and implications for wildlife habitat. Landsc. Urban Plan. 99, 115–122. doi: 10.1016/j.landurbplan.2010.09.002
Phillips, S. J., Anderson, R. P., Dudík, M., Schapire, R. E., and Blair, M. E. (2017). Opening the black box: an open-source release of Maxent. Ecography 40, 887–893. doi: 10.1111/ecog.03049
Phillips, S. J., Anderson, R. P., and Schapire, R. E. (2006). Maximum entropy modeling of species geographic distributions. Ecol. Modell. 190, 231–259. doi: 10.1016/j.ecolmodel.2005.03.026
Phillips, S. J., and Dudík, M. (2008). Modeling of species distributions with Maxent: new extensions and a comprehensive evaluation. Ecography 31, 161–175. doi: 10.1111/j.0906-7590.2008.5203.x
Porter, C., Morin, P., Howat, I., Noh, M. -J., Bates, B., Peterman, K., et al. (2018). ArcticDEM. Harvard Dataverse. doi: 10.7910/DVN/OHHUKH
Post, E., Alley, R. B., Christensen, T. R., Macias-Fauria, M., Forbes, B. C., Gooseff, M. N., et al. (2019). The polar regions in a 2°C warmer world. Sci. Adv. 5, eaaw9883. doi: 10.1126/sciadv.aaw9883
Przybylo, R., Sheldon, B. C., and Meril,ä, J. (2000). Climatic effects on breeding and morphology: evidence for phenotypic plasticity. J. Anim. Ecol. 69, 395–403. doi: 10.1046/j.1365-2656.2000.00401.x
Pshennikov, A. E., and Germogenov, N. I. (2008). Changes in landscape elements on the Siberian Crane eastern population breeding grounds and their long-term dynamics according to aerial and remote sensing data. Sib. Crane Flyw. News 10, 6–7.
R Core Team (2021). R: A Language and Environment for Statistical Computing. Available online at: https://www.r-project.org/ (accessed January 5, 2021).
Radosavljevic, A., and Anderson, R. P. (2014). Making better MAXENT models of species distributions: complexity, overfitting and evaluation. J. Biogeogr. 41, 629–643. doi: 10.1111/jbi.12227
Réale, D., McAdam, A. G., Boutin, S., and Berteaux, D. (2003). Genetic and plastic responses of a northern mammal to climate change. Proc. R. Soc. London Ser. B Biol. Sci. 270, 591–596. doi: 10.1098/rspb.2002.2224
Rennert, K. J., Roe, G., Putkonen, J., and Bitz, C. M. (2009). Soil thermal and ecological impacts of rain on snow events in the circumpolar arctic. J. Clim. 22, 2302–2315. doi: 10.1175/2008JCLI2117.1
Rockwell, R. F., Gormezano, L. J., and Koons, D. N. (2011). Trophic matches and mismatches: can polar bears reduce the abundance of nesting snow geese in western Hudson Bay? Oikos 120, 696–709. doi: 10.1111/j.1600-0706.2010.18837.x
RStudio Team (2022). RStudio: Integrated Development Environment for R. Available online at: http://www.rstudio.com (accessed January 5, 2021).
Shcheglovitova, M., Anderson, R. P., Shcheglovitova, M., and Anderson, R. P. (2013). Estimating optimal complexity for ecological niche models: a jackknife approach for species with small sample sizes. Ecol. Modell. 269, 9–17. doi: 10.1016/j.ecolmodel.2013.08.011
Shevnina, E., Kourzeneva, E., Kovalenko, V., and Vihma, T. (2017). Assessment of extreme flood events in a changing climate for a long-term planning of socio-economic infrastructure in the Russian Arctic. Hydrol. Earth Syst. Sci 21, 2559–2578. doi: 10.5194/hess-21-2559-2017
Sturm, M., Racine, C., and Tape, K. (2001). Increasing shrub abundance in the Arctic. Nature 411, 546–547. doi: 10.1038/35079180
Tei, S., Morozumi, T., Nagai, S., Takano, S., Sugimoto, A., Shingubara, R., et al. (2020). An extreme flood caused by a heavy snowfall over the Indigirka River basin in Northeastern Siberia. Hydrol. Process. 34, 522–537. doi: 10.1002/hyp.13601
Thibaud, E., Petitpierre, B., Broennimann, O., Davison, A. C., and Guisan, A. (2014). Measuring the relative effect of factors affecting species distribution model predictions. Methods Ecol. Evol. 5, 947–955. doi: 10.1111/2041-210X.12203
Thibault, K. M., and Brown, J. H. (2008). Impact of an extreme climatic event on community assembly. Proc. Natl. Acad. Sci. U. S. A. 105, 3410–3415. doi: 10.1073/pnas.0712282105
Tryjanowski, P., Sparks, T. H., and Profus, P. (2009). Severe flooding causes a crash in production of white stork (Ciconia ciconia) chicks across Central and Eastern Europe. Basic Appl. Ecol. 10, 387–392. doi: 10.1016/j.baae.2008.08.002
Van De Pol, M., Ens, B. J., Heg, D., Brouwer, L., Krol, J., Maier, M., et al. (2010). Do changes in the frequency, magnitude and timing of extreme climatic events threaten the population viability of coastal birds? J. Appl. Ecol. 47, 720–730. doi: 10.1111/j.1365-2664.2010.01842.x
Vladimirtseva, M., Bysykatova, I., and Sleptsov, S. (2012). Ecological connection between fish preference in the diet of Siberian cranes and their incubation period in tundra zone. Nat. Preced. 7, 1. doi: 10.1038/npre.2012.6997.1
Warren, D. L., and Seifert, S. N. (2011). Ecological niche modeling in Maxent: the importance of model complexity and the performance of model selection criteria. Ecol. Appl. 21, 335–342. doi: 10.1890/10-1171.1x
Wickham, H (2016). ggplot2: Elegant Graphics for Data Analysis. New York, NY: Springer-Verlag. Available online at: https://ggplot2.tidyverse.org (accessed January 5, 2021).
Wisz, M. S., Hijmans, R. J., Li, J., Peterson, A. T., Graham, C. H., and Guisan, A. (2008). Effects of sample size on the performance of species distribution models. Divers. Distrib. 14, 763–773. doi: 10.1111/j.1472-4642.2008.00482.x
Keywords: extreme flooding, Siberian crane, Arctic, habitat suitability, flooding impact, conservation
Citation: Haverkamp PJ, Bysykatova-Harmey I, Germogenov N and Schaepman-Strub G (2022) Increasing Arctic Tundra Flooding Threatens Wildlife Habitat and Survival: Impacts on the Critically Endangered Siberian Crane (Grus leucogeranus). Front. Conserv. Sci. 3:799998. doi: 10.3389/fcosc.2022.799998
Received: 22 October 2021; Accepted: 23 February 2022;
Published: 14 April 2022.
Edited by:
Christos Mammides, Frederick University, CyprusReviewed by:
Larissa Beumer, Norwegian Polar Institute, NorwayNikita Tananaev, Siberian Branch of the Russian Academy of Sciences (RAS), Russia
Copyright © 2022 Haverkamp, Bysykatova-Harmey, Germogenov and Schaepman-Strub. This is an open-access article distributed under the terms of the Creative Commons Attribution License (CC BY). The use, distribution or reproduction in other forums is permitted, provided the original author(s) and the copyright owner(s) are credited and that the original publication in this journal is cited, in accordance with accepted academic practice. No use, distribution or reproduction is permitted which does not comply with these terms.
*Correspondence: Paul J. Haverkamp, cGpoYXYxN0BnbWFpbC5jb20=