 Mitchell J. Eaton
 Adam J. Terando1,2
 Jaime A. Collazo
- 1U.S. Geological Survey, Southeast Climate Adaptation Science Center, Raleigh, NC, United States
- 2Department of Applied Ecology, North Carolina State University, Raleigh, NC, United States
- 3U.S. Geological Survey, North Carolina Cooperative Fish and Wildlife Research Unit, Department of Applied Ecology, North Carolina State University, Raleigh, NC, United States
The challenge of selecting strategies to adapt to climate change is complicated by the presence of irreducible uncertainties regarding future conditions. Decisions regarding long-term investments in conservation actions contain significant risk of failure due to these inherent uncertainties. To address this challenge, decision makers need an arsenal of sophisticated but practical tools to help guide spatial conservation strategies. Theory asserts that managing risks can be achieved by diversifying an investment portfolio to include assets – such as stocks and bonds – that respond inversely to one another under a given set of conditions. We demonstrate an approach for formalizing the diversification of conservation assets (land parcels) and actions (restoration, species reintroductions) by using correlation structure to quantify the degree of risk for any proposed management investment. We illustrate a framework for identifying future habitat refugia by integrating species distribution modeling, scenarios of climate change and sea level rise, and impacts to critical habitat. Using the plains coqui (Eleutherodactylus juanariveroi), an endangered amphibian known from only three small wetland populations on Puerto Rico’s coastal plains, we evaluate the distribution of potential refugia under two model parameterizations and four future sea-level rise scenarios. We then apply portfolio theory using two distinct objective functions and eight budget levels to inform investment strategies for mitigating risk and increasing species persistence probability. Models project scenario-specific declines in coastal freshwater wetlands from 2% to nearly 30% and concurrent expansions of transitional marsh and estuarine open water. Conditional on the scenario, island-wide species distribution is predicted to contract by 25% to 90%. Optimal portfolios under the first objective function – benefit maximization – emphasizes translocating frogs to existing protected areas rather than investing in the protection of new habitat. Alternatively, optimal strategies using the second objective function – a risk-benefit tradeoff framework – include significant investment to protect parcels for the purpose of reintroduction or establishing new populations. These findings suggest that leveraging existing protected areas for species persistence, while less costly, may contain excessive risk and could result in diminished conservation benefits. Although our modeling includes numerous assumptions and simplifications, we believe this framework provides useful inference for exploring resource dynamics and developing robust adaptation strategies using an approach that is generalizable to other conservation problems which are spatial or portfolio in nature and subject to unresolvable uncertainty.
Introduction
Worldwide, coastal freshwater wetlands are among the most sensitive of ecosystems, resulting in increasing rates of loss as a function of anthropogenic activities (e.g., development, fragmentation and pollution) and changing climate (e.g., salinization, hydrologic alteration; Yu et al., 2019). Wetland-dependent species and the broad range of ecosystem goods and socio-ecological services provided by coastal wetlands are threatened as the distribution, extent, and function of coastal wetlands are reduced in response to relatively rapid changes in sea-level, nutrification, temperature and precipitation extremes, and altered fire regimes (Bhattachan et al., 2018; Taillie et al., 2019; Yu et al., 2019; Osland et al., 2019). Loss of coastal freshwater and tidal wetlands from sea-level rise (SLR) has been observed to result in reduced aboveground biomass, primary productivity, nitrogen sequestration, and water treatment capacity (Craft et al., 2009). Human development and other sources of habitat fragmentation are expected to limit the capacity for positive climate niche tracking of habitat or habitat-dependent species (Honnay et al., 2002; Yu et al., 2019; Zhu et al., 2021). A net loss of freshwater habitat can impact populations directly and also reduces the opportunities for marsh-dependent species to detect and migrate to areas of refugia as a means for climate adaptation.
Caribbean islands comprise a small fraction (0.15%) of global land surface area, however the region supports an inordinate representation of the worlds amphibian and reptile diversity, with 3% of all amphibians and 6.3% of the world’s reptiles occurring in the West Indies (Hedges, 1996). Similarly, Caribbean islands have seen a disproportionate level of anthropogenic impacts (e.g., development, forest loss, fragmentation, invasive species) (Martinuzzi et al., 2007; Collazo et al., 2018) and are expected to experience greater changes in climate extremes relative to baseline experience in temperate regions or continental landmasses with accelerated SLR, salinization of freshwater resources, erosion, extreme periods of precipitation and drying (Jennings et al., 2014; Nurse et al., 2014). Amphibians are among the most sensitive vertebrate groups to rapid environmental changes, largely the result of limited vagility, narrow distributions, and habitat specialization (Joglar et al., 2011; Case et al., 2015; Zhu et al., 2022; He et al., 2023). Puerto Rico was among the first regions to observe declining amphibian populations possibly attributed to climate change and other anthropogenic impacts (Joglar et al., 2011). To protect sensitive biodiversity and ecosystems from climate change on small tropical islands, the natural resource management community is tasked with exploring, adopting, and implementing novel conservation strategies to address proximate factors affecting amphibians and other species at appropriate planning scales.
Towards this end, we present a test-case to demonstrate a potential strategy for localized adaptation planning for species conservation in response to observed and projected global change impacts to important coastal systems. We selected an endangered and endemic amphibian, the plains coqui (Eleutherodactylus juanariveroi; Spanish: coqui llanero; hereafter llanero), on the island of Puerto Rico to represent a spatially discrete natural resource management issue of modest spatial scale. This species is a coastal, fresh-water wetland-obligate species with a highly restricted known distribution, currently believed to be limited to three small, isolated habitat patches on the island’s northern coastal palustrine fringe (Figure 1). We believe the species was once widely distributed throughout the northern coastal plain (Collazo et al., 2023), but has been restricted to isolated marsh patches due to land-use change and altered hydrology. Llanero is the smallest bodied of Puerto Rico’s 17 extant Eleutherodactylus species (14.7-15.8mm mean snout vent length) and is thought to occupy the smallest geographic distribution on the island. Since llanero was first identified from a single wetland in 2007 (Ríos-López and Thomas, 2007; Ríos-López et al., 2014), there have been recent discoveries of two additional isolated populations (Figure 1).
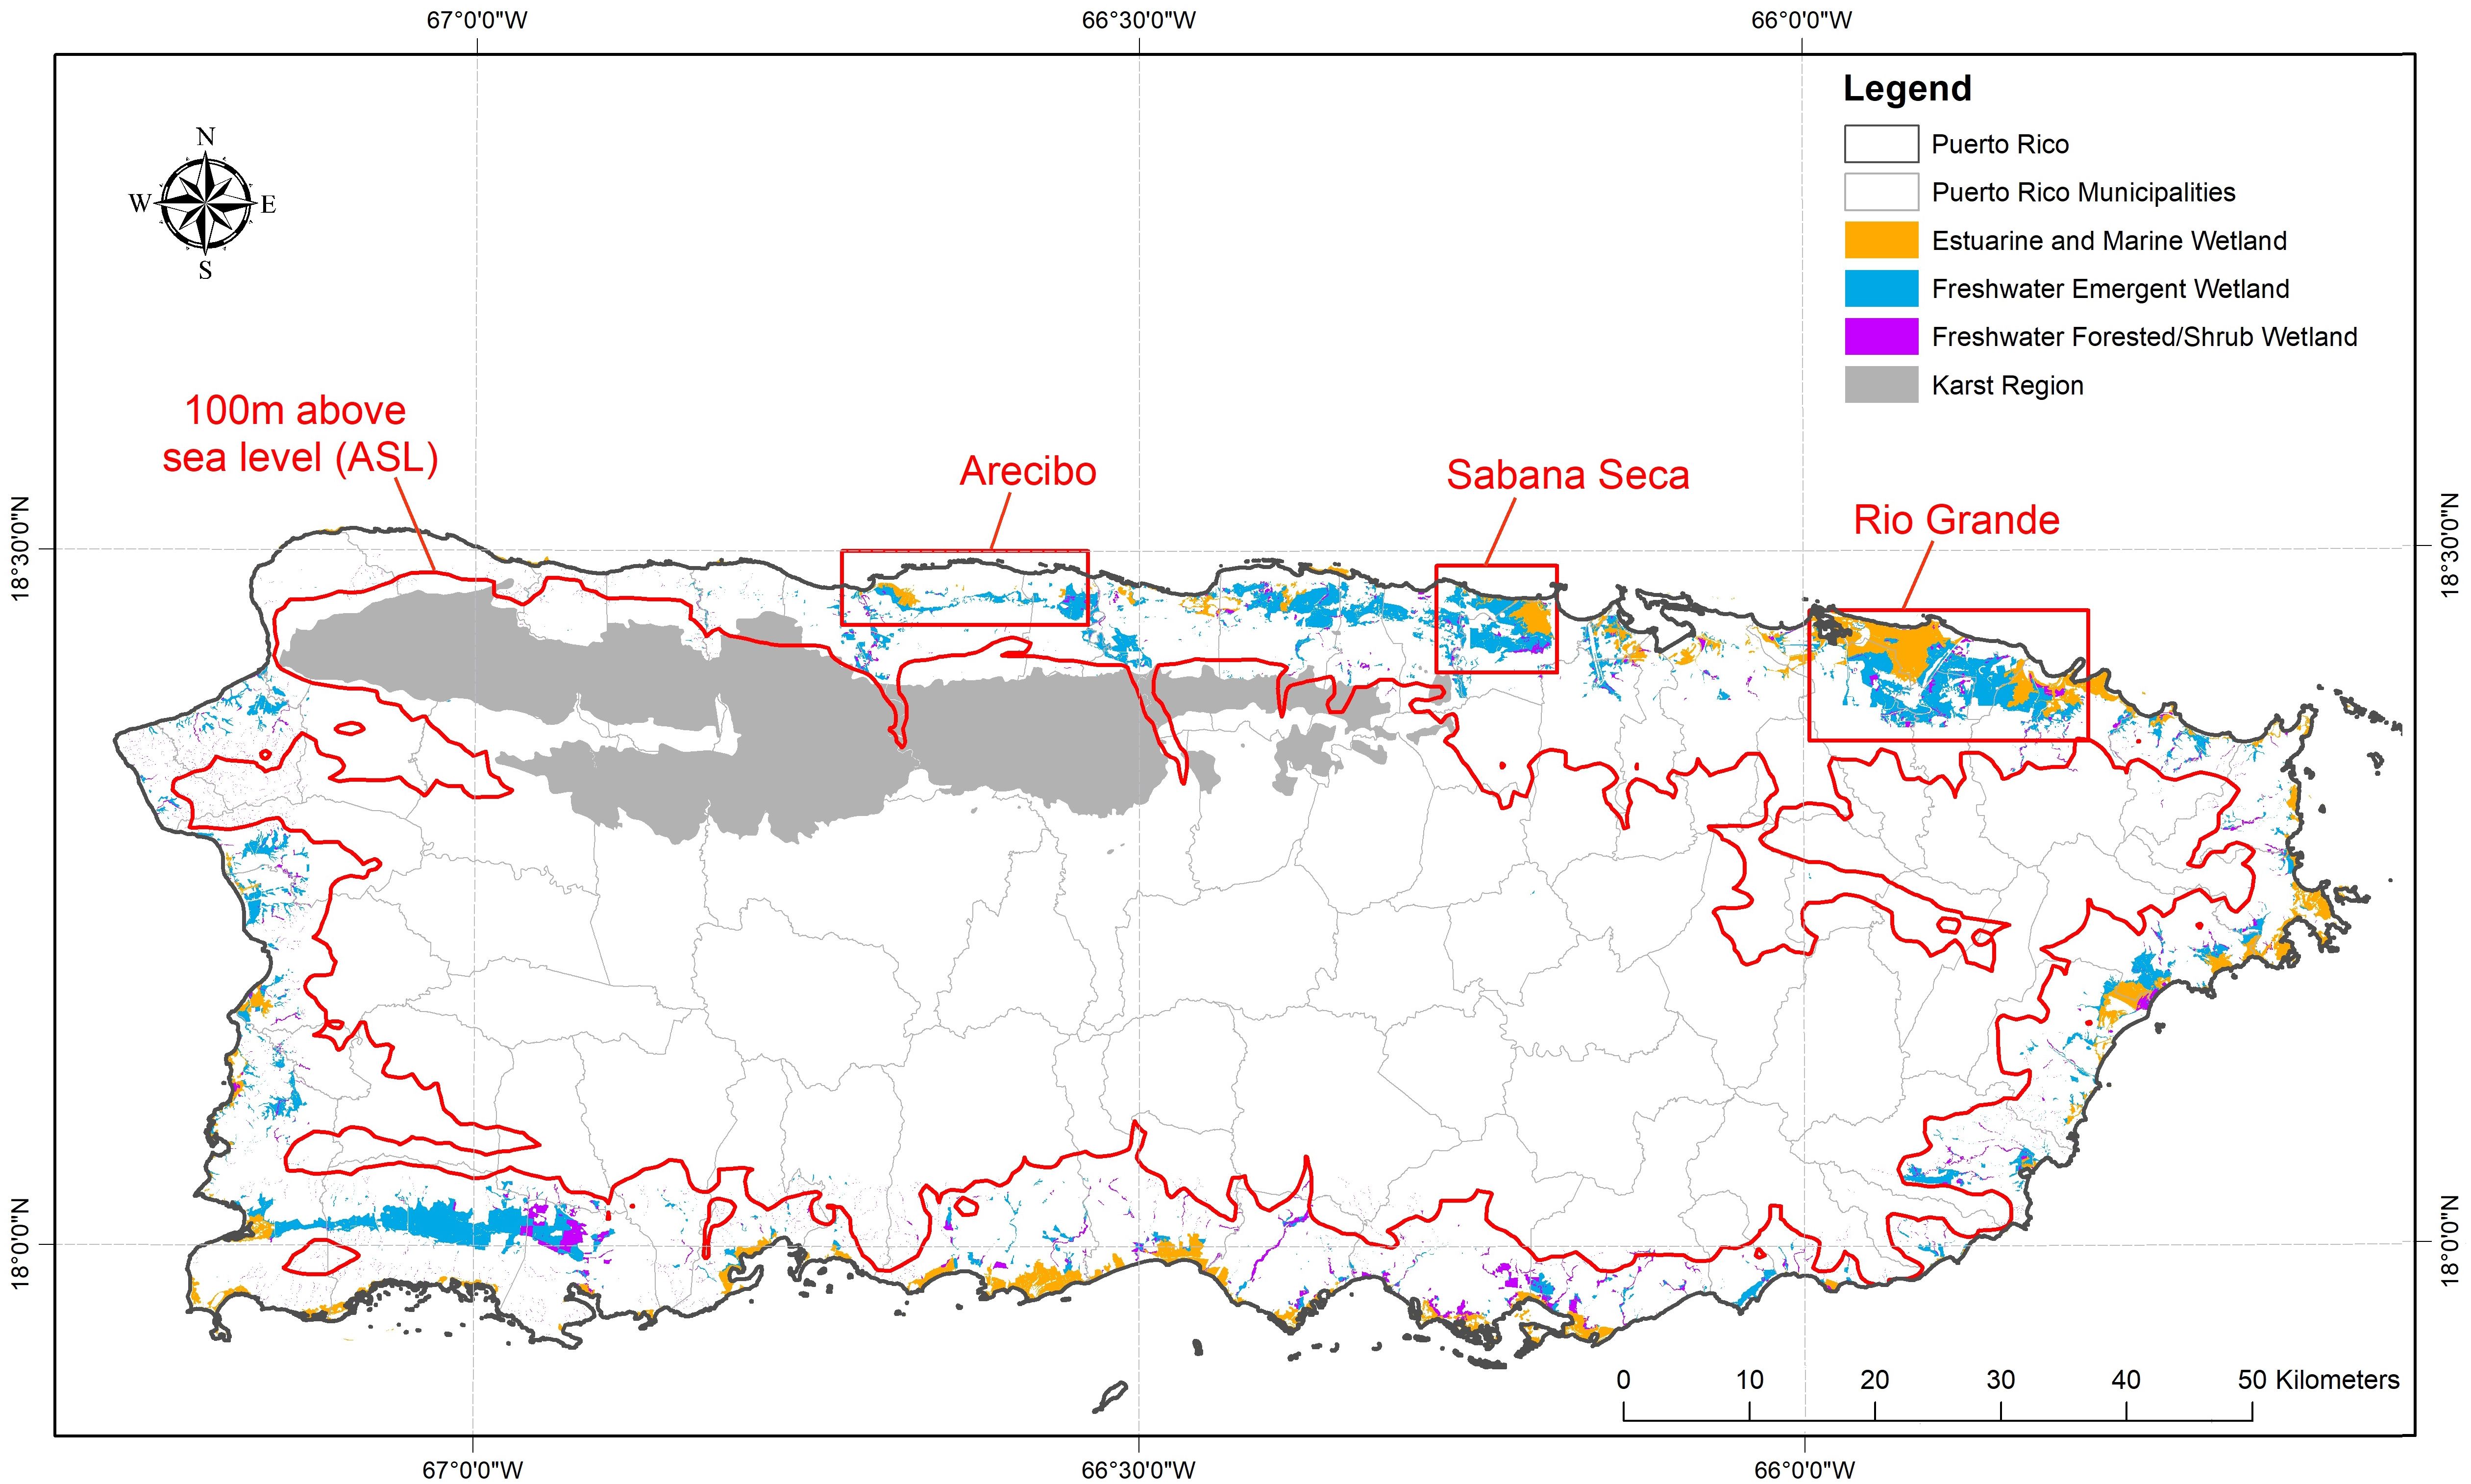
Figure 1. The island of Puerto Rico depicting the current distribution of coastal wetlands and the extent of the island’s karst geology. Outlined in red are the arbitrary boundaries representing the three currently known populations of the plains coqui (E. juanariveroi, “coqui llanero”): Sabana Seca population, discovered in 2005 (Ríos-López and Thomas, 2007) with critical habitat designated in 2012 (USFWS (United States Fish and Wildlife Service), 2012); the Arecibo population, discovered in 2022 (Morales-Pérez et al., 2022); and the Rio Grande population, discovered in 2023.
Puerto Rico’s coastal wetlands have been highly modified by humans since the 1500s, mostly in the form of agriculture; widespread urbanization of the northern coast has been the dominant source of land-use change since the 1930s (Ríos-López and Thomas, 2007). Wetlands of the northern coastal zone are maintained by high aquifer discharge provided by the island’s adjacent karst region. This discharge extends the hydroperiod on the coast, favoring marsh over forested wetland habitat (Lugo et al., 2001). These wetlands are characterized by emergent, seasonally flooded herbaceous non-saline wetlands dominated by ferns, flatsedges, rushes, grasses, and intermittent stands of the tree Pterocarpus officianalis (Ríos-López and Thomas, 2007; Yu et al., 2019). The bulltongue arrowhead (Sagittaria lancifolia) has been hypothesized to serve as an obligate substrate for llanero reproduction; its presence thus regulating the population dynamics and distribution of coqui llanero (Ríos-López et al., 2014). The coastal plains of Puerto Rico are particularly threatened by multiple factors. The rate of SLR recorded in northern Puerto Rico has advanced dramatically in recent years, with a 6-fold increase from 2.08 mm/year over the period 1962 to 2016 to 12.12 mm/year between 2010 and 2016 (Yu et al., 2019). Current mean elevation of coastal wetlands does not exceed 17m above mean sea-level (MSL; Ríos-López and Thomas, 2007) but most llanero localities are at less than 5m above MSL (pers. obs.). The potential of coastal marshes to naturally track SLR landward is effectively restricted by development and may be limited to river valleys and some riparian zones that have escaped development (Yu et al., 2019). In addition to urbanization, SLR, and future salinization of freshwater wetlands, other threats to the species include recreation, contamination from landfills, habitat damage from flood control, and competition or predation by invasive species (Ríos-López et al., 2014). As a result of these threats to Puerto Rico’s coastal wetlands, coqui llanero was designated as endangered by the U.S. Fish and Wildlife Service in 2012 (Ríos-López et al., 2014).
Climate change has been identified as a factor that may affect the demographics, abundance, and distribution of Puerto Rico’s natural resources, either directly (Jennings et al., 2014; Rivera-Burgos et al., 2021) or indirectly (e.g., through increased disease transmission; Burrowes et al., 2004; Joglar et al., 2011). The island is predicted to experience warming and drier conditions especially in the rainy season (Bowden et al., 2021). These changes will exacerbate the vulnerability of both coastal wetlands and temperature- and humidity-sensitive amphibians, including coqui llanero. In addition to protecting viable and resilient habitat within the current species distribution, an important strategy for conserving amphibians threatened by changing biotic and abiotic conditions is to secure habitat refugia (i.e., sites predicted to develop analog conditions into the future) in advance of these changes. Such sites could be protected adjacent to existing habitat, allowing for a gradual evolution of conditions (i.e., marsh migration, elevational climate tracking) at a velocity compatible with species’ natural dispersal capacity. An alternative approach is to use climate model simulations to identify future analog sites wherever they may exist; protecting and, if needed, restoring these sites now will increase adaptation options for future conservation measures, such as reintroductions to sites believed to be in the species’ historical range, assisted migration (i.e., translocation) to sites beyond the known indigenous range, or developing a connected network of migration corridors between existing protected areas. As of 2016, the government of Puerto Rico reported it had achieved a target of 16% of lands in various forms of conservation status (LCC Network, 2016).
We develop our test-case using multiple climate adaptation strategies to maximize the viability of a sensitive amphibian species of conservation importance. We begin by evaluating projected changes in future conditions of coastal wetlands, including SLR, altered precipitation regimes, and habitat transitions, to predict the possible impacts on the status and distribution of extant llanero populations. We consider a range of future scenarios to project the distribution of wetland refugia on the island; these become candidate sites for possible management interventions (e.g., protection, restoration, species reintroduction or assisted migration). Recognizing the uncertainty inherent in these climate and habitat scenarios, we then conduct a spatial portfolio analysis to demonstrate a well-grounded approach for managing the risk of investing in conservation actions to meet objectives for securing long-term resource persistence.
Methods
Modeling species and habitat distributions
For the purposes of this demonstrative model, we were limited in the number of parameters, level of detail, and sophistication in projecting future biotic and abiotic conditions of the island’s coastal wetlands. For recent historical observations (1963-1995), we characterized monthly precipitation and minimum and maximum temperatures using data based on the Parameter-elevation Regressions on Independent Slopes Model (PRISM, Daly et al., 2003) and made use of high-resolution global climate data for other abiotic variables provided by WorldClim (1970-2000; Fick and Hijmans, 2017). Biotic variables include landcover classification from year 2000 (Kennaway and Helmer, 2007), wetland habitat classification (Federal Geographic Data Committee, 2013), and soils data from the U.S. Department of Agriculture’s Natural Resources Conservation Service (NRCS; Soil Survey Staff, 2021). We used projected precipitation and temperature data for the period 2040-2060 under a higher greenhouse gas emissions scenario (RCP8.5) using dynamically downscaled climate model outputs produced for Puerto Rico at a 2km resolution (Bowden et al., 2021). The downscaled climate model projections were bias-corrected based on the PRISM using a simple delta approach (Hay et al., 2000) before using the values in any ecological models.
We developed a candidate set of niche models to estimate the species’ distribution under current conditions and to characterize habitat affinities and potential abiotic determinants of the species’ range based on the conditions of known localities (i.e., niche envelope). Species data for fitting distribution models consist of approximately 45 presence-only observational records with locality information from personal observations and a public database (GBIF, 2023) used to characterize environmental and abiotic conditions to which the species is currently exposed. Although there have been widespread, ad hoc efforts to establish the distribution of coqui llanero (Dávila Casanova, 2021), to our knowledge no systematic occupancy surveys have been performed that could be used for quantifying the detection process (MacKenzie et al., 2017) and for estimating putative species absences. To address this, we included a random sampling of background points distributed over the environmental and abiotic conditions of Puerto Rico’s coastal fringe (i.e., <100m above MSL) to characterize the variability of conditions where we assume the species may be absent (i.e., “pseudo-absence” data; Phillips et al., 2009). Because of the limited number of positive species records, we were unable to evaluate an exhaustive list of covariates explaining possible habitat affinities or avoidance. Instead, we focused on a small number of reasonable, a priori candidate factors including habitat classification and abiotic climate variables. Biotic variables include landcover classification, the refined wetland classification, and soil type. For climate variables, we used the PRISM data to derive mean annual precipitation, mean rainfall over the driest period (Feb-Mar), means of the two highest rainfall months (May and Nov), minimum temperature of the coldest month, and mean temperature of the north coast’s wettest quarter. Given the widespread conversion of wetland habitat to agriculture and urban development (Collazo et al., 2018; Yu et al., 2019), we hypothesize that low-lying, drained freshwater wetlands were likely to have supported llanero populations in the recent past and may represent additional viable habitat for llanero expansion (i.e., through migration or reintroduction) if these areas were to be restored. To evaluate this possibility, we estimate coefficient values for an alternate model specification by adding to the dataset 15 randomly assigned, hypothetical observations to those wetlands classified as drained or partially drained hydric soils (Cowardin et al., 1979; Federal Geographic Data Committee, 2013).
Using combinations of the selected covariates and their values for known llanero observation locations and background locations, we modeled the species’ current environmental niche by specifying a generalized linear model (GLM), using a logistic link function to relate the response variable (probability of occurrence) to a linear combination of habitat and environmental factors at a given location. Assuming upland regions of the island, where wetland habitats are mostly absent, will not be suitable to support llanero populations, we reduced the domain of our analysis to Puerto Rico’s coastal plains (<100m MSL). This area encompasses the three known populations and the majority of palustrine wetlands on the island’s coastal zone. We focus on three sub-regions around each of the three known populations (Figures 1, 2) to summarize and compare current wetland conditions and distributions to those projected under various future scenarios in greater detail. We evaluated a series of modeled combinations of current environmental variables for their fit to the data, using lowest values of AIC to select a final set of covariates that best explain variation in llanero occurrence and distribution (Burnham and Anderson, 2010). For each sub-region we evaluate the proportion of area predicted to have a high probability (>0.6) of current llanero occurrence. We retain the best-fit model under current conditions when evaluating changes in species distributions conditional on future environmental projections.
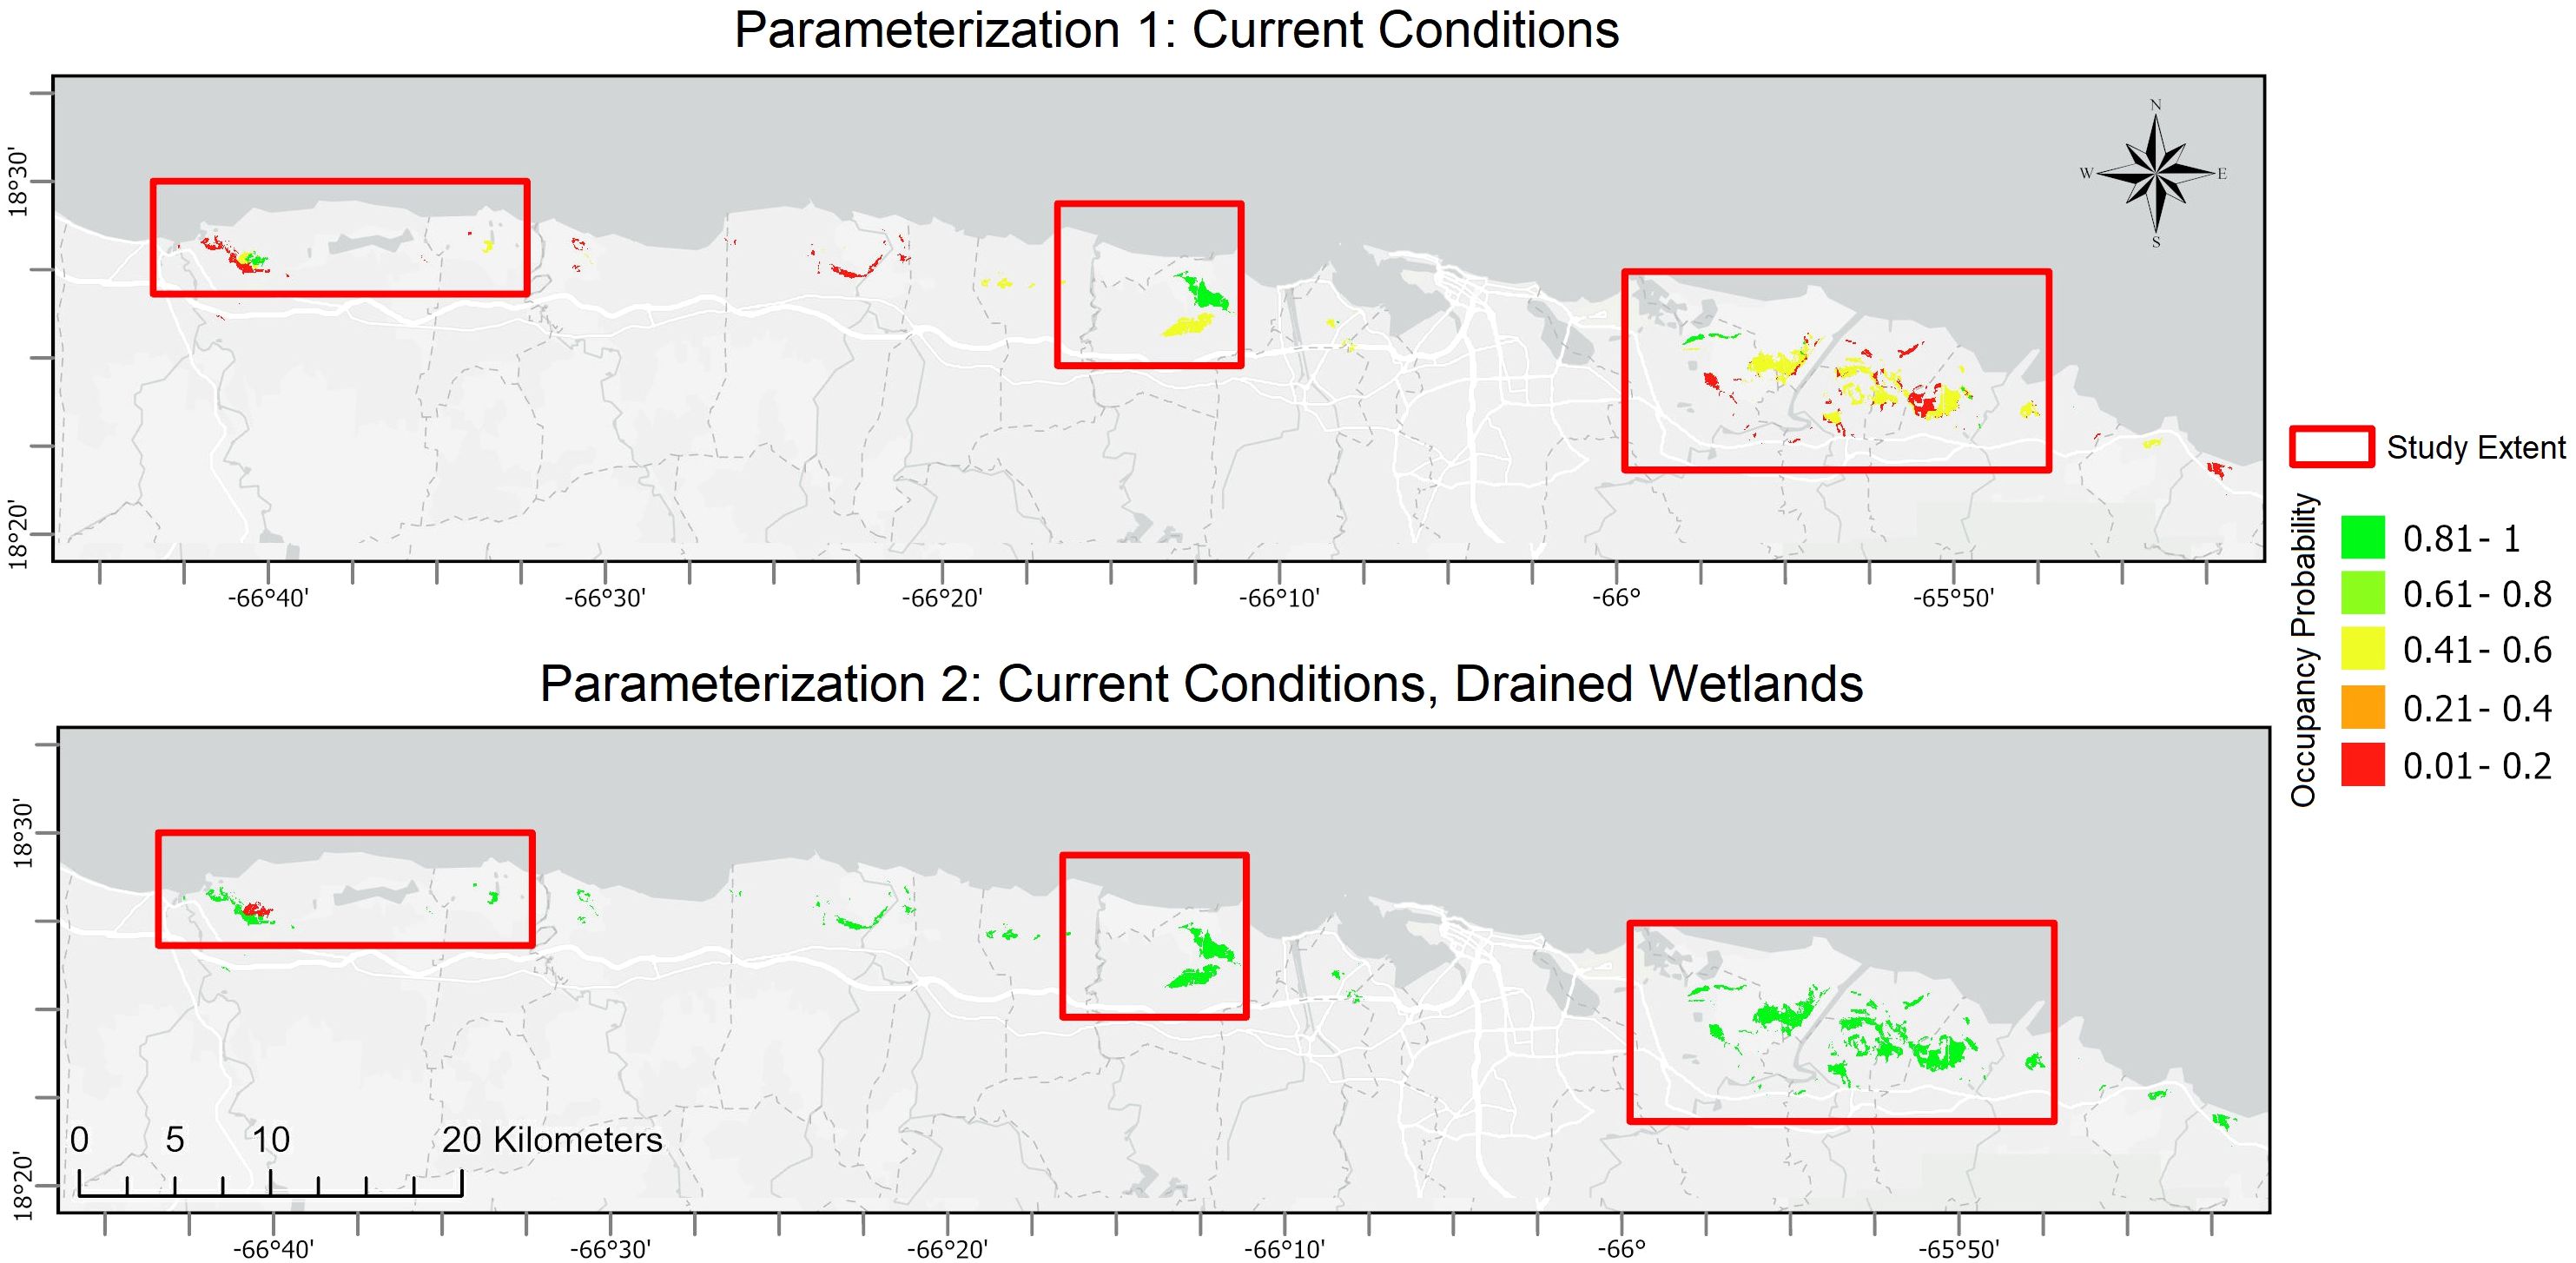
Figure 2. Modeled distributions of the plains coqui (E. juanariveroi, “coqui llanero”) across Puerto Rico’s north coast as a function of current select environmental conditions and under two model parameterizations. Parameterization 1 was modeled using known localities, none of which occur in drained wetlands, whereas Parameterization 2 hypothesizes drained wetlands represent valuable habitat for the species if restored. Red boxes denote the sub-regions analyzed in this study (see Figure 1 for the named designations and full spatial extent).
To model projected changes in species distributions and potential habitat refugia, we would ideally consider multiple hydrological processes that are sensitive to changes in precipitation and rising ocean levels, including freshwater recharge, changes in the water table, hydrologic head gradient, and the fresh water-saline water interface. Such models would then inform predictions of vegetation transitions and other biotic changes, but are not currently available to explicitly model these coastal processes. Instead, we rely on available covariate data to estimate changes under future climate scenarios, including precipitation and temperature projections and habitat transitions linked to SLR scenarios, as well as some static variables such as soils and wetland data layers. For changing sea levels, we rely on an available scenario-based model of SLR which projects spatially resolved changes in habitat cover types over a range of uncertain climate futures and sea levels, including scenarios of 0m (no change), 1m, 2m, and 3m SLR (SLAMM; Clough, 2008). Because future sea-levels were not attributed probabilistically to any given time horizon, the horizon used for climatological projections (2040-2060) represents the period for which the decision optimization is directed. Thus, the range of possible interactions between future precipitation and sea levels constitute an additional, unmodeled source of uncertainty. For each of the resulting eight scenarios – four SLR values with and without hypothetically restored wetlands – we then identified potential future refugia across the north coast with high predicted occurrence probability (>0.6) for further management consideration. All distribution modeling was performed in R (R Core Team, 2021) with the exception of reprojecting some spatial layers using ArcGIS Pro (ESRI v3.1).
Decision analysis using portfolio optimization
Significant and long-term investment is typically required for designing, implementing, or modifying a protected area network. We therefore propose the use of a quantitative portfolio optimization approach that accounts for uncertainty, spatial variability, and risk when evaluating any set of proposed investments in a conservation design (Markowitz, 1959). We evaluated the optimal allocation of resources to conserve an endangered amphibian through assisted migration, habitat restoration, and protection of future refugia under two related but distinct objectives for portfolio optimization: maximizing cumulative occurrence probability (benefit) constrained by a range of management budgets, and a two-objective problem balancing benefit maximization with the risk of investing in a conservation portfolio that performs poorly if an unexpected future unfolds. For either optimization approach, we use modern portfolio theory (MPT), a method which formalizes investment diversification as an explicit strategy to manage risk under uncertainty (Markowitz, 1959). MPT was developed in economics for addressing market uncertainty by postulating that an investment asset should not be assessed in isolation but that portfolios of assets be considered based on total expected benefits and by how each asset in the portfolio co-varies with all others as conditions (e.g., market, climate, or other) fluctuate. This approach quantifies risk by integrating a measure of asset variance over uncertainty and the correlation structure among asset pairs. Ignoring topographic, habitat, or political boundaries, we define a regular hexagonal grid (1000m resolution) across the focal domain coincident with areas below 100m MSL. We treat each grid cell as the unit of decision making (i.e., a potential asset to protect as current or future species refugia) and quantify expected benefit (EV) of the grid cell by taking the average projected occurrence probability from the distribution modeling (25m resolution) for each future scenario. We calculate the variance of each cell (var[EV]) and quantify risk by considering individual asset variance and how refugia quality covaries among all asset pairs over the range of future scenarios (Eaton et al., 2019, 2021). We model SLR as independent of future emission or warming scenarios and therefore do not assign probabilities to SLR scenarios; thus, we calculate EV, var[EV], and asset covariance as equally weighted.
For the optimization model, we consider both currently protected areas (PA; Protected Areas Conservation Action Team, 2018) and unprotected sites, aggregated to the resolution of the grid cell (i.e., a protected area is comprised of ≥1 grid cell). We identify previously drained wetlands and aggregate these as unique assets where they intersect with grid cells and further classify these as currently protected or unprotected cells. Finally, grid cells intersecting with areas of known llanero presence are classified as occupied. To reduce the dimensionality of the optimization problem, we further constrain the number of grid cells within the island’s coastal zone by including only those comprising protected areas, drained wetlands, cells with known llanero occupancy, and cells with a non-zero probability of occupancy across any of the four SLR scenarios. This approach reduces the decision space from >10,000 cells (island-wide), to 3,950 cells across the coastal zone (<100m MSL), to a final problem size of 925 grid cells included in the optimization. Because of the difficulty of assessing land values across Puerto Rico, we make simplifying assumptions regarding the costs of translocating frogs, protecting or restoring land assets, and monitoring existing or translocated populations. We assign a unit cost of 0.5 for implementing a translocation to an unoccupied cell. For each unprotected 1 km2 cell, we ascribe a cost of 1.5 as the cost to put the asset into protected status (i.e., purchase or put into a conservation easement at a cost of 1.0) and conduct the translocation. Because these are identified as climate-analog cells (i.e., matching expected future climate at one location with the current climate at another known location; Fitzpatrick and Dunn, 2019), we assume restoration is not required. We therefore assign a cost of 0.5 to translocate frogs to cells falling within a PA, assuming there is no additional cost to conserve or restore these parcels. Because the reserve design optimization software considers the possibility of divesting from a PA to add the recovered funds to the design budget (Ghasemi Saghand et al., 2021), we modified the protected status of PA cells so they would be ignored for translocation rather than be selected for divestment. For unprotected, drained wetland sites, we assign a unit value of 2.0 to account for the cost to protect and restore these sites prior to conducting a translocation. Therefore, a cost of 1.0 is assigned to drained wetlands falling within a PA, reflecting the costs of restoration and translocation. Finally, we assume a nominal cost of 0.05 for monitoring currently occupied sites. With these specifications, our optimal spatial portfolios include decision outcomes reflecting nine possible management actions for each of the 925 grid cells evaluated – 1) disregard an unprotected cell, 2) conserve an unprotected cell and translocate frogs, 3) translocate to a currently protected cell, 4) disregard a protected cell, 5) restore and translocate to a protected drained wetland, 6) conserve, restore and translocate to an unprotected drained wetland, 7) disregard a drained wetland cell, 8) monitor a currently occupied cell, and 9) discontinue investing efforts into a currently occupied cell.
We evaluate reserve designs under two optimization frameworks and across a range of unit-cost budget scenarios. We developed a range of budget constraint scenarios, using unit-costs values of {10, 30, 50, 75, 100, 150, 200}, based on a set of trial model runs, with the highest budget scenario corresponding to the point where no changes in portfolio decisions or values were observed. The two forms of optimization included a cost-constrained maximization and a risk-benefit tradeoff analysis. The former strategy focuses on maximization of expected occurrence value conditional on budget constraints, while the latter prioritizes trading off expected return with risk minimization using a Nash bargaining solution (Nash, 1950; Eaton et al., 2019) under each budget-constrained scenario. We performed all portfolio optimizations using the SiteOpt package (Ghasemi Saghand et al., 2021) in R. SiteOpt was designed to solve large portfolio optimizations by solving a series of smaller, binary linear or quadratic optimization problems that obviate the need to compute the full Pareto-optimal frontier (Sierra-Altamiranda et al., 2020). The SiteOpt optimization model allows us to efficiently identify the best and worst values for each objective (return, cost, risk) independently, and find Nash-optimal solutions that balance bi-objective problems (e.g., cost vs. benefit or benefit vs. risk) by identifying the location on the Pareto frontier where the volume of dominated alternatives is maximized (Santín et al., 2017; Eaton et al., 2019; Sierra-Altamiranda et al., 2020; Supplementary Figure S1). For each budget scenario, we quantify the proportion of the maximum possible management return produced by the optimum,
where PBb is the proportion of total benefit provided by an optimal portfolio at budget level b, is a vector of occurrence probabilities for each grid cell (unweighted expected values across S environmental scenarios), and xi,b is a vector of binary decision variables which take a value of one if grid cell i is identified for a conservation action (i.e., protection, restoration or translocation) and zero if no action is recommended for cell i under budget level b. We also evaluate the proportion of the ideal benefit for the optima under each budget level, as well as the proportion of worst-case risk or costs (i.e., nadir of the Pareto frontier) for each optima incurred at a given budget level (see Equations 5-8 in Sierra-Altamiranda et al., 2020). Evaluating the trends produced by these tradeoffs can provide insights to decision makers regarding idealized levels of funding to maximize rates of increase in management return and, alternatively, to minimize rates of loss (i.e., cost and risk). For each of the two optimization frameworks and under each level of investment, we additionally quantify the number of new parcels recommended to add to the PA network and the average value each decision category contributes to the total expected portfolio return.
Results
Current estimates of coqui llanero distribution
Applying a balance of statistical model diagnostics (e.g., minimized AIC values) and biological knowledge of the species (Porfirio et al., 2014), we used a stepwise approach to evaluate combinations of covariates to select a final model for predicting species distribution. The model with the lowest AIC included categorical variables of landcover class, soil type, and wetland category, as well as a continuous variable of average monthly rainfall during the driest period (Feb-Mar). The next best-supported model included these same variables with the exception of precipitation. Selected covariates also conform to expert understanding of drivers of llanero distribution (N. Ríos-López, pers. comm.). Based on the best-fit model and using a threshold occurrence probability > 0.6, the area occupied in Arecibo is estimated to be approximately 32 hectares (0.5% of the undeveloped habitat extent in the demarcated sub-region), 179 hectares (3.6%) in Sabana Seca, and 53 hectares (0.4%) in the Rio Grande region (Figure 2). The overall predicted distribution of llanero across the coastal wetlands of Puerto Rico is 267 hectares or 0.1% of the potentially available habitat in the region (Table 1; Figure 2). Under the same model but including hypothesized species presence in currently drained wetlands, the predicted distributions of llanero increase considerably. The overall prediction of potentially occupied area for the island’s coasts increases to approximately 1930 hectares, a more than 7-fold expansion relative to the initial parameterization (Table 1; Figure 2).
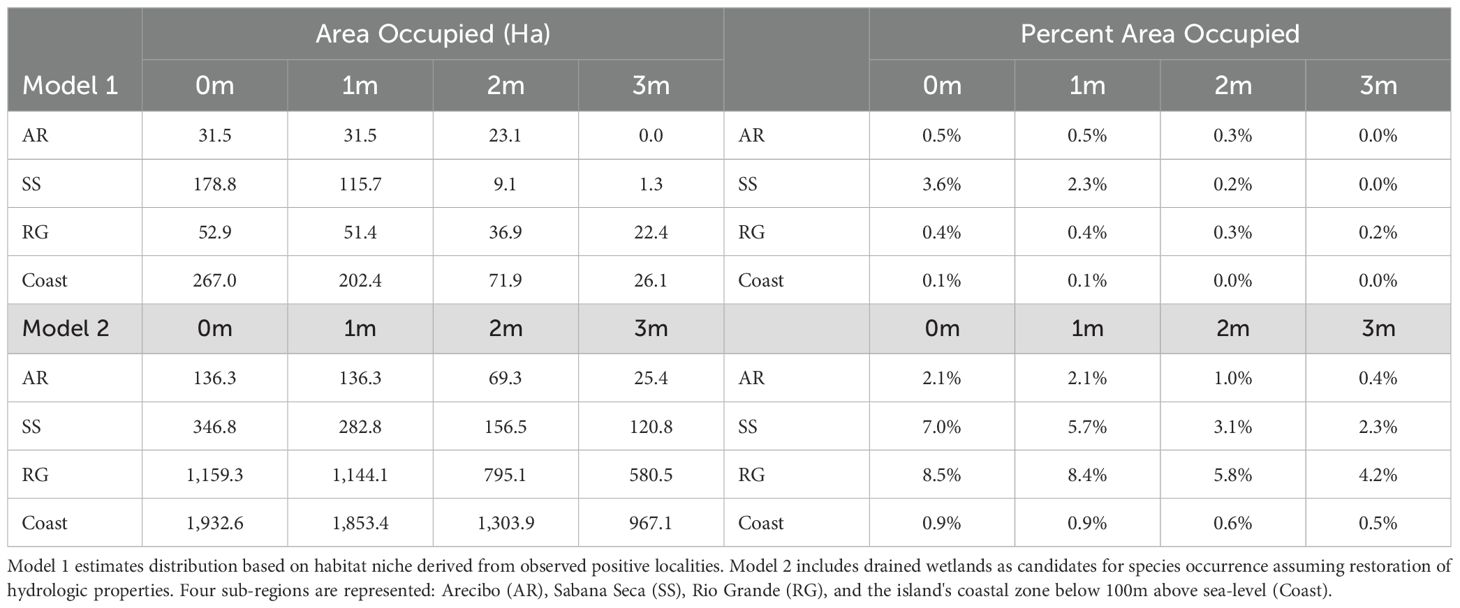
Table 1. Projected area (hectares) and percent of sub-regions occupied by coqui llanero under current sea levels and for scenarios of 1-3m sea-level rise (SLR).
Projected changes to abiotic conditions and coastal wetlands
Puerto Rico’s northern coastal plains and karst region fall within the subtropical moist forest life zone (Khalyani et al., 2016). Daily average minimum temperatures are projected to increase from 1.2—1.5˚C and maximum temperatures by 1.1 to 1.6˚C during the period 2041-2060 under the high emissions scenario and annual precipitation is projected to decline between 9 and 23%, with model-consistent reductions in extreme, afternoon, and evening rainfall (Bowden et al., 2021).
To evaluate the range of projected changes in abiotic conditions at the scale of current llanero distribution, we compared historical to future projected mean precipitation values for our delineated coastal region. To do this we took the original downscaled output from Bowden et al. (2021) and calculated the percent differences in mean monthly precipitation at each 2km grid cell of the projection period (2040-2060) compared to the historical model simulation period (1985-2005). Then, we applied these percent differences to the PRISM data (Daly et al., 2003) over that dataset’s analysis period (1963-1995) to obtain estimated changes in the absolute amount of mean precipitation. We assume that even though there is only partial overlap between the PRISM historical period and the historical climate model simulation period, the two periods are climatologically (and statistically) similar since both dataset periods represent times before the global anthropogenic signal had significantly emerged. We apply this procedure, rather than directly using the percentage precipitation change from the climate model simulations because the absolute precipitation values are required for the species distribution models. Under the RCP8.5 scenario, average monthly rainfall in our study area for the driest two months (Feb-Mar) is projected to decline 16% by the middle of the century from a current monthly average of 70 mm (Figure 3A). Precipitation during the wettest month (May), currently averaging 198 mm, is projected to decrease by 23% with the greatest declines projected to occur over the northwestern karst mountains and in the eastern cordillera (Figure 3B).
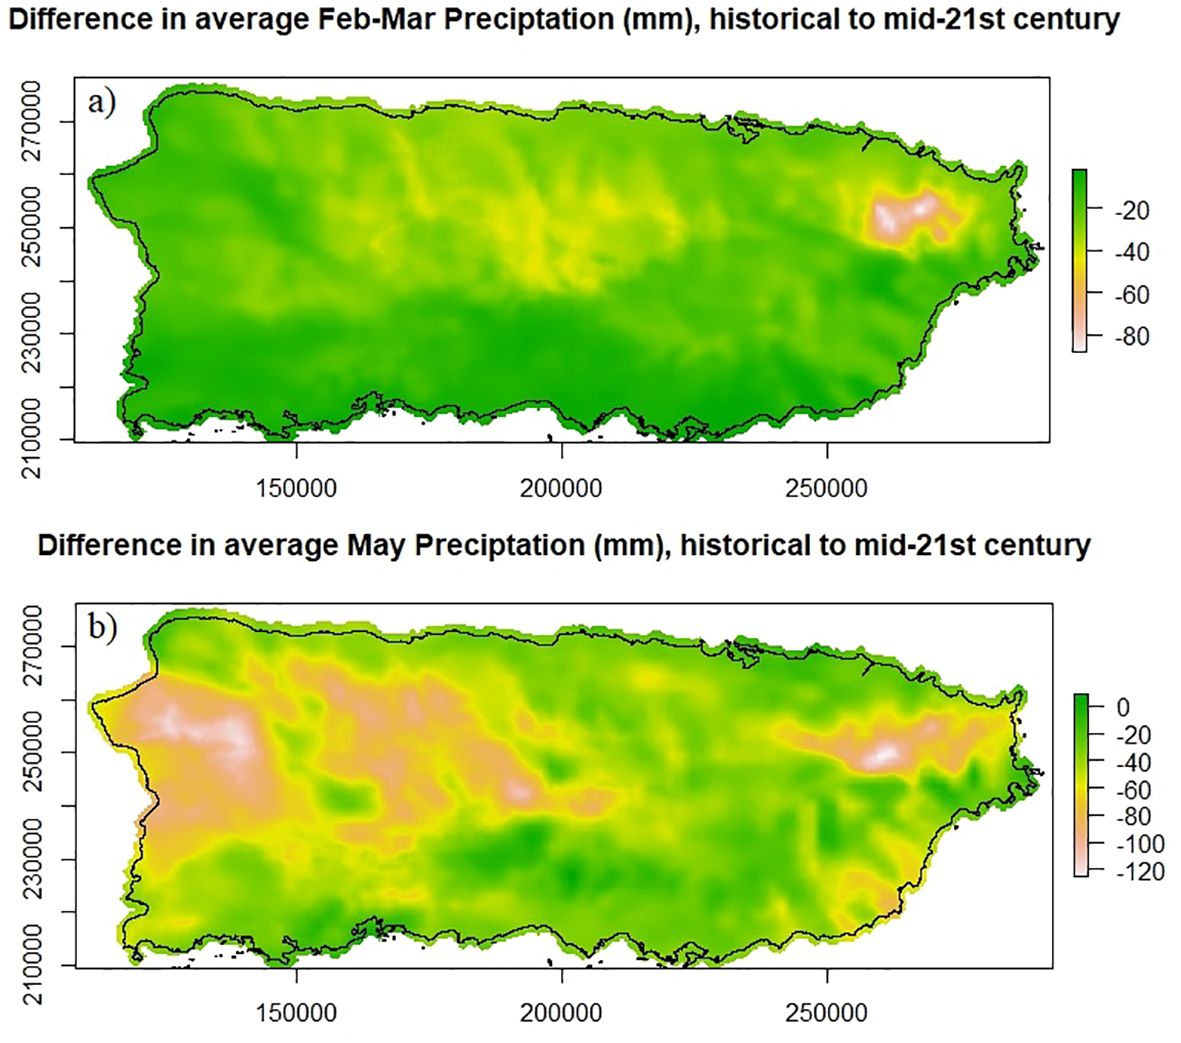
Figure 3. Projected declines in precipitation across Puerto Rico for (A) the dry season (Feb-Mar) and (B) the month of highest precipitation (May). Declines are visualized as differences between mean monthly historical (1963-1995) and mid-century (2050) projections.
Current freshwater marsh (based on an a priori SLR scenario of no change) is estimated to cover approximately 16% of the coastal fringe, with the three sub-regions comprising a much higher representation of potentially suitable marsh habitat (Arecibo: 38%, Sabana Seca: 38%, Rio Grande: 33%; Table 2A). Across the three additional a priori SLR scenarios (1m, 2m, 3m), SLAMM output predicts substantial loss of freshwater marsh (ranging from less than 1% to 3.5%), with the highest expected losses being inland freshwater marsh and irregularly flooded marsh (losses as high as 27% and 20%, respectively, under the highest predicted SLR). Transitional marsh is projected to more than triple in area, open estuary area experiences up to a four-fold increase, and ocean beach expands more than three-fold under the 3m SLR scenario (Table 2B). Projected wetland losses are not distributed equally across the three llanero sub-regions. Regardless of the scenario, Sabana Seca is projected to experience the greatest relative loss of critical habitat, from 20% to 73%. The Rio Grande and Arecibo areas are projected to experience similar levels of loss, from 2% and 3% under a minimal SLR and 42% and 44% under highest SLR, respectively.
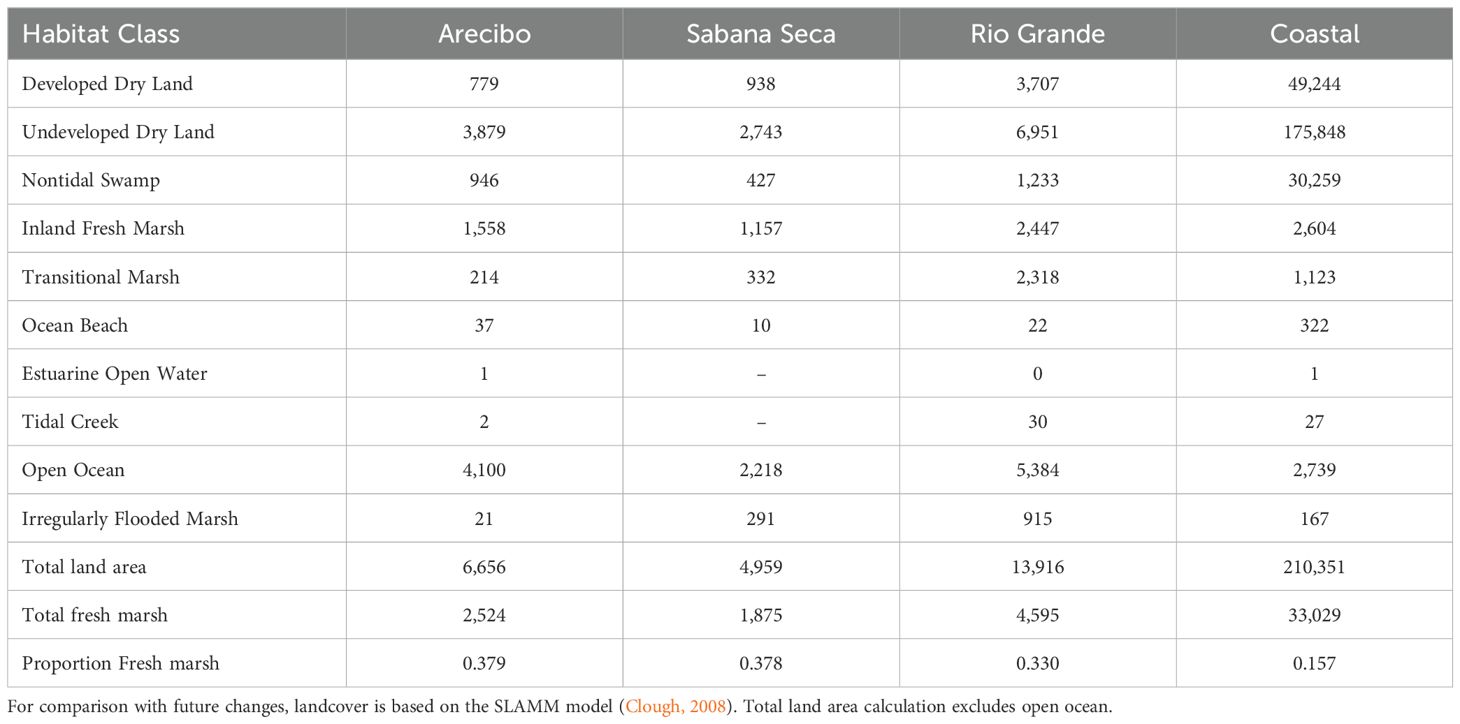
Table 2A. Distribution of landcover classes under current conditions, in hectares, for the sub-regions designated in this study.
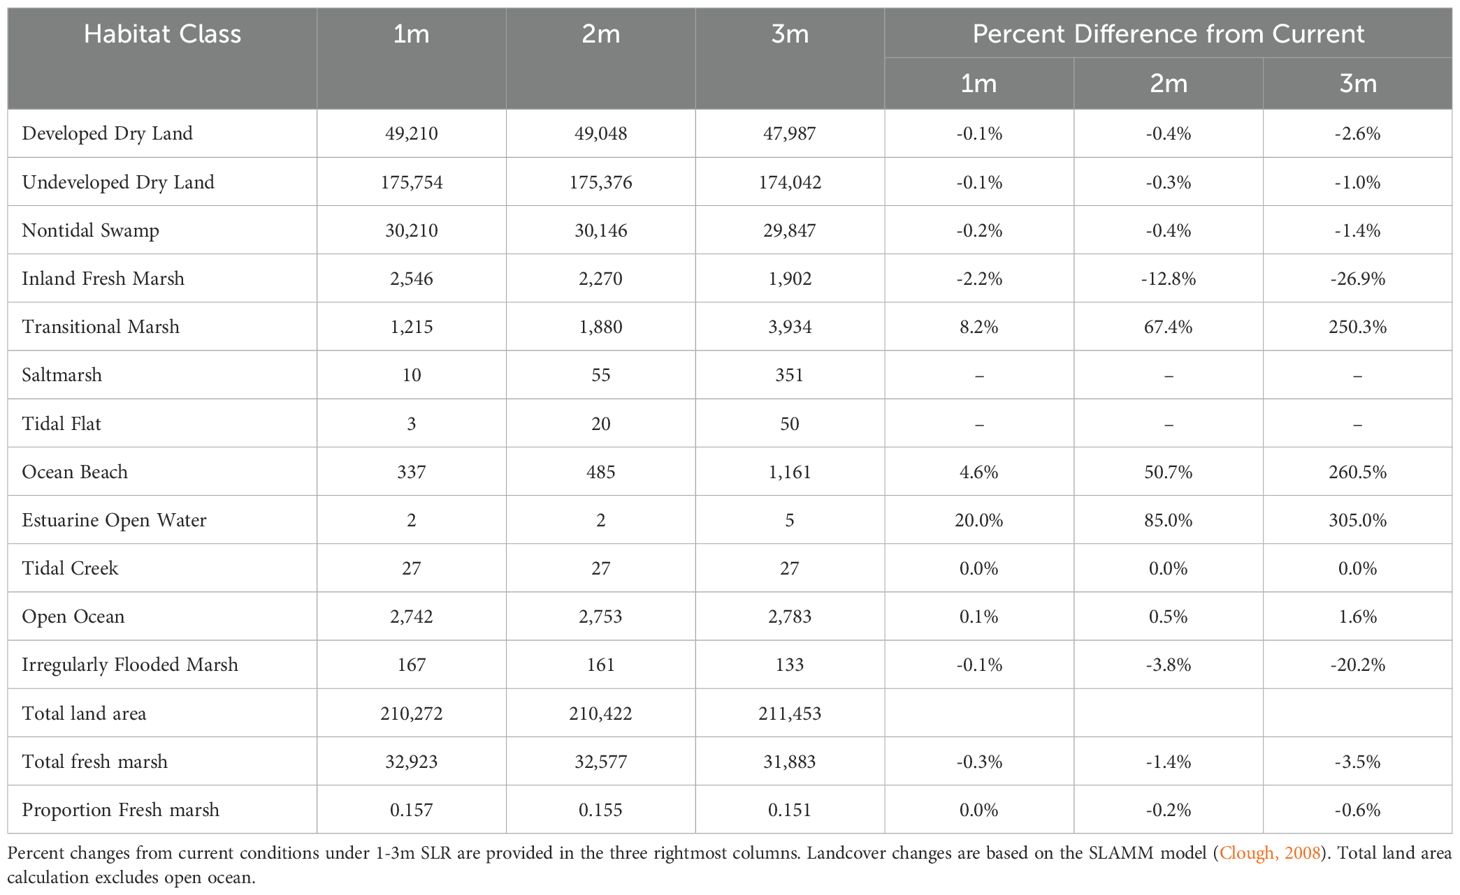
Table 2B. Distribution of projected future landcover classes, in hectares, for Puerto Rico’s coastal zone (below 100m above sea-level) as designated in this study.
Projected changes in coqui llanero distribution and identification of habitat refugia
Interactions of climate change with SLR-driven habitat transitions are expected to result in significant changes to the species’ distribution, with somewhat unexpected spatial variation over the modeled scenarios. Using a threshold probability of occurrence of >0.6 to estimate area occupied, a 1m SLR scenario is projected to have no impact to llanero distribution in Arecibo but results in a 35% decline in the occupied area in Sabana Seca. Under the 2m SLR scenario, the projected loss of occupied area ranges from 95% in Sabana Seca to a 27% loss in Arecibo. A 3m SLR scenario would result in total extirpation of the population in Arecibo and a decline in occupied area of ~58% in Rio Grande. Across the three SLR scenarios, the entire coastal zone would experience average losses in llanero distribution of 25%, 73%, and 90%, respectively (Table 1; Figure 4). Predicting changes in llanero distribution under the second parameterization (which models occupancy assuming drained wetlands are currently occupied) resulted in similar patterns of reductions in species distribution with increasing SLR, although with overall greater extents of area occupied and larger proportional losses under rising seas (Table 1). Despite the disparities in projected habitat-area loss over the three population sub-regions, shifts in future habitat refugia follow a similar pattern, with refugia projected to shift landward over SLR scenarios, suggesting saltwater intrusion or habitat transition may be stronger drivers of population dynamics relative to changes in rainfall, temperature, or other factors. The consequences of these dynamics of near-coast habitat loss, and potential inland habitat gains, is a shift away from areas of known occupancy, particularly in Arecibo marshes (Figure 4). Under the second parameterization (drained wetlands modeled as potential habitat), llanero is predicted to be more widely distributed relative to the original parameterization (Table 1), including scattered distributions beyond the northern coastal plains to eastern wetlands (Figure 5). Although the area of occupancy declines with increasing SLR, at an occupancy probability threshold >0.6, the predicted distribution increases when using this more permissive niche parameterization relative to the first parameterization. This suggests the potential opportunity for expanding freshwater habitats (e.g., transitional marsh; Table 2A) to act as refugia for llanero as ocean levels rise (Figure 5).
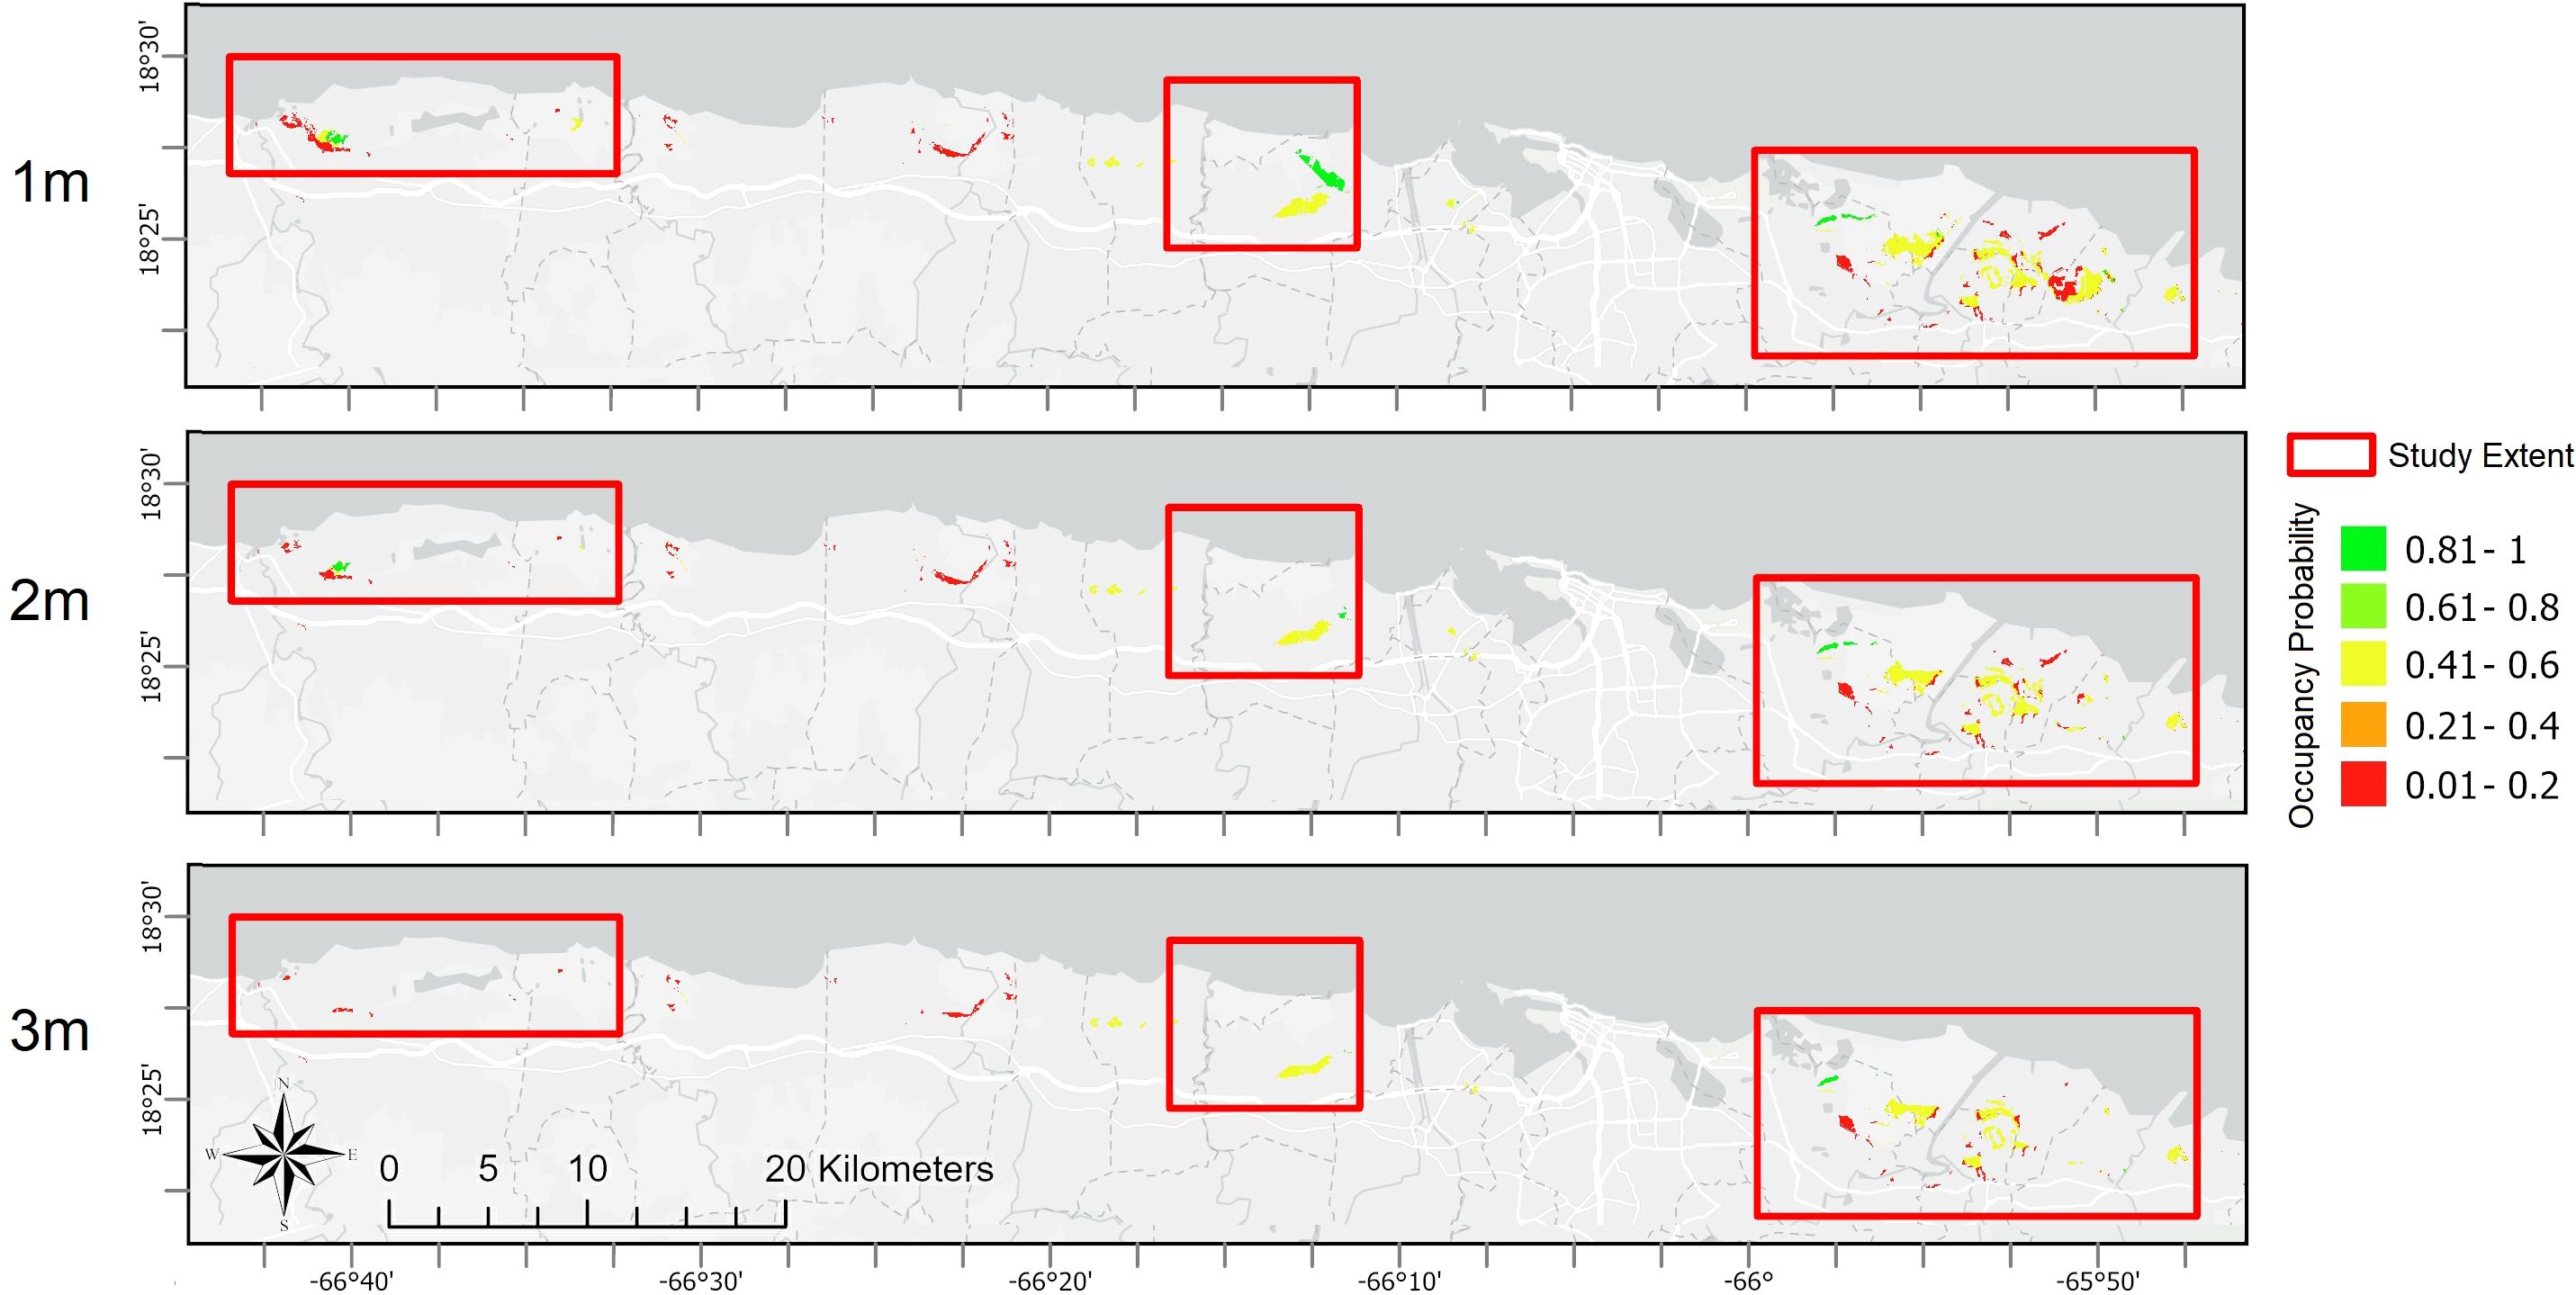
Figure 4. Modeled probabilities of future plains coqui (E. juanariveroi, “coqui llanero”) distribution across Puerto Rico's northern coast, and at three sub-regions included in this study (see Figure 1). Rows represent future uncertainty in sea-levels, with scenarios of 1m, 2m, and 3m of sea-level rise (SLR).
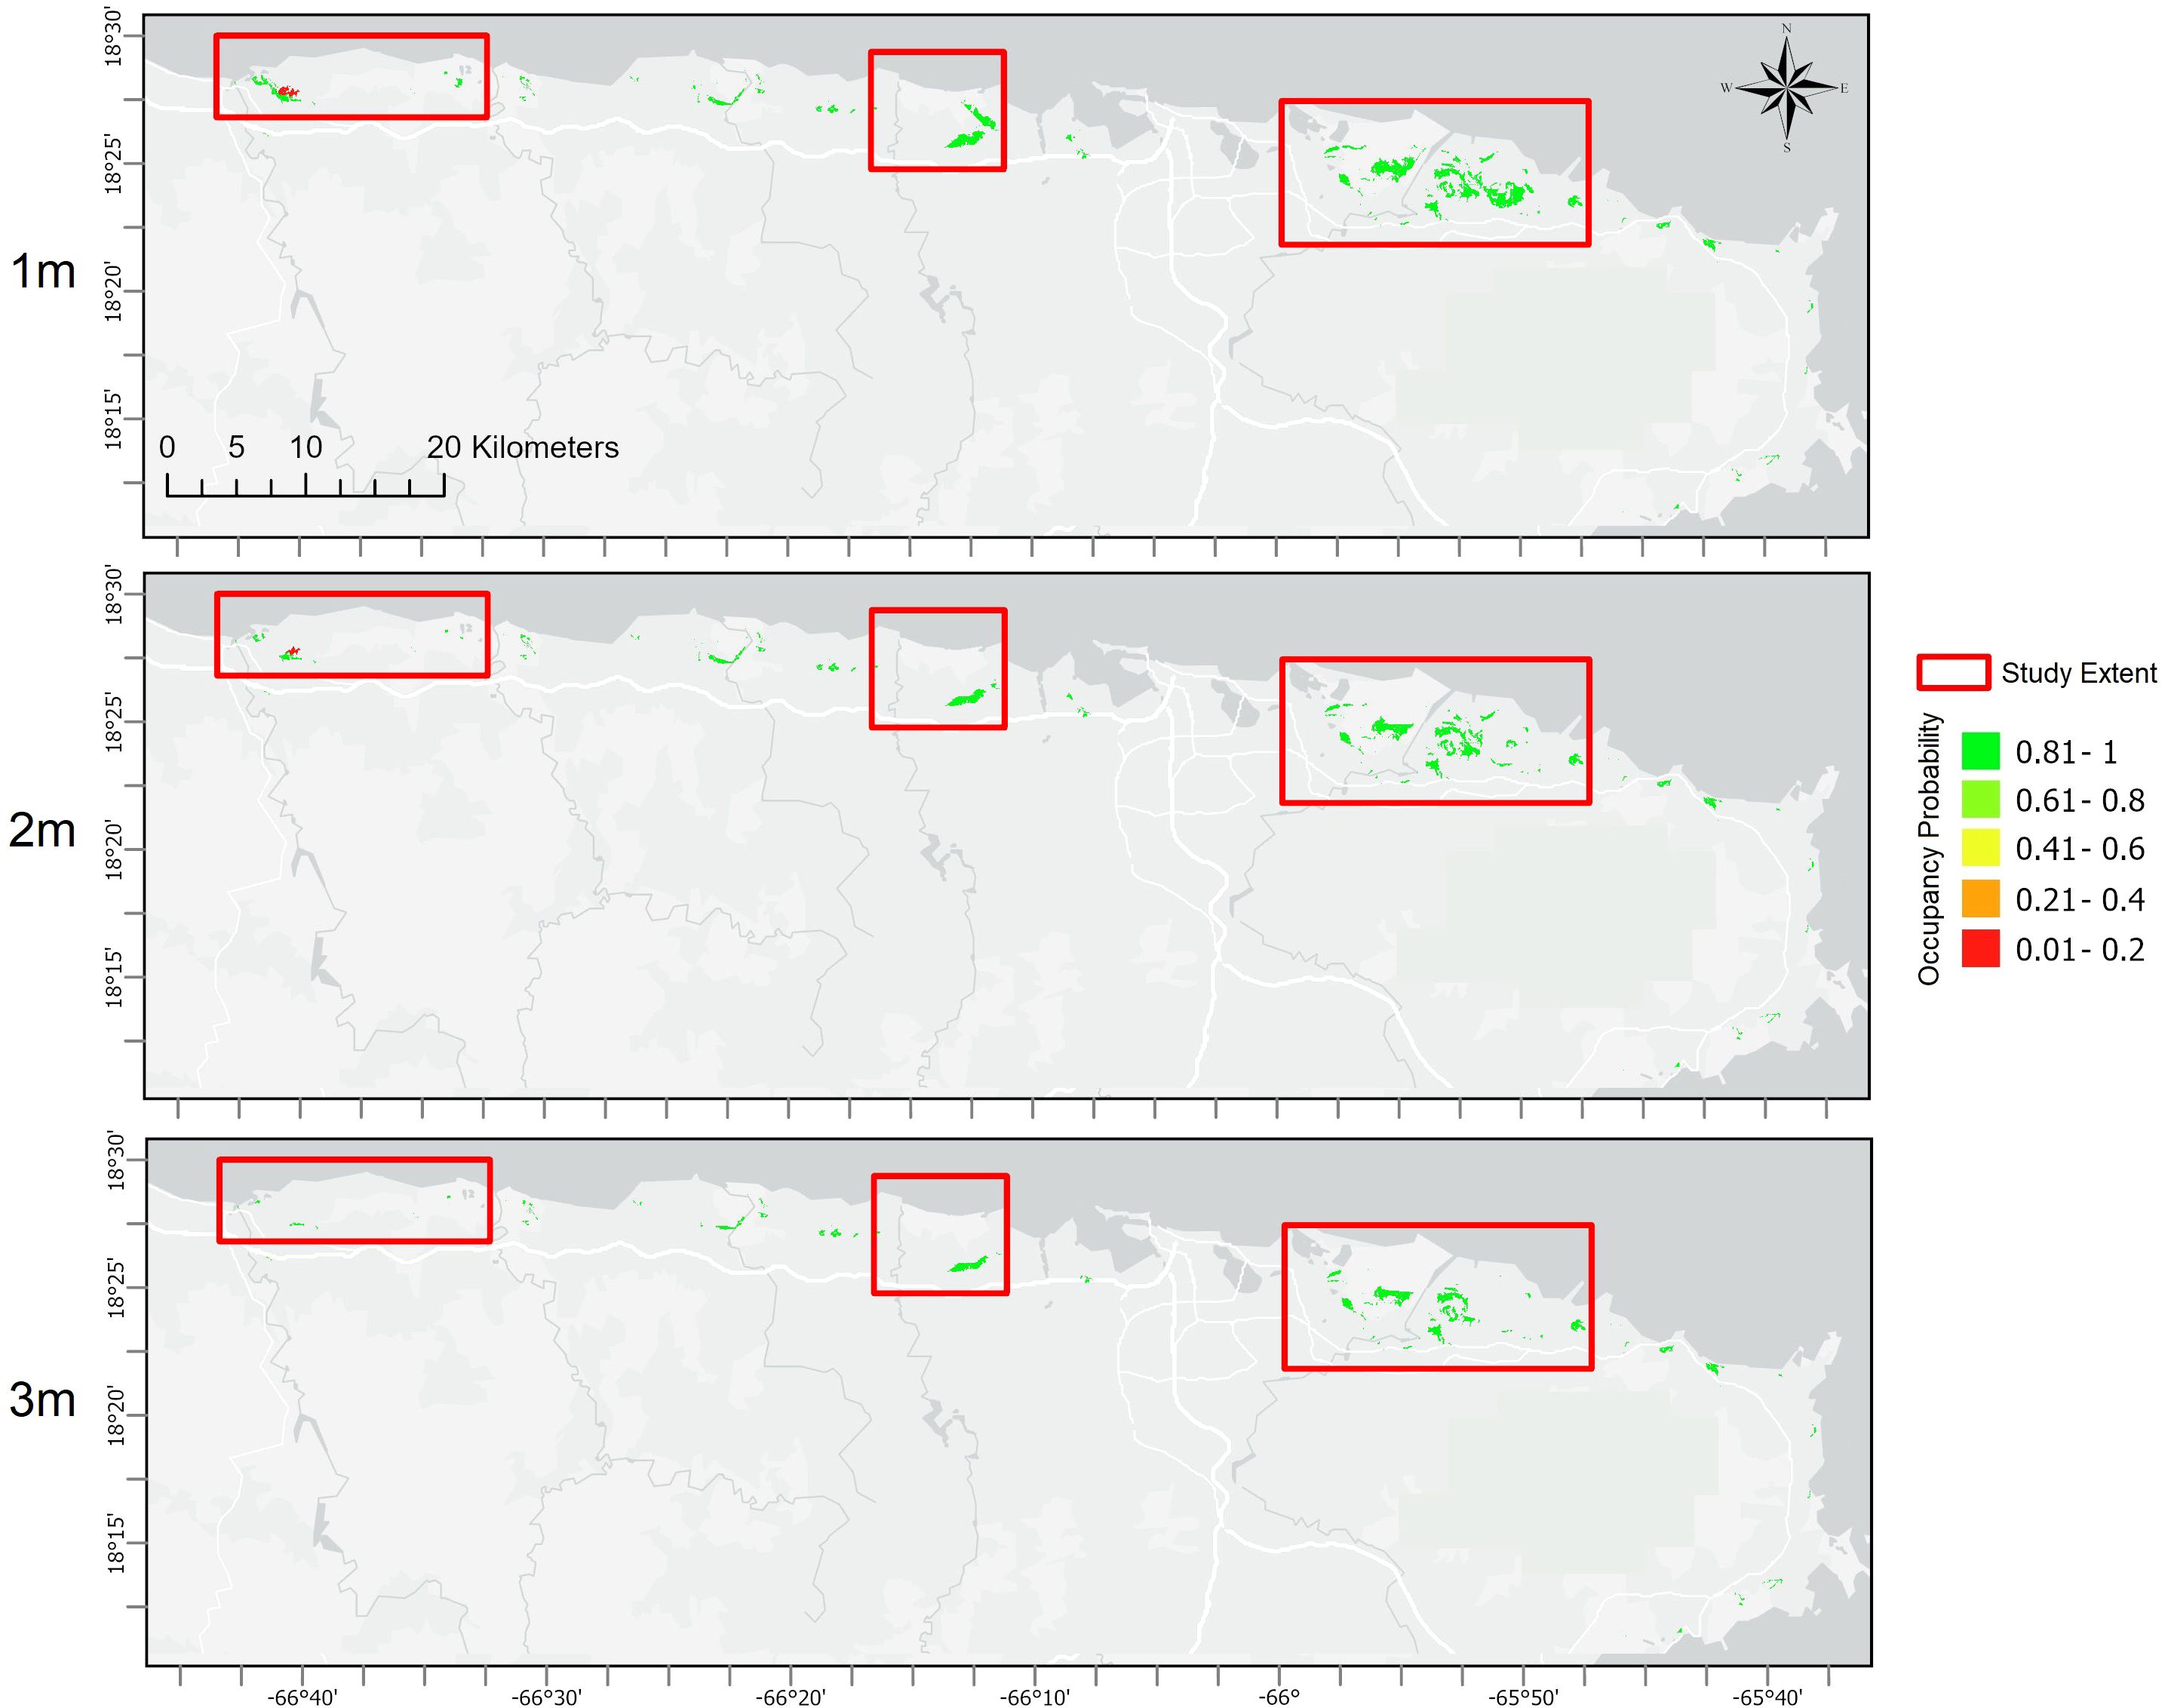
Figure 5. Modeled probabilities of future plains coqui (E. juanariveroi, “coqui llanero”) distribution across the northern and eastern coastal zone included in this study (see Figure 1 for the named designations) under the alternative parameterization in which predicted species distribution is modeled assuming drained wetlands represent viable habitat. Rows represent future uncertainty in sea-levels, with scenarios of 1m, 2m, and 3m of sea-level rise (SLR).
Portfolio optimization for a risk-managed adaptation to climate change
The covariance structure of expected parcel benefits across climate scenarios revealed that the majority (95.2%) of grid-cell pairs are either uncorrelated or negatively correlated with changes in SLR (i.e., < 4.8% of cell pairs co-vary positively across scenarios). A neutral (uncorrelated) or negative (one parcel improves while the other declines under a given scenario) relationship between pairs allows for managing risk through diversification of a reserve portfolio with sites that bet-hedge over the full range of climate uncertainty. This contrasts with a strategy of selecting those parcels which are individually expected to provide the highest benefits (i.e., averaged over scenarios). Our cost-constrained optimization approach did not include this risk-mitigation but produced results comparable to the risk-return framework (Table 3). This outcome may be due in part to the small percentage (< 1%) of negatively correlated site pairs contributing to the neutral or negative relationships among parcels, suggesting that bet-hedging opportunities for coastal sites may be limited and, thus, managing risk may not play as large a role in protected area design for coastal Puerto Rico as might be expected. Under this first approach, our evaluation of SLR scenarios across the coastal zone offers evidence that the location of potential refugia sites may vary spatially as a function of future climate outcomes (Figure 5). As budgets increase, a cost-constrained maximization suggests an increased focus of translocations to existing protected areas, with greater emphasis in the northeast region of the island (e.g., Rio Grande) with some new sites added to conserve wetlands near Sabana Seca and Rio Grande at very high budget levels, relative to the north-western population (Figure 6). Drained wetlands are not identified for protection or restoration under this optimization, except for one protected site under the highest budget scenario. Using this framework, translocating to existing PAs contributes an average of nearly 80% of the total expected conservation benefit, while adding new parcels to the reserve design contributes only 14% of the expected benefit. Continued investment for monitoring existing populations adds an average of 6% to the conservation outcome (Table 3).
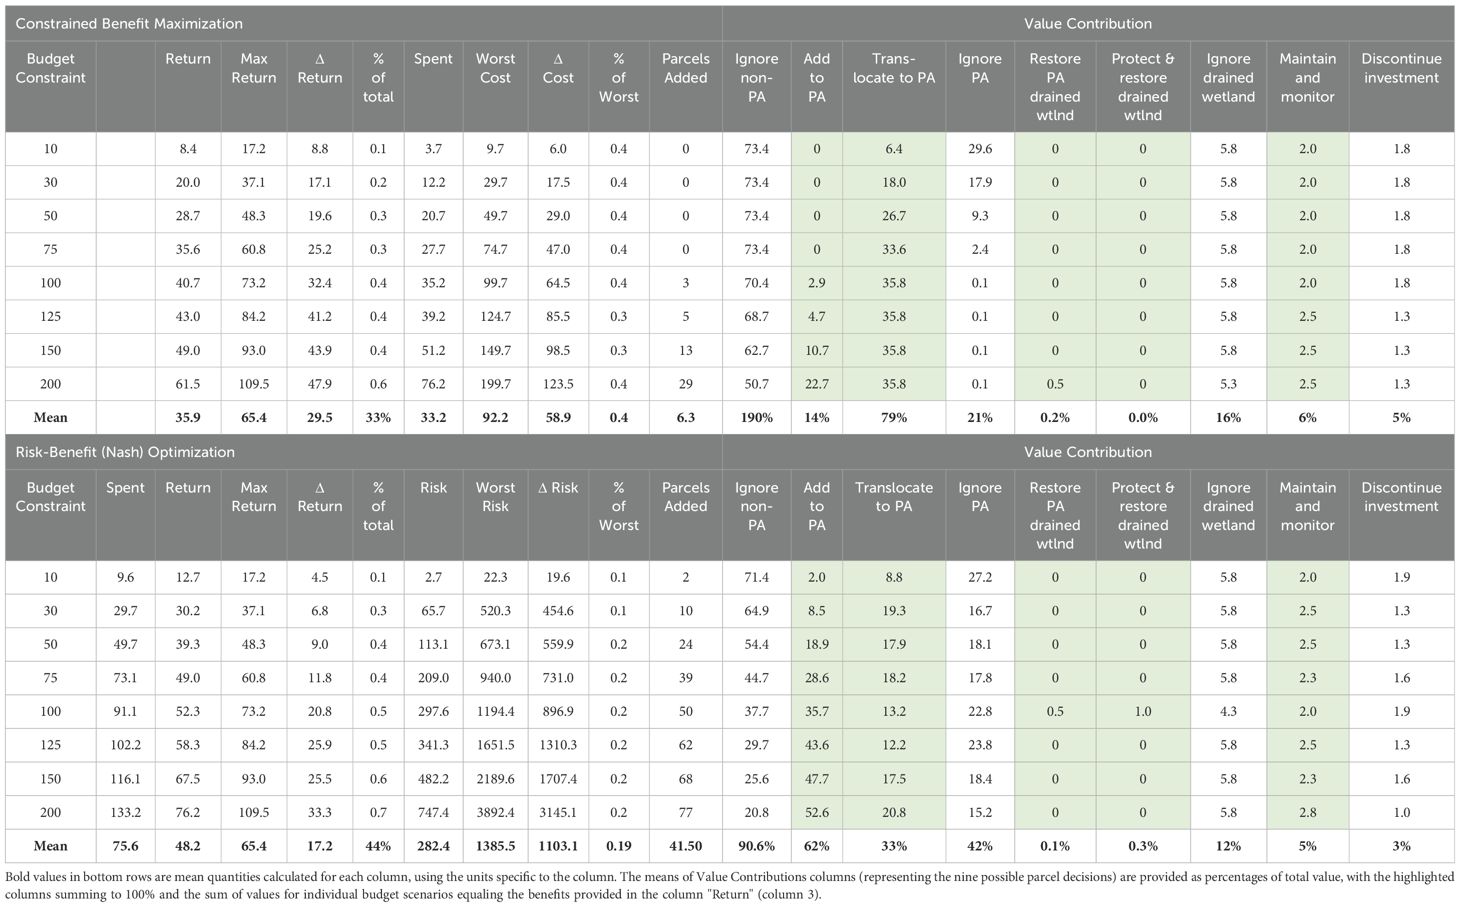
Table 3. Results produced for reserve design optimization under two analytical frameworks: maximization of species benefits under cost constraints and a risk-benefit optimization based on a Nash bargaining solution.
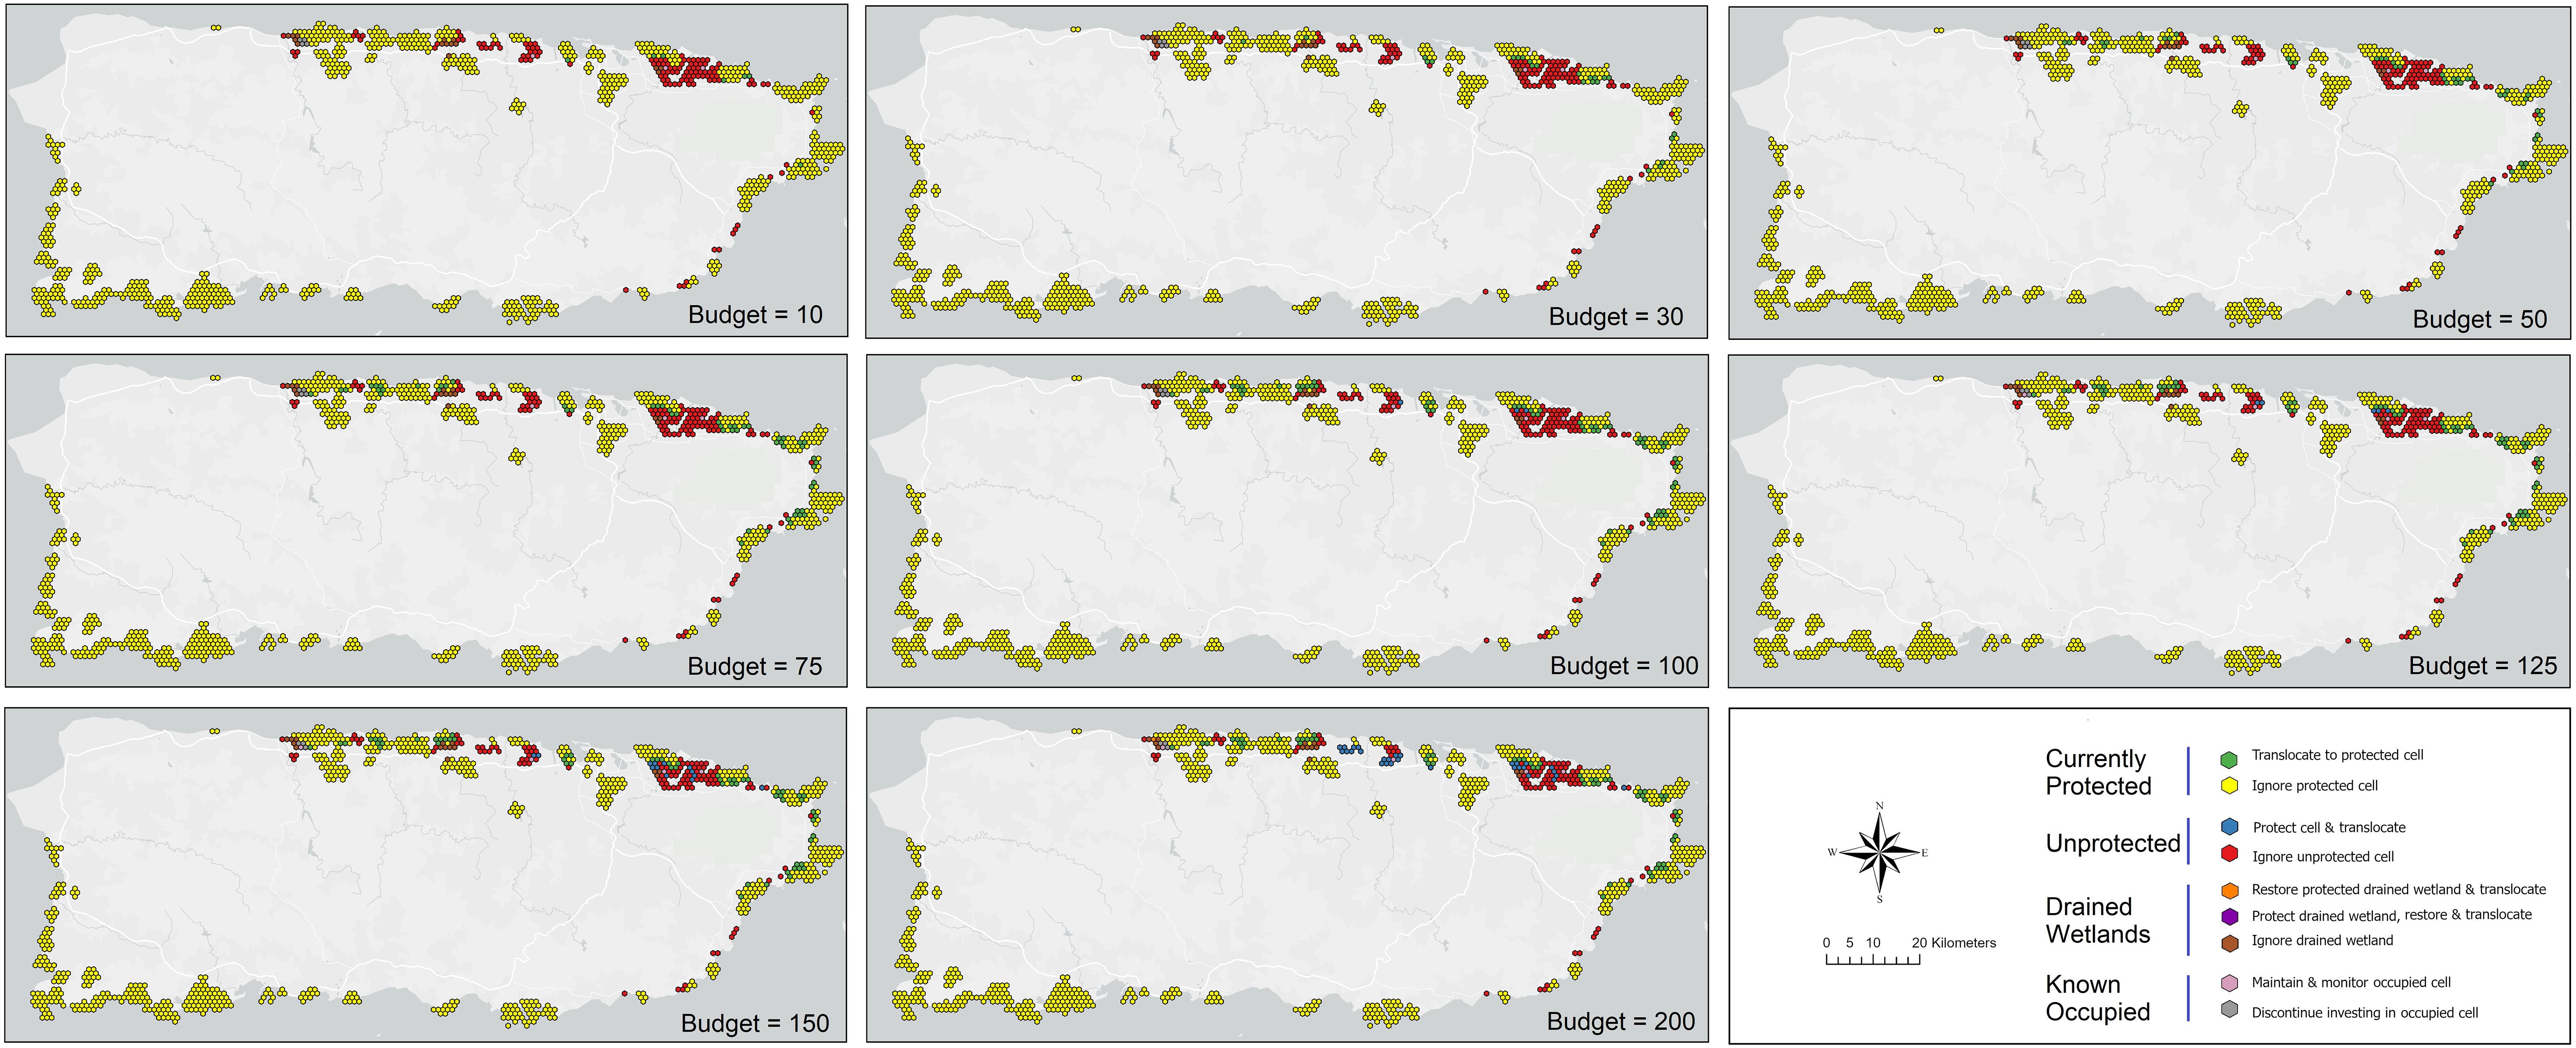
Figure 6. Reserve design results for coastal Puerto Rico to maximize the cumulative probability of occurrence of the plains coqui (E. juanariveroi, “coqui llanero”) based on modeled habitat changes and projected species distributions over eight future scenarios. Optimization outcomes are constrained under eight budget levels and include nine possible management decisions, conditional on the protected-area status of a parcel and whether a parcel falls within an historical (drained) wetland.
We repeated budget-scenario optimizations using a Nash bargaining solution to balance expected benefits with the risks of investing in lands that may lose their conservation value conditional on climate futures (Figure 7). Surprisingly, average returns were higher across budget scenarios under the Nash approach than with the benefit-maximization framework (48.2 versus 35.9, respectively; Table 3). Relative to the previous analysis, the Nash solutions rely more heavily on conserving unprotected cells for translocating frogs and are less dependent on existing protected areas, with an average of nearly 62% of conservation benefit stemming from the protection of new land and only 33% from utilizing current PAs for species management (Table 3). Investment in the protection and restoration of a few additional drained wetlands near Arecibo and Rio Grande adds to the predicted conservation outcome, but only under a moderate budget scenario (100 cost-units; Figure 7). Recommended additions to the reserve design are again concentrated in the northcentral and northeast, with a few unprotected and currently protected cells identified for translocation along the eastern coast (Figure 7).
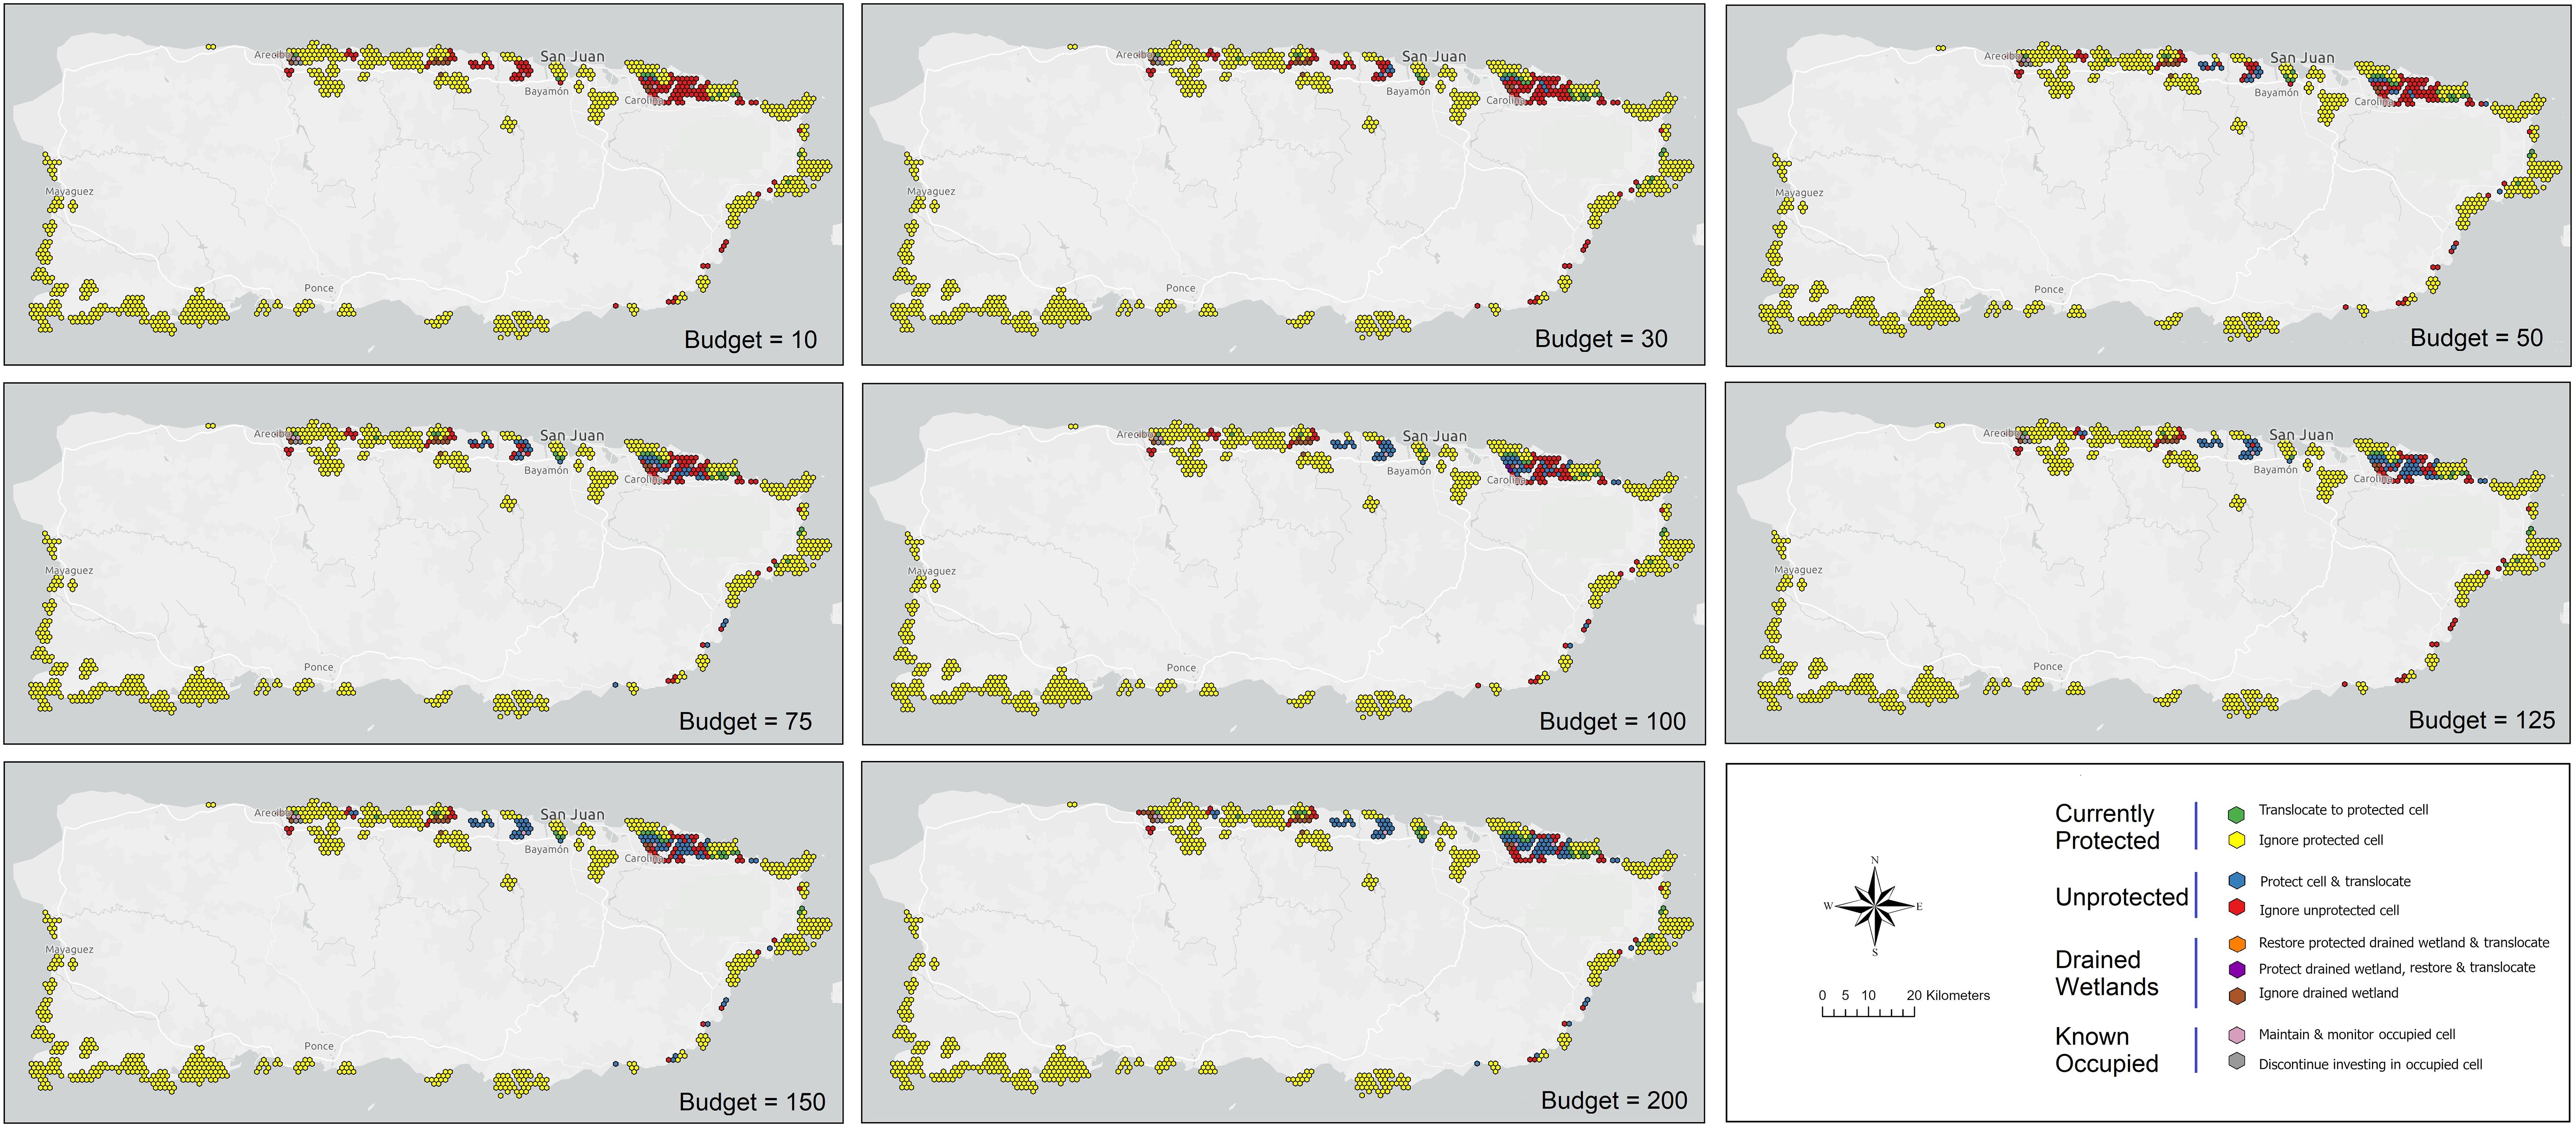
Figure 7. Reserve design results for coastal Puerto Rico to balance the cumulative probability of occurrence of the plains coqui (E. juanariveroi, “coqui llanero”) and the level of risk represented by the spatial configuration and correlation structure of parcels included in a portfolio. The optimization used a Nash bargaining solution (Nash, 1950; Eaton et al., 2019) and is based on modeled habitat changes and projected species distributions over eight future scenarios. Optimization outcomes are constrained under eight budget levels and include nine possible management decisions, conditional on the protected-area status of a parcel and whether a parcel falls within an historical (drained) wetland.
Although the proportion of total potential benefits increases monotonically with available budget for both the Nash solutions and the benefit-maximization optimizations, the risk-benefit framework of the Nash approach returns a greater proportion of the total available conservation benefit at each budget level relative to a benefit-maximization framework (Figure 8). This outcome suggests that overall conservation benefits may not have to be sacrificed by actively managing for risk – i.e., trading-off parcels with high expected benefit for those with lower associated risk, as theory predicts for diversified portfolios. Relatedly, the proportions of realized relative to maximum possible gains at each budget level were also systematically higher for the Nash solution, although there was no overall trend across the range of budgets under either framework (Figure 9A). However, higher proportional benefits were achieved at lower budgets (i.e., <100 cost units) in both cases. Evaluating complementary optimization outcomes of loss rates (i.e., the proportions of worst possible risks and costs incurred under each framework, respectively) reveals the Nash risk-benefit framework sustained a low and relatively consistent proportion of potential risk for each budget scenario (mean of 19%; Figure 9B). In contrast, the proportion of expended costs relative to the potential was substantially greater under a benefit-maximization approach, with a mean outlay of 37% of cost potential (Figure 9B and Table 3). Note that this is a relative comparison between different framework objectives and the trends in Figure 9B represent distinct scales.
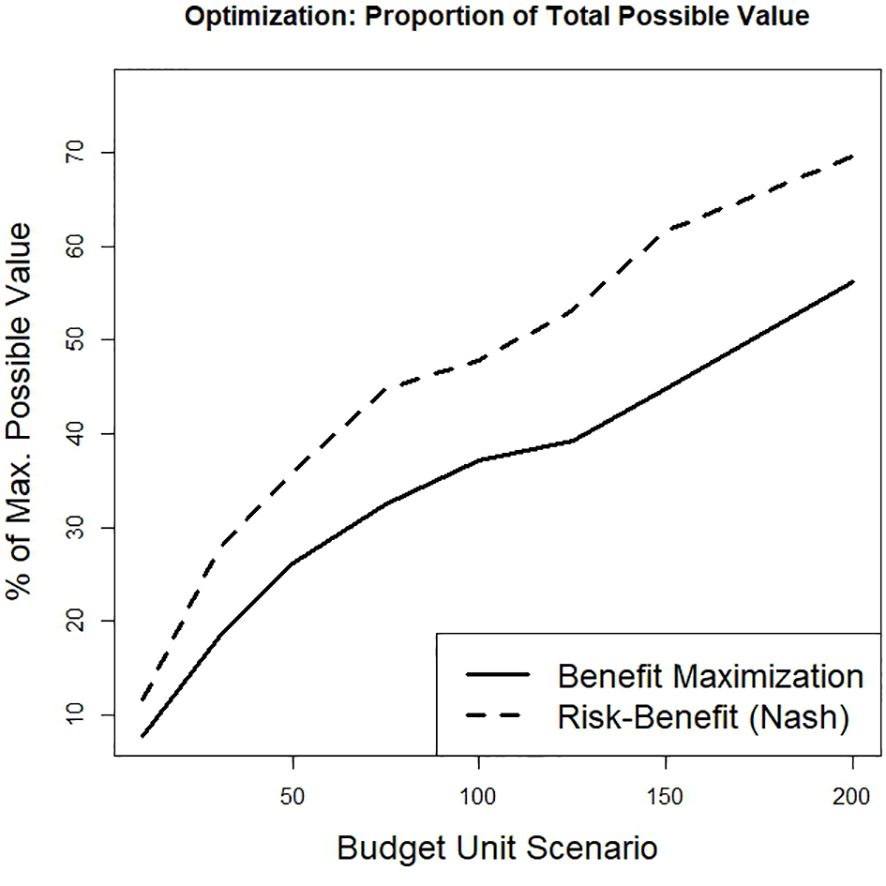
Figure 8. The percentage of total unconstrained available benefits (i.e., cumulative probability of occurrence) achieved under each of eight budget levels for two spatial design optimization approaches (cost-constrained maximization and balanced risk-return optimization).
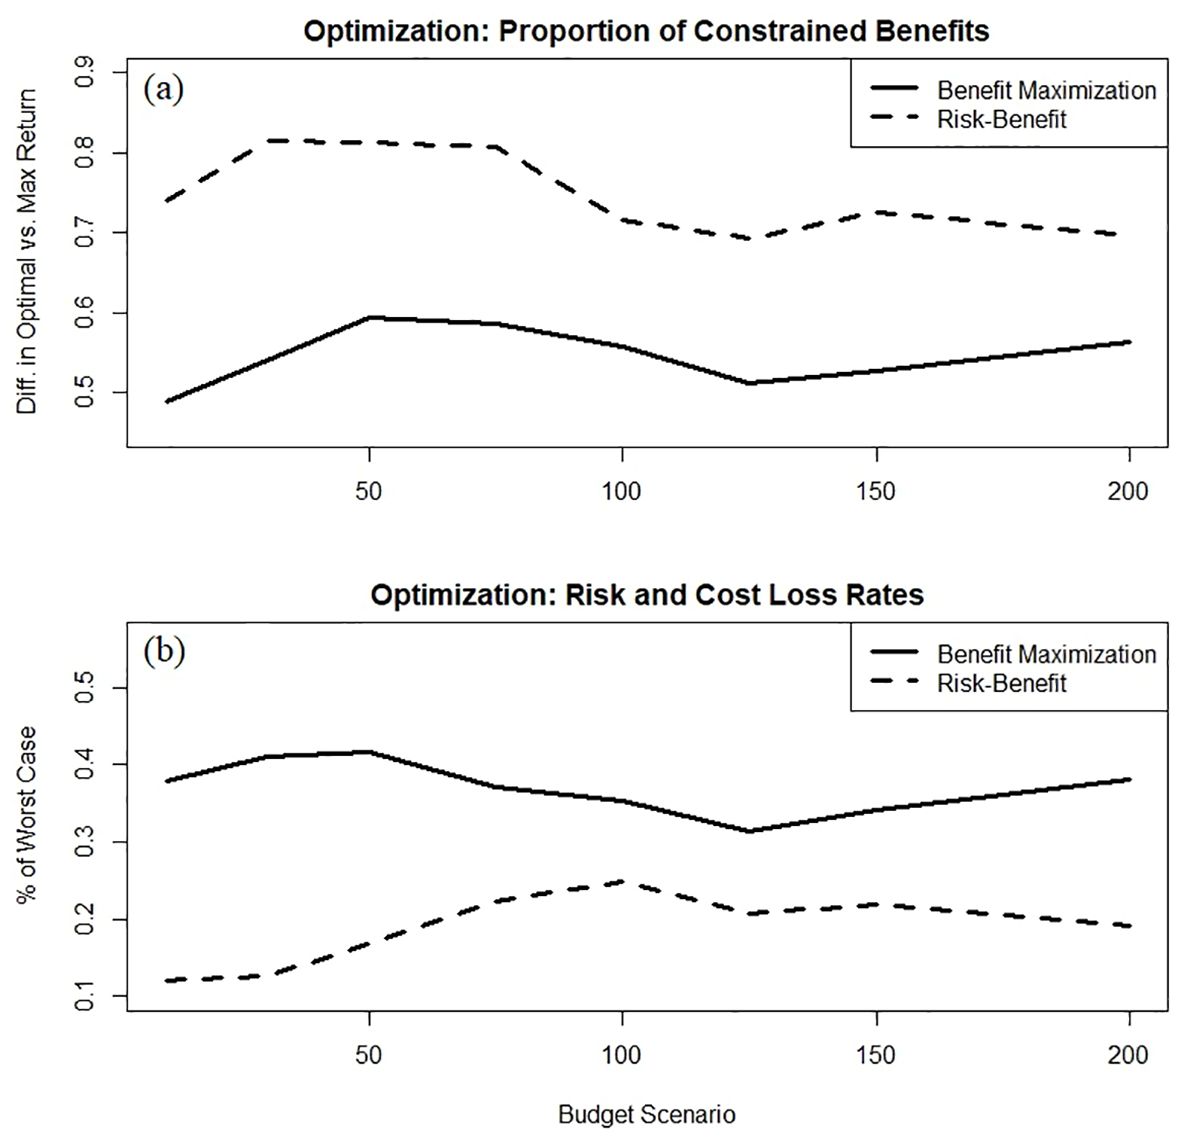
Figure 9. The gap between achieved conservation benefit at each budget level and the idealized benefit available for that budget for the two optimization approaches (A), and the proportions of worst possible risks and costs incurred at each given budget level for the two optimization frameworks (i.e., representing the ability of each framework to minimize cost or risk losses) (B). Note that in (B), lower values represent better performance, and that the results from the two optimization models illustrate different metrics and are therefore not directly comparable.
Discussion
Hedging bets as a core climate adaptation strategy
Climate change can cause direct disruptions to species persistence through physiological effects as the planet warms (Calosi et al., 2008), or via indirect effects to species’ habitats or ecosystem interactions. When the conservation goal is to enhance the persistence of valued resources across a landscape in the face of uncertain future environmental change, some form of bet-hedging will be an important part of any climate adaptation strategy. When there is a spatial component to a climate adaptation problem, as is the case with designing reserve networks when future conditions are uncertain, decision makers can manage risk by leveraging the spatial correlation structure that exists among the universe of potential design elements. Theory and empirical evidence suggest that portfolios designed to maximize total expected benefits typically contain higher risk, because returns are generally calculated under “average” conditions, leading to much lower benefits if an extreme future manifests. A portfolio focused on reducing risk rather than maximization can use spatial correlation to guide a strategy of diversification which often results in lower expected returns but is more robust to any projected climate future (Eaton et al., 2019). Encouragingly, inference from our Nash optimization reveal that a risk-benefit tradeoff approach can actually produce higher absolute and percentage returns (i.e., relative to the maximum possible) than a budget-constrained maximization framework. A risk-benefit tradeoff approach was also found to result in a lower percentage of total risk relative to percent spending losses under the maximization optimization. The favorable performance of the Nash optimization may in part be due to the small percentage of negatively correlated parcel pairs available for selection, inferring that design consideration may be somewhat limited in terms of benefits to risk-reduction. Higher absolute returns, higher percentage of total possible returns, and relatively low levels of risk exposure convey the potential benefits of a balanced risk-management approach to portfolio designs for species conservation and spatial protected-area planning.
Both current protected areas and the potential of drained wetlands contributed to a conservation design to increase the persistence of coqui llanero. Recommendations to protect and restore drained wetland were inevitably influenced by the second model parameterization (i.e., drained wetlands being viable llanero habitat). Cost considerations may also minimize attention given to restoring drained wetlands, with limited numbers of parcels being recommended for conservation as budgets increase (Figures 6, 7). If restoring historical wetlands is found to benefit the species, decisions to restore this habitat will likely be more important than our preliminary findings suggest. The existing PA network protects only 14% of the current predicted distribution of llanero, and conserves only 3% of the extant wetlands found along Puerto Rico’s northern coast. The value of the current PA network to future conservation of llanero may still be beneficial relative to this small percent coverage, however, with 79% and 33% of the total expected benefits attributed to PAs under the constrained-maximization and risk-benefit frameworks, respectively. Importantly, cost considerations were more pronounced under the benefit-maximization framework, with an average of only 6.25 unprotected cells identified for adding to the reserve network. Under the risk management Nash approach, adding an average of 41.5 cells to the PA was assessed as optimal, even though conserving these parcels added twice the cost relative to translocating frogs to currently protected cells (Table 3). These results highlight concerns that reliance on the current protected-area network for conserving coastal species may include substantial risk. Although it was not an explicit feature of our optimization, an additional benefit of the Nash optimization results includes increased connectivity among several protected areas in the northeast (Figure 7), as well as expanding potentially valuable refugia near Sabana Seca which may support natural migration of the extant llanero population in this region.
Model limitations
Although we applied the current state of knowledge regarding factors affecting llanero distribution, including all known species localities and available data on historical and future biotic (vegetation, soils, wetlands) and abiotic (precipitation, temperature) conditions in coastal Puerto Rico, we simplified several aspects of our projection, species, and decision models. Simplifications affected our modeling of projected changes in habitat conditions, subsequent llanero distribution, and of the optimization of spatial conservation portfolios. Due to data limitations, we did not include coastal and karst hydrology or estimates of water-balance in projecting vegetation dynamics. Temperature-mediated evapotranspiration, declining freshwater input causing reduced hydrologic head pressure, and SLR are all expected to lead to advancing saltwater intrusion and the conversion of fresh marsh habitat to other cover types. For the decision modeling, we standardized parcel size to 1 km2 grid cells as well as the costs to purchase, restore, translocate, or monitor. We also simplified the options available for each parcel to nine management alternatives based on expected benefits and current protection status. The implementation of one of these options, adding to a protected-area design, may not be realistic to consider for the conservation of a single species, but this practice has precedent under the “umbrella species” concept (Poiani et al., 2001; Runge et al., 2019). There will be important complexity (e.g., contextual details of translocating endangered species) to consider, in addition to other decision options available to managers (e.g., fee simple purchase versus funding conservation easements, various levels of restoration, etc.). Connectivity between cells receiving conservation action was not explicitly modeled, which could have refined the resulting portfolios and improved management benefits (Udell et al., 2018). Finally, we did not conduct an exhaustive evaluation of the sensitivity of our assumptions by simulating species distribution, habitat transition, or optimization outcomes under variations in parameter values. Our decision framework is presented as robust strategy for making long-term resource investments under substantial uncertainty, but before translocation or land-conservation decisions are implemented we advise a more thorough analysis is conducted to test the assumptions we describe. These limitations constrain the practical use of our results, but we believe the decision framework outlined here will be helpful in exploring general patterns of change, of uncertain futures, and two distinct approaches for generating optimal strategies in response.
Because of their restricted distribution and a lack of systematic survey (i.e., detection/non-detection) data, it is unsurprising that our llanero occurrence models fit a relatively few environmental variables, including landcover type, wetland categorization, soil class, and average precipitation during the driest months. Projected changes in these covariables over a range of possible climate futures resulted in substantial variation in the expected distribution of viable llanero habitat. Freshwater marshes on the island’s coastal zone are anticipated to decline under all climate scenarios, with inland freshwater marsh declining 27%, flooded marsh contracting by 20%, and non-tidal swamp experiencing a 1.5% reduction under the highest SLR scenario. Saltmarsh, transitional marsh, and tidal flats are all predicted to increase as SLR progresses. Habitat transition and loss will not be experienced equally across the llanero distribution, with western and central populations projected to decline to near local extirpation under the highest SLR scenario while eastern populations could see reductions of less than 60% under one model. Overall losses in distribution are projected at between 50% and 90% for the northern coastal region. When modeling these habitat responses, we treated the four SLR scenarios as equally likely which could have attributed greater weight to extreme futures and biased high the expected habitat losses. Although a 3-m SLR scenario may appear extreme, updated long-term mean sea level projections for the U.S. include a range of 0.8 to 3.9m for the modeled emission scenarios by 2150 (Sweet et al., 2022). Regardless of timing or magnitude, sea-level rise and other climate-change drivers are anticipated to shift potential habitat refugia increasingly landward.
Conclusions
Although coqui llanero may be locally abundant, this tiny coastal species with limited migration ability is currently known from only three small populations in sensitive lowland marshlands, putting the global distribution of this amphibian at critical risk of extinction. Before considering localized management responses such as restoration or conservation of individual land parcels, or translocation of individuals to a “highly likely” refugia, evaluation of a more comprehensive portfolio strategy may help decision makers mitigate the risks of investing in costly, long-term activities when facing large climate uncertainty. Investing in multiple translocation sites and possibly a portfolio of land parcels is unavoidably much costlier than acting on individual protection options, but the portfolio does not have to be implemented all at once, nor by a single decision maker. Opportunities to conserve individual parcels as they become available do not have to be ignored, and optimization methods exist to advance the process we detail here by identifying an optimal sequence of parcels to conserve in an identified portfolio design (e.g., Moilanen and Cabeza, 2007; Golovin et al., 2011; Bonneau et al., 2018). An explicit and deliberative process of collaborative knowledge generation, adaptation planning, decision making, and resource sharing is one means (Johnson et al., 2020) to begin to assemble an island-wide reserve network to conserve a suite of valued species, habitats, and ecosystem processes.
Data availability statement
Publicly available datasets were analyzed in this study. This data can be found here: https://www.gbif.org/.
Author contributions
ME: Conceptualization, Formal analysis, Investigation, Methodology, Software, Writing – original draft, Writing – review & editing. AT: Conceptualization, Formal analysis, Methodology, Writing – review & editing. JC: Conceptualization, Formal analysis, Methodology, Writing – review & editing.
Funding
The author(s) declare financial support was received for the research, authorship, and/or publication of this article. This work was supported by funding from the US Geological Survey - Southeast Climate Adaptation Science Center, under grant RWO-241 "Advancing Climate Change Adaptation Strategies for High Elevation and Endangered Lowland Coquí Frogs in the U.S. Caribbean".
Acknowledgments
We thank Curtis Belyea for assistance with manuscript figures. Julien Martin offered helpful revisions for an earlier draft. Neftalí Ríos López has provided on-going discussion, advice, and insights on coqui llanero biology and conservation, for which we are grateful. Two reviewers offered helpful suggestions to improve this manuscript. The U.S. Geological Survey, Southeast Climate Adaptation Science Center has provided long-term funding, administrative, and staff support for amphibian conservation efforts in Puerto Rico. Any use of trade, firm, or product names is for descriptive purposes only and does not imply endorsement by the U.S. Government.
Conflict of interest
The authors declare that the research was conducted in the absence of any commercial or financial relationships that could be construed as a potential conflict of interest.
Publisher’s note
All claims expressed in this article are solely those of the authors and do not necessarily represent those of their affiliated organizations, or those of the publisher, the editors and the reviewers. Any product that may be evaluated in this article, or claim that may be made by its manufacturer, is not guaranteed or endorsed by the publisher.
Supplementary material
The Supplementary Material for this article can be found online at: https://www.frontiersin.org/articles/10.3389/fcosc.2024.1444626/full#supplementary-material
Supplementary Figure 1 | Properties of the Nash Bargaining Solution (Nash, 1950). With competing objectives to maximize Reward and minimize Risk, the Pareto efficient frontier (thick line) is identified and defines the solution space of dominated alternatives (light and hatched grey). The point where both objectives are maximized (U) is unobtainable. Solutions D1 and D2 are where Reward and Risk, respectively, are optimized at the expense of the other objective. The Nash solution optimizes the point on each axis (O1* and O2*, identifying N* on the efficient frontier) that maximizes the products of line segments s1 and s2 (i.e., the furthest combined distance from both D1 and D2), thereby maximizing the volume of dominated solutions (hatched grey). See Santín et al., 2017 and Eaton et al., 2019 (Appendix S1: Section S4) for equations and additional details.
References
Bhattachan A., Jurjonas M. D., Moody A. C., Morris P. R., Sanchez G. M., Smart L. S., et al. (2018). Sea level rise impacts on rural coastal social-ecological systems and the implications for decision making. Environ. Sci. Policy 90, 122–134. doi: 10.1016/j.envsci.2018.10.006
Bonneau M., Sabbadin R., Johnson F. A., Stith B. (2018). Dynamic minimum set problem for reserve design: Heuristic solutions for large problems. PloS One 13, 1–23. doi: 10.1371/journal.pone.0193093
Bowden J. H., Terando A. J., Misra V., Wootten A., Bhardwaj A., Boyles R., et al. (2021). High-resolution dynamically downscaled rainfall and temperature projections for ecological life zones within Puerto Rico and for the U.S. Virgin Islands. Int. J. Climatol. 41, 1305–1327. doi: 10.1002/joc.v41.2
Burnham K. P., Anderson D. R. (2010). Model Selection and Multi-Model Inference: A Practical Information-Theoretic Approach (New York: Springer-Verlag).
Burrowes P. A., Joglar R. L., Green D. E. (2004). Potential causes for amphibian declines in Puerto Rico. Herpetologica 60, 141–154. doi: 10.1655/03-50
Calosi P., Bilton D. T., Spicer J. I. (2008). Thermal tolerance, acclimatory capacity and vulnerability to global climate change. Biol. Lett. 4, 99–102. doi: 10.1098/rsbl.2007.0408
Case M. J., Lawler J. J., Tomasevic J. A. (2015). Relative sensitivity to climate change of species in northwestern North America. Biol. Conserv. 187, 127–133. doi: 10.1016/j.biocon.2015.04.013
Clough J. (2008). SLAMM 5.0.1. Technical documentation and executable program. Available online at: http://www.warrenpinnacle.com/prof/SLAMM/index.html. (Accessed: October 13, 2022)
Collazo J. A., Terando A. J., Eaton M. J., Puente-Rolón A., Bell R. C., Martinez E. (2023). Strategic Habitat Conservation and Adaptive Strategies for Recovery and Pre-listing Conservation of Eleutherodactylus (coqui) Amphibians in Puerto Rico. Final report submitted to the USFWS Caribbean Ecological Services Field Office Grant number: G19AC00346. 22 pp.
Collazo J. A., Terando A. J., Engman A. C., Fackler P. F., Kwak T. J. (2018). Toward a resilience-based conservation strategy for wetlands in Puerto Rico: meeting challenges posed by environmental change. Wetlands 39, 1255–1269. doi: 10.1007/s13157-018-1080-z
Cowardin L. M., Carter V., Golet F. C., LaRoe E. T. (1979). Classification of Wetlands and Deepwater Habitats of the United States (Washington D.C: U. S. Department of the Interior, Fish and Wildlife Service).
Craft C., Clough J., Ehman J., Joye S., Park R., Pennings S., et al. (2009). Forecasting the effects of accelerated sea-level rise on tidal marsh ecosystem services. Front. Ecol. Environ. 7, 73–78. doi: 10.1890/070219
Daly C., Helmer E. H., Quinones M. (2003). Mapping the climate of Puerto Rico, vieques and culebra. Int. J. Climatol. 23, 1359–1381. doi: 10.1002/joc.v23:11
Davila-Casanova D. (2021). The Coqui Llanero, Eleutherodactylus Juanariveroi, Habitat and Sea Level Rise, a Science Driven Modeling Framework for the Conservation and Recovery of a Critically Endangered Species. Dissertation University of Puerto Rico.
Eaton M. J., Johnson F. A., Mikels-Carrasco J., Case D. J., Martin J., Stith B., et al. (2021). Cape Romain Partnership for Coastal Protection. U.S. Geological Survey Open-File Report2021–1021, 174. doi: 10.3133/ofr20211021
Eaton M. J., Yurek S., Haider Z., Martin J., Johnson F. A., Udell B. J., et al. (2019). Spatial conservation planning under uncertainty: adapting to climate change risks using modern portfolio theory. Ecol. Appl. 29. doi: 10.1002/eap.v29.7
Federal Geographic Data Committee (2013). Classification of wetlands and deepwater habitats of the United States (Washington D.C: Wetlands Subcommittee, Federal Geographic Data Committee and U.S. Fish and Wildlife Service).
Fick S. E., Hijmans R. J. (2017). WorldClim 2: new 1-km spatial resolution climate surfaces for global land areas. Int. J. Climatol. 37, 4302–4315. doi: 10.1002/joc.2017.37.issue-12
Fitzpatrick M. C., Dunn R. R. (2019). Contemporary climatic analogs for 540 North American urban areas in the late 21st century. Nat. Commun. 10, 614. doi: 10.1038/s41467-019-08540-3
GBIF (2023). Global biodiversity information facility: free and open access to biodiversity data. Available online at: http://www.gbif.org/. (Accessed: February 15, 2024)
Ghasemi Saghand P., Haider Z., Charkhgard H., Eaton M. J., Martin J., Yurek S., et al. (2021). SiteOpt: an open-source R-package for site selection and portfolio optimization. Ecography 44, 1678–1685. doi: 10.1111/ecog.v44.i11
Golovin D., Krause A., Gardner B. E., Converse S. J., Morey S. (2011). Dynamic Resource Allocation in Conservation Planning. Association for the Advancement of Artificial Intelligence (AAAI), 1331–1336.
Hay L. E., Wilby R. L., Leavesley G. H. (2000). A comparison of delta change and downscaled GCM scenarios for three mountainous basins in the United States. JAWRA. J. Am. Water Resour. Assoc. 36, 387–397. doi: 10.1111/j.1752-1688.2000.tb04276.x
He Y., Liao Z., Chen X., Chen Y. (2023). Climatic debts for global amphibians: Who, where and why? Biol. Conserv. 279, 109929. doi: 10.1016/j.biocon.2023.109929
Hedges S. B. (1996). “The origin of West Indian amphibians and reptiles,” in Contributions to West Indian Herpetology: A Tribute to Albert Schwartz, vol. 12. , 95–128.
Honnay O., Verheyen K., Butaye J., Jacquemyn H., Bossuyt B., Hermy M. (2002). Possible effects of habitat fragmentation and climate change on the range of forest plant species. Ecol. Lett. 5, 525–530. doi: 10.1046/j.1461-0248.2002.00346.x
Jennings L. N., Douglas J., Treasure E., González G. (2014). Climate change effects in El Yunque National Forest, Puerto Rico, and the Caribbean region. Gen. Tech. Rep. SRS-GTR-193 Vol. 193 (Asheville, NC: USDA-Forest Service, Southern Research Station. 47), 1–47.
Joglar R. L., Álvarez A. O., Aide T. M., Barber D., Burrowes P. A., García M. A., et al. (2011). “Conserving the puerto rican herpetofauna,” in Conservation of Caribbean Island Herpetofaunas Volume 2: Regional Accounts of the West Indies (Brill), 339–357.
Johnson F. A., Eaton M. J., Mikels-Carrasco J., Case D. J. (2020). Building adaptive capacity in a coastal region experiencing global change. Ecol. Soc. 25, 9. doi: 10.5751/ES-11700-250309
Kennaway T., Helmer E. H. (2007). The forest types and ages cleared for land development in Puerto Rico. GISci. Remote Sens. 44, 356–382. doi: 10.2747/1548-1603.44.4.356
Khalyani A. H., Gould W. A., Harmsen E., Terando A., Quinones M., Collazo J. A. (2016). Climate change implications for tropical islands: interpolating and interpreting statistically downscaled GCM projections for management and planning. J. Appl. Meteorol. Climatol. 55, 265–282. doi: 10.1175/JAMC-D-15-0182.1
LCC Network (2016). Puerto Rico Meets Target to Protect 16% of Its Lands - Protected Areas Conservation Team (PA-CAT) Celebrates. Available online at: https://lccnetwork.org/news/puerto-rico-meets-target-protect-16-its-lands-protected-areas-conservation-team-pa-cat. (Accessed: March 01, 2024)
Lugo A. E., Castro L. M., Vale A., López T. D. M., Hernández Prieto E., García Martinó A., et al. (2001). Puerto Rican Karst — A Vital Resource (USDA Forest Service), 1–102.
MacKenzie D. I., Nichols J. D., Royle J. A., Pollock K. H., Bailey L. L., Hines J. E. (2017). Occupancy estimation and modeling: inferring patterns and dynamics of species occupancy (Amsterdam: Elsevier).
Markowitz H. M. (1959). Portfolio Selection: Efficient Diversification of Investments (New Haven: Yale University Press).
Martinuzzi S., Gould W. A., Ramos González O. M. (2007). Land development, land use, and urban sprawl in Puerto Rico integrating remote sensing and population census data. Landscape Urban. Plann. 79, 288–297. doi: 10.1016/j.landurbplan.2006.02.014
Moilanen A., Cabeza M. (2007). Accounting for habitat loss rates in sequential reserve selection: Simple methods for large problems. Biol. Conserv. 136, 470–482. doi: 10.1016/j.biocon.2006.12.019
Morales-Pérez A. L., Monzon O., Gómez C. A. R., Santiago L. (2022). Eleutherodactylus juanariveroi (Plains Coqui Frog): Geographic Distribution note. Herpetolocial. Rev. 53, 498–439.
Nurse L. A., McLean R. F., Agard J., Briguglio L. P., Duvat-Magnan V., Pelesikoti N., et al. (2014). “Small islands,” in Climate Change 2014: Impacts, Adaptation, and Vulnerability. Part B: Regional Aspects. Contribution of Working Group II to the Fifth Assessment Report of the Intergovernmental Panel on Climate Change. Eds. Barros V. R., Field C. B., Dokken D. J., Mastrandrea M. D., Mach K. J., Bilir T. E., Chatterjee M., Ebi K. L., Estrada Y. O., Genova R. C., Girma B., Kissel E. S., Levy A. N., MacCracken S., Mastrandrea P. R., White L. L. (Cambridge University Press, Cambridge, United Kingdom and New York, NY, USA), 1613–1654.
Osland M. J., Grace J. B., Guntenspergen G. R., Thorne K. M., Carr J. A., Feher L. C. (2019). Climatic controls on the distribution of foundation plant species in coastal wetlands of the conterminous United States: knowledge gaps and emerging research needs. Estuaries. Coasts. 42, 1991–2003. doi: 10.1007/s12237-019-00640-z
Phillips S. J., Dudík M., Elith J., Graham C. H., Lehmann A., Leathwick J., et al. (2009). Sample selection bias and presence-only distribution models: implications for background and pseudo-absence data. Ecol. Appl. 19, 181–197. doi: 10.1890/07-2153.1
Poiani K. A., Merrill M. D., Chapman K. A. (2001). Identifying conservation-priority areas in a fragmented minnesota landscape based on the umbrella species concept and selection of large patches of natural vegetation. Conserv. Biol. 15, 513–522. doi: 10.1046/j.1523-1739.2001.015002513.x
Porfirio L. L., Harris R. M. B., Lefroy E. C., Hugh S., Gould S. F., Lee G., et al. (2014). Improving the use of species distribution models in conservation planning and management under climate change. PloS One 9, e113749. doi: 10.1371/journal.pone.0113749
Protected Areas Conservation Action Team (2018). Puerto Rico Protected Areas Database (San Juan, Puerto Rico: GIS data).
R Core Team (2021). R: A language and enviroment for statistical computing (Vienna, Austria: R Foundation for Statistical Computing). Available at: https://www.R-project.org/.
Ríos-López N., Thomas R. (2007). A new species of palustrine Eleutherodactylus (Anura: Leptodactylidae) from Puerto Rico. Zootaxa 64, 51–64. doi: 10.11646/zootaxa.1512.1.3
Ríos-López N., Reyes-Díaz M., Ortíz-Rivas L., Negrón-Del Valle J. E., de Jesús-Villanueva C. N. (2014). Natural history and ecology of the critically endangered puerto rican plains coquí, eleutherodactylus juanariveroi Ríos-López and Thomas 2007 (Amphibia: anura: eleutherodactylidae)1. Life.: Excitement. Biol. 2, 69–93. doi: 10.9784/leb2(2)rios.01
Rivera-Burgos A. C., Collazo J. A., Terando A. J., Pacifici K. (2021). Linking demographic rates to local environmental conditions: Empirical data to support climate adaptation strategies for Eleutherodactylus frogs. Global Ecol. Conserv. 28, e01624. doi: 10.1016/j.gecco.2021.e01624
Runge C. A., Withey J. C., Naugle D. E., Fargione J. E., Helmstedt K. J., Larsen A. E., et al. (2019). Single species conservation as an umbrella for management of landscape threats. PloS One 14, e0209619. doi: 10.1371/journal.pone.0209619
Santín I., Pedret C., Vilanova R. (2017). “Pareto optimality,” in Control and Decision Strategies in Wastewater Treatment Plants for Operation Improvement. Eds. Santín I., Pedret C., Vilanova R. (Springer, Switzlerland), 115–124.
Sierra-Altamiranda A., Charkhgard H., Eaton M. J., Martin J., Yurek S., Udell B. J. (2020). Spatial conservation planning under uncertainty using modern portfolio theory and Nash bargaining solution. Ecol. Model. 423, 109016. doi: 10.1016/j.ecolmodel.2020.109016
Soil Survey Staff (2021). Gridded Soil Survey Geographic (gSSURGO) Database for Puerto Rico and U.S. Virgin Islands (United States Department of Agriculture, Natural Resources Conservation Service).
Sweet W. V., Hamlington B. D., Kopp R. E., Weaver C. P., Barnard P. L., Bekaert D., et al. (2022). Global and Regional Sea Level Rise Scenarios for the United States: Updated Mean Projections and Extreme Water Level Probabilities Along U.S. Coastlines (Silver Spring, MD: National Oceanic and Atmospheric Administration, National Ocean Service), 111.
Taillie P. J., Moorman C. E., Poulter B., Ardón M., Emanuel R. E. (2019). Decadal-scale vegetation change driven by salinity at leading edge of rising sea level. Ecosystems 22, 1918–1930. doi: 10.1007/s10021-019-00382-w
Udell B. J., Martin J., Fletcher R. J., Bonneau M., Edwards H. H., Gowan T. A., et al. (2018). Integrating encounter theory with decision analysis to evaluate collision risk and determine optimal protection zones for wildlife. J. Appl. Ecol. 56, 1050–1062. doi: 10.1111/1365-2664.13290
USFWS (United States Fish and Wildlife Service) (2012). Endangered and threatened wildlife and plants; determination of endangered species status for Coquí Llanero throughout its range and designation of critical habitat, final rule (Federal Register).
Yu M., Rivera-Ocasio E., Heartsill-Scalley T., Davila-Casanova D., Ríos-López N., Gao Q. (2019). Landscape-level consequences of rising sea-level on coastal wetlands: saltwater intrusion drives displacement and mortality in the twenty-first century. Wetlands 39, 1343–1355. doi: 10.1007/s13157-019-01138-x
Zhu G., Papeş M., Armsworth P. R., Giam X. (2022). Climate change vulnerability of terrestrial vertebrates in a major refuge and dispersal corridor in North America. Diversity Distributions. 28, 1227–1241. doi: 10.1111/ddi.13528
Keywords: spatial conservation planning, reserve design, portfolio optimization, risk management, habitat-species modeling, climate change, assisted migration
Citation: Eaton MJ, Terando AJ and Collazo JA (2024) Applying portfolio theory to benefit endangered amphibians in coastal wetlands threatened by climate change, high uncertainty, and significant investment risk. Front. Conserv. Sci. 5:1444626. doi: 10.3389/fcosc.2024.1444626
Received: 05 June 2024; Accepted: 11 September 2024;
Published: 07 October 2024.
Edited by:
James Nichols, University of Florida, United StatesReviewed by:
Timothy C. Haas, University of Wisconsin–Milwaukee, United StatesDoug P. Armstrong, Massey University, New Zealand
Copyright © 2024 Eaton, Terando and Collazo. This is an open-access article distributed under the terms of the Creative Commons Attribution License (CC BY). The use, distribution or reproduction in other forums is permitted, provided the original author(s) and the copyright owner(s) are credited and that the original publication in this journal is cited, in accordance with accepted academic practice. No use, distribution or reproduction is permitted which does not comply with these terms.
*Correspondence: Mitchell J. Eaton, bWVhdG9uQHVzZ3MuZ292