 Hal R. Holmes*
 Misa WintersCifeng Fang
 Gareth FotouhiMaria Fernanda BaronDavid L. DayJacqueline MercaderDavid Anthony FoxPaul M.E. BunjeAlex Dehgan
- Conservation X Labs, Washington, DC, United States
The escalating threats to biodiversity, public health, and food security posed by emerging infectious diseases, wildlife trafficking, and invasive species expansions require novel approaches to biosurveillance. Modern genetic testing technology can detect many of these unseen threats, but existing genetic testing approaches are largely inaccessible to most people working in the field. The Nucleic Acid Barcode Identification Tool (NABIT) is a handheld, battery-powered device that enables rapid nucleic acid amplification tests to be performed at the point-of-contact by non-technical users, creating a critical bridge between centralized laboratories and the field by reducing barriers to accessible and routine genetic testing. In this work, we present initial performance data for the NABIT and lyophilized assays for nucleic acid amplification testing of two diverse applications to demonstrate the potential of the NABIT to serve as a platform for on-site biosurveillance and species detection. The results demonstrated that the NABIT COVID-19 test kit could detect SARS-CoV-2 at 0.93 NDU/µL. The NABIT sockeye test kit showed amplification between 13–22 minutes from filtered water samples from a salmon hatchery.
1 Introduction
The IUCN lists over 42,000 species as under threat, and over 16,000 species believed to be at risk of extinction (IUCN Red List of Threatened Species). The impending catastrophic loss of biodiversity is no longer just a problem for ecologists and conservationists. Biodiversity loss and wildlife trafficking have become threats to public health by increasing the likelihood of spillover events (Keesing and Ostfeld, 2021). Food security is also under threat due to biodiversity loss and wildlife trafficking, disrupting healthy ecosystems and destabilizing the food chain. The USDA has listed over 60 animal diseases that threaten food security as notifiable emergency situations, as well as 200 zoonotic diseases that pose a risk of spillover (USDA APHIS, [[No Year]]). The World Bank estimates zoonotic diseases cause over $20 billion in direct losses to production animals and over $200 billion in indirect losses to related economies (Bank W, 2010; Barratt et al., 2019).
Genetic technologies have become indispensable tools for environmental monitoring and biosurveillance, particularly in tracking invasive species, detecting pathogens, and documenting biodiversity loss. Among these, environmental DNA (eDNA) metabarcoding has emerged as a leading method for ecosystem-scale assessments. It allows researchers to characterize entire biological communities from water, air, or soil samples by amplifying and sequencing barcode regions from mixed DNA templates. This untargeted, high-resolution approach enables the detection of cryptic or unexpected taxa, builds comprehensive biodiversity baselines, and supports hypothesis generation in novel or complex environments (Deiner et al., 2017; Ruppert et al., 2019). As such, metabarcoding is the primary tool used during discovery phases in conservation and One Health studies.
However, the deployment of metabarcoding is constrained by its reliance on centralized laboratories, specialized personnel, and advanced sequencing infrastructure. Turnaround times are often days to weeks, and costs can be prohibitive—particularly for time-sensitive decisions in remote field settings. Flow cells for real-time nanopore sequencing (e.g., Oxford Nanopore MinION) may cost $500–$900 each, while short-read sequencing with Illumina or PacBio platforms can range from $50 to $200 per sample depending on multiplexing. These costs, combined with cold chain requirements and bioinformatic analysis pipelines, make routine use difficult for many implementation organizations. Thus, while metabarcoding remains the most powerful tool for biodiversity discovery, other molecular detection technologies—including qPCR, ddPCR, CRISPR-based diagnostics, and hybridization assays—may be better suited for rapid, targeted applications in decentralized contexts (Ferguson et al., 2020; Urban and Werner, 2022).
Genetic testing, particularly species or pathogen specific PCR-based diagnostics, is used routinely to detect trafficked wildlife (Linacre and Tobe, 2011), prevent the introduction of invasive species and pathogens (Dejean et al., 2012), and monitor disease spread or outbreaks that can devastate the health of ecosystems, agricultural systems, and our communities alike (Clemmons et al., 2021). However, current models and platforms for species detection and diagnostics provide only a limited menu of available tests and are heavily restricted to centralized laboratories, far from where the threats to biodiversity are occurring and emerging. New tools, especially diagnostics (National Academies of Sciences, Medicine, 2019), and novel approaches to biosurveillance, are imminently required to protect our ecosystems and communities. Furthermore, these tools must prepare us for new unknown threats, while enabling early detection strategies that will minimize loss down the road.
To address the challenges that limit genetic monitoring, we hypothesize that a versatile platform to perform genetic tests in the field without extensive training or equipment can be developed to address these broad-ranging threats of extinction. The Nucleic Acid Barcode Identification Tool (NABIT - Figure 1) is a handheld, battery powered tool that enables non-technical personnel to perform a nucleic acid amplification test (NAAT) at the point-of-contact. To better contextualize NABIT’s role within the landscape of portable genetic testing platforms, it is important to differentiate it from existing field-deployable PCR systems. While portable PCR workstations provide valuable field-testing capacity, they often rely on cold-chain storage, precision pipetting, multistep protocols, and trained users. In contrast, NABIT was designed for decentralized biosurveillance scenarios where users may be non-technical, infrastructure is limited, and test menus must be adaptable.
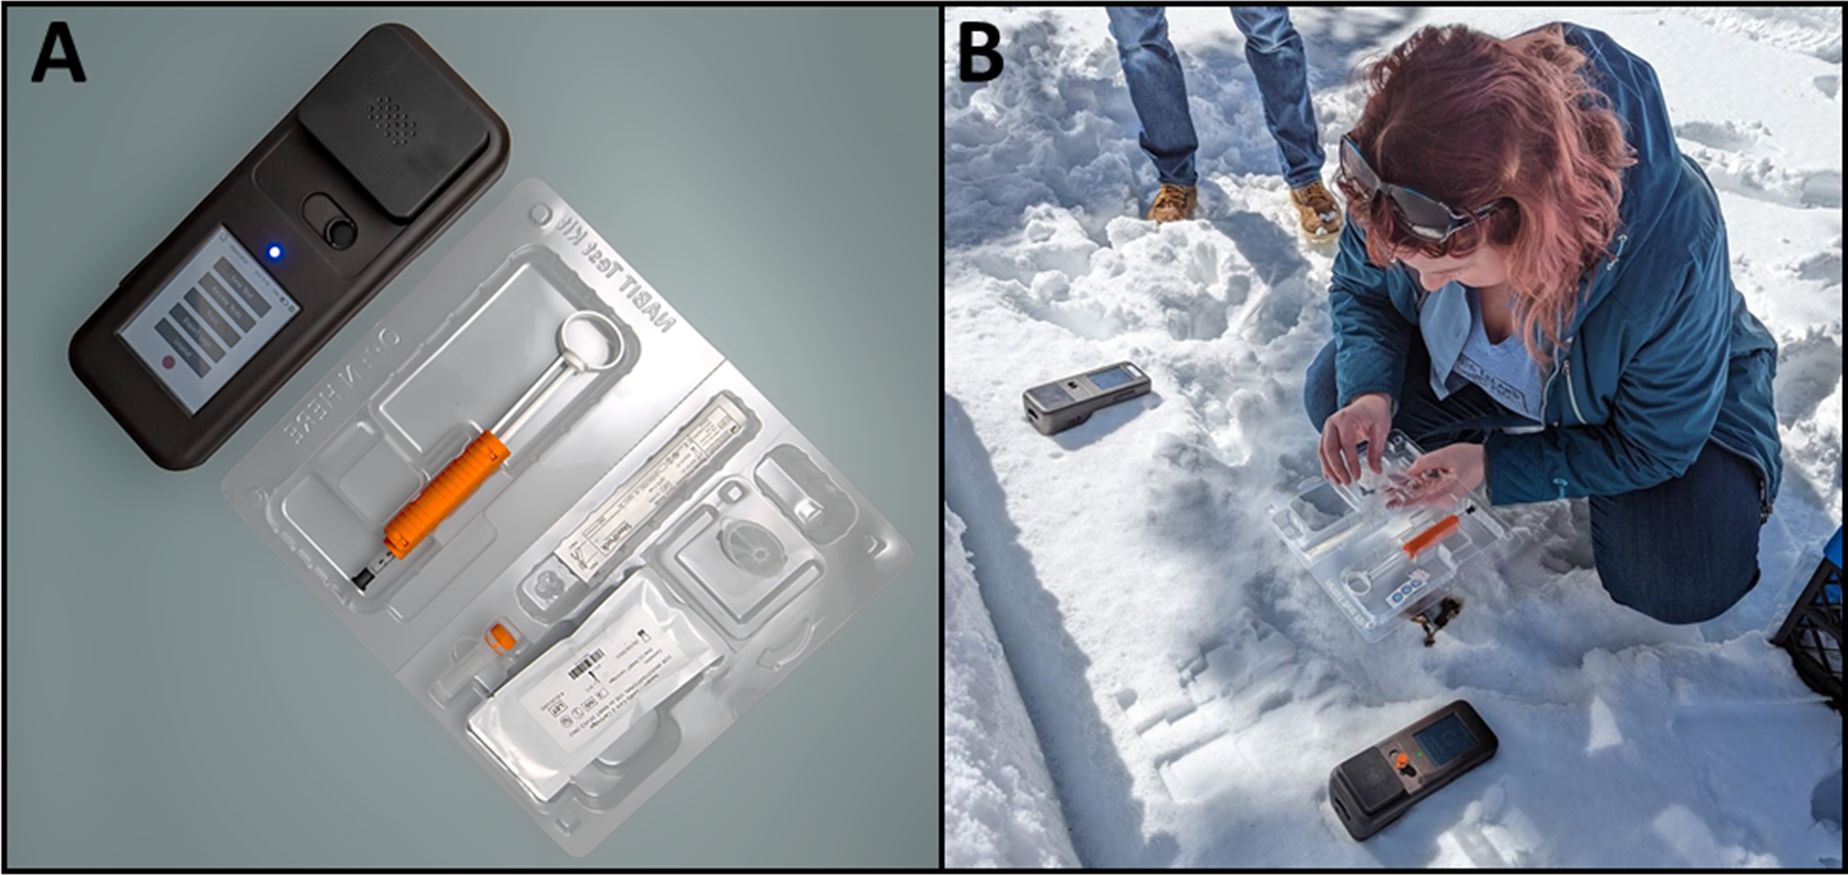
Figure 1. Decentralizing molecular testing for wildlife genetics and biosurveillance. The NABIT (A) provides a vehicle to enable point-of-contact genetic testing (B).
NABIT integrates sample lysis, multiplex isothermal amplification, and automated result interpretation into a battery-powered handheld device. It uses lyophilized assays stable for over 17 months without refrigeration and requires no measurement steps or software interpretation by the user. This format dramatically simplifies sample-to-result workflows, reducing the barrier to genetic monitoring in remote or resource-constrained environments. These distinctions—particularly NABIT’s simplified user interface, no-cold-chain assays, low manufacturing cost, and modular test kits—make it uniquely suited for applications like invasive species detection, wildlife trade monitoring, and community-based disease surveillance.
In this work, we demonstrate the first proof-of-concept of this envisioned hardware platform through the application of two field-ready tests. The first test detects a zoonotic RNA viral pathogen, SARS-CoV-2, which caused the COVID-19 pandemic that is now endemic in our communities and still threatens many wildlife populations, and the second test detects a specific fish species, sockeye salmon (Oncorhynchus nerka), that is of significant economic and cultural significance to the Pacific Northwest region of North America. While ongoing specific validation studies will still be required to fully characterize the performance of these assays and the impact of this approach, here we report on the specific hardware advances that lay the cornerstone of this vision.
2 Materials and methods
The key elements of the NABIT are a sample preparation port that enables thermal lysis of samples collected in the field, a reaction-detection chamber that accepts a cartridge, drives and monitors an isothermal amplification reaction, and a touch screen that provides an interactive user interface to guide users through the entire test process and report results.
With this format, a complete sample-to-result NAAT can be performed on the NABIT with a single manual processing step (Figure 2). To perform this workflow, a user will first collect the sample (typically in the format of a swab, scrape, tissue punch, or filter) into a lysis tube that contains a lysis buffer before inserting it into the NABIT to conduct a thermal lysis. After lysis, the user will withdraw the processed sample and dispense it into a five-well NABIT cartridge that is preloaded with lyophilized assays designed specifically for the test target. A custom transfer syringe enables users to perform this processing step without making any measurements or requiring technical precision. This syringe also enables a diluent buffer to be mixed with the lysed sample if required for that sample workflow. Finally, the loaded cartridge is inserted into the NABIT to run the isothermal amplification. During the test, the NABIT monitors a fluorescent indicator in the reaction in real-time and, with an automated detection algorithm, provides interpreted results in an easy-to-understand format as soon as the test is complete.
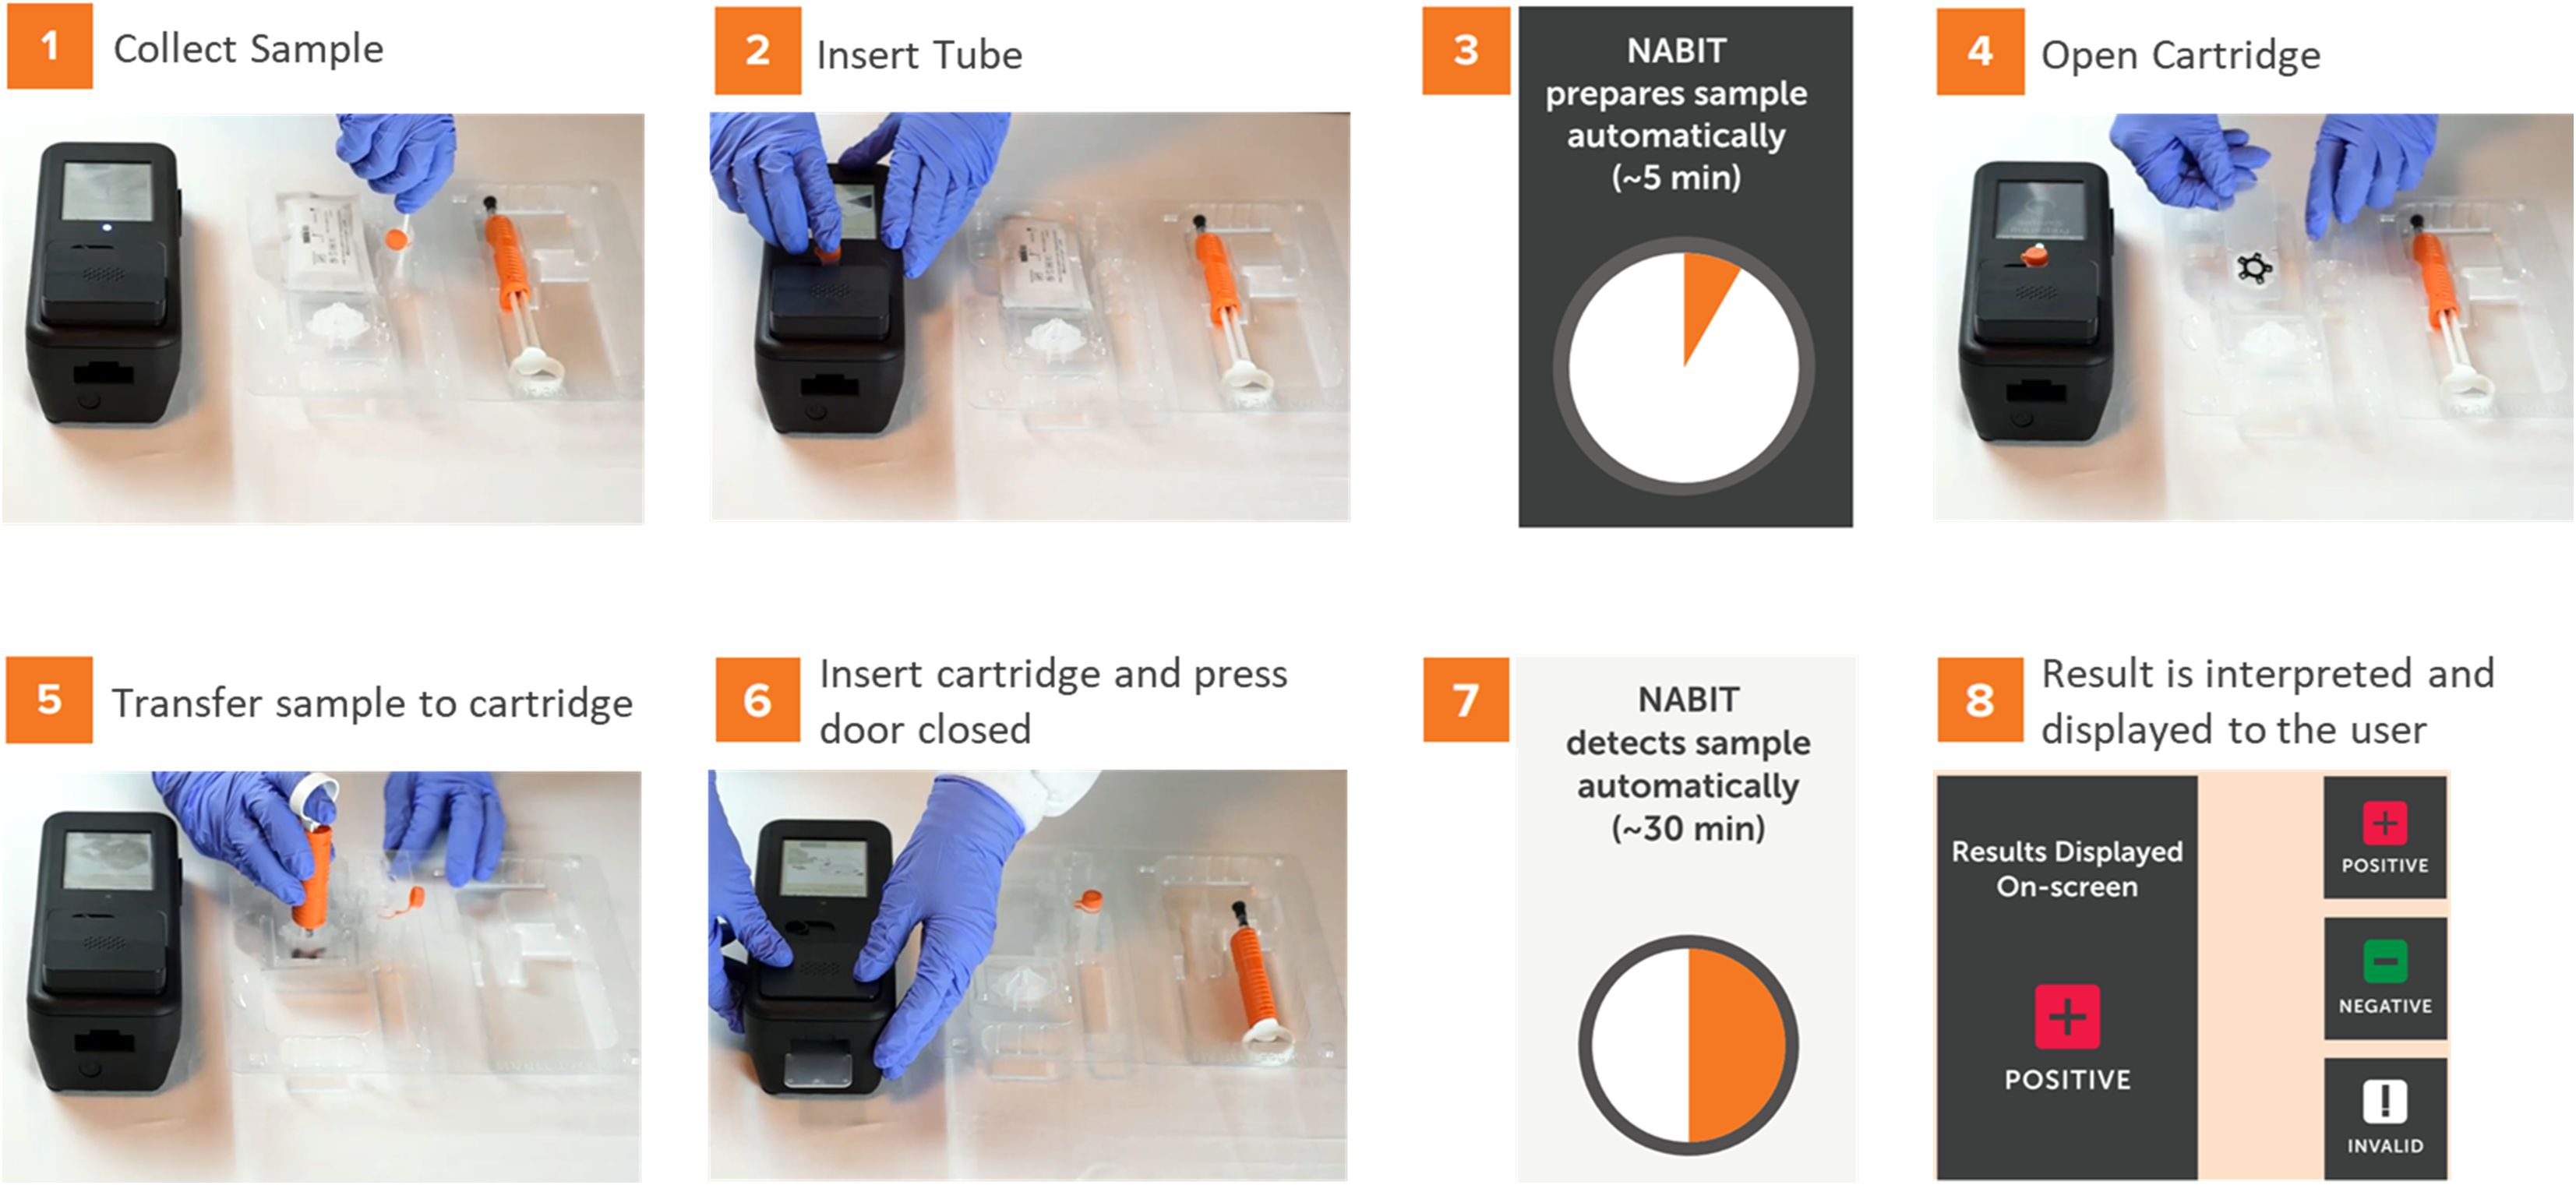
Figure 2. The NABIT and accompanying test kit provide a streamlined workflow to run genetic tests without precision measurements or techniques. A test is run on the NABIT by collecting and inserting the sample into the lysis tube (1) then inserting the tube into the NABIT (2) for thermal lysis (3). During lysis, the cartridge can be removed from its hermetically sealed pouch (4), upon which a volume-limited transfer syringe is used to add diluent before transferring the processed sample into the cartridge (5). The loaded cartridge is inserted into the NABIT (6) where the reaction is automatically performed (7) and the result is displayed to the user (8).
The four major sub-assemblies of the NABIT are the 1) base assembly - consisting of the housing base, battery, and barcode scanner, 2) top assembly – consisting of the top housing, touch screen, and main electronic board, 3) core assembly (Figure 3A) – containing the photodetector board, light emission channels, reaction heater and lysis heater, and 4) door assembly – containing the excitation LED board, excitation optical channels (LED Guide), and a spring loaded compression mechanism to seal the reaction wells in the cartridge when the door is engaged. For NABITs used in this work, we fabricated these sub-assembles and complete NABIT instruments using typical manual assembly techniques with custom and off-the-shelf componentry.
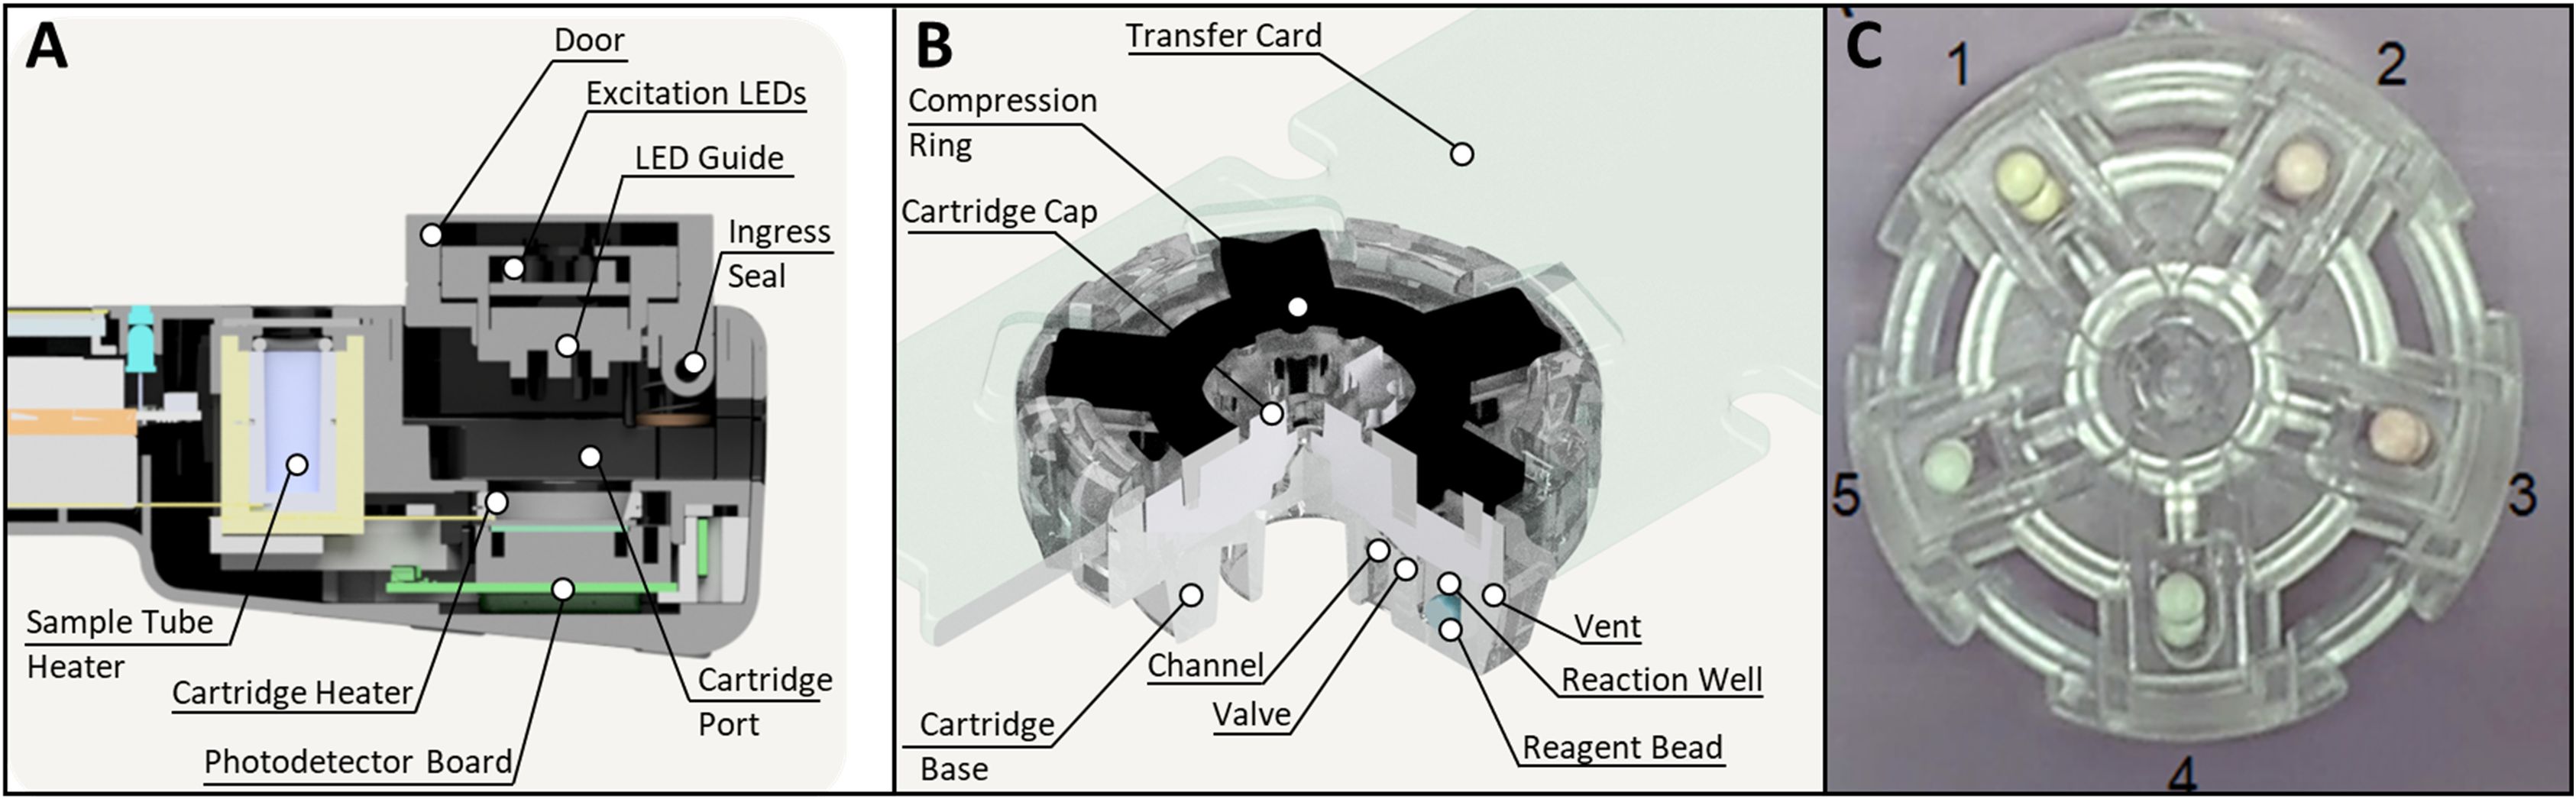
Figure 3. The NABIT enables sample-to-result tests with 5-well multiplex cartridges. The NABIT (A) provides a port to lyse samples in a collection tube and a reaction chamber that can heat cartridges and monitor a fluorescent reaction in each cartridge well. Lyophilized assay beads are housed in cartridge wells (B, C). A channel is formed by geometry at the interface of the base and cap, enabling the lysed sample to be distributed into each of the cartridge wells. A valve, also formed at this interface, seals the wells when the cartridge is compressed by the door assembly of the NABIT.
NABIT cartridges (Figure 3B) are composed of four components: 1) a transparent, rigid base composed of cyclic olefin copolymer, 2) a clear flexible silicone rubber cap, 3) a rigid compression ring composed of black acetyl butyl styrene/polycarbonate (ABS/PC), and 4) a transfer card composed of a black ABS. Each cartridge provides five wells that can house up to five specific assays for multiplex reactions. For all cartridges used in this work, we manually assembled cartridge components and placed lyophilized assay beads into the cartridge wells using a tweezer-vac with a 2.38 mm vacuum cup (Virtual Industries #TV-1000–110 and V8903-D-S) in an isolation glove box (Cleateach #2100-2-E) maintained at <10% RH.
2.1 Engineering verification tests
Following assembly, we performed verification tests on the NABIT to characterize the key performance parameters of the instrument. These tests focused on measuring the thermal range and stability of the lysis heater and cartridge heater, and the optical range of the photodetection system.
2.1.1 Lysis heater
To characterize the performance of the lysis heater, we used a thermocouple (Omega 5TC-TT-TI-36-1M) fed through a 2 mL centrifuge tube cap (Thermo Scientific 3471TOS) and threaded onto a 2 mL centrifuge tube (Thermo Scientific 3490S) containing 280 µL of water. We then placed this thermocouple embedded tube into the lysis chamber in the NABIT and monitored the in-tube temperature while the lysis heater was activated using DAQami data acquisition software (Digilent 6069-390-000).
2.1.2 Cartridge heater
We characterized the performance of the cartridge heater in a similar manner to the lysis heater by creating a thermocouple embedded cartridge with thermocouples placed in the center of each cartridge well and embedded in adhesive. We then placed this thermocouple embedded cartridge in the reaction chamber of the NABIT to monitor the temperature in each well of the cartridge while heating.
2.1.3 Optical system
We interrogated the range of the optical system using cartridges filled with a serial dilution of fluorescein sodium ranging from 2 mM – 100 µM to emit a range of fluorescence intensities consistent with a loop-mediated isothermal amplification (LAMP) reaction utilizing a fluorescent intercalating dye. For each cartridge, the reaction chamber was heated for 10 minutes allowing for 60 readings of each well to be taken by the NABIT optical system.
2.2 Test kit implementation of workflow
To enable a streamlined sample-to-result process with no measurement steps required by the user, we developed a test kit and custom transfer syringe to package the NABIT workflow. We created a holding tray to house a swab (or other collection tool), lysis tube, custom transfer syringe, and detection cartridge. This tray also has a built-in guide flap to facilitate loading of the cartridge.
The custom transfer syringe enables users to withdraw a volume of 155 µL to be transferred to the cartridge without any measurements and add a diluent buffer if required. This action is performed through a combination of cantilever stops built into a custom handle and a finger loop that connects to a 1 mL syringe (BD 309659). We make these parts from an injection molded ABS (Lustran 348). With this format, the transfer syringe can dispense up to 1000 µL of diluent buffer into the lysis tube, and when the plunger is withdrawn, the cantilever restricts movement to ensure 155 µL ± 5 µL is aspirated into the syringe for transfer into the cartridge. A skirt on the tube-facing edge of the transfer syringe prevents overflow of the lysis tube during this user step.
2.3 Software and detection algorithm
We developed an algorithm to automatically interpret the result of the amplification test for the user. To accommodate the variety of use cases the NABIT intends to address, we designed this algorithm to be adaptable and adjustable among different assays and sample types, while still providing reliable results based on the qualitative variables of each specific assay. The developed algorithm effectively detects signal increasing step windows that identify positive reactions that have occurred in each well channel (Figure 4). These step windows are defined by looking at the overall fluorescence signal derivative (dVdiff/t), a defined signal derivative threshold (rateTh), and signal steps labeled in a tuple containing the start and end indexes. Then, the width of a step, i.e., the duration of signal increase above the derivative threshold (Ts), is calculated by subtracting the starting index from the end index. The signal increase (Vdiff) is calculated from the integration of the derivative within the labeled steps. Hence, the average signal increase rate (avgRate = Vdiff/Ts) can be obtained. Within these step windows, we consider a set of threshold parameters (rateTh, widthLB and avgRateTh) to ensure the signal increase captured is from a true assay reaction. These variables look at the derivative of the reaction curve to filter potential false positives caused by a sudden impulse to the reaction signal, such as that caused by a mechanical shock or high-intensity signal interference occurring during the reaction, as well as signal drift that may occur independently of a true reaction.
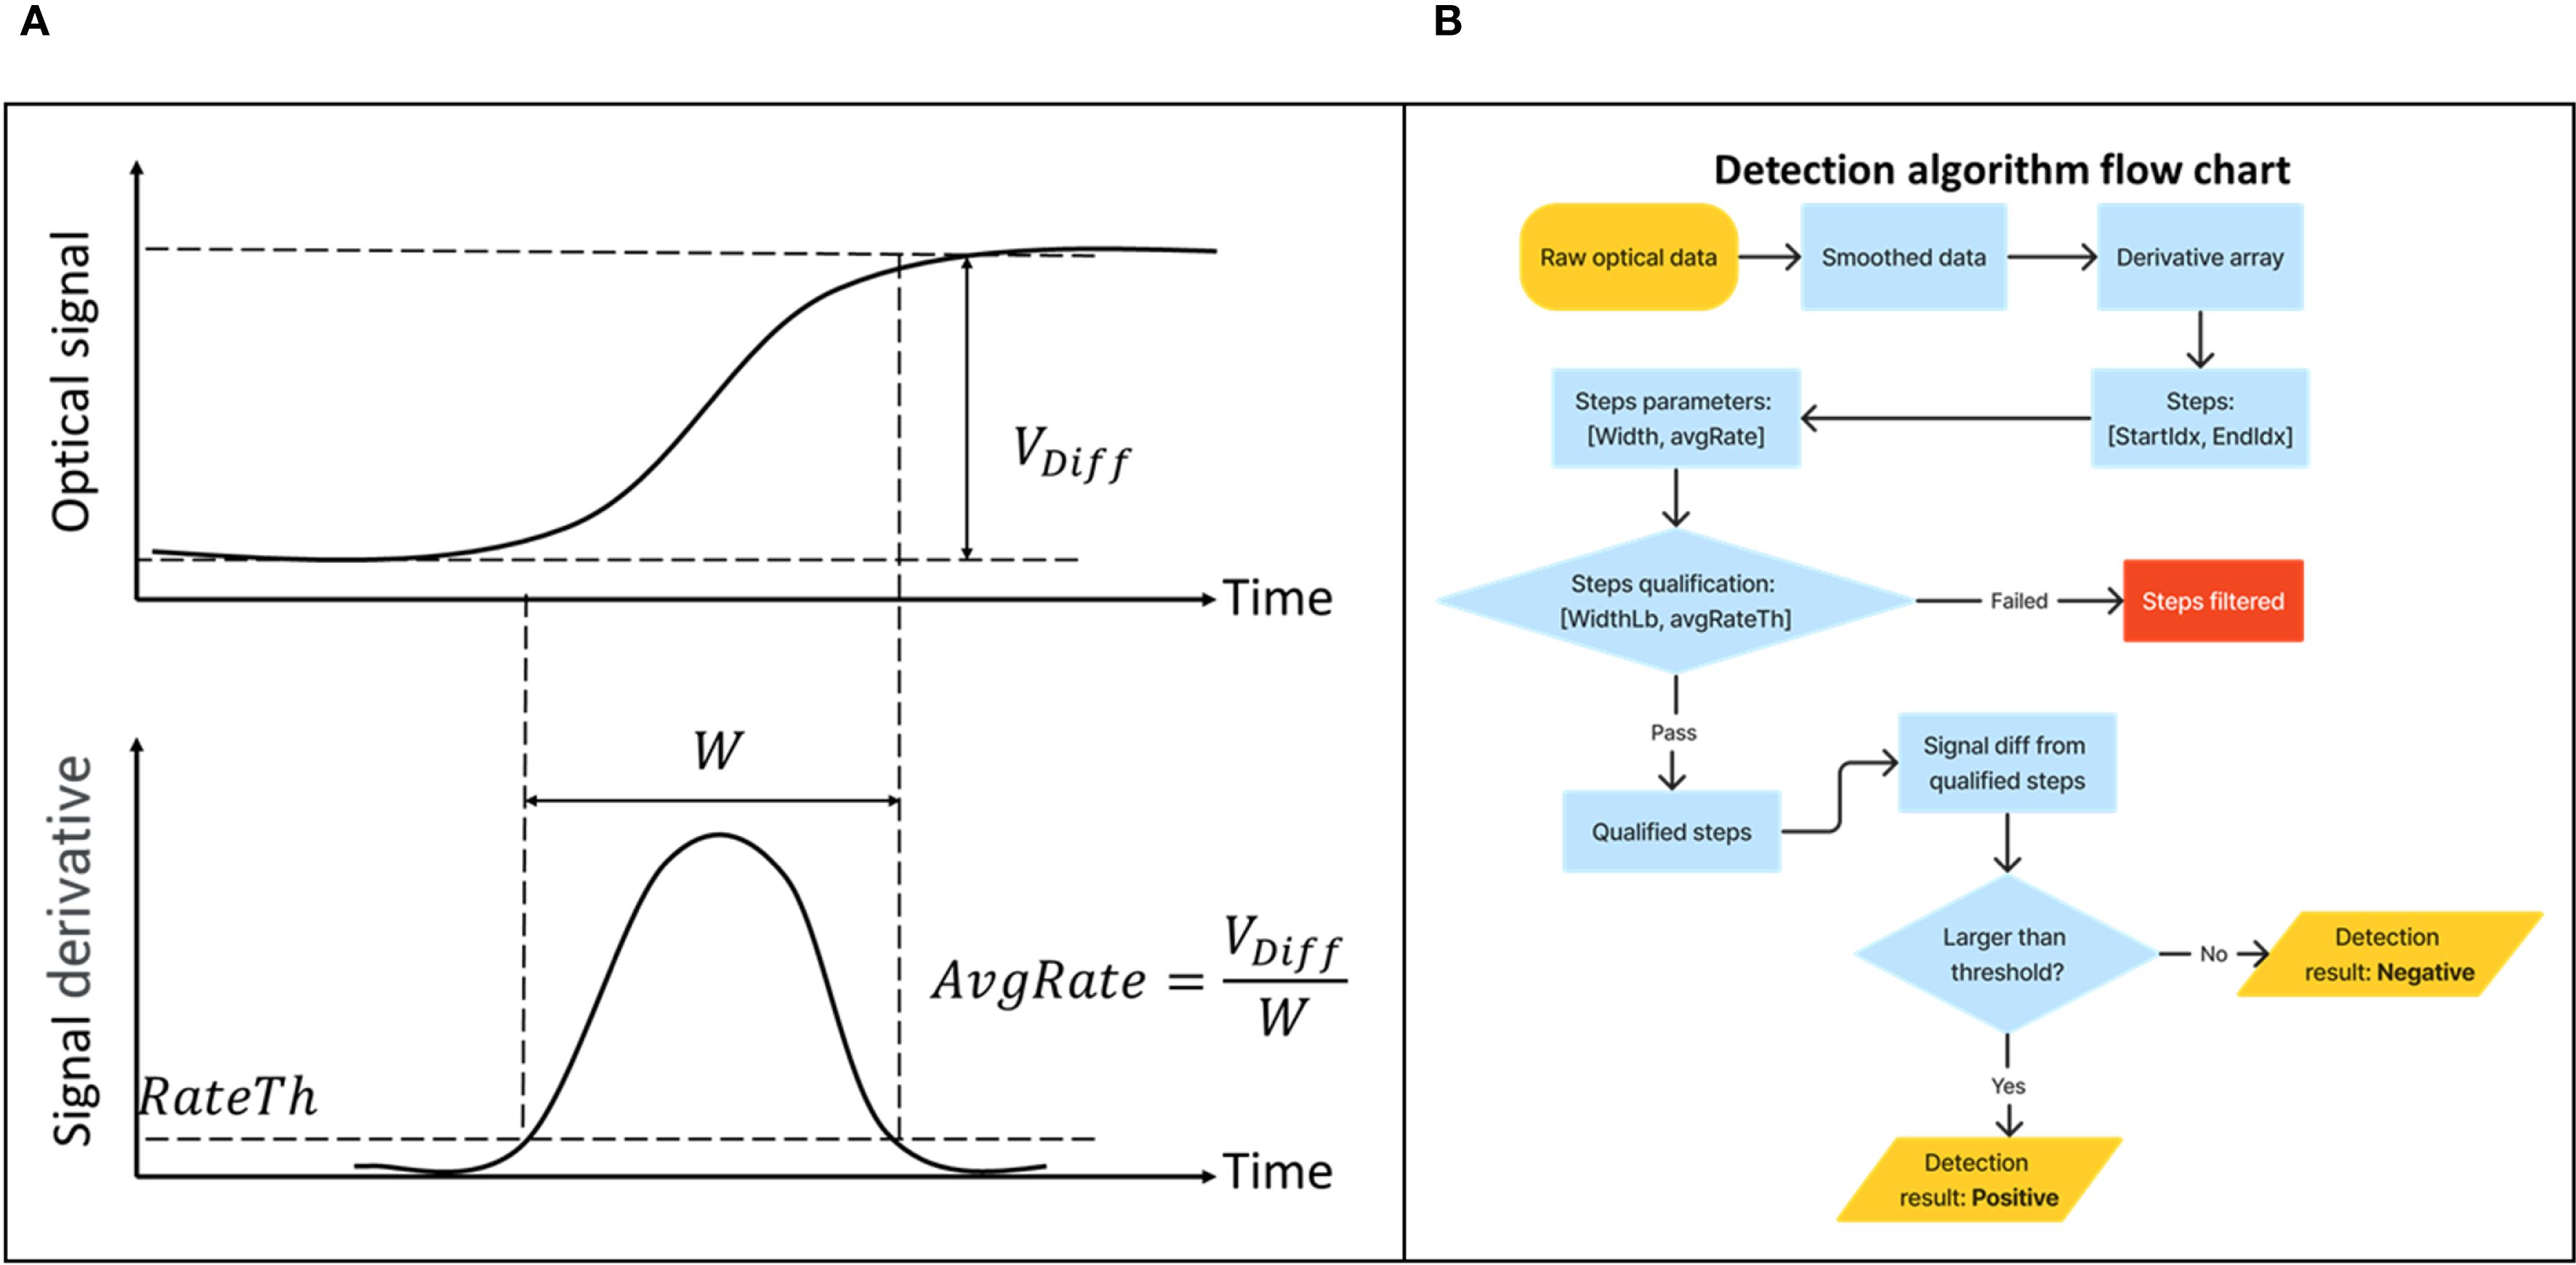
Figure 4. The NABIT detection algorithm monitors the fluorescent signal of reactions to provide automatic result interpretations and enable early call detection. The NABIT detection algorithm monitors for a sufficient rise in signal (Vdiff) to determine a positive test and analyzes the derivative of the incoming signal to ensure signal rise occurs within a specific window (W) that is consistent with amplification behavior rather than an impulse or signal drift during the reaction (A). To call a result, the process performed by the algorithm is shown in a flowchart (B), where the algorithm first performs this analysis on the derivative and then checks that the signal threshold has been crossed to call a positive.
2.4 Lyophilized assay production
To demonstrate the versatility of the NABIT platform, here we present data for two lyophilized field-ready tests developed for the NABIT - a zoonotic RNA viral pathogen, SARS-CoV-2, and a keystone anadromous species, sockeye salmon (Oncorhynchus nerka). We designed multiple LAMP or reverse-transcriptase LAMP (RT-LAMP) assays for each of these tests, which incorporated an intercalating dye for fluorescence detection of amplification products. We designed multiple custom primer sets across various gene targets while accounting for target variability and similarity to closely related species or confounding species (e.g. non-target species). We provided the primer sets with final assay recipes to a lyophilization manufacturer to translate each formulation into a stable, freeze-dried assay construct (a bead or cake) that could be physically handled and placed into the cartridge wells.
2.4.1 SARS-CoV-2 test
We used three RT-LAMP assays to create a NABIT test kit to detect SARS-CoV-2. In reference to the cartridge well layout shown in Figure 3C, well 1 contained an endogenous positive control that targets the human bacteriophage MS2 and includes a known concentration of RNA to monitor cartridge performance and inhibition. Wells 2 and 3 contain an assay that targets the nucleocapsid phosphoprotein (N) gene of the SARS-CoV-2 genome, while the assay in wells 4 and 5 targets the membrane glycoprotein (M) gene in the SARS-CoV-2 genome. We describe the RT-LAMP primers in Supplementary Table S1.
We designed all assays for a 20 µL total volume (assay compositions shown in Supplementary Table S2) and submitted these formulations to a lyophilization manufacturer that added excipients and dispensed reagents as roughly 5 µL droplets into liquid nitrogen and performed lyophilization according to the manufacturer’s cycling and drying processes (Argonaut Manufacturing Services – Carlsbad, CA).
2.4.2 Sockeye salmon test
For the sockeye salmon test, we developed two LAMP assays. The first was an endogenous positive control that targeted a section from a randomly synthesized DNA fragment, and the second assay targeted sockeye salmon (O. nerka). The DNA positive control assay template is a synthetic 1600 bp sequence developed using a random-number generator to create a unique genetic sequence that did not mimic any naturally occurring sequences stored in the National Center for Biotechnology Information Database (Sayers et al., 2022). In reference to the cartridge well layout shown in Figure 3C, well 1 contained the DNA positive control with a known concentration of template DNA to monitor cartridge performance and inhibition, and the remaining 4 wells contained the sockeye salmon assay. We describe the LAMP primers (Supplementary Table S3) and DNA positive control synthetic target sequence (Supplementary Table S4) in the Supplementary Materials.
We submitted the positive control DNA assay formulation (composition shown in Supplementary Table S5) to a lyophilization manufacturer that added excipients and dispensed reagents as roughly 2X 10 µL droplets into liquid nitrogen and performed lyophilization according to the manufacturer’s cycling and drying processes (Evik Diagnostic Innovations – Ottawa, ON Canada).
For the sockeye salmon assay, we explored the use of a custom primer-less mixture (with composition shown in Supplementary Table S5) dispensed as a 2X 10 µL droplet directly into 96-well plates and lyophilized into cakes according to the manufacturer’s cycling and drying process (NEB Lyophilization Sciences – Oxford United Kingdom). The primer mix was added separately by drying down in the four respective cartridge wells for 60 minutes prior to dispensing the lyophilized cake.
2.5 Molecular performance tests and controls
We evaluated both assays using respective DNA or RNA targets from real samples to demonstrate complete sample-to-result workflows on the NABIT.
2.5.1 SARS-CoV-2 test evaluation
Specificity was evaluated using the ZeptoMetrix Respiratory Panel (#NATRPP-1), which includes 19 species of related or confounding viruses and bacteria plus a positive (SARS-CoV-2 at 1000 NDU/µL) and negative control in quadruplicate (n=4). Each species was added to lysis buffer containing 46% saline, 1 U/µL RiboGuard RNase Inhibitor (Biosearch Technologies RG90925), and 20% QuickExtract™ RNA (Biosearch Technologies SS000880-D2) then lysed at 95°C for 3 minutes. The LAMP reaction was prepared as a wet chemistry (not lyophilized) following Supplementary Table S2 with 5 µL of the lysed sample added to each reaction.
Range finding and performance testing were conducted by the Atlanta Center for Microsystems Engineered POC Technologies at Emory University (ACME-POCT - Atlanta, GA). The sample-to-result workflow used gamma-irradiated SARS-CoV-2 virus standards (Isolate USA-WA1/2020 - BEI #NR-52287) in human nasal wash (Lee Biosolutions #991-26-P), ranging from 7,650 to 12 NDU/µL. Each standard (50 µL) was loaded onto a polyester swab (Puritan 25-806) to represent a standard range of 38,250 NDU - 600 NDU of input, followed by dipping the swab into a 2 mL microcentrifuge tube with tethered O-ring cap (described in section 2.1.1) containing 400 µL of a lysis buffer consisting of 25 mM UltraPure™ Tris-HCl (Invitrogen™ 15568025), 25% QuickExtract™ RNA (Biosearch Technologies SS000880-D2) and UPdH2O (Invitrogen™ 10977015) for 10 seconds. The tube was heated to 95°C for 5 min in the NABIT lysis chamber followed by addition of 1 mL of diluent buffer consisting of 25 mM UltraPure™ Tris-HCl (Invitrogen™ 15568025), 1X RNAsecure™ RNase Inactivation Reagent (Invitrogen AM7005) and UPdH2O (Invitrogen™ 10977015) using the transfer syringe in section 2.2. Finally, 155 µL ± 5 µL of the prepared standard was loaded into the cartridge at final concentrations ranging from 29.77 to 0.47 NDU/µL, then inserted into the NABIT for incubation at 65°C for 30 min, followed by result interpretation by the algorithm.
The standards were also evaluated using traditional laboratory methods for comparison to the NABIT results. Extraction was performed using the EZ1 Virus Mini kit v2.0 (Qiagen) and EZ1 Advanced XL instrument (Qiagen). Briefly, 120 μL of standard was lysed with AVL lysis buffer (Qiagen) to a final volume of 400 μL prior to initiation of automated purification, of which includes: proteinase K treatment, nucleic acid binding to magnetic particles, two washing steps and finally elution of 60 μL purified nucleic acid with AVE elution buffer (Qiagen). The standard product was then amplified in a real-time thermocycler using the CDC 2019-Novel Coronavirus real-time RT-PCR Diagnostic Panel (2019-n CoV N2 and RNase P assays) to produce Ct values.
2.5.2 Sockeye salmon test evaluation
We conducted sample-to-result tests with the sockeye cartridge using eDNA collected via water filtration at a salmon hatchery in the Pacific Northwest region of the United States. Environmental water samples collected in this manner did not disturb or directly contact any animals and therefore did not require ethical approval or permits according to local legislation and regulations where the samples were collected. We drew 1 L of water from a tank (pool volume of 1308 ft3 with a river supply rate of 150 gallon/minute) holding 395 live O. nerka salmon across a 0.45 µm pore size polyethersulfone membrane filter (Smith-Root 11746-25) using an eDNA Citizen Scientist Collector (Smith-Root 12099). The filter was transferred using single use forceps and custom 3D-printed funnel to a 2 mL microcentrifuge tube with tethered O-ring cap (described in section 2.1.1) containing 1.5 mL of an alternate lysis buffer composed of 25 mM UltraPure™ Tris-HCl (Invitrogen™ 15568025), 0.2 mM EDTA (Invitrogen™ AM9260G), 0.2 mM NaCl (USB Corporation 75888), 5% Tween (Thermo Scientific J20605-AP), and UPdH2O (Invitrogen™ 10977-015). The tube was shaken for 15 seconds then heated to 92°C for 5 min in the NABIT lysis chamber. After an additional 15 seconds of shaking, 155 µL ± 5 µL of the heated buffer was loaded into the cartridge. The cartridge was then inserted into the NABIT and heated to 65°C for 40 min followed by result interpretation by the algorithm.
3 Results
Overall, the NABIT provides a hand-held, battery-powered platform that successfully detected both a pathogen (SARS-CoV-2) and wildlife species (O. nerka) target using predesigned assays incorporated into NABIT-compatible test kits. The NABIT also delivered these results from two notably different samples and processing workflows, demonstrating the ability of the onboard sample preparation chamber and accompanying test kit format to enable complete sample-to-result tests of diverse sample types without additional equipment. Finally, producing the different cartridges for this work only required changing the assay beads or cakes placed into the cartridge wells, demonstrating that the design of the NABIT cartridge, in combination with the use of lyophilized assay beads, provides for an agile manufacturing platform for new test layouts to be readily assembled when additional assays become available. The use of pre-made lyophilized LAMP/RT-LAMP mastermix cakes (NEB LyoPrime™) in combination with dried-down primers also demonstrated the utility and speed at which new applications can be tested on real samples in remote settings prior to translation to a long-term shelf-stable product.
While a manual step is required between collection of the sample and performance of the NAAT, this format enables a greater level of versatility than would be possible in a fully automated system. With this format, accompanying test kits can be readily customized to collect and process different sample types by altering the collection tools, buffer composition, and volumes. Additional steps can also be added to future test kits if required for especially challenging sample types or applications. Through this functionality, the NABIT is poised to address a broad variety of applications, from identifying trafficked wildlife or wildlife products, detecting protected or invasive species with eDNA, and biosurveillance applications for pathogens.
3.1 Sample preparation
The sample preparation chamber consists of a heatblock and heating element that supports a standard 2 mL microcentrifuge tube. The temperature is controlled by the NABIT software and monitored by a thermistor on the heatblock. The chamber can safely reach temperatures up to 100°C. In-tube temperature measurements show that the NABIT sample preparation chamber can reach and maintain 95°C within ± 2°C through the completion of the heating cycle (Figure 5). Furthermore, the ramp time from room temperature to 95°C was 3 minutes. The ability to reach 95°C and stably maintain this temperature demonstrates the ability of the NABIT to enable preparation of sample types that require inactivation (Kampf et al., 2020) at high temperatures and covers the range of temperatures used in thermolysis (Islam et al., 2017; Lestari et al., 2019).
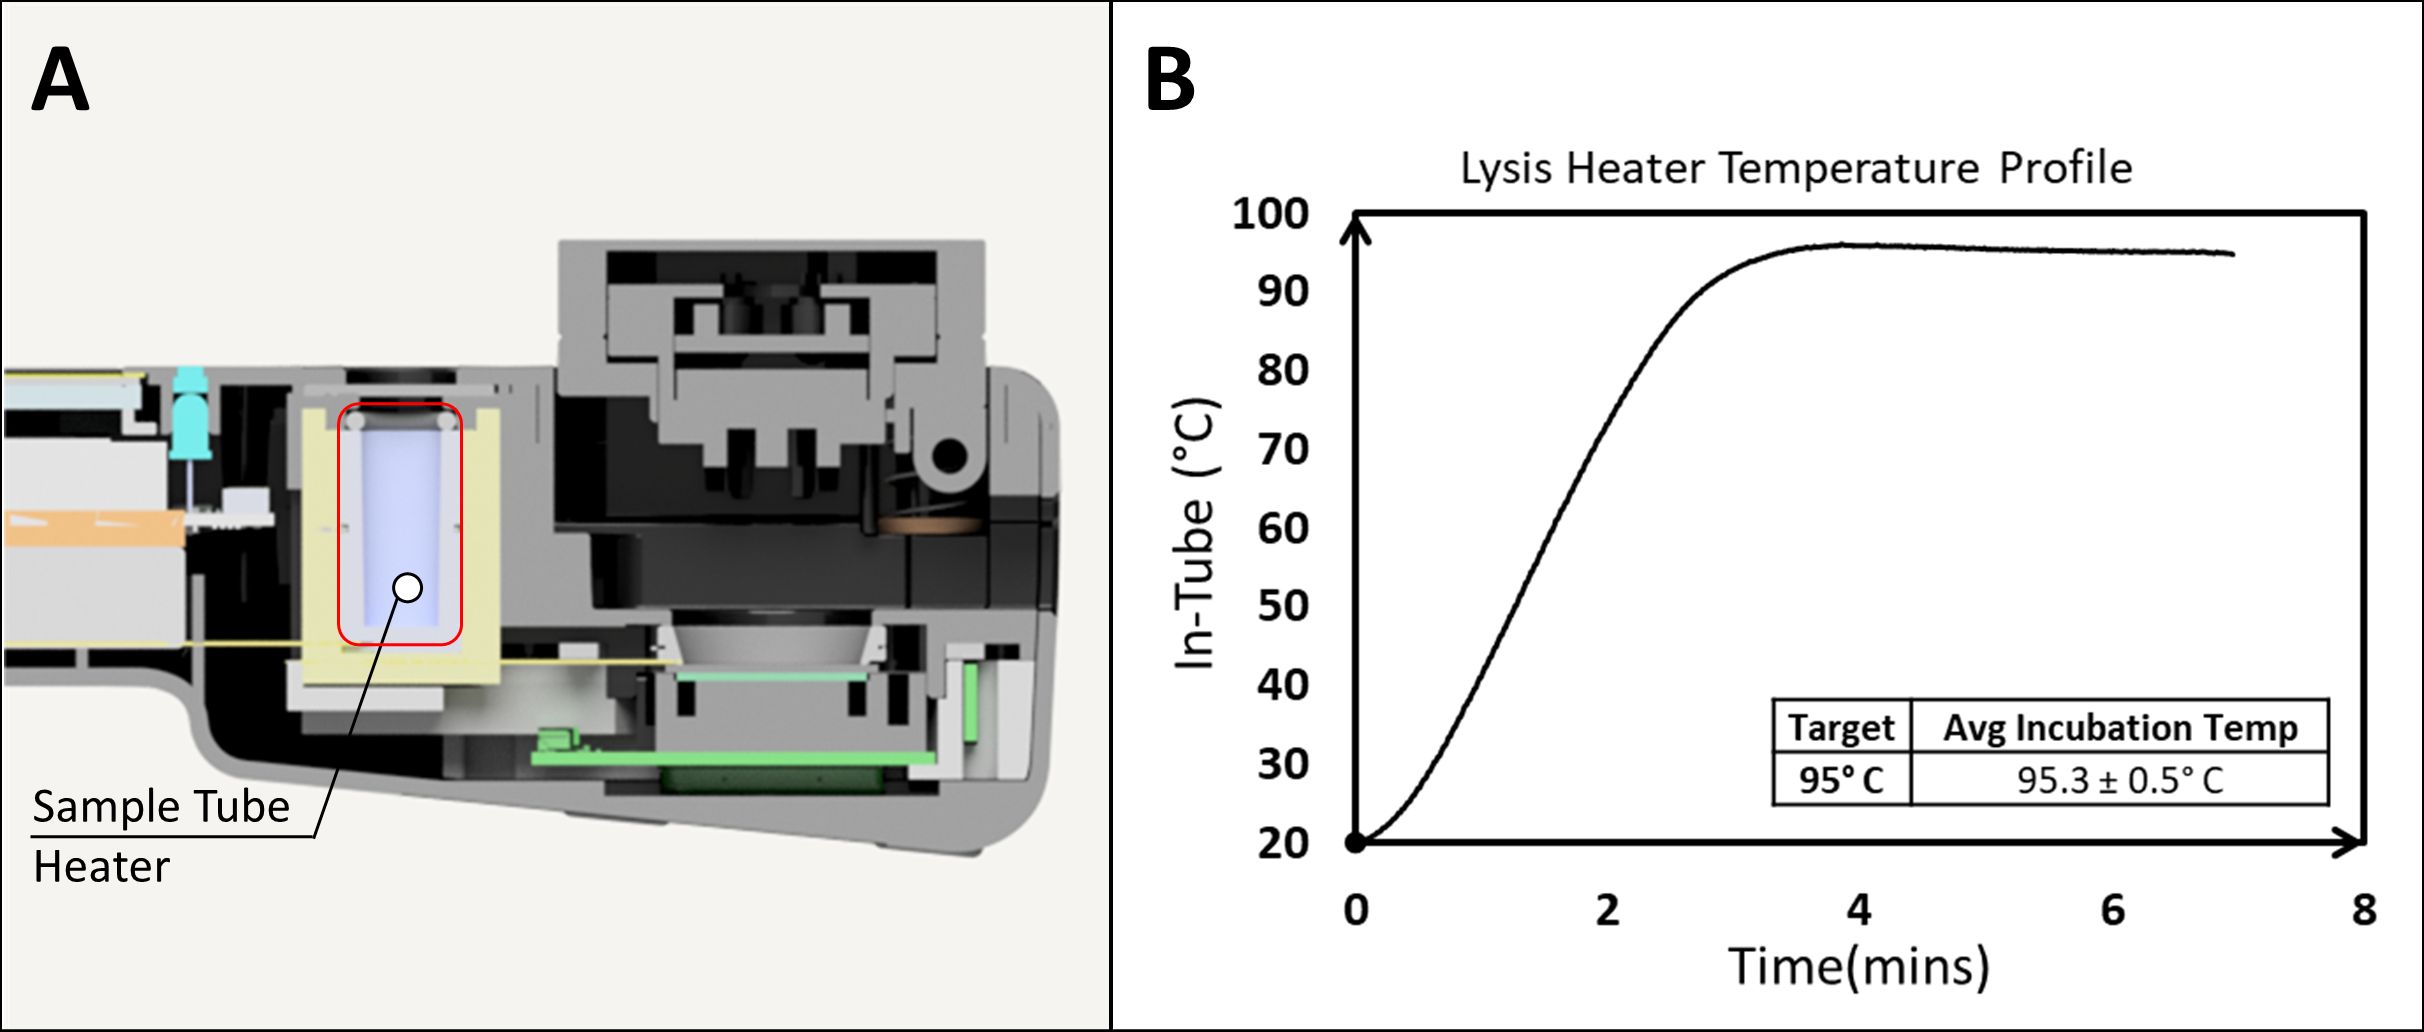
Figure 5. The on-board NABIT lysis heater provides a quick ramp rate up to high temperatures for thermal sample processing. The sample tube heater (A) demonstrates a ramp time of 180 seconds to maintain a lysis temperature of 95.3° ± 0.5°C.
3.2 Reaction-detection chamber
Results demonstrate that the cartridge heater maintained temperatures up to 70°C with a well-to-well variance of ± 1.0°C (Figure 6). The reaction-detection chamber took less than 6 minutes for each well to reach the target reaction temperature. The detection system of the NABIT detected concentrations of fluorescein down to 2 µM and as high as 10 µM, sufficient to cover the emission range of a LAMP reaction with an intercalating dye. Together, the reaction chamber exhibited the required temperature range and stability to reliably drive isothermal amplification tests and monitor fluorescent emission of indicator dyes throughout the course of the reaction. This ability, combined with an automated detection algorithm also enables early call functionality to be implemented on the NABIT where the test can report the result to the operator as soon as an amplification curve is observed, rather than waiting until the specified incubation time is complete.
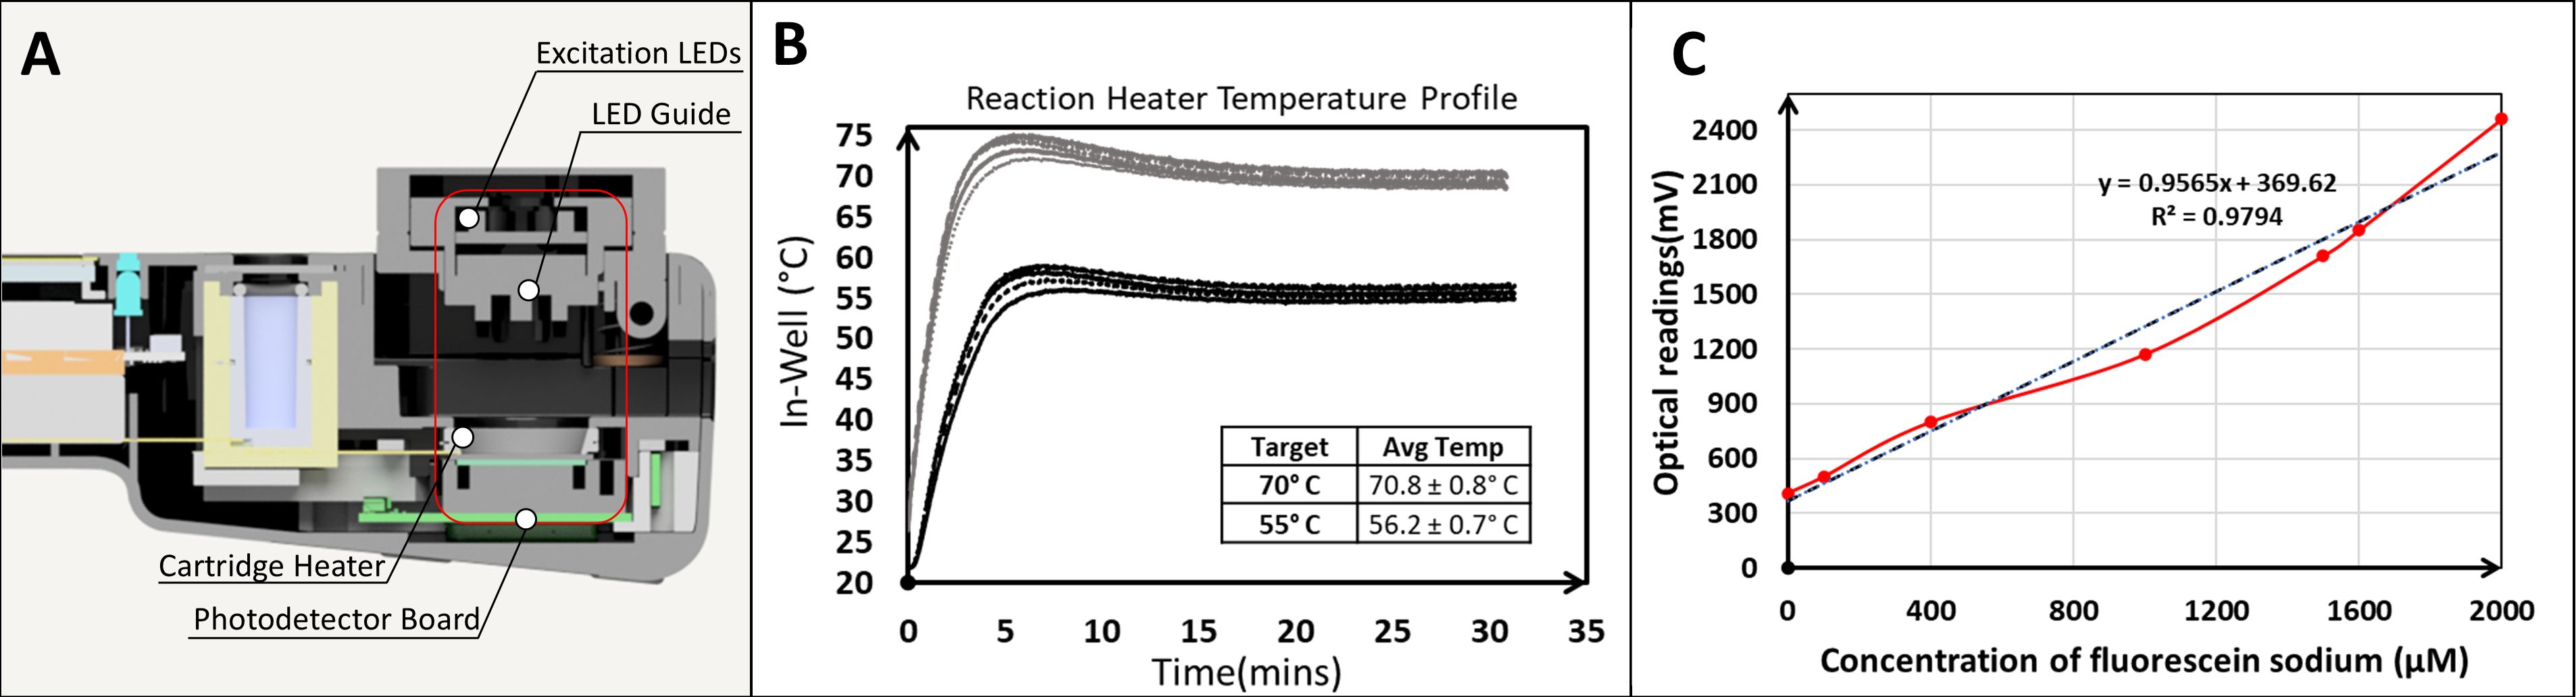
Figure 6. The NABIT reaction-detection chamber provides stable thermal profiles and optical sensitivity to drive and monitor amplification reactions. The NABIT reaction-detection chamber (A) provides ramp times less than 6 minutes for reaction temperatures ranging from 55°C to 75°C, and maintains target temperatures at ± 1.0°C (B). The optical sensors detect fluorescein sodium with a linear trend (R2 = 0.98) across a concentration of 2 to 10 µM (C).
3.3 Test performance
Both assays produced results as expected from sample-to-result inputs using either a contrived nasal swab input (for SARS-CoV-2) or an eDNA water filtrate (for sockeye salmon), and demonstrated consistent amplification on the NABIT, with all LAMP or RT-LAMP reactions occurring in under 30 minutes. Furthermore, the NABIT produced results from samples collected in the field and evaluated on-site.
3.3.1 SARS-CoV-2 assay performance
Performance testing at ACME-POCT on the NABIT device required at least 3 positive tests to confirm an overall positive result for each standard concentration. The results demonstrated that the NABIT could detect template targets down to a concentration of 0.93 NDU/µL (Figure 7), the equivalent of about 18.6 NDU in a reaction well, a value that is approaching the theoretical limit of 10 copies required for LAMP reactions (Notomi et al., 2000). The NABIT can detect lower concentrations, as shown by the 0.47 NDU/µL standard, but not as consistently with this test. The comparison test of the standard using traditional laboratory extraction and amplification produced Ct values between 21.54-27.87 for 2019-n CoV N2, with a Ct of 27.75 for the 1195 NDU LoD input (starting point of the 0.93 NDU/µL LoD). Ct values for RNase P averaged at 26.86 (SD 1.54), indicating consistent extraction and amplification of the standard dilutions. A false positive was reported in a negative sample that was attributed to the inherent contamination risk involved with diagnostic sampling. We will continue to characterize these results and adapt with changes to the sample workflow and detection algorithm to ensure a low rate of false positives.
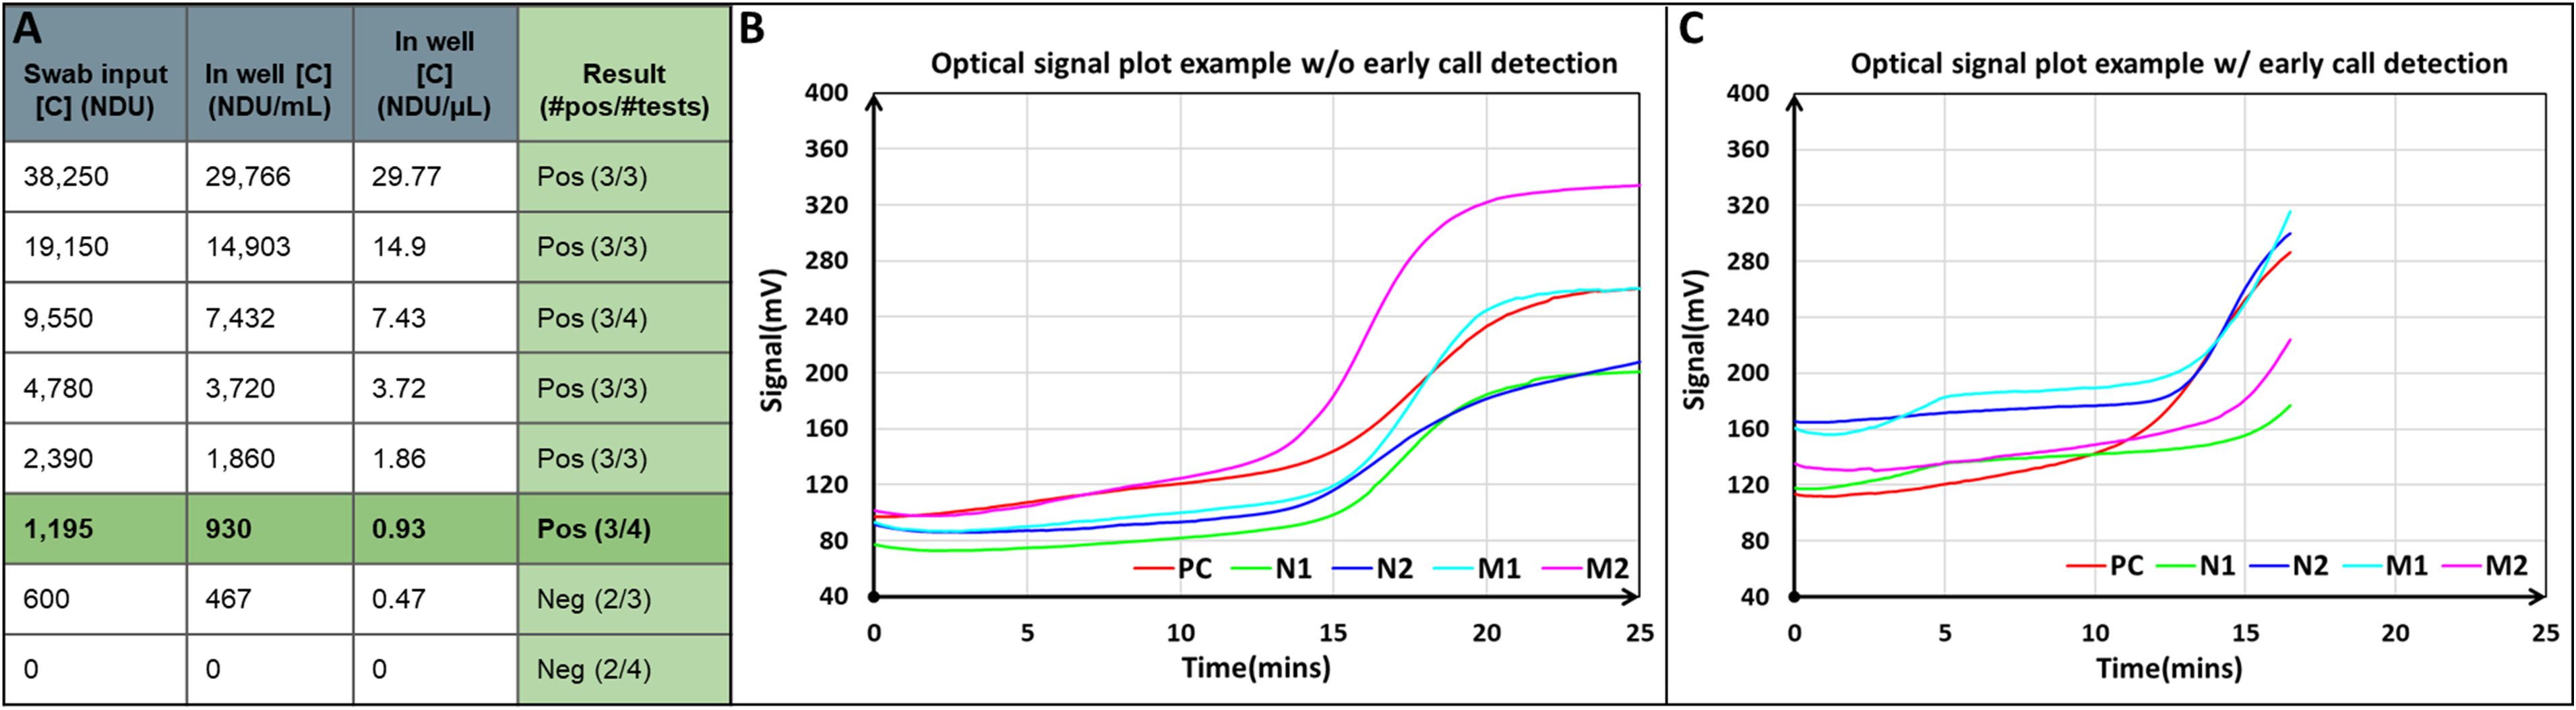
Figure 7. The NABIT can provide sensitive, low copy number detection of SARS-CoV-2 samples. Range finding limit of detection tests performed by ACME-POCT at Emory University demonstrated detection of input sample down to 0.93 NDU/µL (A). Fluorescent curves on the NABIT show the monitoring (B) and early call capability of a positive result (C).
Specificity testing performed on the SARS-CoV-2 assay using the ZeptoMetrix Respiratory Panel confirmed that no species other than the positive control amplified prior to 35 minutes, which is beyond the testing time of the SARS-CoV-2 Test performed on the NABIT (Supplementary Table S6).
3.3.2 Sockeye salmon assay performance
Sample-to-result tests conducted on eDNA water filters collected from O. nerka mesocosms generated positive amplification for all wells (Figure 8). Our team performed these NABIT tests on-site, immediately following collection of the eDNA filtrates. The DNA positive control assay amplified within 11–13 minutes, while the O. nerka assay amplified between 13–22 minutes. Further evaluation of the O. nerka LAMP assay, including analytical performance and limit of detection on water filter samples, will be conducted after lyophilized bead optimization. This result provided proof-of-concept verification that the NABIT could correctly confirm the presence of O. nerka in a freshwater system from a simple water filter extraction and LAMP assay, enabling for the first time the capability of processing eDNA samples containing O. nerka at the point-of-contact from collection-to-result.
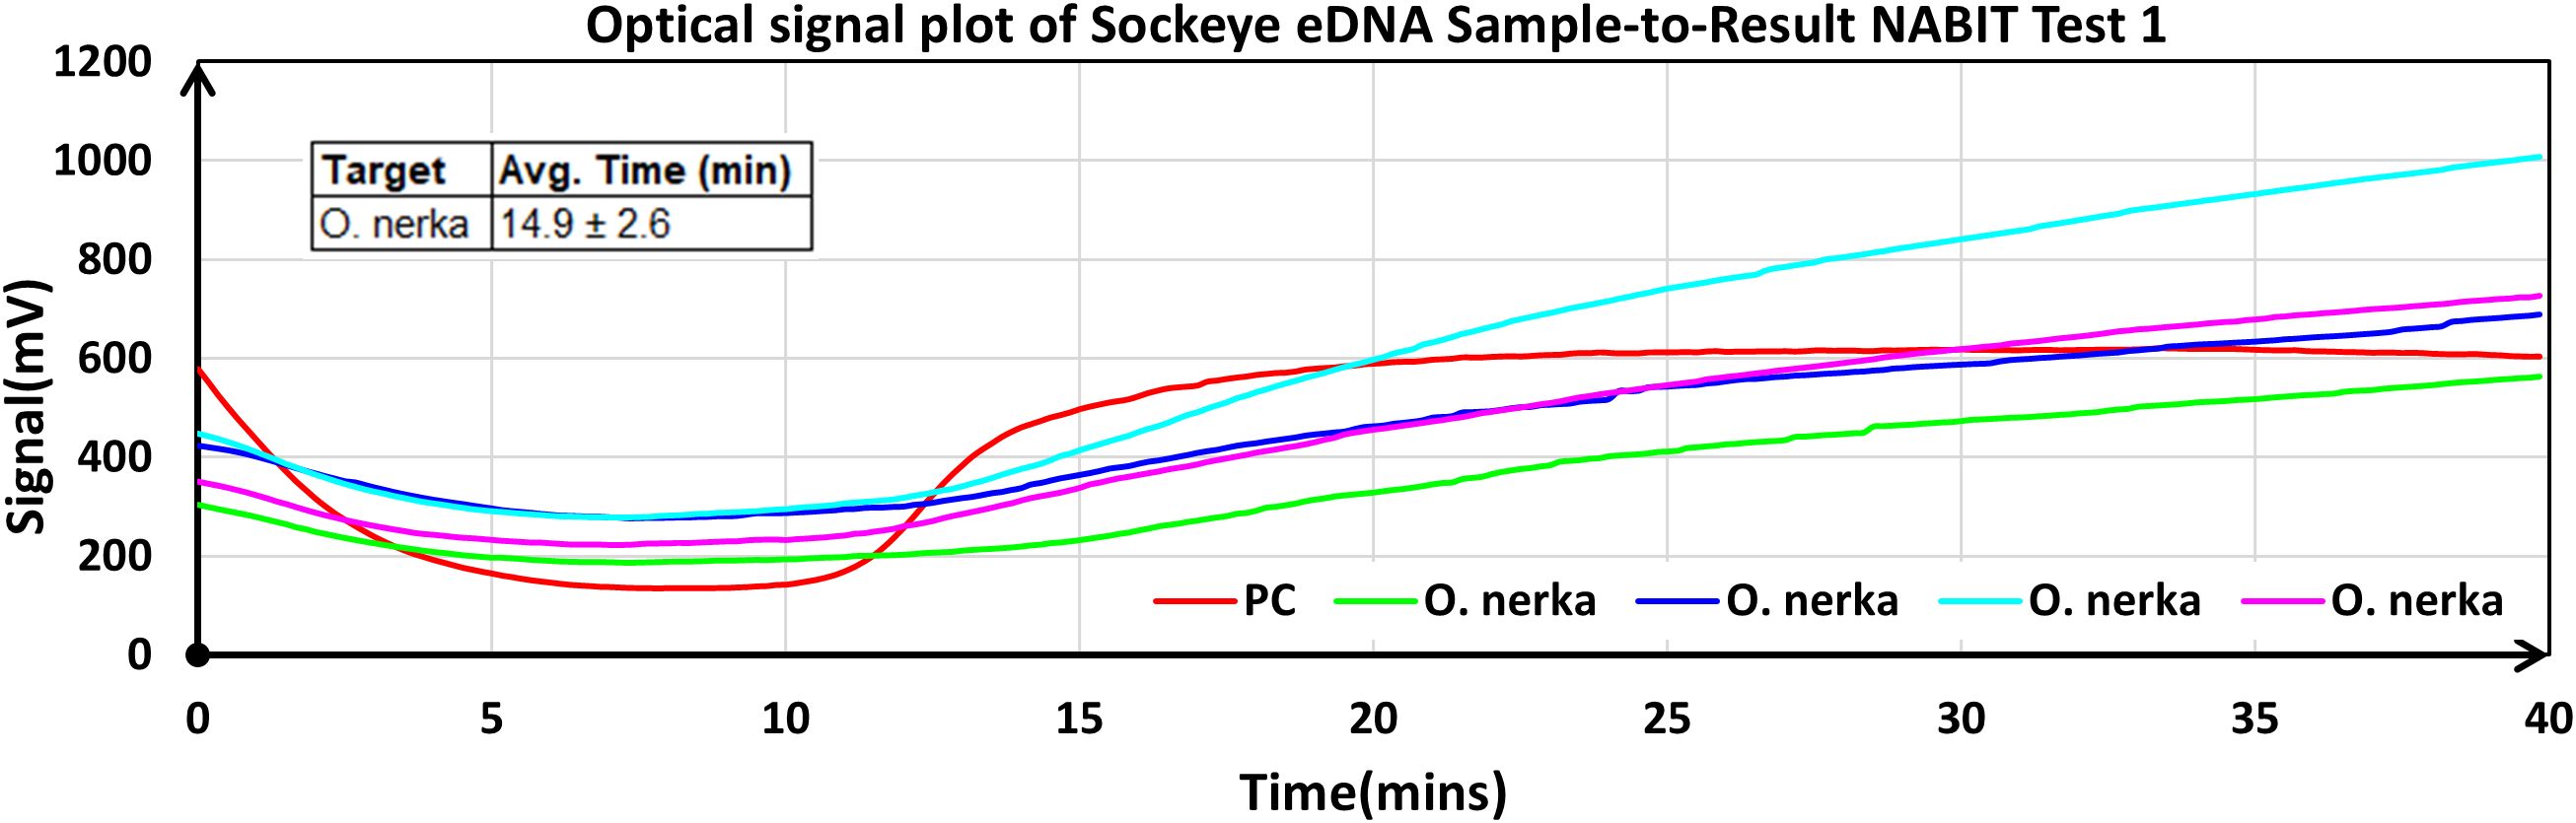
Figure 8. The NABIT detection of sockeye salmon (O. nerka) eDNA samples on-site. Graph displays real-time fluorescence data on the NABIT with a cartridge containing a DNA positive control and four wells with the O. nerka assay. All wells showed positive reactions in under 20 minutes from a sample of eDNA (1 L of water filtered from a tank containing 395 sockeye salmon) processed on the NABIT on-site.
4 Discussion
This work presents the potential of the NABIT platform as a rapid presence-absence detection tool, to bridge advancements in genetics and genetic testing technologies to non-technical personnel actively implementing conservation and environmental health programs - marking a successful first step toward democratizing genetic capabilities in the field. Current technologies such as qPCR, ddPCR, CRISPR-based diagnostics, and hybridization assays provide targeted and sensitive detection, but each has trade-offs in complexity, portability, and interpretability. For example, qPCR and ddPCR enable quantification of target DNA but require trained personnel to perform thermal cycling and interpret amplification curves, limiting their accessibility outside centralized labs (Fomsgaard and Rosenstierne, 2020). CRISPR-based assays, including platforms like SHERLOCK and DETECTR, offer promise for speed and specificity but still rely on multi-step workflows and are still undergoing validation for broader field use (Patchsung et al., 2020). Hybridization and lateral flow assays are simple and cost-effective but often lack the sensitivity or specificity needed for low-abundance eDNA detection (Kozel and Burnham-Marusich, 2017). Field-portable workstations like the Bento Lab have been used to support mobile qPCR, sequencing, and DNA extraction in remote conditions, yet still require trained operators and remain cost-prohibitive for widespread deployment in conservation (Watsa et al., 2021; Bento Lab, 2024). Ultimately, the landscape of tools is expanding, but practical barriers—such as cost-per-test, infrastructure needs, and technical burden—continue to shape the accessibility and scalability of molecular detection in conservation and environmental health efforts (Land et al., 2019). The NABIT eliminates these barriers, enabling rapid point-of-contact detection, demonstrated in this work through two proof-of-concept test kits that can detect a target from field samples.
The design of the NABIT hardware and test kits can accommodate a range of applications - demonstrated through proof-of-concept results on both a viral pathogen and a keystone species - while providing a more approachable user interface that guides and canalizes performance of the test to reduce error and improve reliability when performed by non-technical users. This work demonstrated the NABIT’s lab-quality performance through third-party testing (ACME-POCT), showing low copy number sensitivity and high specificity of the SARS-CoV-2 assay. Further validation and adoption of this approach can enable early detection and rapid response to be more accessible and cost-effective to implement.
A point-of-contact approach to eDNA genetic testing does not exist for targets such as O. nerka, requiring stakeholders to collect samples and process them in centralized labs with long lead times, high costs, and technical expertise. For applications such as eDNA monitoring for the invasive European Green Crab (Danziger and Frederich, 2022) and rodent species on islands (Piaggio et al., 2024), the time to detection is a significant barrier to rapid response efforts that are critical to habitat restoration efforts (Dunn et al., 2025). Point-of-contact devices are being developed for eDNA applications (Ecogenomic sensors), but have yet to break through commercially and have been limited to research papers (Lu et al., 2024). When viewed from the current landscape of constraints and opportunities for molecular methods and field-deployable genetics for conservation and environmental health, the NABIT addresses an important gap for cost-effective and rapid decision-making by non-technical implementers.
5 Conclusion
The Nucleic Acid Barcode Identification Tool (NABIT) demonstrates significant potential to transform on-site genetic testing. While we present results from two use cases in this initial demonstration of the NABIT, the versatility of this technology demonstrates the potential to serve a myriad of applications across biosurveillance, Planetary Health, and wildlife conservation. By enabling non-technical users to conduct rapid nucleic acid amplification tests, the NABIT has the potential to bridge the gap between centralized laboratories and field operations. The modularity of the NABIT, test kits, and cartridge format provides for facile adaptation and implementation of new assays and layouts into a test kit. As emerging infectious diseases, invasive species, and biodiversity loss continue to challenge global health and ecosystems, the NABIT offers a proactive and accessible solution to detect and mitigate these threats.
For future work, we aim to conduct broader parametric studies on the assays presented here and additional assays in development by our team to demonstrate how deployed NABIT testing at a larger scale compares to traditional laboratory testing approaches with regard to performance, accessibility, and turnaround time for early detection and rapid response scenarios. While we continue to expand our assay menu and sample workflow availability for the NABIT, our goal is to facilitate collaborative efforts with interdisciplinary partners interested in a variety of applications. This will be crucial for advancing this technology, broadening its applications, and fostering a global community dedicated to safeguarding biodiversity and public health.
Data availability statement
The original contributions presented in the study are included in the article/Supplementary Material. Further inquiries can be directed to the corresponding author.
Ethics statement
Ethical approval was not required for the studies on humans in accordance with the local legislation and institutional requirements because only commercially available established cell lines were used. Ethical approval was not required for the study involving animals in accordance with the local legislation and institutional requirements because the samples used in this work were environmental water samples that contained environmental DNA. This sample collection did not disturb or directly contact any animals and did not require ethical approval or permitting according to local legislation and regulations.
Author contributions
HH: Conceptualization, Funding acquisition, Investigation, Methodology, Project administration, Resources, Supervision, Visualization, Writing – original draft, Writing – review & editing. MW: Data curation, Formal analysis, Methodology, Supervision, Validation, Writing – original draft, Writing – review & editing. CF: Conceptualization, Data curation, Formal analysis, Methodology, Software, Validation, Visualization, Writing – review & editing. GF: Conceptualization, Data curation, Formal analysis, Investigation, Methodology, Validation, Visualization, Writing – review & editing. MB: Data curation, Writing – review & editing, Formal analysis, Methodology. DD: Data curation, Methodology, Writing – review & editing. JM: Data curation, Writing – review & editing. DF: Conceptualization, Funding acquisition, Resources, Supervision, Writing – review & editing. PB: Conceptualization, Funding acquisition, Resources, Writing – review & editing. AD: Conceptualization, Funding acquisition, Resources, Writing – original draft, Writing – review & editing.
Funding
The author(s) declare financial support was received for the research, authorship, and/or publication of this article. The authors would like to acknowledge the Gordon and Betty More Foundation, Schmidt Marine Technology Partners, Schmidt Futures, the National Institutes of Health Rapid Acceleration of Diagnostics (RADx Next) Program, KKR Philanthropy, and the Center of Complex Interventions for their support of this work.
Acknowledgments
The authors would like to acknowledge Fahim Farzadfard and Louis Kang for their assistance in primer design and the Atlanta Center for Microsystems Engineered Point-of-Care Technologies (ACME-POCT) for the assistance in assay validation.
Conflict of interest
PB, AD, DF, MW, CF, GF, and HH are employees of Conservation X Labs and authors on a patent that underlies the NABIT technology. JM, MB, and DD, are employees of Conservation X Labs.
Generative AI statement
The authors declare that no Gen AI was used in the creation of this manuscript.
Any alternative text (alt text) provided alongside figures in this article has been generated by Frontiers with the support of artificial intelligence and reasonable efforts have been made to ensure accuracy, including review by the authors wherever possible. If you identify any issues, please contact us.
Publisher’s note
All claims expressed in this article are solely those of the authors and do not necessarily represent those of their affiliated organizations, or those of the publisher, the editors and the reviewers. Any product that may be evaluated in this article, or claim that may be made by its manufacturer, is not guaranteed or endorsed by the publisher.
Supplementary material
The Supplementary Material for this article can be found online at: https://www.frontiersin.org/articles/10.3389/fcosc.2025.1521050/full#supplementary-material
References
Bank W (2010). Volume one: towards a one health approach for controlling zoonotic diseases (Washington, DC: World Bank).
Barratt A. S., Rich K. M., Eze J. I., Porphyre T., Gunn G. J., and Stott A. W. (2019). Framework for estimating indirect costs in animal health using time series analysis. Front. Vet. Sci. 6, 190. doi: 10.3389/fvets.2019.00190
Bento Lab (2024). Bento Lab – Portable DNA Laboratory. Available online at: https://www.bento.bio (Accessed July 27 2025).
Clemmons E. A., Alfson K. J., and Dutton J. W. (2021). Transboundary animal diseases, an overview of 17 diseases with potential for global spread and serious consequences. Anim. Open Access J. MDPI 11, 2039. doi: 10.3390/ani11072039
Danziger A. M. and Frederich M. (2022). Challenges in eDNA detection of the invasive European green crab, Carcinus maenas. Biol. Invasions 24, 761–777. doi: 10.1007/s10530-022-02757-y
Deiner K., Bik H. M., Mächler E., Seymour M., Lacoursière-Roussel A., Altermatt F., et al. (2017). Environmental DNA metabarcoding: transforming how we survey biodiversity. Mol. Ecol. 26, 5872–5895. doi: 10.1111/mec.2017.26.issue-21
Dejean T., Valentini A., Miquel C., Taberlet P., Bellemain E., and Miaud C. (2012). Improved detection of an alien invasive species through environmental DNA barcoding: the example of the American bullfrog Lithobates catesbeianus. J. Appl. Ecol. 49, 953–959. doi: 10.1111/j.1365-2664.2012.02171.x
Dunn R. E., Benkwitt C. E., Maury O., Barrier N., Carr P., and Graham N. A. J. (2025). Island restoration to rebuild seabird populations and amplify coral reef functioning. Conserv. Biol. 39, e14313. doi: 10.1111/cobi.14313
Ferguson J., Duran J., Killinen W., Wagner J., Kulesza C., Chatterley C., et al. (2020). A field-deployable and low-cost PCR (FLC-PCR) thermocycler for the rapid detection of environmental E. coli. Annu. Int. Conf IEEE Eng. Med. Biol. Soc 2020, 2209–2212. doi: 10.1109/EMBC44109.2020.9176519
Fomsgaard A. and Rosenstierne M. N. (2020). An alternative workflow for molecular detection of SARS-CoV-2—escape from the NA extraction kit-shortage, Copenhagen, Denmark, March 2020. Eurosurveillance. 25, 2000398. doi: 10.2807/1560-7917.ES.2020.25.14.2000398
IUCN Red List of Threatened Species. Available online at: https://www.iucnredlist.org/en (Accessed November 1, 2024).
Islam M. S., Aryasomayajula A., and Selvaganapathy P. R. (2017). A Review on Macroscale and Microscale Cell Lysis Methods. Available online at: https://europepmc.org/article/pmc/pmc6190294 (Accessed July 27 2025).
Kampf G., Voss A., and Scheithauer S. (2020). Inactivation of coronaviruses by heat. J. Hosp Infect. 105, 348–349. doi: 10.1016/j.jhin.2020.03.025
Keesing F. and Ostfeld R. S. (2021). Impacts of biodiversity and biodiversity loss on zoonotic diseases. Proc. Natl. Acad. Sci. U.S.A. 118, e2023540118. doi: 10.1073/pnas.2023540118
Kozel T. R. and Burnham-Marusich A. R. (2017). Point-of-care testing for infectious diseases: past, present, and future. J. Clin. Microbiol. 55, 2313–2320. doi: 10.1128/JCM.00476-17
Land K. J., Boeras D. I., Chen X. S., Ramsay A. R., and Peeling R. W. (2019). REASSURED diagnostics to inform disease control strategies, strengthen health systems and improve patient outcomes. Nat. Microbiol. 4, 46–54. doi: 10.1038/s41564-018-0295-3
Lestari R., Nasrul A. A., Pitaloka K. D., and Hendrayanti D. (2019). “The effect of various temperatures of heat shock method to the DNA concentration of filamentous strains Cyanobacteria,” in AIP Conference Proceedings (Melville, New York, USA: AIP Publishing) 2168.
Linacre A. and Tobe S. S. (2011). An overview to the investigative approach to species testing in wildlife forensic science. Investig. Genet. 2, 1. doi: 10.1186/2041-2223-2-2
Lu S., Zeng H., Xiong F., Yao M., and He S. (2024). Advances in environmental DNA monitoring: standardization, automation, and emerging technologies in aquatic ecosystems. Sci. China Life Sci. 67, 1368–1384. doi: 10.1007/s11427-023-2493-5
National Academies of Sciences, Medicine (2019). Science breakthroughs to advance food and agricultural research by 2030 (Washington DC: National Academies Press). Available online at: https://books.google.com/books?hl=en&lr=&id=iDiPDwAAQBAJ&oi=fnd&pg=PR1&dq=+Science+Breakthroughs+to+Advance+Food+and+Agricultural+Research+by+2030&ots=hye8hkDKw2&sig=5427Vyl9PiZcMwVJKWCUsEVDmRo (Accessed July 27 2025).
Notomi T., Okayama H., Masubuchi H., Yonekawa T., Watanabe K., Amino N., et al. (2000). Loop-mediated isothermal amplification of DNA. Nucleic Acids Res. 28, e63–e63. doi: 10.1093/nar/28.12.e63
Patchsung M., Jantarug K., Pattabiraman D., Aphicho K., Suraritdechachai S., Meesawat P., et al. (2020). Clinical validation of a Cas13-based assay for the detection of SARS-CoV-2 RNA. Nat. BioMed. Eng 4, 1140–1149. doi: 10.1038/s41551-020-00603-x
Piaggio A. J., Gierus L., Taylor D. R., Holmes N. D., Will D. J., Gemmell N. J., et al. (2024). Building an eDNA surveillance toolkit for invasive rodents on islands: can we detect wild-type and gene drive Mus musculus? BMC Biol. 22, 261. doi: 10.1186/s12915-024-02063-0
Ruppert N. C., Kline R. J., and Rahman M. S. (2019). Past, present, and future perspectives of environmental DNA (eDNA) metabarcoding: a review. Metabarcoding Metagenomics 3, e37954. doi: 10.3897/mbmg.3.37954
Sayers E. W., Bolton E. E., Brister J. R., Canese K., Chan J., Comeau D. C., et al. (2022). Database resources of the national center for biotechnology information. Nucleic Acids Res. 50, D20–D26. doi: 10.1093/nar/gkab1112
Urban L. E. and Werner D. (2022). Environmental DNA sequencing with Oxford Nanopore: in the lab and in the field. Oxford Nanopore Technol. Webinar (Accessed July 27 2025).
USDA APHIS National List of Reportable Animal Diseases. Available online at: https://www.aphis.usda.gov/aphis/ourfocus/animalhealth/monitoring-and-surveillance/nlrad/ct_national_list_reportable_animal_diseases (Accessed July 27 2025).
Keywords: nucleic acid amplification test, biosurveillance, species detection, on-site genetic testing, eDNA
Citation: Holmes HR, Winters M, Fang C, Fotouhi G, Baron MF, Day DL, Mercader J, Fox DA, Bunje PME and Dehgan A (2025) Decentralizing genetic testing for biodiversity monitoring and biosurveillance with the Nucleic Acid Barcode Identification Tool (NABIT). Front. Conserv. Sci. 6:1521050. doi: 10.3389/fcosc.2025.1521050
Received: 28 January 2025; Accepted: 01 September 2025;
Published: 17 October 2025.
Edited by:
Elena Buzan, University of Primorska, SloveniaReviewed by:
Mai Fahmy, Fordham University, United StatesNi Kadek Dita Cahyani, Diponegoro University, Indonesia
Copyright © 2025 Holmes, Winters, Fang, Fotouhi, Baron, Day, Mercader, Fox, Bunje and Dehgan. This is an open-access article distributed under the terms of the Creative Commons Attribution License (CC BY). The use, distribution or reproduction in other forums is permitted, provided the original author(s) and the copyright owner(s) are credited and that the original publication in this journal is cited, in accordance with accepted academic practice. No use, distribution or reproduction is permitted which does not comply with these terms.
*Correspondence: Hal R. Holmes, TkFCSVRAY29uc2VydmF0aW9ueGxhYnMub3Jn