 Micaela Small
 Hazel A. Oxenford
- 1School of Ocean and Earth Science, Faculty of Environmental and Life Sciences, University of Southampton, Southampton, United Kingdom
- 2Centre for Resource Management and Environmental Studies, University of the West Indies, Cave Hill Campus, Bridgetown, Barbados
Anchoring is well known to cause potentially significant damage to sensitive marine habitats, yet is relatively poorly studied, especially for cruise ships. These are among the largest ships in the world and frequently seek to visit relatively unspoilt tropical destinations, where docking facilities are absent or inadequate, resulting in cruise ships anchoring instead. Limited resources in agencies tasked with marine management in these destinations often constrain the ability to assess potential impacts and develop robust anchoring protocols based on scientific information that seek to preserve valuable marine habitats. In this study we present a low-cost method for identifying anchoring events and studying the detailed movement of cruise ships at anchor to determine their anchoring footprint and to map maximum potential habitat damage. This methodological approach using open access automatic identification systems (AIS) data is particularly well suited to destinations where resources for marine management are scarce, yet the environmental and socioeconomic cost of anchoring damage is likely to be high.
1 Introduction
Anchor damage has long been recognised as an important stressor on sensitive tropical marine habitats, especially coral reefs and seagrass meadows (e.g. Davis, 1977; Halas, 1985; Rogers, 1985; Smith, 1988; Creed and Amado Filho, 1999; Milazzo et al., 2004; Hernández-Delgado, 2023). Anchoring is highly detrimental to these sensitive habitats because it not only results in physical damage directly under the dropped anchor, but also during the process of anchoring which requires that the anchor is ‘set’ after dropping by dragging it backwards until it digs into the substrate. Once anchoring is complete, the retrieval of the anchor leads to further damage (Collins et al., 2010). During the anchoring process on hard substrates, stony corals, gorgonians and sponges that are essential to the integrity of a biodiverse coral reef community are broken, fragmented, or overturned, even damaging the reef framework itself (Rogers and Garrison, 2001; Smith, 1988). For seagrass meadows in soft substrates, the anchoring process severely damages the above-ground canopy and can uproot or break the network of rhizomes below the sediment surface leading to ‘potholing’ (through subsequent erosion) and damage to the integrity of the meadow (Collins et al., 2010; Francour et al., 1999; Milazzo et al., 2004). In both these sensitive habitats, anchoring causes significant impacts through damaging the foundational ecosystem engineering species. These impacts can be long-term as seen in the US Virgin Islands where even ten years after a cruise ship dropped anchor on a coral reef in Virgin Islands National Park, St. John there were no signs of recovery (Rogers and Garrison, 2001). Furthermore, ships’ anchors only hold if pulled horizontally or at a very small angle requiring a substantial amount of chain to achieve this (the deeper the water the longer the anchor chain required). Whilst at anchor, ships swing back and forth depending on prevailing winds, waves and currents causing the anchor chain to drag across the seafloor, thereby increasing the area of damage to these sensitive habitats substantially through direct physical contact (scouring) and through the release of silt clouds (Davis et al., 2016; Watson et al., 2022).
The degree of damage that occurs from anchoring is dependent on the type and size of anchor used, with larger anchors known to result in greater damage (Collins et al., 2010; Dao and Grabe, 2024). The anchoring of large ocean-going cruise ships, in particular, can potentially cause significant damage to sensitive habitats (Rogers and Garrison, 2001). For example, a typical ocean cruise ship is around 200–300 m in length and carries two anchors each weighing between 5–18 metric tons with over 500 m of anchor chain that drags across the substrate as the anchored vessel swings (Davis et al., 2022; Ito et al., 2023). Interestingly, although remote sensing tools are increasingly being used to examine anchoring footprints, a standard approach has not been adopted industry-wide and there is little quantitative information on anchoring damage to sensitive habitats (especially coral reefs) by cruise ships. This is despite the burgeoning cruise industry, that has seen a steady 7.3% rise in passenger numbers annually over the past three decades (Ito et al., 2023). Furthermore, it is common practice to drop anchor whilst awaiting entry to busy ports, or where the destination does not have docking facilities or is too shallow to enter the port (Davis et al., 2022). In fact, cruise ships commonly seek anchorages in near-pristine locations without docking facilities or designated ships anchorages where they potentially cause much greater habitat damage than in well-used commercial anchorages where the habitats are already destroyed (Davis and Broad, 2016). This lack of a standard approach by the shipping industry to assessing the impacts of anchoring on benthic habitats and the dearth of information came into sharp focus during the global COVID-19 pandemic (2020-2021) when many large ships (including cruise ships) were forced to seek safe anchorages outside congested ports for many months (Davis et al., 2022; Small and Oxenford, 2022; Tinsley, 2021; Watson et al., 2022). The cruise ship industry was the most impacted shipping sector during the COVID-19 pandemic as the entire industry shut down in March 2020. This meant that many cruise ships anchored whilst out of work in places such as Barbados due to port congestion (EMSA, 2021).
Nowadays, managers of sensitive tropical habitats, especially coral reefs, are facing a myriad of anthropogenic stressors that are causing global declines in these valuable ecosystems (Hughes et al., 2017; Mumby et al., 2014; Souter et al., 2021). The sources of many of these stressors are global (e.g. warming sea water temperatures, increasing frequency of dangerous storms, spread of invasive species) and thus very hard or impossible to manage at the local level. However, anchoring can be considered a local stressor with tangible management solutions that can be applied by reef managers to reduce some of the pressures to which these valuable habitats are exposed. Significant reduction in anchor damage associated with recreational vessels has been reported by several studies. The British Virgin Islands saw a reduction in anchoring on coral rich habitats after the installation of mooring buoys (Forrester, 2020), and in Australia after the introduction of ‘no-anchor’ zones in coral reef areas at 4–12 m depth (Beeden et al., 2014) and use of ‘screw’ moorings in seagrass in areas 3–6 m deep (Beeden et al., 2014; Demers et al., 2013; Forrester, 2020). However, managing the anchoring of ocean-going cruise ships, to mitigate habitat damage is more complex. This is because foreign vessels have a ‘right to anchor’ in the territorial waters of any nation under UNCLOS (Davis et al., 2016) and especially when globally or regionally significant events (e.g. pandemics, shut down or blockage of key shipping routes, major storms, war) can change the schedules or destinations and behaviour of the cruise industry at short notice. The general dearth of information regarding cruise ship anchoring damage to sensitive tropical habitats (Broad et al., 2020; Davis et al., 2016; Mason et al., 2023; Watson et al., 2022) is a constraint for effective management. This knowledge gap is exacerbated, particularly in Caribbean small island developing states (SIDS) with high cruise ship visitation rates, by the lack of a standardised low-cost protocol to monitor anchoring and behaviour of cruise ships at anchor.
In this study, we used a unique opportunity arising from multiple cruise ships being permitted to anchor in coral-rich Barbadian waters during the first six months of the COVID-19 pandemic (Small and Oxenford, 2022) to test a low-cost approach with high spatial and temporal resolution data to monitor cruise ship anchoring events, derive the anchoring footprint and estimate potential structural damage to coral rich habitat in Barbados from cumulative anchoring events.
2 Methods
For this study, we focus on ocean-going cruise ships (classified as ‘passenger ships’) in Barbados’ coastal waters, and use data and information that is free of charge. Our approach makes use of the global International Maritime Organization (IMO) requirement for all passenger vessels to carry an automatic identification systems (AIS) transponder that continuously transmits position data, identity and navigational status of the vessel, making it a good tool to monitor anchoring events (Deter et al., 2017). We accessed AIS data through MarineTraffic1, an open-access web-based platform providing, via their ‘live map’, high resolution position data (GPS locations in near real-time transmitted every 2 seconds to 3 minutes). These data show all ships’ movements (as route and speed), and their navigational status (as ‘underway using engine’, ‘at anchor’, ‘not under command’, ‘moored’ and ‘restricted manoeuvrability’) whilst in coastal waters. Movement data are also shown over the previous 24 hr.
2.1 Descriptive vessel data
Descriptive data on the selected cruise ships including vessel size (length, width, gross tonnage and draught) were downloaded from the MarineTraffic and Scheepvaartwest2 websites. Additional information on the length of the anchor chain carried and number of passenger decks were obtained for some cruise ships from the Scheepvaartwest and Cruise Deck Plans3 websites, and for the smaller vessels from their own websites.
2.2 High-resolution anchoring footprint
In this study we consider a polygon incorporating the location of the anchor drop and vessel swing whilst at anchor as the ‘anchoring footprint’ (defined by Deter et al., 2017 as the ‘anchoring zone’).
The timing and location of anchoring events by any vessel can be approximated by monitoring its AIS position data and the navigational status (i.e. when a vessel changes its status to or from ‘at anchor’). However, the navigational status is manually set by the ship’s crew and the AIS position data indicates the location of the ship’s hull (i.e. the location of the AIS transponder on the ship’s bridge which, in the case of cruise ships, is located near the bow). As such, the ship’s location when the navigation status is manually changed to ‘at anchor’ is unlikely to reflect the actual location of the anchor drop. Further, this cannot be estimated from the location of the vessel at anchor without knowing the amount of anchor chain deployed, and other factors such as water depth and wind and current direction and strength. To obtain the location of the anchor drop with much greater precision, we examined the cruise ship’s past track immediately prior to changing their status to ‘at anchor’, since a ship will sharply reduce speed (to < 1 knot) prior to dropping anchor. The vessel then falls back immediately after, as it drags the anchor backwards to set it, and then pays out the chain. The approximate length of chain deployed on the seafloor was then measured from the putative anchor drop location to the anchored vessel location using the latitude and longitude position of each, obtained by hovering the cursor over each point of interest on the screen image of the MarineTraffic interface.
In our study we used this precision method to determine the anchor chain length for a subset of anchoring events by a range of vessel sizes (Supplementary Table 1) and subsequently used the mid-range value of 250 m as a proxy of chain length for each event in our study where we lacked more detailed information on the anchor location, but had coordinates of the swing pattern.
Vessel swing at anchor was monitored once daily using the vessel track data for the previous 24 hrs. The latitude and longitude coordinates of the vessel swing and anchor location were then imported into ArcGIS Pro and ArcMap (ESRI, USA) to reveal the ‘anchoring footprint’ (Figure 1). The area of the anchoring footprint and swing angle were calculated using the ‘measure’ and COGO (Coordinate Geometry) tools respectively (Figure 1). For anchoring events longer than 24 hrs, a cumulative anchor footprint was obtained by combining data for each 24 hr period. The area of this footprint informed the maximum area of potential direct habitat damage for each anchoring event.
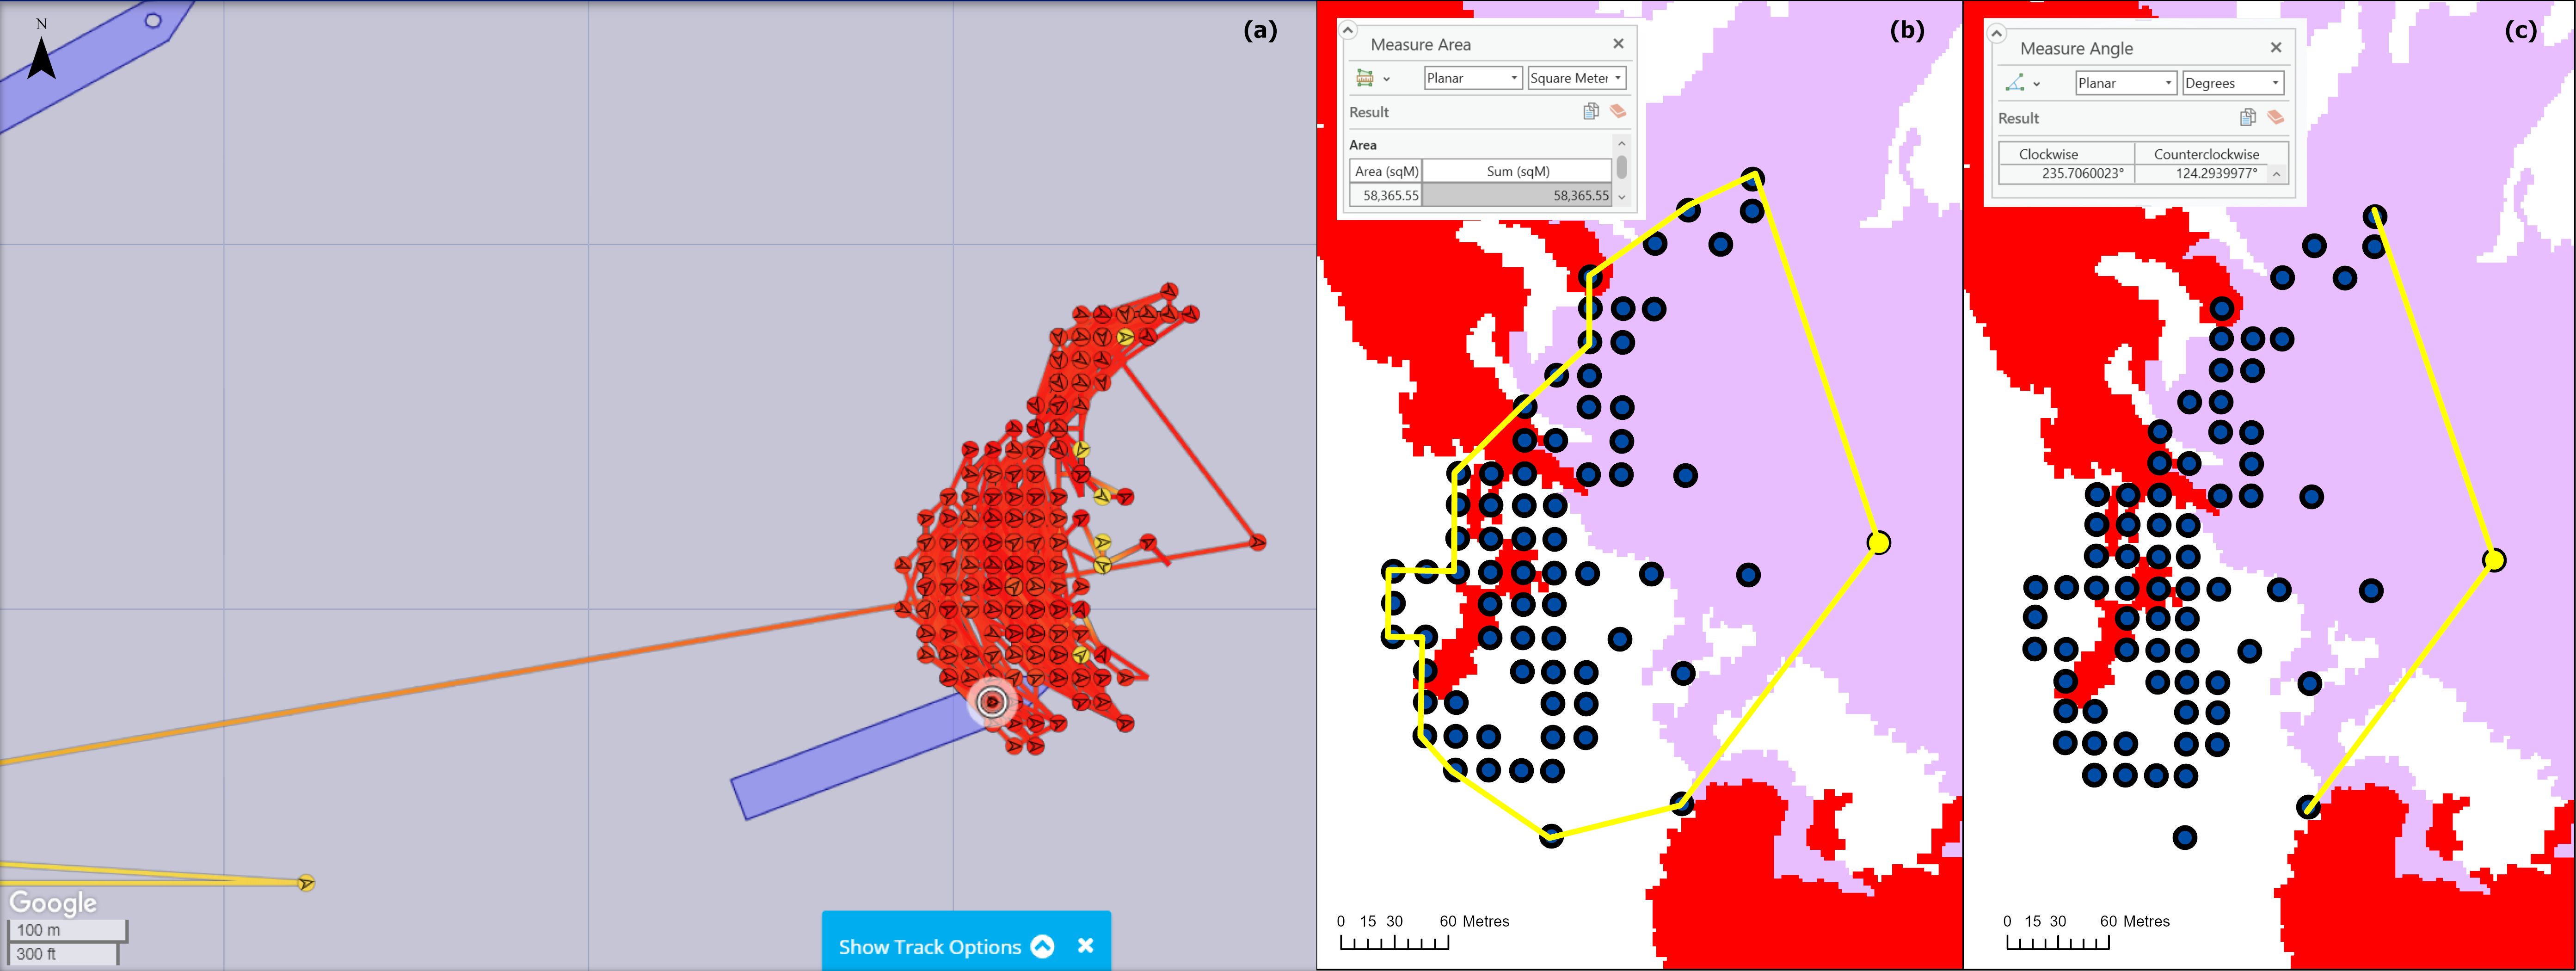
Figure 1. Mapping the anchoring footprint of a cruise ship in Carlisle Bay, Barbados. (a) shows the MarineTraffic visualisation of vessel movements while at anchor (red track and points). (b) shows the hourly positions (blue circles) plotted on a benthic habitat map in ArcGIS Pro. Yellow circle represents presumed anchor location, yellow polygon indicates the anchoring footprint and inset box shows the polygon area calculated with the Measure tool. Coloured areas (mauve and red) represent coral-rich habitat. (c) shows the swing arc of the anchored ship and inset box shows the calculated angle using the Measure tool.
2.3 Validation of anchor location, chain length and habitat damage
Our interpretation of the ship’s track immediately prior to showing an ‘at anchor’ status to determine the precise anchor drop location and length of chain deployed was validated by taking surface and bottom measurements via SCUBA on a cruise ship at anchor. This involved (1) diving on the ‘live’ anchor chain taking video footage along the entire length, measuring and then counting chain links from under the ship to the anchor, and (2) taking handheld GPS coordinates under the anchor hawsehole of the cruise ship and over the anchor as indicated by divers’ surface marker.
To confirm and characterise habitat damage occurring in the derived anchoring footprint, we undertook qualitative coral reef damage assessments of several cruise ship anchoring footprints using SCUBA gear. Habitat damage was recorded by an underwater camera (as still photographs and video footage) and approximate distances (to nearest 5 m) were measured by counting standardised fin kicks of known length for each diver.
2.4 Estimating coral-rich habitat damage from anchored cruise ships
To estimate the maximum potential damage to coral-rich habitats by cruise ship anchoring events in Barbados, we used ArcMap to overlay the derived anchoring footprints (polygons) onto a benthic habitat map for Barbados created previously by Baldwin et al. (2019) using high resolution satellite images and ground-truthing in 2015. We also examined the anchoring depths to the nearest 10 m by overlaying the anchor coordinates on a bathymetric contour map for Barbados created previously from a bathymetric surface gridded from a LiDAR survey conducted by Coastal Zone Management Unit in 1999.
To reduce the time required for monitoring pre-anchoring tracks of every cruise ship, we used position data every 24 hrs to obtain the swing pattern at anchor from which we could estimate the anchor location, informed by the validated chain length. Further, we derived anchoring footprints for different size categories of cruise ship. For this we selected eight different anchoring events of 3–5 days duration for cruise ships belonging to three distinct size categories (three small: < 45,000 GT; two medium: 45,000-105,000 GT; three large > 105,000 GT, Supplementary Table 1), to obtain an estimate of the typical swing of the vessel and mean area of the anchoring footprint for each vessel size category. This was then used as a proxy of the maximum area of potential direct habitat damage caused by each vessel size category.
All derived anchoring footprints were then overlaid on the benthic habitat map using the mean location of the anchored vessel as a guide, to determine the area of potential damage to sensitive coral-rich habitats (in this case, hard coral patch reef and hard coral framework reef) as they were the focus of our damage assessment due to the importance of coral reefs to the island (Schuhman et al., 2017). For cruise ships with anchoring footprints on, or partially on, less sensitive habitats (i.e. deep sand) the Intersect Geoprocessing tool in ArcGIS Pro was used to select only the footprint areas falling on coral-rich habitat. Further, when anchoring events by the same or different vessels were in close proximity to one another so that the anchoring footprints overlapped, we drew a polygon around the clustered anchoring footprints to calculate the area of likely damage and thus avoid overestimating the total area of reef damaged.
3 Results
Using the MarineTraffic AIS data we recorded the arrival of 43 cruise ships in the coastal waters of Barbados over the first 6-months of the COVID-19 pandemic (1 March – 1 September 2020) of which 65% anchored, some of them multiple times (Supplementary Table 1) resulting in 132 anchoring events (Figure 2).
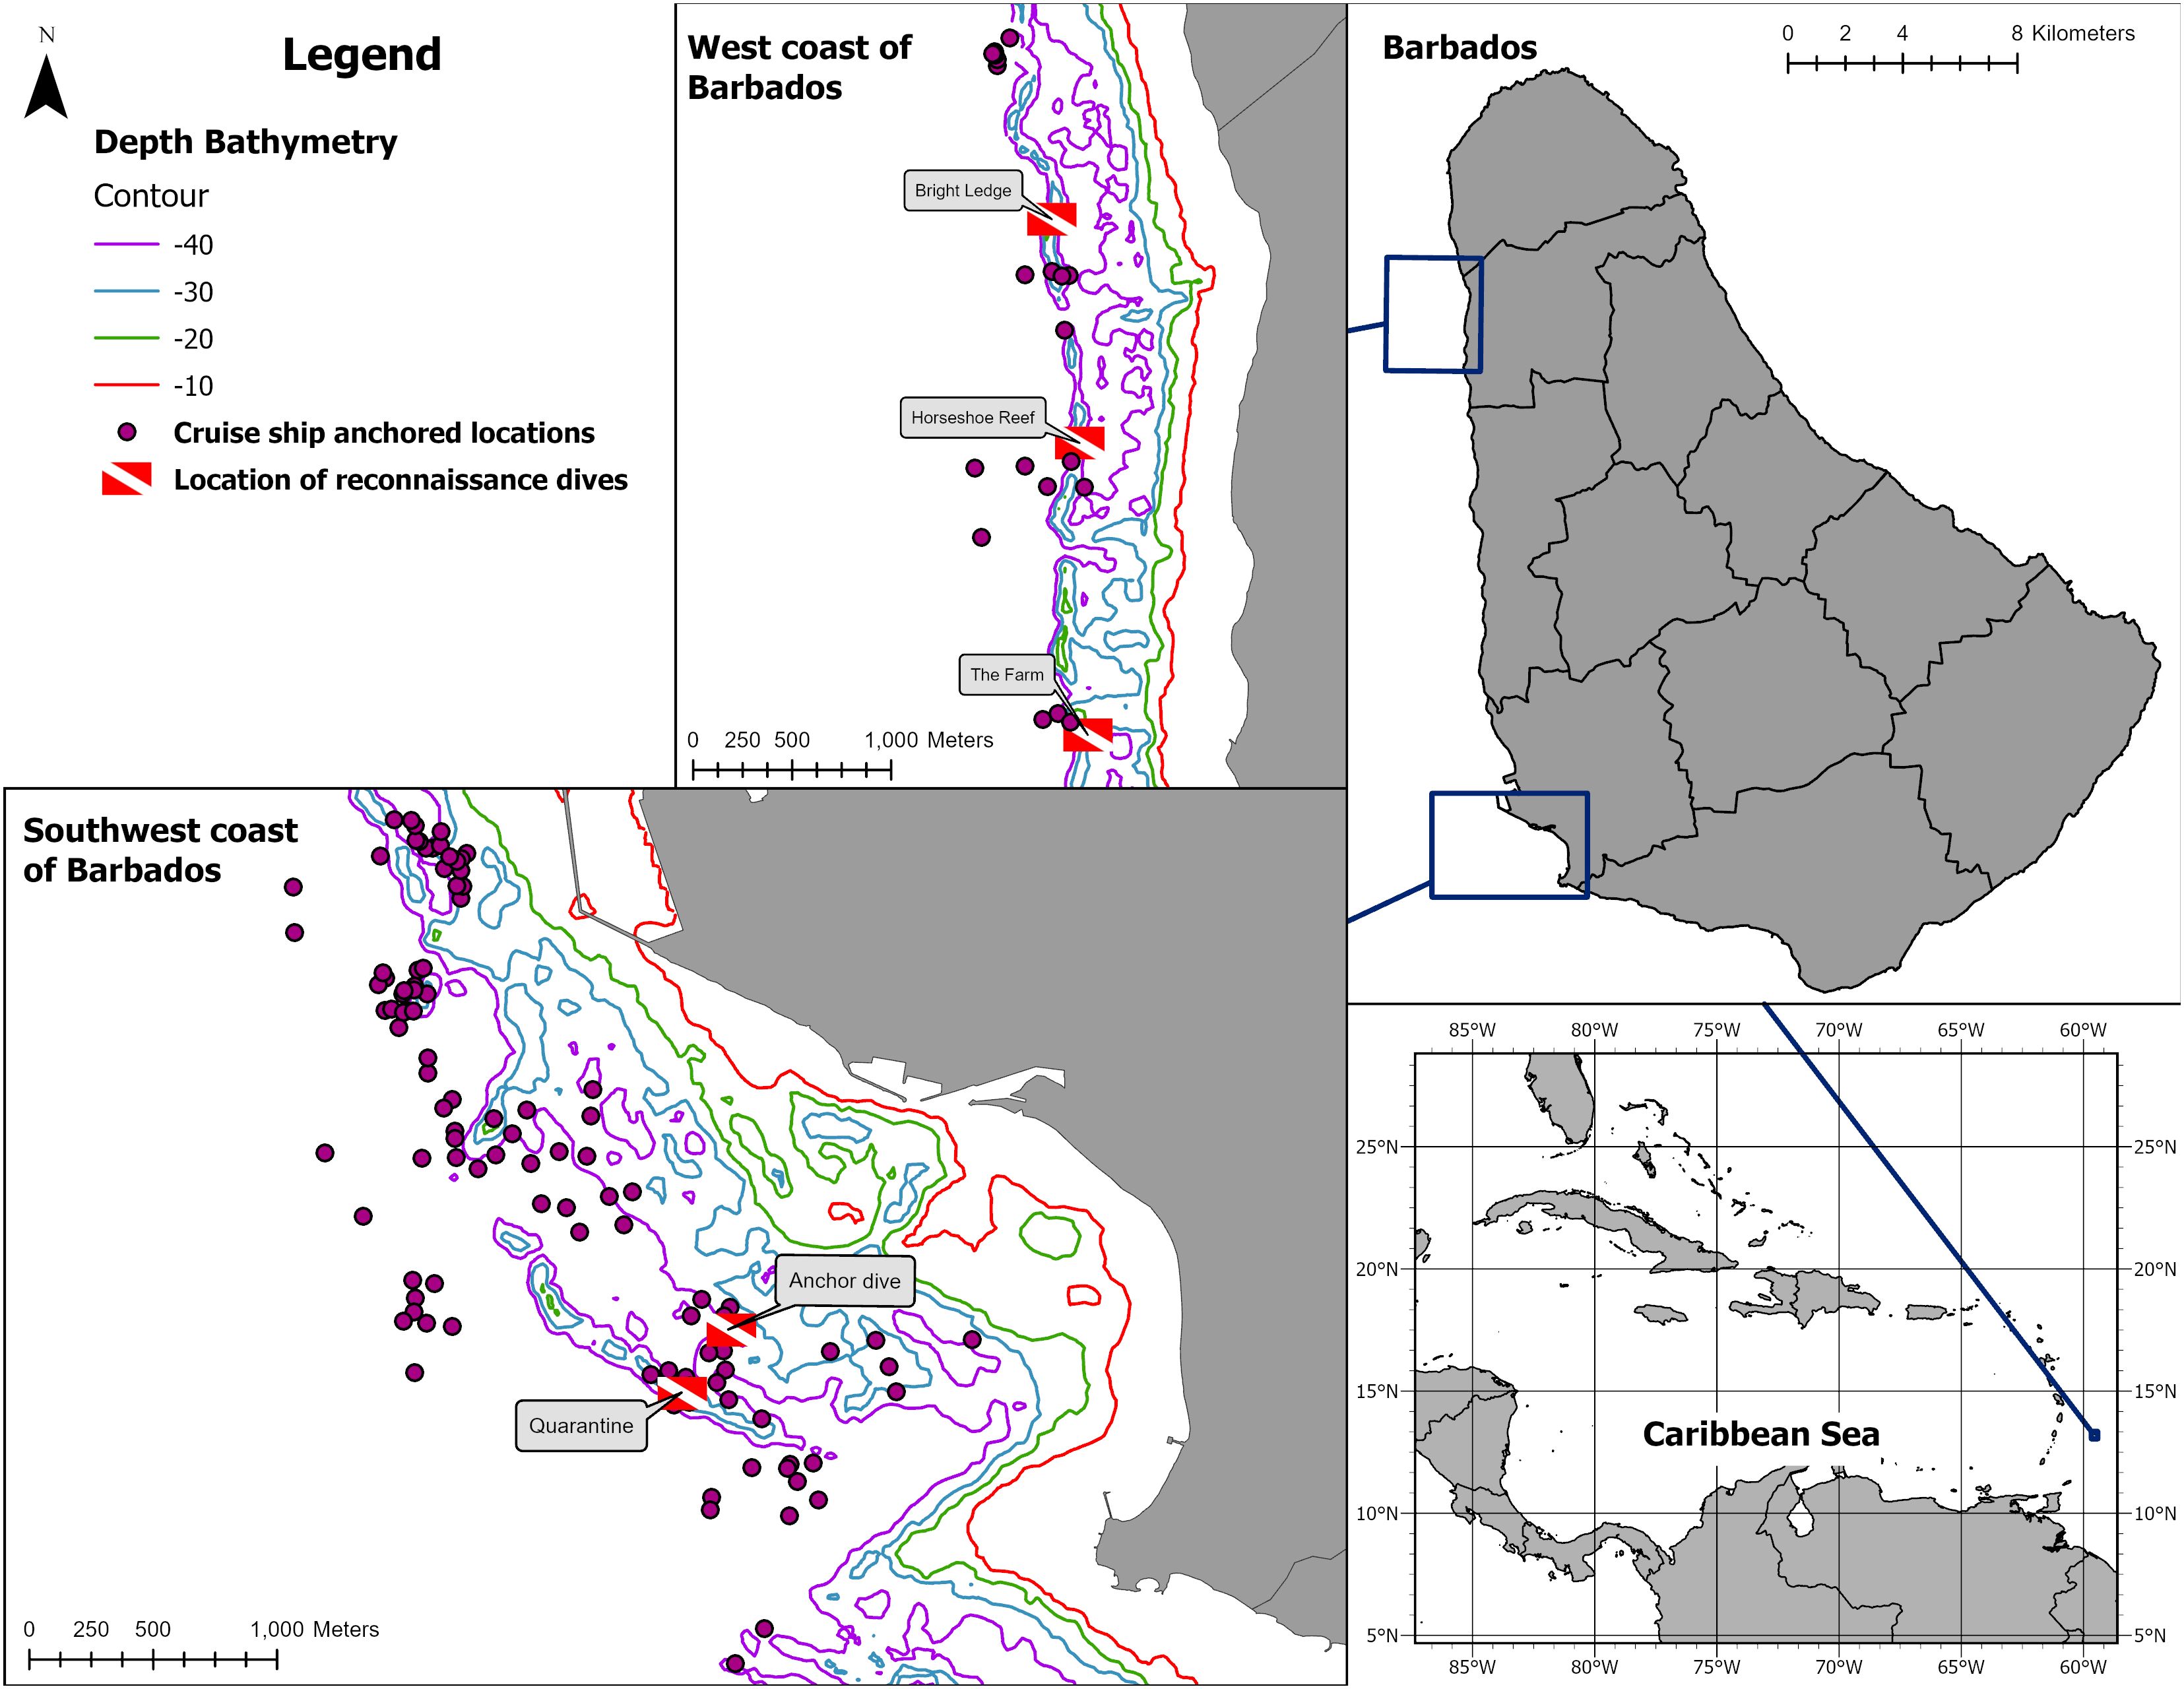
Figure 2. Mean location of 132 anchored cruise ship events that occurred off the southwest and west coasts of the Eastern Caribbean island of Barbados.
3.1 Validation of derived high resolution anchoring footprints
It is expected that the size of the anchoring footprint will be determined by many factors including ship design, length of time at anchor, wind speed and direction, bathymetry of the anchoring ground etc. Monitoring the high temporal resolution ships track data for approximately 10 minutes before and after cruise ships manually changed their navigational status to ‘at anchor’ provided a high spatial resolution estimate of the initial anchor drop location (Figure 3a). Monitoring the location data every 24 hrs allowed accurate visualisation of the vessel movement at anchor. For some, especially those anchored for many days under changing wind conditions that resulted in anchor drags or redeployments that were not recorded as a change in AIS navigational status, it was more difficult to interpret, particularly because of the density and overlap of position datapoints that occurs over time. In these cases, we used the 24 hr track visualisations to detect the positions of likely anchor drags and re-anchoring events to further inform underwater surveys of where to look for additional habitat damage within a composite anchoring footprint (Figure 3b).
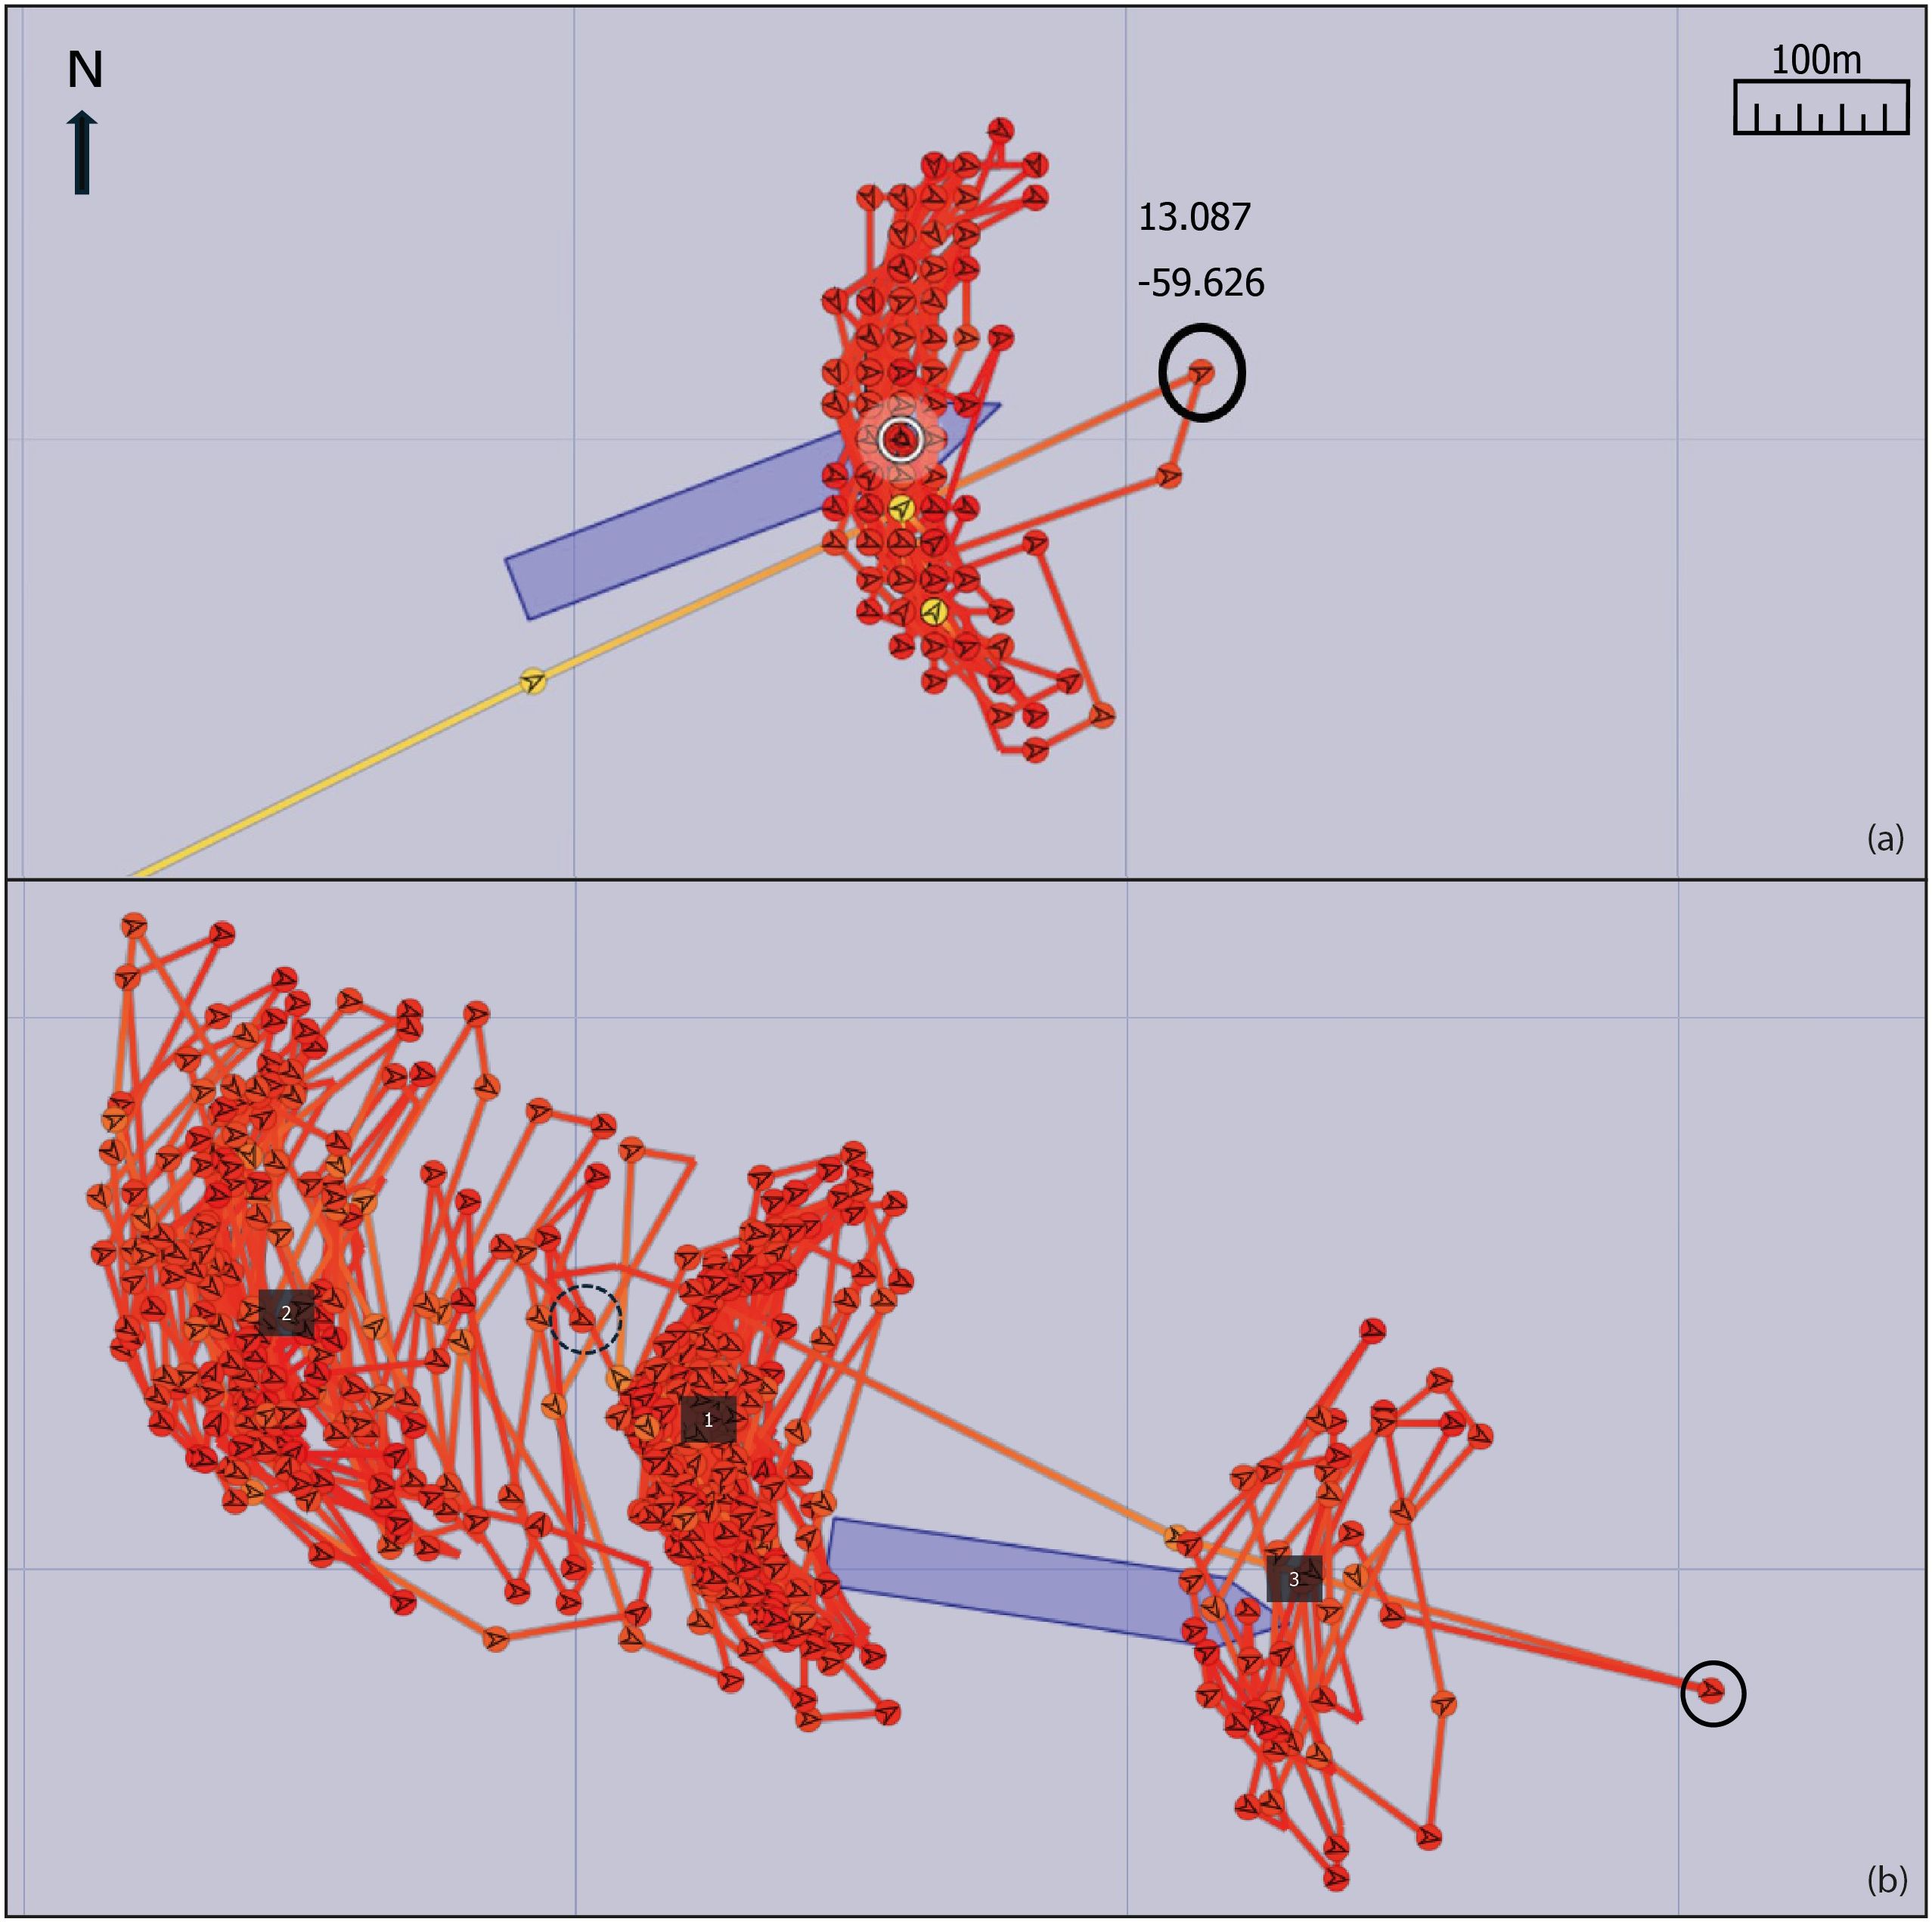
Figure 3. Example screen shots adapted from the MarineTraffic app showing the high resolution movements of cruise ship anchoring events. Hull location is visualised by mauve rectangle. (a) shows a 24 hr track including the moment of the anchor drop. Yellow line shows the vessel approaching from the southwest at approximately 8 knots, slowing to 0 knots (line changes to red) and then falling back and subsequently swinging back and forth 200 m downwind of the presumed anchor drop location (black circle). The coordinates of the presumed anchor location are shown. (b) shows more complex vessel movement over a period of 72 hr at anchor. Swing track at 1 indicates movement at anchor over 24 hr. Swing track at 2 shows the swing pattern gradually moving downwind by several 100 m over the following day, likely indicating that the anchor was dragging. Swing pattern at 3 shows that the vessel hauled anchor (from the area show by the dashed black circle) on the third day and reset it approximately 800 m upwind (as shown by the black circle).
A reconnaissance dive on the ‘live’ anchor of a medium sized cruise ship (279 m long, 78,717 GT) allowed us to confirm the location of the anchor drop (within 10 m of the estimated location based on the AIS method), size and length of the anchor chain and witness active scouring of the substrate (Figure 4). The chain comprised stud-links of 64 mm diameter with each link measuring 400 mm in length giving an industry standard weight of 25 kg/link and 94 kg/m (Ramos, 2025). In this validation exercise 200 m of chain (weighing an estimated 18.8 mt) had been deployed in an anchoring depth of 24 m, giving a chain length to depth ratio of 1:8.3. Both field measurements of the chain length and estimates from the AIS data were in close agreement (within 5 m of each other). The ship was actively swinging in an arc directly downwind as expected and dragging the chain across the substrate, releasing a plume of sediment, fragmenting coral colonies and uprooting gorgonians and sponges (Figure 4). A wide swath of newly scraped substrate, was also clearly visible directly in front of the anchor where it had been dragged backwards to set it after the initial drop (Figure 4d). The fresh scars in the substrate and new breaks on coral colonies were very obvious based on their white coloration and clearly caused by the anchoring event based on their location and orientation.
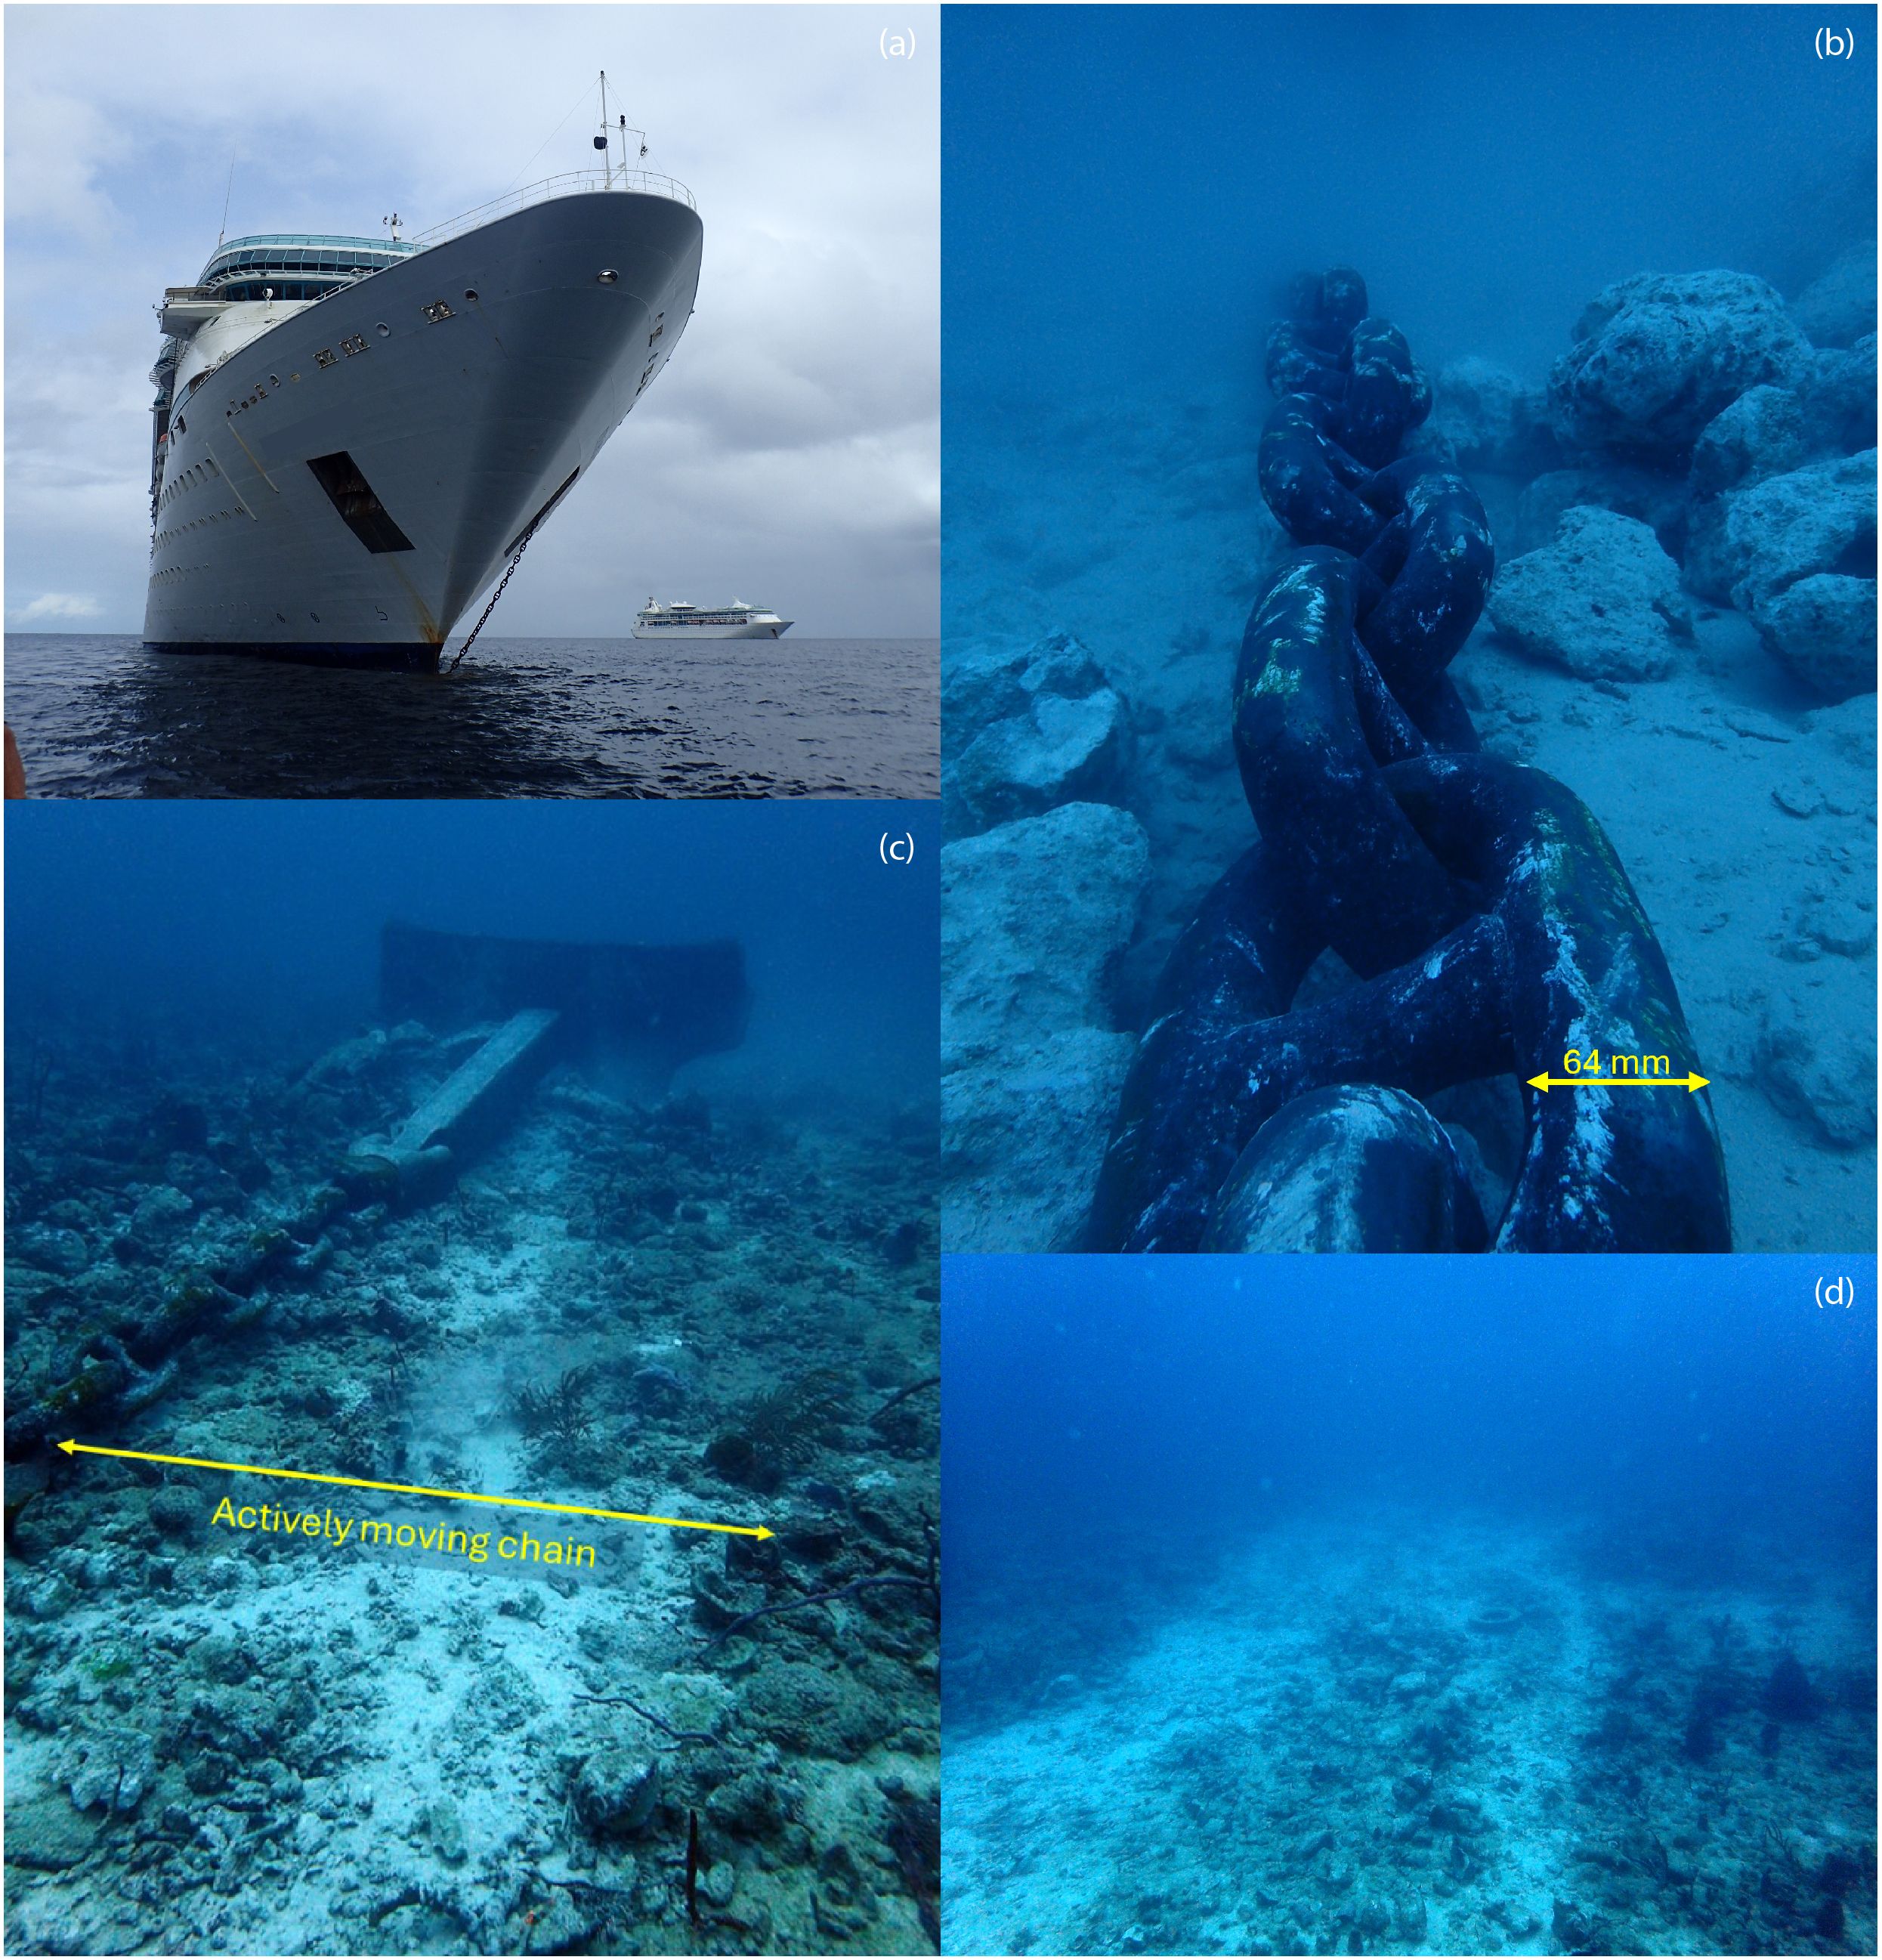
Figure 4. Validation of anchor position, length of chain deployed and active scouring on ‘live’ cruise ship anchor. Images show (a) approach to anchored vessel for dropping divers and taking a GPS location, (b) measuring stud links and filming the length of anchor chain, (c) set anchor with large pile of coral rubble and actively moving chain causing scour, (d) anchor drag damage as seen looking from the set anchor towards the location of the initial drop. Photo credits: Annabel Cox and Hazel Oxenford.
We were able to demonstrate that the mean size of the anchoring footprint differed among different sized cruise ships in our study (Table 1). Generally, the area of anchor impact increased with vessel class size as was expected with the smaller vessels covering an approximate mean surface area of 14,349 m2, whilst the mega cruise ships, which include some of the largest ships in the world, covered almost three times that area (> 40,000 m2). Of note was that the cumulative area of coral rich habitat affected was greater for medium sized vessels than for the largest sized vessels, despite more anchoring events by the latter (Table 1). This is because the larger vessels tended to anchor in deep sand away from the coral reefs.

Table 1. Mean anchoring footprints, maximum potential area of substrate affected and estimated area of coral-rich habitat damage caused by cruise ships anchoring in Barbados between 1 March – 1 September 2020, shown by vessel size category.
3.2 Confirming habitat damage in derived anchoring footprints
Qualitative visual survey using SCUBA to examine habitat damage (chosen as a rapid and cost effective method) in six of the derived cruise ship anchoring footprints, revealed that the presumed locations of the anchor drops were accurate and confirmed that structural reef damage had occurred in these relatively deep (25–35 m) highly rugose reefs where storm damage is minimal and anchoring does not normally occur (Figure 5). High resolution coordinates of the anchor drop location and the derived anchoring footprint was very useful in helping to find the damaged area underwater and interpret the pattern and extent of habitat destruction observed. Qualitative surveys at some sites, where the anchor had been dropped and set directly on reef, revealed clear evidence of the structural damage caused by the massive anchor itself as well as a wide swath (tens of metres in length based on fin kicks) of cleared reef, upturned coral colonies, gorgonians and sponges, and broken coral rubble piles where it had been dragged backwards to set, as seen in Figure 4d. Large areas of physical damage surrounded by undamaged reef were obvious and scouring damage was manifested by flattened areas and long scrapes across the coral rock where the anchor chain had dragged back and forth over the reef as the ship swung at anchor in an arc as much as 180° as illustrated in Figure 5.
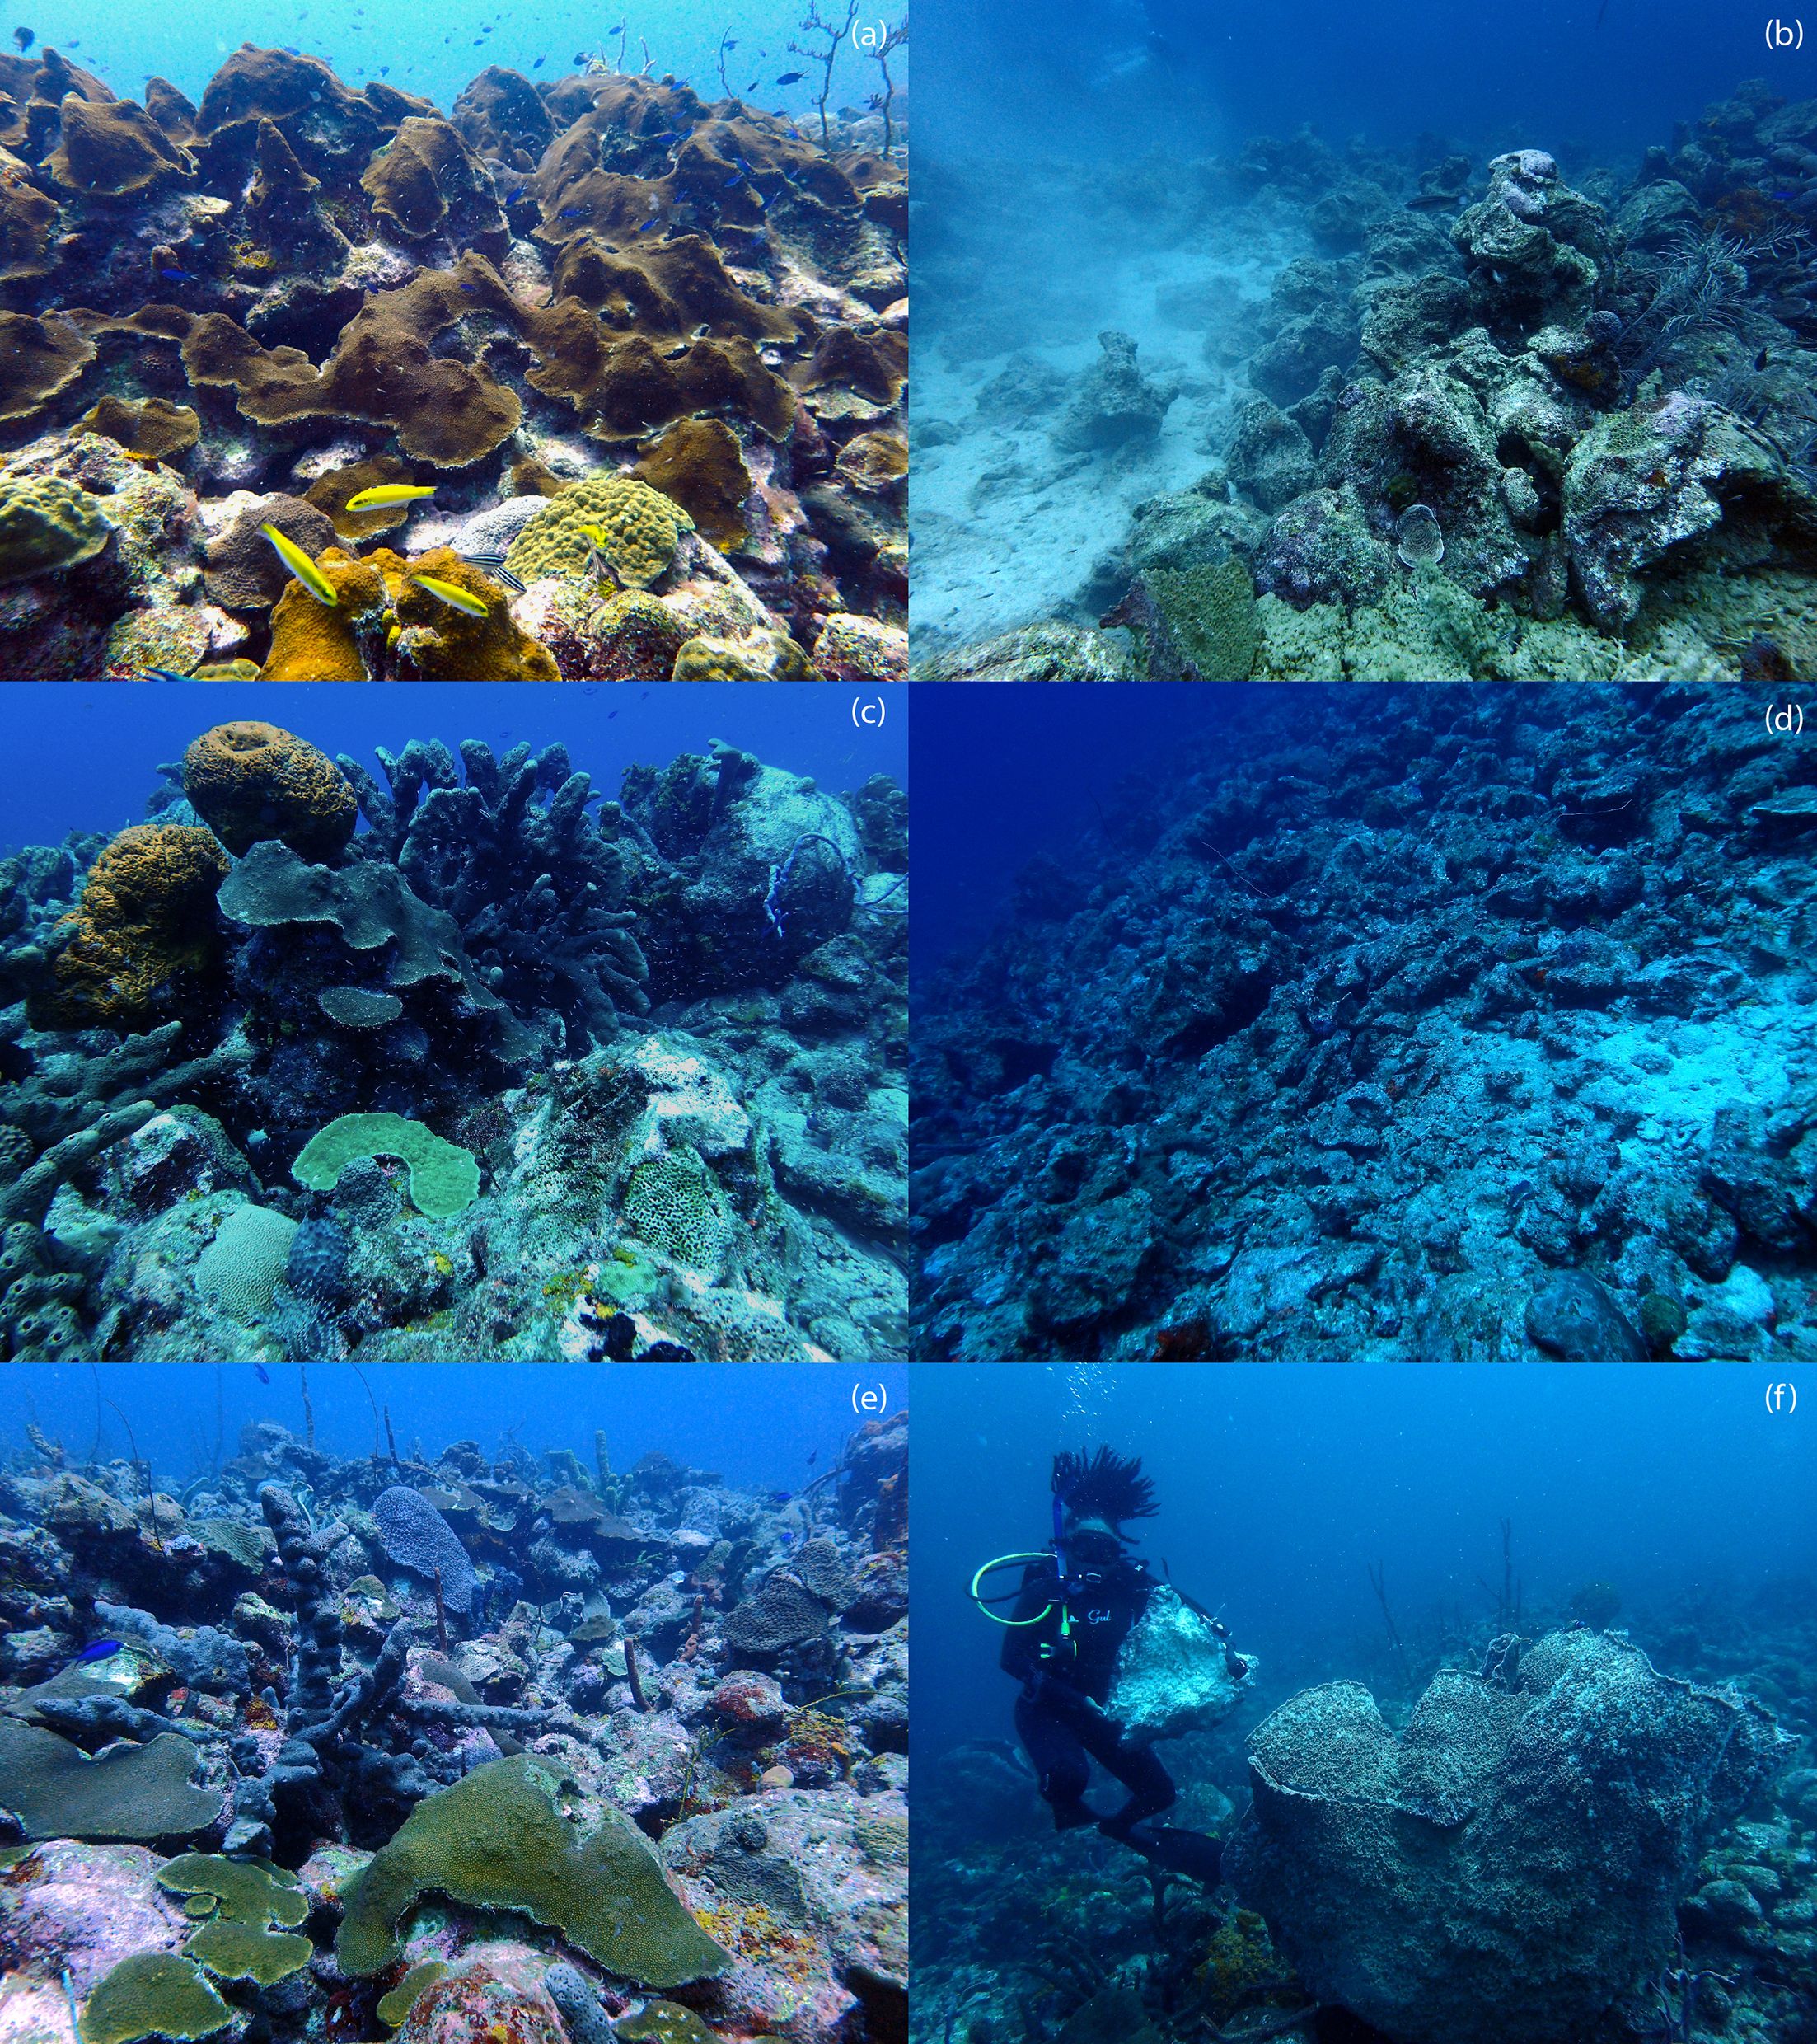
Figure 5. Photographs taken by SCUBA divers on three west coast bank reef sites in Barbados, showing adjacent pristine reef compared to coral reef damage caused by cruise ships’ anchor chain dragging across the reef. (a, c, e) show the high coral cover, large sponges and high architectural complexity of the undamaged area outside the anchor footprints at the Farm Reef, Bright Ledge Reef and Horseshoe Reef (respectively); (b, d) show scars in the reef where corals and other biota have been cleared by the anchor or chain; (f) shows broken piece of barrel sponge due to movement of the anchor chain. Photo credits: Hazel Oxenford.
3.3 Mapping footprints to assess potential habitat damage
When all of the anchoring events by cruise ships in Barbados between 1 March and 1 September 2020 were considered, the derived footprints had a cumulative area of 3.80 km2 (Table 1). However, overlaying the anchoring footprints on the marine habitat map indicated that not all anchoring events occurred on highly sensitive coral-rich habitat (Figure 6). A total of 19.7% of anchoring events occurred in deep sand areas and 13.6% occurred on the Quarantine bank reef within the Quarantine Anchorage, a historically designated anchoring site which has been reduced to rubble and is devoid of living coral reef biota due to the decades of anchoring by ships visiting Barbados. Furthermore, there was some overlap of anchoring footprints. As such, the maximum area of potential ‘new’ damage to sensitive coral-rich habitat was calculated as 0.18 km2.
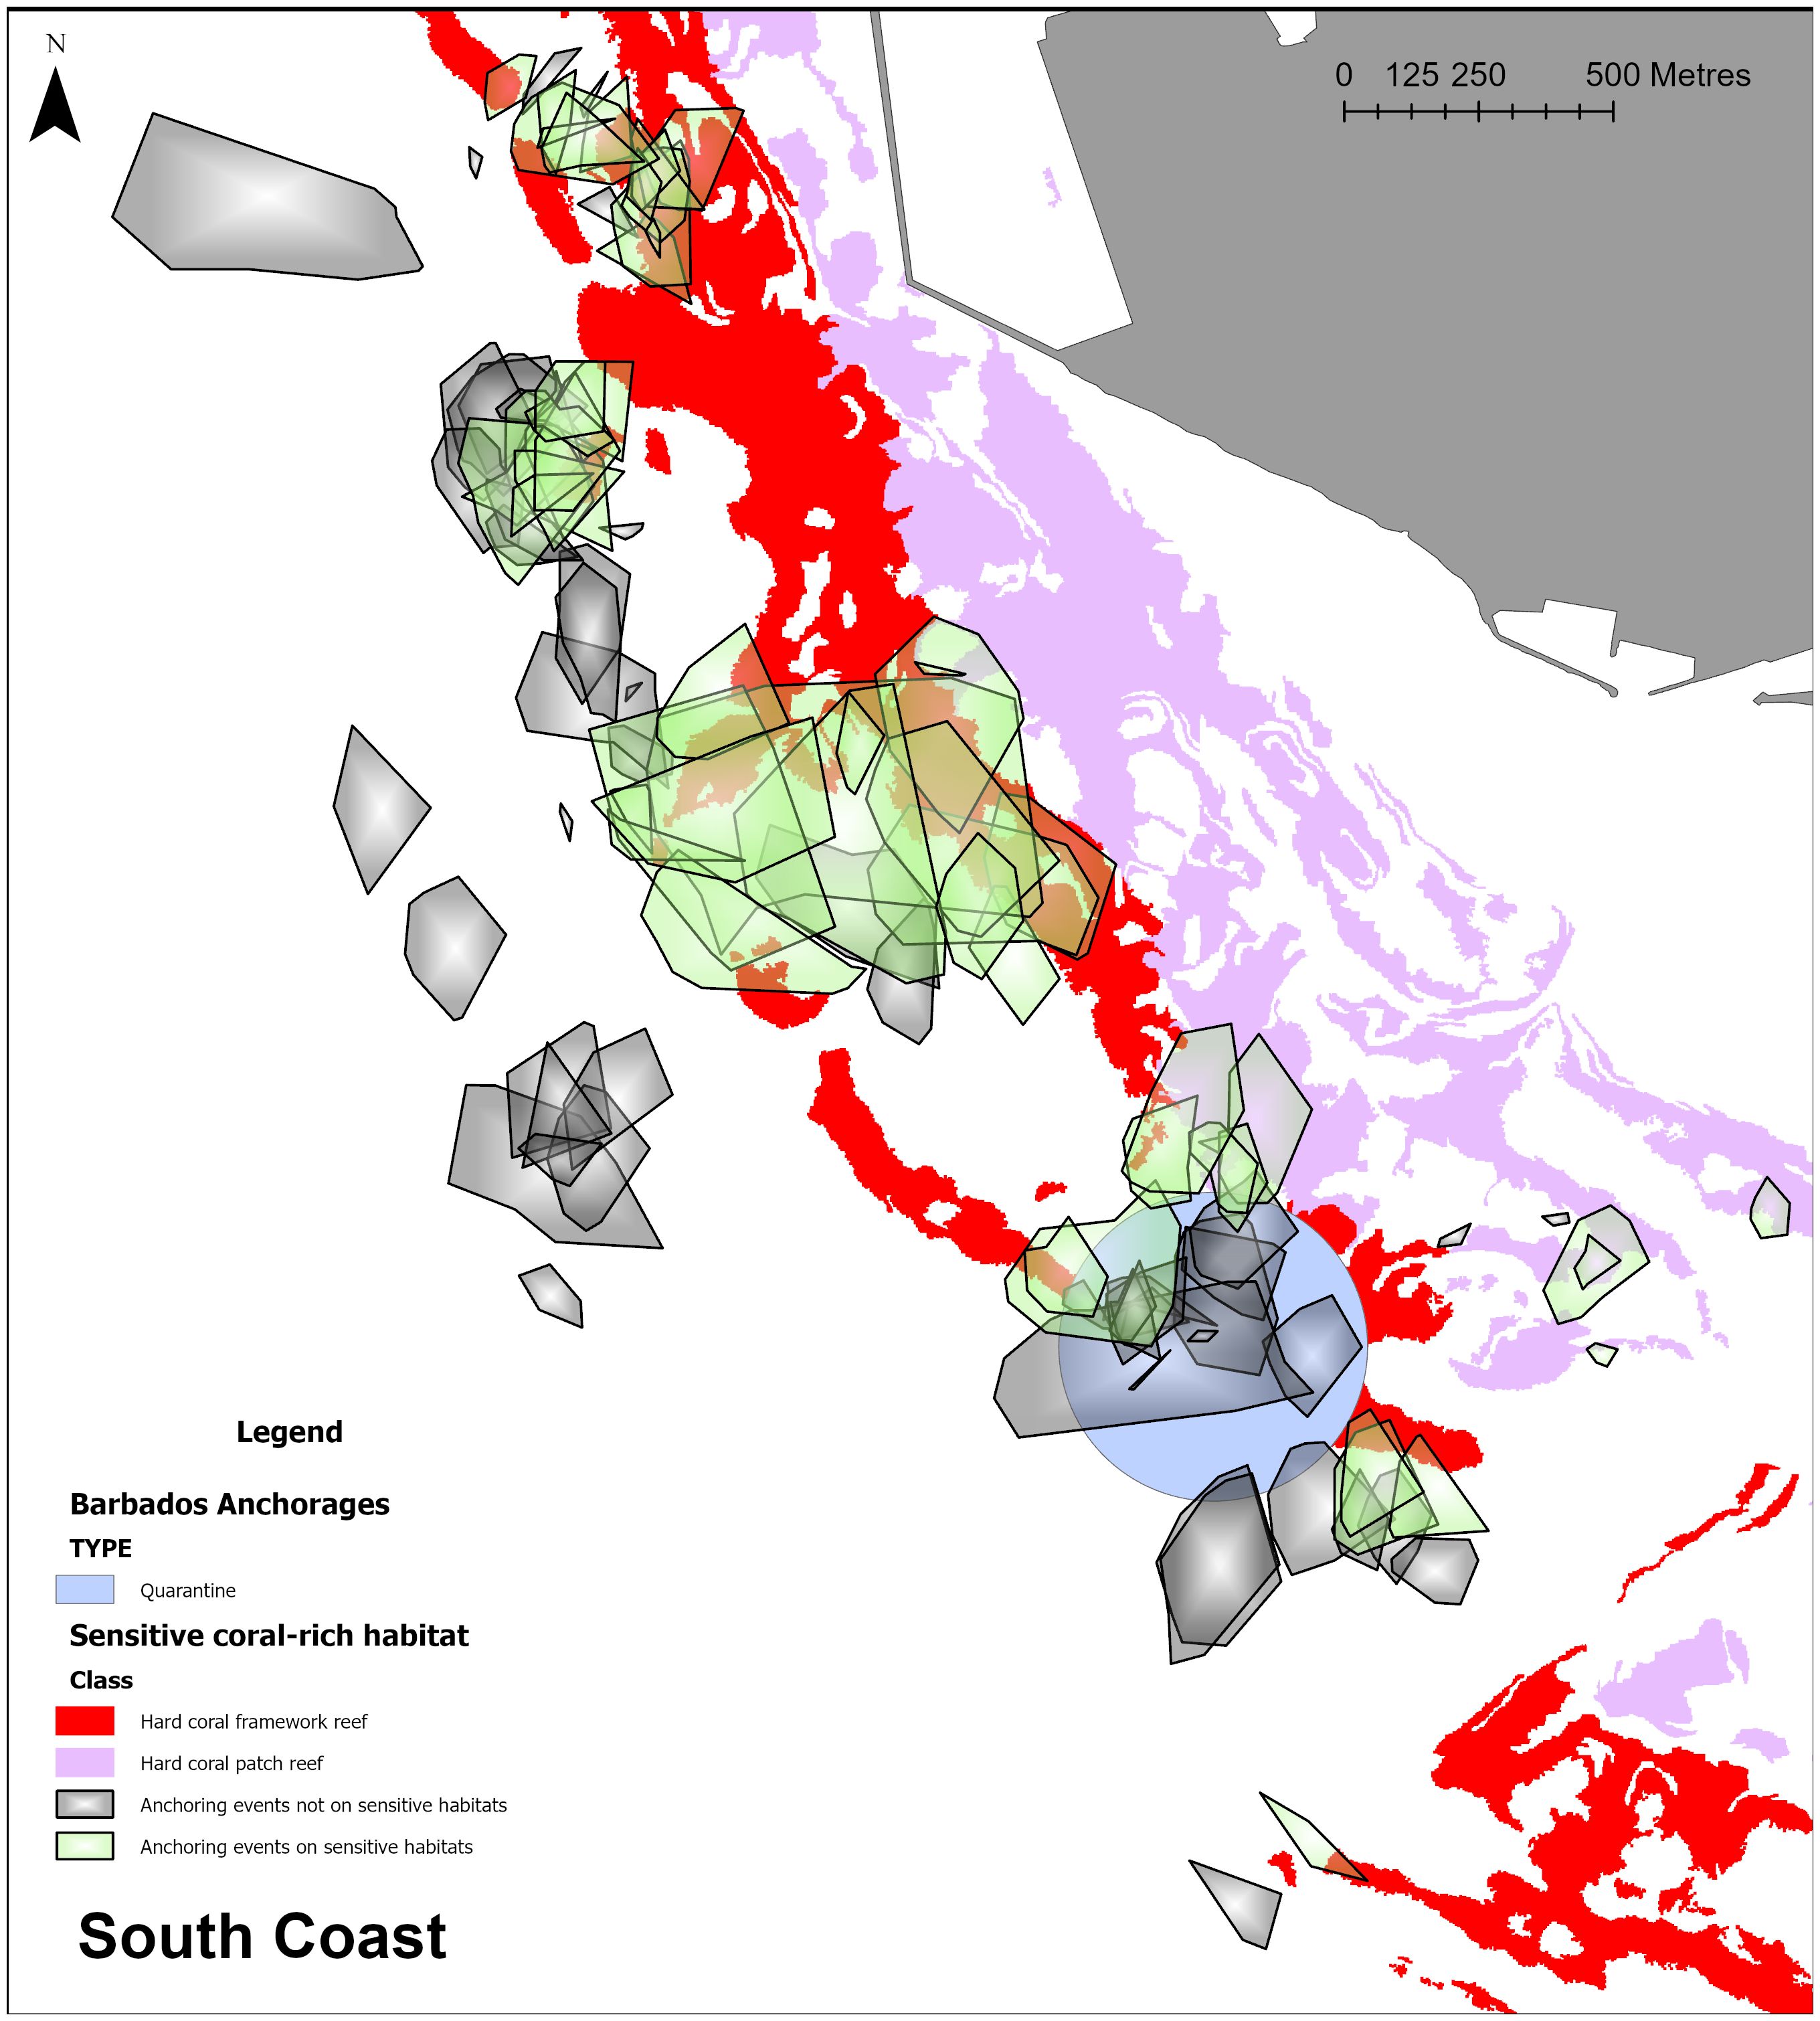
Figure 6. Example of derived cruise ship anchoring footprints overlaid on the benthic habitat map off the south coast of Barbados.
4 Discussion
In this study we validate the use of a novel low-cost method for monitoring cruise ship anchoring behaviour using the freely accessible AIS data from the MarineTraffic live map. We derive high resolution anchoring footprints incorporating the location of the anchor and swing of the vessel for multiple cruise ships. We demonstrate that when anchored with a single anchor and chain deployed from one side of the bow, cruise ships with their shallow draft and multiple passenger decks will invariably be blown off to one side by wind pressure on the hull and superstructure. Further, when the ship reaches the full extent of the anchor chain that it can pull over the substrate, it will naturally tack and drag the chain back as it swings in an arc. As noted by others, this swing pattern continues back and forth (Davis et al., 2016; Deter et al., 2017), with the degree of swing determined by the ship’s size and windage, wind speed and amount of chain inter alia (Inoue et al., 2002). Szymoński (2019) noted that the swing pattern is particularly exaggerated in the case of large commercial vessels, in line with our own findings with cruise ships swinging close to 180 degrees even in a steady wind. We were also able to determine that cruise ships anchoring in Barbados’ coastal waters typically deploy in excess of 200 m of chain, using a chain length to depth ratio of greater than 1:7.
Adoption of this methodology to derive high resolution, georeferenced anchoring footprints could greatly improve efficiency and ease of interpretation of detailed underwater surveys to assess habitat damage from individual anchoring events, by focusing effort on the exact area of predicted impacts. Such surveys would typically be required under national legislation when claiming punitive damages and seeking compensation from unauthorised anchoring events, or for consideration of habitat restoration work. Further, the individual anchoring footprints of different sized cruise ships derived in this study, plus the hull length of up to 339 m, demonstrate the large space that would be required to safely anchor typical ocean-going cruise ships in an anchorage to avoid collision with other vessels or installations. This is of particular relevance for cruise ship destinations, such as Barbados and other Caribbean SIDS with busy ports and small designated anchorages. For example, the designated ships anchorage for Bridgetown, Barbados (considered an international commercial shipping hub for the Eastern Caribbean and a major port of entry for cruise ships4; Barbados Port Inc., 2022) is a circular area with a radius of just 300 m (Figure 6).
We also demonstrate the use of this method for mapping multiple anchoring events, providing information on the spatial and temporal distribution of anchoring activity relative to sensitive habitats, similar to the application of Deter et al. (2017) in their assessment of anchoring pressure along the French Mediterranean coastline. However, whereas Deter et al. (2017) purchased archived data from MarineTraffic and examined anchoring events from all vessels carrying AIS transponders over several years, we used the freely accessible, near real time AIS data and focused specifically on cruise ships in a tropical coral reef environment in Barbados. Here we were able to overlay all of the anchoring footprints on a detailed habitat map to estimate the maximum potential damage to sensitive coral-rich habitat likely to be caused by the anchor drop and drag and scouring by the moving chain, as reported for other large ship anchoring events (e.g. Broad et al., 2020; Broad et al., 2023; Tinsley, 2021; Watson et al., 2022).
We acknowledge that the area of actual damage on the sea floor will likely be less than our derived anchoring footprint, and will be determined by the habitat type, how much the anchor is dragged to set it, the microscale bathymetry and how easily the chain moves as the ship swings inter alia. Nevertheless, a potential overestimate could be considered usefully conservative for marine managers with regard to the threat posed by anchoring these very large vessels, and the space that will be required when designating anchoring zones. This information is also appropriate for guiding policy decisions and the development of anchoring protocols designed to minimize risk of damage to sensitive habitats. As an example, results from this study highlighting the behaviour and potential damage to coral-rich habitats in Barbados posed by anchoring cruise ships during the COVID-19 pandemic precipitated policy action by the Government to prevent cruise ships from anchoring outside the designated Quarantine Anchorage area (Small and Oxenford, 2022). This stated policy was initiated in September 2020, and made further provisions to cover a case when the designated anchorage is unable to accommodate the number of cruise ships requesting permission to anchor. In these circumstances, cruise ships will now be required to hold their position without anchoring by using their Dynamic Positioning System, or be allowed to drift off the leeward (west) coast.
While this study monitored the anchoring behaviour of cruise ships, the methodology can also be applied to other vessel types that are required to carry AIS transponders i.e. ships > 300 GT engaged on international voyages, all cargo ships > 500 GT and all passenger ships regardless of size (IMO Convention for the Safety Of Life At Sea (SOLAS) Regulation V/19.2.4). The method is also useful for pleasure craft, particularly super-yachts, which typically have AIS transponders even though not mandated. The latter group are likely to be of particular interest due to the growing size of these pleasure craft fleets. For example, globally, the number and sizes of super-yachts ranging from 24 to 70 m in length have increased between 1997 and 2008, and the yachting tourism market continues to increase in the post COVID-19 period due to the impact of the pandemic on the cruise ship industry (Ajagunna and Casanova, 2022; Eijdenberg et al., 2022). The Caribbean, especially, is a major hub for cruise tourism with 50% of the global market tied to the region (CDB, 2018). Furthermore, yachting tourism and yacht racing is also highly popular in the Caribbean with Antigua alone attracting up to 500 yachts for their annual ‘Sailing Week’ event (Ajagunna and Casanova, 2022; Clegg et al., 2021; Walker et al., 2023).
Use of this methodology across a wider selection of vessels could help to improve marine space management by highlighting which areas and times are likely to have high anchoring activity and overcrowding of specific anchorages, making this methodology particularly important to marine protected area managers. The method is also highly suitable for future studies investigating relationships between the size of the anchoring footprint and vessel size/type, anchor chain length, wind conditions, length of anchoring period and habitat type inter alia. It is also suitable for guiding more quantitative approaches to measuring the actual habitat damage and recovery in the anchoring footprint.
Even though this methodology is a good way to calculate the area potentially affected by anchoring events, additional high spatial resolution habitat maps (such as those available in this study) are required for estimates of potential damage to sensitive habitats to inform policy and management action. Detailed habitat maps, however, are often lacking in many countries, and whilst open-source marine habitat maps exist, they are generally of low resolution and not useful for anchor management and damage assessment (Davis et al., 2022).
A particularly attractive aspect of this methodology, especially for agencies that may be understaffed and underfunded is that it is essentially desk-based, and whereas we used ArcGIS Pro and ArcMap for mapping, free mapping software such as QGIS can also be used. Even though actual habitat damage assessment requires field study, our results show that assumptions made about the anchor position and swing of the anchor chain are reliable. This suggests that in cases where SCUBA surveys or use of underwater remote sensing technology to quantify habitat damage are not an option, using the desk-based assessment alone can still be sufficient to make reasonable assumptions about the extent of the anchoring footprint and potential threat to benthic habitats. A further advantage of using near real time AIS data is that they are readily available from MarineTraffic free of charge. However, when attempting to cover anchoring activity over extended periods of time, there will invariably be data that are missed. It is worth noting in this case that archived position data can be purchased directly from MarineTraffic and customised based on vessel type, area of interest, frequency of position data (high or low temporal resolution) and time period. Other useful features including alerts when selected vessels anchor or drag anchor are also available with various paid plans.
In conclusion, our study demonstrates that the described methodology using open-access AIS data is an effective, low-cost tool for (1) identifying anchoring pressure (number, location, date and length of anchoring events); (2) determining the extent of the anchoring footprint of known vessels; and (3) assessing the maximum potential area of physical damage to sensitive marine habitats (given additional spatial data for the latter) posed by the anchoring of any individual or multiple cruise ships. Furthermore, the methodology is applicable to any vessels carrying AIS transponders.
Recognising the threat posed to marine habitats by anchoring large vessels and the growth of the cruise ship and yachting industries, especially within the Caribbean SIDS (which typically have sensitive economies, limited resources and a high reliance on their marine biodiversity; Monnereau et al., 2017), this methodology is likely to be very useful as an accessible tool for monitoring anchoring behaviour. Application of this method will ultimately fill important knowledge gaps and thus guide science-based policy that seeks to protect valuable marine habitats from further decline by the marine transport industry.
Data availability statement
Publicly available datasets were analyzed in this study. These data can be found here: www.marinetraffic.com.
Author contributions
MS: Writing – original draft, Writing – review & editing, Conceptualization, Data curation, Formal Analysis, Methodology, Validation, Visualization. HO: Writing – review & editing, Conceptualization, Methodology, Supervision, Validation.
Funding
The author(s) declare financial support was received for the research and/or publication of this article. This work was supported by the Centre for Resource Management and Environmental Studies, University of the West Indies, Cave Hill Campus, Barbados as an MSc research grant to M. Small and by the University of Southampton, Southampton, United Kingdom.
Conflict of interest
The authors declare that the research was conducted in the absence of any commercial or financial relationships that could be construed as a potential conflict of interest.
Generative AI statement
The author(s) declare that no Generative AI was used in the creation of this manuscript.
Any alternative text (alt text) provided alongside figures in this article has been generated by Frontiers with the support of artificial intelligence and reasonable efforts have been made to ensure accuracy, including review by the authors wherever possible. If you identify any issues, please contact us.
Publisher’s note
All claims expressed in this article are solely those of the authors and do not necessarily represent those of their affiliated organizations, or those of the publisher, the editors and the reviewers. Any product that may be evaluated in this article, or claim that may be made by its manufacturer, is not guaranteed or endorsed by the publisher.
Supplementary material
The Supplementary Material for this article can be found online at: https://www.frontiersin.org/articles/10.3389/fcosc.2025.1552357/full#supplementary-material.
Supplementary Table 1 | Anchoring event data and descriptive data for all 28 cruise ships and sample anchoring event data for 11 cruise ships that anchored in Barbados during March – September 2020.
Footnotes
- ^ MarineTraffic, accessed May 8, 2025. https://marinetraffic.com.
- ^ Scheepvaartwest, “Passengers & Cruises”, accessed November 8, 2024. https://www.scheepvaartwest.be/CMS/index.php/passengers-cruise.
- ^ Cruisedeckplans LLC, “Home”, accessed November 8, 2024. https://www.cruisedeckplans.com/DP/deckplans/index.php
- ^ Ministry of Tourism and International Transport, “Barbados Port Inc.”, accessed August 8 2025. https://tourism.gov.bb/About/Agencies/BPI#:~:text=The%20Barbados%20Port%20Inc.%20is,the%20island%27s%20tourism%20cruise%20industry.
References
Ajagunna I. and Casanova S. (2022). An analysis of the post-COVID-19 cruise industry: Could this be a new possibility for the luxury yacht sector in the Caribbean? Worldwide Hospitality Tourism Themes 14, 115–123. doi: 10.1108/WHATT-12-2021-0158
Baldwin K., et al. (2019). Developing a benthic habitat classification scheme and island-wide map for Barbados based on remote sensing and comprehensive ground-truthing. CERMES Technical Report 94. Bridgetown: Centre for Resource Management and Environmental Studies, The University of the West Indies, Cave Hill Campus, p. 53.
Barbados Port Inc (2022). Our history - Barbados port inc. Available online at: https://Barbadosport.com/our-history/ (Accessed August 11, 2025).
Beeden R., Maynard J., Johnson J., Dryden J., Kininmonth S., and Marshall P. (2014). No-anchoring areas reduce coral damage in an effort to build resilience in Keppel Bay, southern Great Barrier Reef. Australas. J. Environ. Manage. 21, 311–319. doi: 10.1080/14486563.2014.881307
Broad A., Rees M. J., and Davis A. R. (2020). Anchor and chain scour as disturbance agents in benthic environments: trends in the literature and charting a course to more sustainable boating and shipping. Mar. pollut. Bull. 161, 111683. doi: 10.1016/j.marpolbul.2020.111683
Broad A., et al. (2023). Developing a benthic habitat classification scheme and island-wide map for Barbados based on remote sensing and comprehensive ground-truthing. Sci. Total Environ. 863, 160717. doi: 10.1016/j.scitotenv.2022.160717
CDB (2018). Financing the blue economy: A caribbean development oppurtunity. Caribbean Development Bank, Wildey, Barbados.
Clegg P., Cumberbatch J., and Degia K. (2021). “Tourism in the caribbean and the blue economy. Can the two be aligned?,” in Caribbean blue economy (Routledge, London), 131–142.
Collins K., Suonpää A., and Mallinson J. (2010). The impacts of anchoring and mooring in seagrass, Studland Bay, Dorset, UK. Underwater Technol. 29, 117–123. doi: 10.3723/ut.29.117
Creed J. C. and Amado Filho G. M. (1999). Disturbance and recovery of the macroflora of a seagrass (Halodule wrightii Ascherson) meadow in the Abrolhos Marine National Park, Brazil: an experimental evaluation of anchor damage. J. Exp. Mar. Biol. Ecol. 235, 285–306. doi: 10.1016/S0022-0981(98)00188-9
Dao D. A. and Grabe J. (2024). Numerical assessment of ship anchor penetration depth in Baltic Sea Sand: Implications for subsea cable burial. Ocean Eng. 314, 119674. doi: 10.1016/j.oceaneng.2024.119674
Davis G. E. (1977). Anchor damage to a coral reef on the coast of Florida. Biol. Conserv. 11, 29–34. doi: 10.1016/0006-3207(77)90024-6
Davis A. R. and Broad A. (2016). Curb anchor scour for green shipping. Nature 533, 36–36. doi: 10.1038/533036a
Davis A. R., Broad A., Gullett W., Reveley J., Steele C., and Schofield C. (2016). Anchors away? The impacts of anchor scour by ocean-going vessels and potential response options. Mar. Policy 73, 1–7. doi: 10.1016/j.marpol.2016.07.021
Davis A. R., Broad A., Small M., Oxenford H. A., Morris B., and Ingleton T. C. (2022). Mapping of benthic ecosystems: Key to improving the management and sustainability of anchoring practices for ocean-going vessels. Continental Shelf Res. 247, 104834. doi: 10.1016/j.csr.2022.104834
Demers M.-C. A., Davis A. R., and Knott N. A. (2013). A comparison of the impact of ‘seagrass-friendly’ boat mooring systems on Posidonia australis. Mar. Environ. Res. 83, 54–62. doi: 10.1016/j.marenvres.2012.10.010
Deter J., Lozupone X., Inacio A., Boissery P., and Holon F. (2017). Boat anchoring pressure on coastal seabed: Quantification and bias estimation using AIS data. Mar. pollut. Bull. 123, 175–181. doi: 10.1016/j.marpolbul.2017.08.065
Eijdenberg E. L., Thirumaran K., and Wong C. (2022). “Emerging yachting tourism and luxury policy mobility: Singapore and the southeast asian extension,” in Luxury yachting: perspectives on tourism, practice and context. Eds. Gladkikh T., Séraphin H., Gladkikh V., and Vo-Thanh T. (Springer International Publishing, Cham), 173–194. doi: 10.1007/978-3-030-86406-4_10
Forrester G. E. (2020). The influence of boat moorings on anchoring and potential anchor damage to coral reefs. Ocean Coast. Manage. 198, 105354. doi: 10.1016/j.ocecoaman.2020.105354
Francour P., Ganteaume A., and Poulain M. (1999). Effects of boat anchoring in Posidonia oceanica seagrass beds in the Port-Cros National Park (north-western Mediterranean Sea). Aquat. Conservation: Mar. Freshw. Ecosyst. 9, 391–400. doi: 10.1002/(SICI)1099-0755(199907/08)9:4<391::AID-AQC356>3.0.CO;2-8
Halas J. (1985). “An unique mooring system for reef management in the Key Largo National Marine Sanctuary,” in Proceedings of the Fifth International Coral Reef Congress, Moorea, French Polynesia, The Antenne Museum-EPHE, 237–242.
Hernández-Delgado E. A. (2023). Long-term persistence of propeller and anchor damage to seagrass canopy and demersal biodiversity in Puerto Rico. Open J. Ecol. 13, 671–710. doi: 10.4236/oje.2023.1310042
Hughes T. P., Barnes M. L., Bellwood D. R., Cinner J. E., Cumming G. S., Jackson J. B. C., et al. (2017). Coral reefs in the anthropocene. Nature 546, 82–90. doi: 10.1038/nature22901
Inoue K., Ma R., and Usui H. (2002). Development of an Integrated Simulation System for Analyzing the Swinging Movements of a Ship at Anchor and its Application for Educational Use. J. Japan Institute Navigation 107, 121–126. doi: 10.9749/jin.107.121
Ito H., Hanaoka S., and Sugishita K. (2023). Seasonality of the global cruise industry. Maritime Transport Res. 5, 100094. doi: 10.1016/j.martra.2023.100094
Mason R. A., Bozec Y.-M., and Mumby P. J. (2023). Setting sustainable limits on anchoring to improve the resilience of coral reefs. Mar. pollut. Bull. 189, 114721. doi: 10.1016/j.marpolbul.2023.114721
Milazzo M., Badalamenti F., Ceccherelli G., and Chemello R. (2004). Boat anchoring on Posidonia oceanica beds in a marine protected area (Italy, western Mediterranean): effect of anchor types in different anchoring stages. J. Exp. Mar. Biol. Ecol. 299, 51–62. doi: 10.1016/j.jembe.2003.09.003
Monnereau I., Mahon R., McConney P., Nurse L., Turner R., and Vallès H. (2017). The impact of methodological choices on the outcome of national-level climate change vulnerability assessments: An example from the global fisheries sector. Fish Fisheries 18, 717–731. doi: 10.1111/faf.12199
Mumby P., Flower J., Chollett I., Box S. J., Bozec Y.-M., Fitzsimmons C., et al. (2014). Towards reef resilience and sustainable livelihoods: A handbook for Caribbean coral reef managers (Exeter, Devon, UK: University of Exeter).
Rogers C. (1985). Degradation of Caribbean and Western Atlantic coral reefs and decline of associated fisheries. Proc. 5th Int. Coral Reef Congr, Moorea, French Polynesia, The Antenne Museum-EPHE 491–496.
Rogers C. S. and Garrison V. H. (2001). Ten years after the crime: Lasting effects of damage from a cruise ship anchor on a coral reef in St. John U.S. Virgin Islands. Bull. Mar. Sci. 69, 793–803.
Schuhman P. W., Skeete R., and Waite R. (2017). Economic importance of coastal and marine resources to tourism in Barbados Caribbean Tourism Organisation, Warrens, Barbados.
Small M. and Oxenford H. A. (2022). Impacts of cruise ship anchoring during COVID-19: Management failures and lessons learnt. Ocean Coast. Manage. 229, 106332. doi: 10.1016/j.ocecoaman.2022.106332
Smith S. H. (1988). Cruise ships: A serious threat to coral reefs and associated organisms. Ocean Shoreline Manage. 11, 231–248. doi: 10.1016/0951-8312(88)90021-5
Souter D., Planes S., Wicquart J., Obura D., and Staub F. (2021). Status of coral reefs of the world: 2020 report. Global Coral Reef Monitoring Network (GCRMN) and International Coral Reef Initiative (ICRI). doi: 10.59387/WOTJ9184
Szymoński M. (2019). Some effects of wind on ship’s manoeuvrability. TransNav Int. J. Mar. Navig. Saf. Sea Transp. 13, 623–626. doi: 10.12716/1001.13.03.19
Tinsley P. (2021). Impacts of large vessel anchoring on seabed habitats and Marine Protected Areas. Dorchester, UK: Dorset Wildlife Trust.
Walker T. B., Rolle S., and McLeod M. (2023). Yachting tourism’s contribution to the Caribbean’s social economy and environmental stewardship. Worldwide Hospitality Tourism Themes 15, 422–430. doi: 10.1108/WHATT-03-2023-0048
Keywords: anchor damage, Barbados, marine habitats, small island developing states, cruise ships, automatic identification systems (AIS)
Citation: Small M and Oxenford HA (2025) Low-cost, high-resolution method for determining cruise ship anchoring behaviour to assess potential impacts on sensitive tropical marine habitats. Front. Conserv. Sci. 6:1552357. doi: 10.3389/fcosc.2025.1552357
Received: 27 December 2024; Accepted: 02 September 2025;
Published: 19 September 2025.
Edited by:
Sally Joan Watson, National Institute of Water and Atmospheric Research (NIWA), New ZealandReviewed by:
Timothy Ingleton, Industry and Environment (DPIE), AustraliaDuy Anh Dao, Hamburg University of Technology, Germany
Copyright © 2025 Small and Oxenford. This is an open-access article distributed under the terms of the Creative Commons Attribution License (CC BY). The use, distribution or reproduction in other forums is permitted, provided the original author(s) and the copyright owner(s) are credited and that the original publication in this journal is cited, in accordance with accepted academic practice. No use, distribution or reproduction is permitted which does not comply with these terms.
*Correspondence: Micaela Small, bS5hLnNtYWxsQHNvdG9uLmFjLmVkdQ==