- 1Shcool of Natural Resources, Environmental Studies and Agriculture, Maasai Mara University, Narok, Kenya
- 2Mpala Research Centre, Nanyuki, Kenya
- 3Department of Ecology and Evolutionary Biology, Princeton University, Princeton, NJ, United States
The seasonal distribution and abundance of Grevy’s zebra were studied in the Samburu–Laikipia landscape. The aim was to understand how anthropogenic activities combined with seasonal weather patterns influence Grevy’s zebra abundance and distribution. Distance sampling was used to estimate Grevy’s zebra and cattle densities while vegetation structure and composition were measured using selected random line transects. Our analysis showed non-uniform distributions of Grevy’s zebra across the Samburu–Laikipia ecosystem largely driven by seasonal changes in vegetation quality and quantity driven by seasonal rainfall patterns and pastoralist herder use. Grevy’s zebras were found at higher densities and larger herds on community lands during wet periods when livestock grazing was heavy, stimulating grass growth and producing short, high-quality swards. During dry periods, Grevy’s zebras moved to protected areas, commercial ranches, and conservancies where lower levels of year-round grazing produced tall grass banks composed of swards of low-quality vegetation that zebras as hindgut fermenters can process. This suggests that pastoralist herd activity in conjunction with season rainfall patterns shapes Grevy’s zebra movements at a landscape level. While most reproductive classes of Grevy’s zebras occurred together in large herds during the wet season mostly on pastoral grazing lands, during dry periods, only territorial males, lactating females, and their foals were found together with herds that tended to be small. Bachelor males, non-lactating females, and juveniles generally spread themselves evenly over the landscape, perhaps as a way of reducing competition during times of food scarcity or to secure mating. Conservation strategies for successfully increasing survival of all Grevy’s zebra age classes will require maintaining a mixture of rapidly growing grass swards during the wet season and grass bank reserves during the dry season at the regional scale in order to enable seasonal movements across land use patterns driven by alternating rainfall periods. In the past, people have been perceived as part of the “Grevy’s zebra problem”. We show, going forward, that they can become part of the solution.
Introduction
Fostering conservation of large-bodied and mobile endangered species entails monitoring their distributions and abundances over large areas (Ritchie et al., 2009). Ultimately, an understanding of the impacts of habitat conversion, fragmentation, overexploitation, and climate change on movements and habitat use (Jones, 2011) will be required. Fretwell and Lucas (1970) demonstrated that movements among habitat types by individuals of different age, sex, and reproductive classes will be governed by the need to maximize fitness and are likely to lead to differences in specific distributions on the landscape. Thus, animals are expected to occur in large numbers in preferred habitats that have high quality and abundant resources while numbers are likely to be reduced in areas of lower-quality food and where predators are active, especially for age, sex, and reproductive classes most at risk. The persistence of an endangered species at a landscape level is highly dependent on dispersal either as one large population or smaller subpopulations depending on age, sex, and reproductive class needs. Source–sink dynamics as well as biological and environmental factors are likely to shape the distribution and abundance of the entire population or subpopulations. Making informed decision for management planning and conservation of an endangered species on a variable landscape, such as the Grevy’s zebra (Equus grevyi) (Oustalet, 1882), which number only approximately 2,800 worldwide (Rubenstein et al., 2016), will require understanding seasonal changes in the distribution and abundance of a population and its underlying ecological causation. This will provide insights into population trends that can be used to predict future demographic outcomes depending on patterns of land use and climate change.
Grevy’s zebras are large grazing mammals that occupy the northern regions of Eastern Africa ranging from northern Kenya into parts of Ethiopia. IUCN (2003); Williams (2002); Moehlman et al. (2008), and Rubenstein et al. (2016) show that its range have shrunk dramatically over the last 50 years and its population has declined from 15,000 in the 1970s to under 2,800 by 2018, a 75% decline globally, making it one of the most endangered mammal species and has been on CITES Appendix I since 1979. Williams (2002) describes the current range for Grevy’s zebra as the Samburu–Laikipia landscape and some small pockets of Ethiopia. Livestock grazing pressures, competition for water, poaching, and habitat fragmentation and loss, among others, are factors proposed to be the cause of Grevy’s zebra population and range decline (Rubenstein et al., 2016; Berger-Wolf et al., 2016). In the Samburu–Laikipia landscape, Grevy’s zebras live on a variety of land use types with varied management objectives. This will likely influence Grevy’s zebra survival, distribution, and abundance, which is very important in management.
The distribution and abundance of a species are shaped by its physical environment. Variation in environmental conditions within a habitat and across landscapes plays an important role in understanding changes of animal abundance and distribution. Of particular importance are changes in the distribution of food, water, and predation levels (Owen-Smith et al., 2005). Rainfall variation and its seasonality are the main environmental factors characterizing arid and semi-arid regions. Rainfall variation influences vegetation growth, quality, and nutrient availability, which, in turn, influences herbivore abundance and distributions (Coe et al., 1976; East, 1984; Scholes and Archer, 1997; Woinarski et al., 1999). Altered and expanding patterns of human land use intensified by climate change have induced changes in weather and also modify rainfall patterns and water availability as well as the size, dispersion, quality, and connectivity of grazing areas, thus influencing animal distribution and abundances.
Rubenstein (2010) has illustrated that Grevy’s zebras live in a fission–fusion society, and therefore, group or herd sizes are likely to change depending on seasonal rainfall and weather patterns. Also, individuals of various ages, sexes, and reproductive classes are likely to associate and disassociate differently depending on individual nutritional and energetic demands. Ruckstuhl and Neuhaus (2002), Rubenstein (1986; 2010), and Odadi et al. (2011) indicate that factors such as predation risk, facilitation by other herbivores, forage quality, and quantity and availability of drinking points shape activity budgets, thus governing the nature and dynamics of fission–fusion societies. For Grevy’s zebras that live in arid and semi-arid regions of the Samburu–Laikipia landscape where rainfall is often unpredictable, we examined how seasonal weather patterns and human activities of cattle grazing were likely to influence group size, distribution, and abundance as well as movement and association patterns by age, sex, and reproductive class. Here, we show that (1) the overall distribution and abundance of Grevy’s zebras changes seasonally, moving from areas of high year-round cattle activity during the wet season where vegetation is heavily cropped to areas of low year-round cattle density during the dry season where grass banks are fostered; (2) while grass quality is important in the wet season, it is grass abundance that influences Grevy’s zebra distribution and abundance in the dry season; and (3) reproductive classes distribute themselves differently across this spatial–temporal mosaic, with lactating females moving to areas of high vegetation abundance in the dry season with all other reproductive classes distributing themselves more evenly across land use types during dry periods.
Study area and methodology
Study area
The study was conducted between 2009 and 2015 in the Samburu–Laikipia landscape located between 36°15′–38°00′E and 0°00′–1°00′N covering 15,634 km2 (Figure 1). The study sites included the West Gate Conservancy, the Ngaroni community land, and the Sessia–Barsalinga community land, which are community group ranches in the north; Buffalo Springs and Samburu National Reserves, both protected areas (PAs) in the north; Oldonyiro and Kipsing community areas in the middle; and Laikipia community group ranches and Mpala Ranch both in the south (Figure 1).
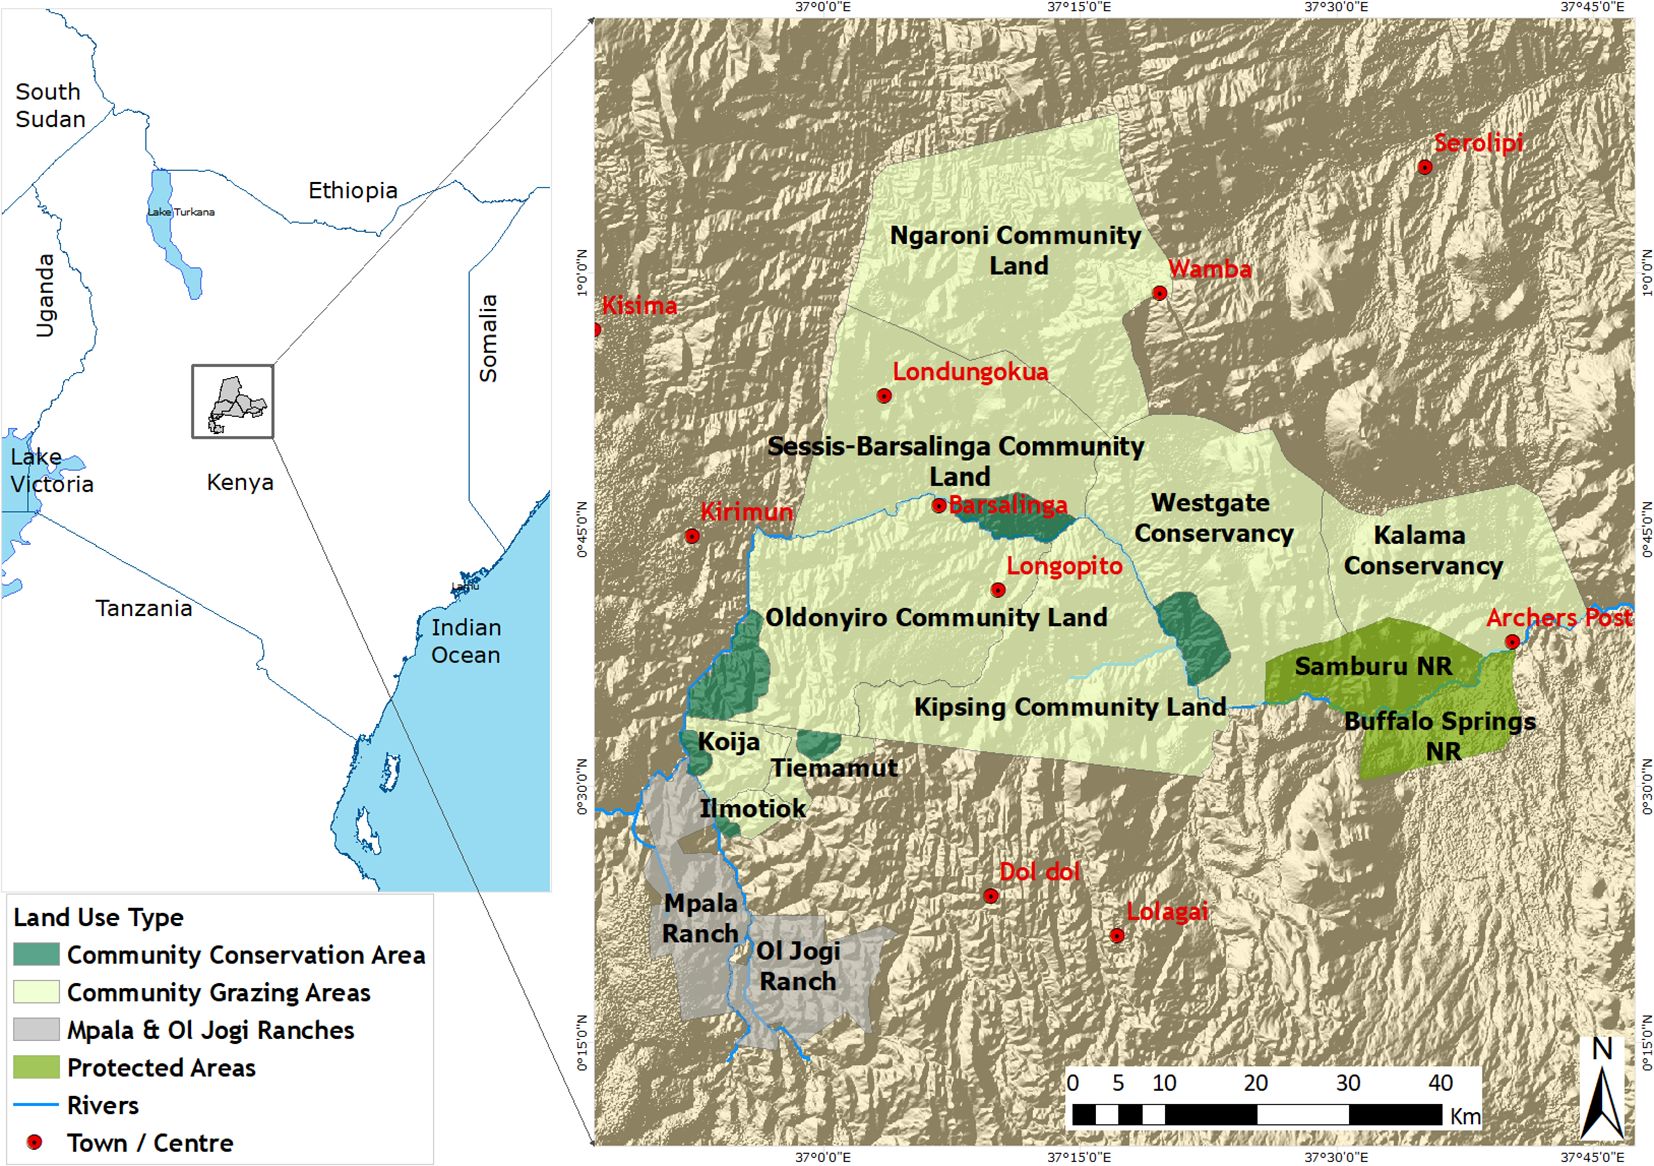
Figure 1. Map of Kenya showing the study area and land use types occurring in the Samburu–Laikipia landscape. NR = National Reserve (dark green areas) and since none of these large properties are fenced (turquoise and gray areas), there are no barriers constraining large-scale movements by Grevy’s zebras.
On this landscape, there is wide variation in seasonal rainfall, largely affected by altitude and the fact that the Samburu–Laikipia landscape lies on the lee side of both the Aberdares mountain range and Mt. Kenya.
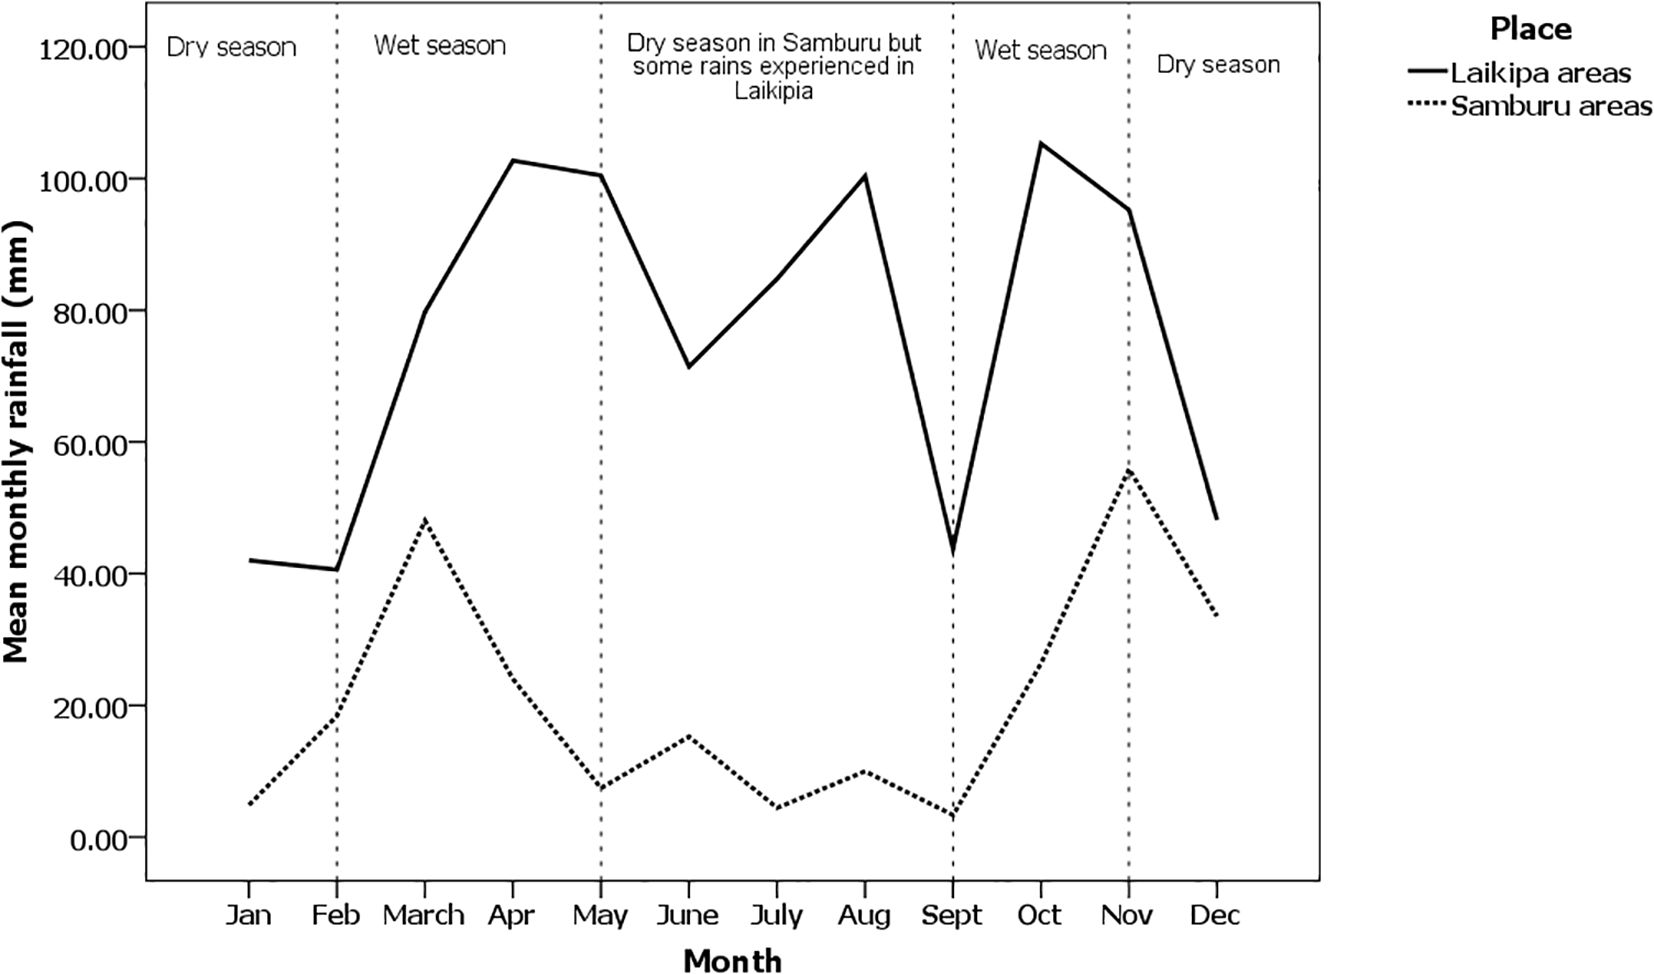
Study sites located in the south (Laikipia) receive more rainfall ranging between 600 and –800 mm per annum (Jaetzold and Schmidt, 1983) than in the northern part of the species' range around Archer's post and Wamba town where yearly rainfall averages approximately 250 mm per annum (Jaetzold and Schmidt, 1983; Figure 2). The climate is hot and dry during the day with cool nights while the mean annual temperature is 30°C (SNR, 2003, unpublished technical report). The vegetation communities fall under the “Agro-ecological zone V” consisting largely of bush grassland and wooded grassland (Pratt et al., 1966). The systems represented in the area include alternating savannah mosaic, Vachellia grasslands, and Vachellia-Commiphora scrubs (Pratt and Gwynne, 1977). Large areas of Vachellia tortilis wooded grasslands with a ground cover of perennial and annual grasses dominate.
In both counties, the onset and termination of seasons are highly variable. In Samburu, the long and short rains typically occur between February and April and between October and November, respectively. In Laikipia, the long rains commence in March and end in early May to July, whereas the short rains occur during October and November. As Figure 2 shows, Laikipia also has a third rainy period from June through August (“the summer rains”). Overall, Laikipia receives more rain per month on average than Samburu.
Methodology
Land use types and patterns
In order to see the influence of different human activities on Grevy’s zebra distribution and abundance, the study sites were stratified into different land use types occurring in the area. These include the following:
1. Laikipia ranches (LR), which mainly included Mpala Ranch, but also Ol Jogi Ranch where livestock stocking rates and controlled.
2. Community conservation areas (CCAs). These include sections of areas set aside within pastoral group ranches for conservation by Laikipia group ranches and the conservancies of West Gate, Oldonyiro, and Sessia–Barsalinga. These areas are only maintained as conservation areas during wet periods and are the first to serve as dry season livestock grazing areas by local communities before herders look for grass elsewhere.
3. Community grazing areas (CGAs). These include CGAs in Laikipia group ranches, the communities of West Gate, and Sessia–Barsalinga, as well as Isiolo Trust Land, composed of parts of the Oldonyiro and Kipsing communities. These areas maintain high livestock densities throughout the year and always look overgrazed.
4. PAs, which include Buffalo Springs and Samburu National Reserves. These land use types attempt to exclude pastoralist herds and, as a result, differ in the types and degrees of human activities, which varied from one season to another and therefore differentially impact Grevy’s zebra distribution and abundance (Figure 1).
Determination of Grev’s zebra and cattle distribution and abundance
Grevy’s zebra and cattle distribution and abundances were assessed using census routes that mimicked transect lines following a systematic design to avoid double counting (Grimsdell, 1973; Norton-Griffiths, 1978) effectively covering 25%–30% of each study site. Distance sampling (Buckland et al., 2001) was applied on the transects to determine Grevy’s zebra and cattle distribution and abundance in the study area in both wet and dry season. Distance sampling is based on the scenario of animals being distributed spatial–temporally according to a stochastic process with rate parameter D (density). Transects are placed at random or systematically to ensure that objects in the survey strip are uniformly distributed in relation to distance from the transect. Distance sampling rests on four basic assumptions: (i) animals on the transect are always detected; (ii) animal locations are always measured to the point where the animal was first detected; (iii) distances to the animals and angles between the animal and the transect are measured exactly; and (iv) herds are counted accurately, at least when they are close to the transect (Buckland et al., 2001). Grevy’s zebras and cattle are large and conspicuous animals; thus, the first assumption is easily met. Here, distance from observer to animal was measured using laser rangefinders, thus supporting the second assumption. Transect direction and angle between animal and observer were determined from an analog handheld compass, thus supporting the third assumption. Perpendicular distance to the transect was calculated using the angle between the transect and the animal and radial distance from observer to animal. Finally, the fourth assumption was met by recording length of censuses routes in kilometers from the car odometer.
For each Grevy’s zebra or herds sighted, herd composition was recorded by sex, age, and, within the sexes, reproductive class using the method by Williams (1998). Females were only classified into two classes—non-lactating females or lactating females—when observed with a foal due to difficulties in distinguishing pregnant females from other non-lactating females. Males were classified as either bachelors or territorial males. Bachelor males occurred in herds of two and above, while territorial males, which are large in size, occurred mostly alone defending a territory. Territorial males were always found to be vigilant, harassing other zebras and scouting their territories in addition to mating with estrous females (Ginsberg, 1988; Estes, 1997). Young individuals were recorded as juveniles and foals in relation to their size, coat color, or hair length compared to adults or association with a mother (Ginsberg, 1988). Juveniles and foals were also further distinguished as male or female using external genitalia, i.e., hanging penile and scrotum for males or wide perineal area for females.
To obtain distribution data, each Grevy’s zebra location via distance sampling was determined using a Garmin GPS, compass direction, and distance from the census route. Grevy’s zebra location data were superimposed into the map of the area using ARCMAP to show distribution. Because both the total number of Grevy’s zebra sighted along transects at each study site and the area of each site varied, the analyses across space and time with respect to the number of Grevy’s zebras and cattle encountered per transect in each study site and for each monthly census were converted into densities per km2.
Grevy’s zebra and cattle density determination
Grevy’s zebra and cattle densities were determined for each land use type and compared across the seasons. The census data were summarized into respective transects and pooled to obtain zebra abundances for each study site. For each study site, summaries of total number of Grevy’s zebra and reproductive classes were obtained. The data were further analyzed using the program Distance 6.0 (Thomas et al., 2010) to provide Grevy’s zebra and reproductive class densities for each site.
Density was estimated using the following equation using the Distance software:
where D is the density, n is the number of individuals detected, W is the effective animal observation width, L is the length of census routes, and Pa is the detection probability.
where μ is half effective width (Buckland et al., 1993).
To analyze animal density, exact perpendicular distances were used and the zebra herds or other animals were treated as one group. The same treatment was applied to the different reproductive classes of Grevy’s zebra. Only territorial males known not to associate with others were treated as individual observation rather than herd. For each census visit and on each census route, we evaluated half-normal, hazard, and uniform models with cosine and simple polynomial adjustments and chose the final model based on a minimum AIC value on Distance Program 6.0 release 2 (Akaike, 1974; Burnham and Anderson, 2002). For this analysis, half-normal models with cosine adjustment or hazard rate with simple polynomial adjustments produced the lowest AIC value and were used.
Determination of grass composition and structure
Along the Grevy’s zebra and cattle census routes, 1-km grids were established using ARCGIS. 3.363 grids where Grevy’s zebra or cattle were present were selected randomly to ensure that the distribution of vegetation type used was unbiased. For every randomly chosen grid cell, a 100-m transect was walked from the center of the chosen grid in order to assess herbaceous cover (forbs and grasses). By choosing new grids and transects monthly, spatial variation of vegetation cover and type across time was ensured.
Along the 100-m random transects, a welding rod was dropped at meter intervals. Vegetation touching the pin was keyed to species, and counts were used to estimate percent cover, species diversity, proportion perennial, and proportion annual grasses. Proportion hit by any grass part was recorded as follows: grass cover, green grass, grass leaves, and grass seeds. Grass and forb height was determined using a meter rule (e.g., Rubenstein, 2010). Biomass was estimated by clipping grass in four 0.5-m2 quadrat evenly spaced along the transect. The clipped grass was dried and weighed until no further weight loss was achieved.
Statistical analysis
Two-way analyses of variance (ANOVAs) using principal component values were used to build general linear models (GLMs) to assess how the quantity and abundance of vegetation changed by season and land use pattern. When overall significant differences were found (p < 0.05), differences among means were tested using Student’s t-test least squares method (LSM) difference tests (JMP 12.0, Kramer, 1956; Tukey, 1953).
Repeated sightings of Grevy’s zebra by demographic and reproductive class, as well as all cattle by season across sites and seasons, were used to generate GLMs determining how seasonal and human land use practice affected patterns of the study species abundance. The distribution of Grevy’s zebra across the land use types and season was tested using the chi-square test of independence (χ2). JMP Pro 12 statistical computer software from the Statistical Analysis System (SAS) was used to analyze data and construct GLMs (SAS Institute Inc, 2016). Data that did not conform to uniform distribution were square root transformed for analysis and then back transformed for data presentation. Grevy’s zebra herd size and abundance for wet and dry seasons by land use patterns were compared using two-way ANOVA. When models showed significant differences, differences in means were compared using Student’s t-LSD test to see whether they are different (Kramer, 1956; Tukey, 1953). Data are presented as mean ± standard error (SE).
Results
Vegetation characteristics influencing Grevy’s zebra distribution and abundance
Since many of the vegetation variables co-varied, principal component analysis was used to identify independent composite variables thought to influence Grevy’s zebra distribution and abundance. Table 1 shows that two components explain 71% of vegetation variation: PC1 is composed of variables depicting “Grass Abundance” given the high eigenvector scores of average hits per pin and average height of the leaf table (both estimates of biomass) and proportion of pins hitting vegetation as opposed to bare ground (an estimate of percent vegetation cover); PC2 is composed of variables corresponding to “Grass Quality” given the high eigenvector scores of proportions of pins hitting green (as opposed to brown) grass plant parts, or forbs.
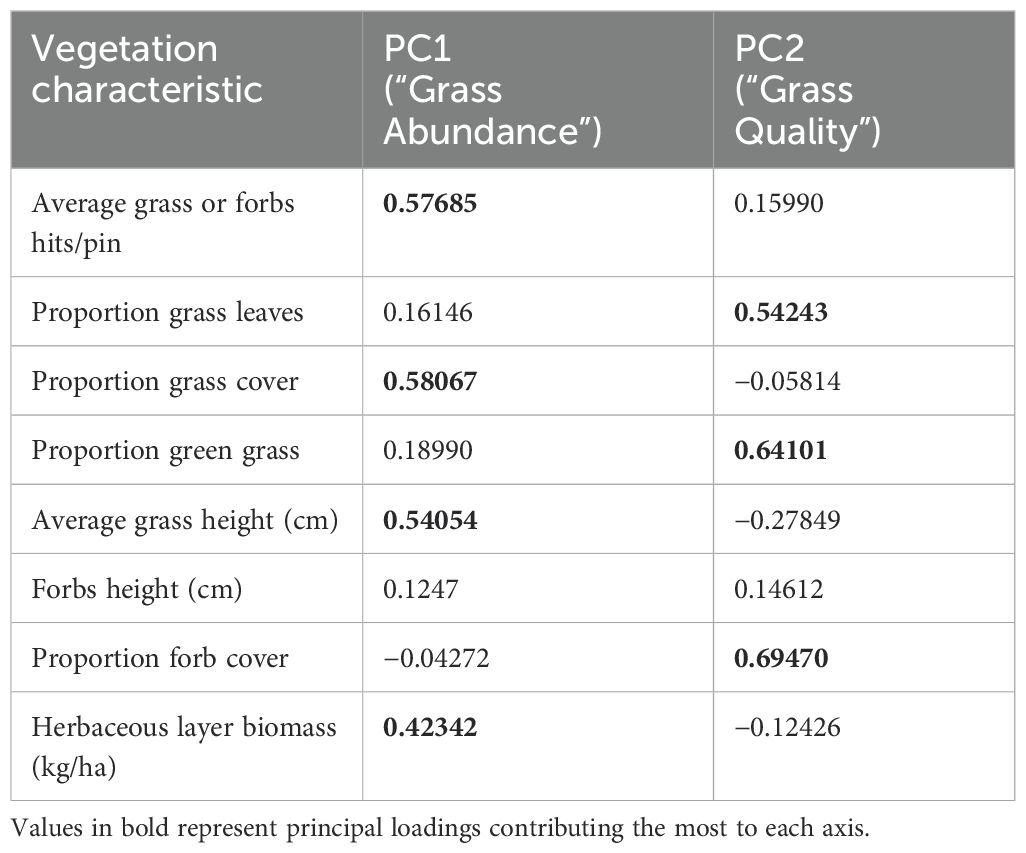
Table 1. Principal components of vegetation characteristics in the Samburu–Laikipia landscape study sites.
Grevy’s zebra seasonal distribution and abundance in the Samburu–Laikipia landscape
A total of 10,178 Grevy’s zebra encounters were seen during the census throughout the study period across all the study sites. A total of 25,068 cattle were also encountered during the census. A total of 17,166 km of transects were driven during the study period. Overall, more Grevy’s zebra were encountered during the dry (as opposed to during the wet) season.
Grevy’s zebra seasonal distributions by land use patterns
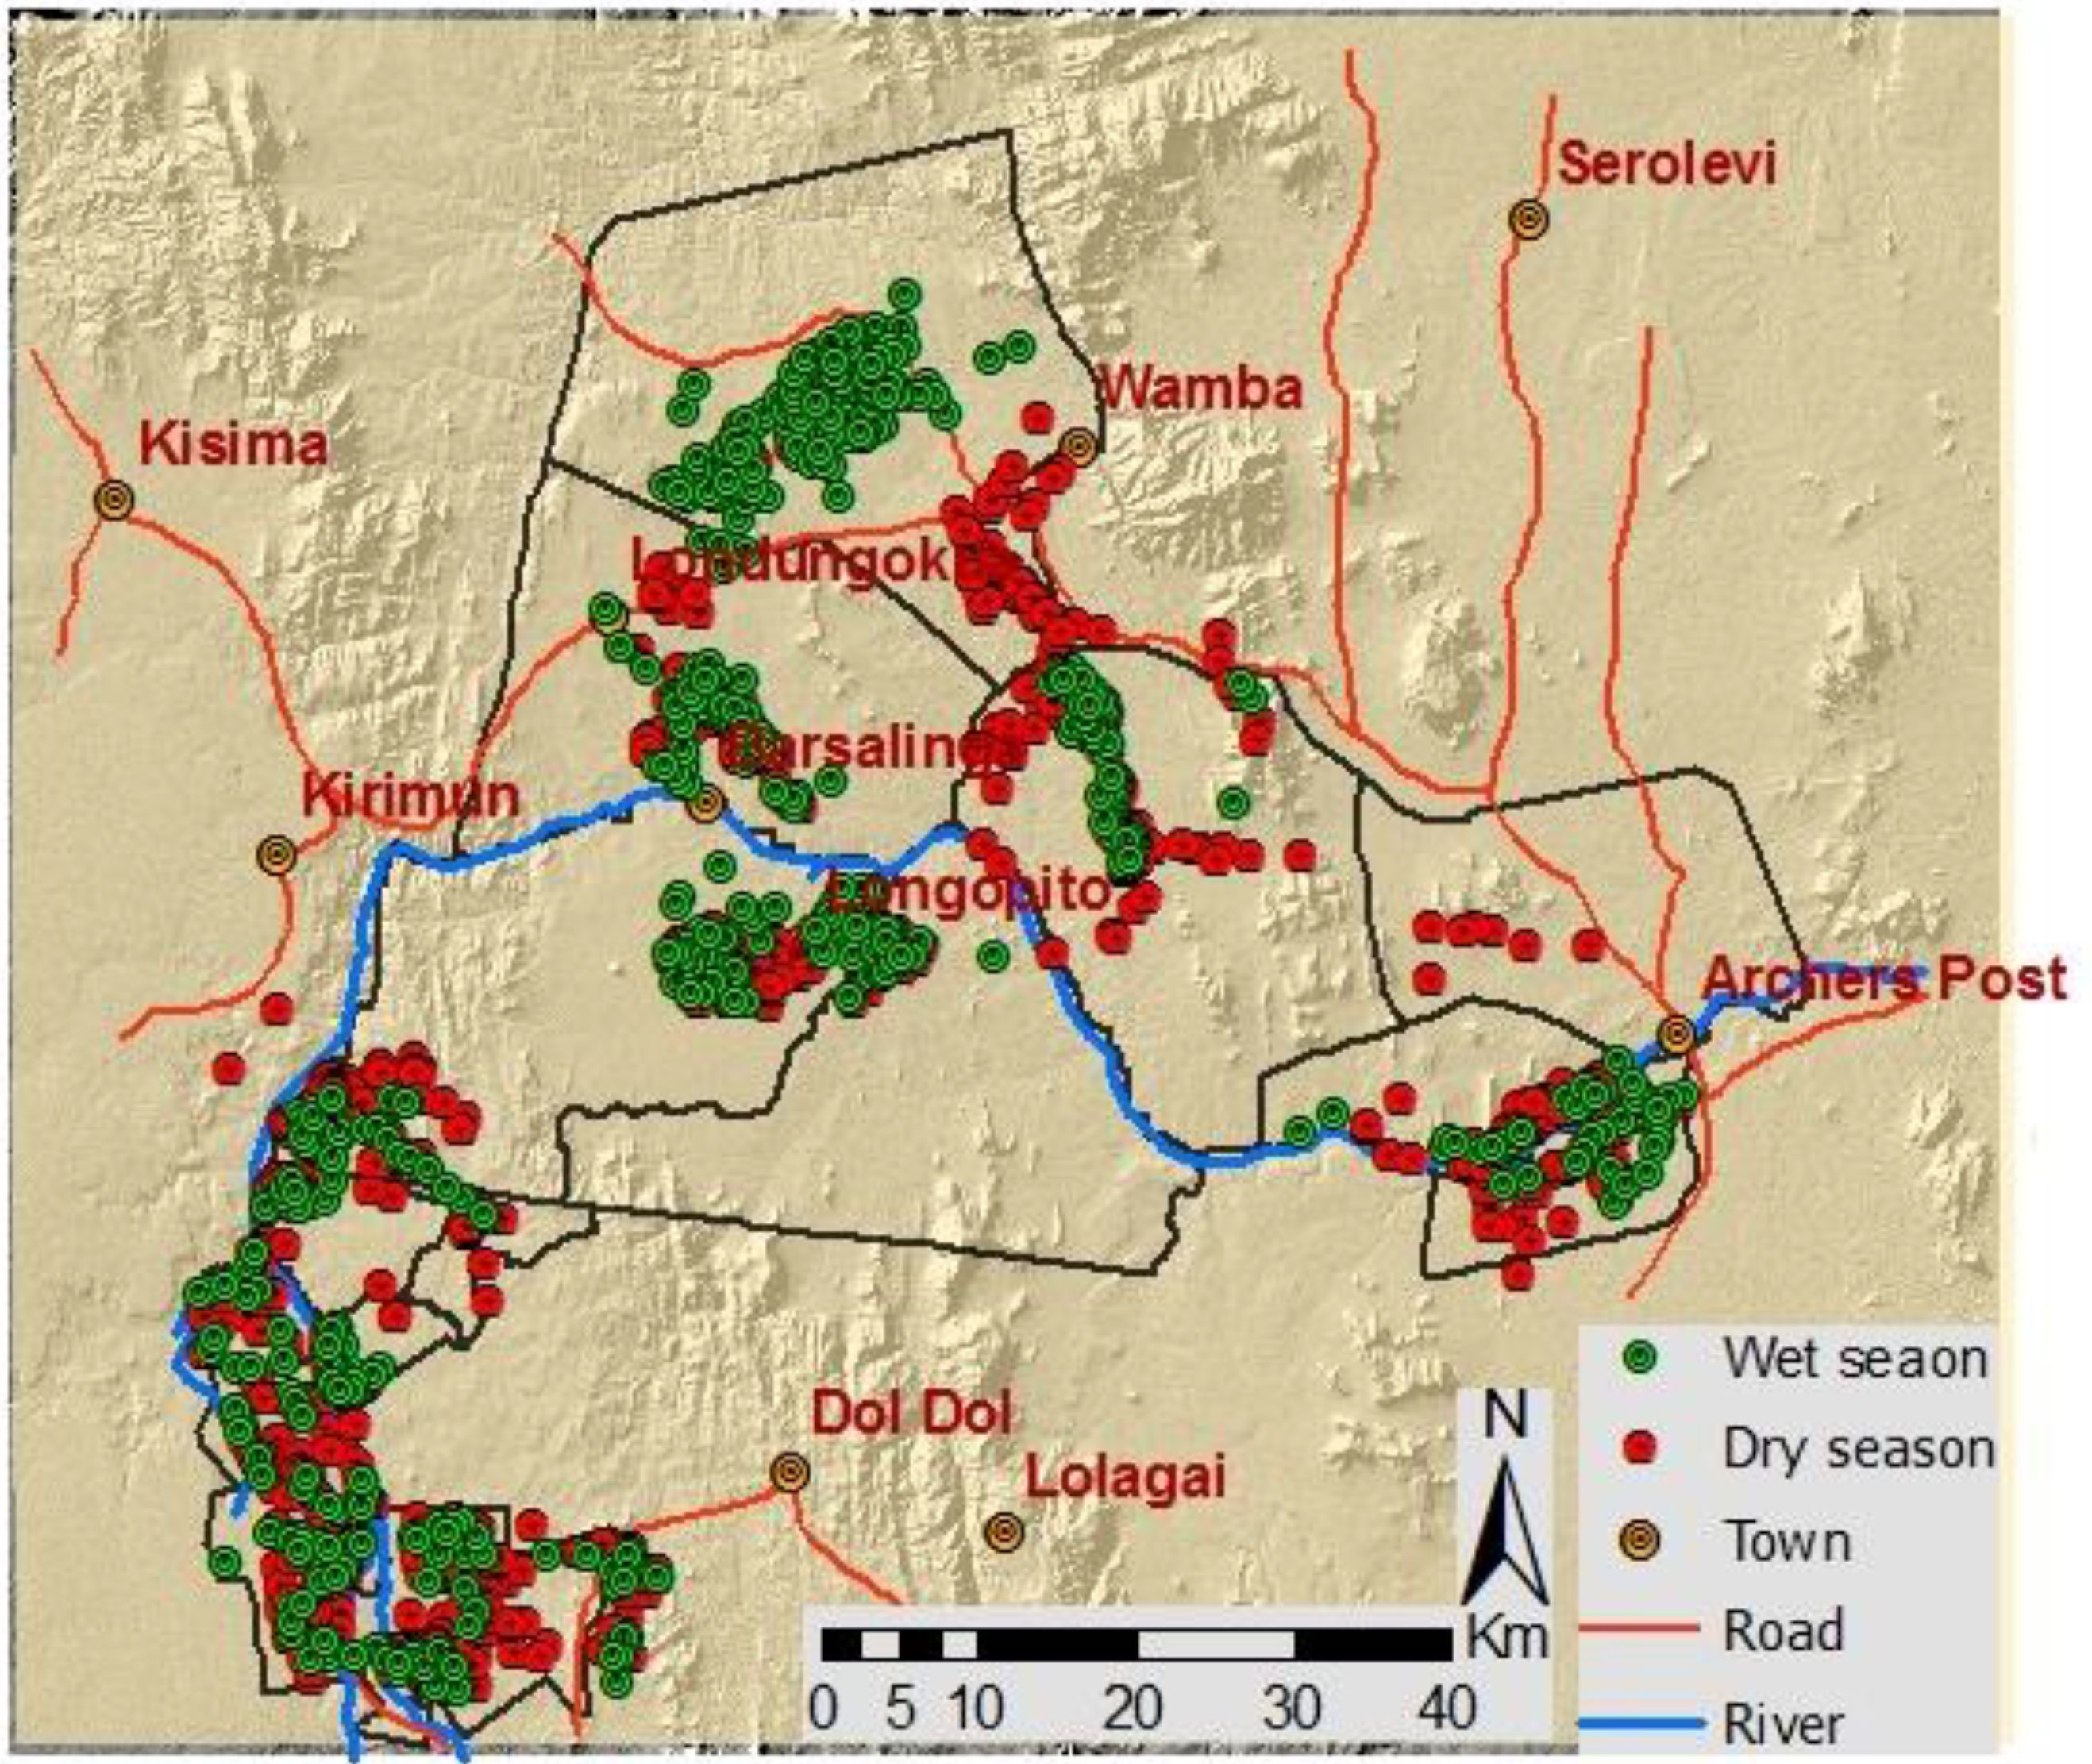
Figure 3 depicts all Grevy’s zebra sightings for both wet and dry seasons. The distribution of Grevy’s zebra changed seasonally as measured by densities per km2 in study area (χ2 = 94.18, p < 0.001, 8 df). During the wet season, Grevy’s zebras were found to concentrate in only a few areas, while in the dry season, they spread out over the entire study area (Figure 3). In the wet season, most Grevy’s zebra sightings were observed on Samburu community ranches of Ngaroni, Sessia–Barsalinga, and West Gate Conservancy (CGAs; Figure 4). Very few individuals were sighted on Laikipia conservancies, PAs, and Laikipia commercial ranches (Figure 3).
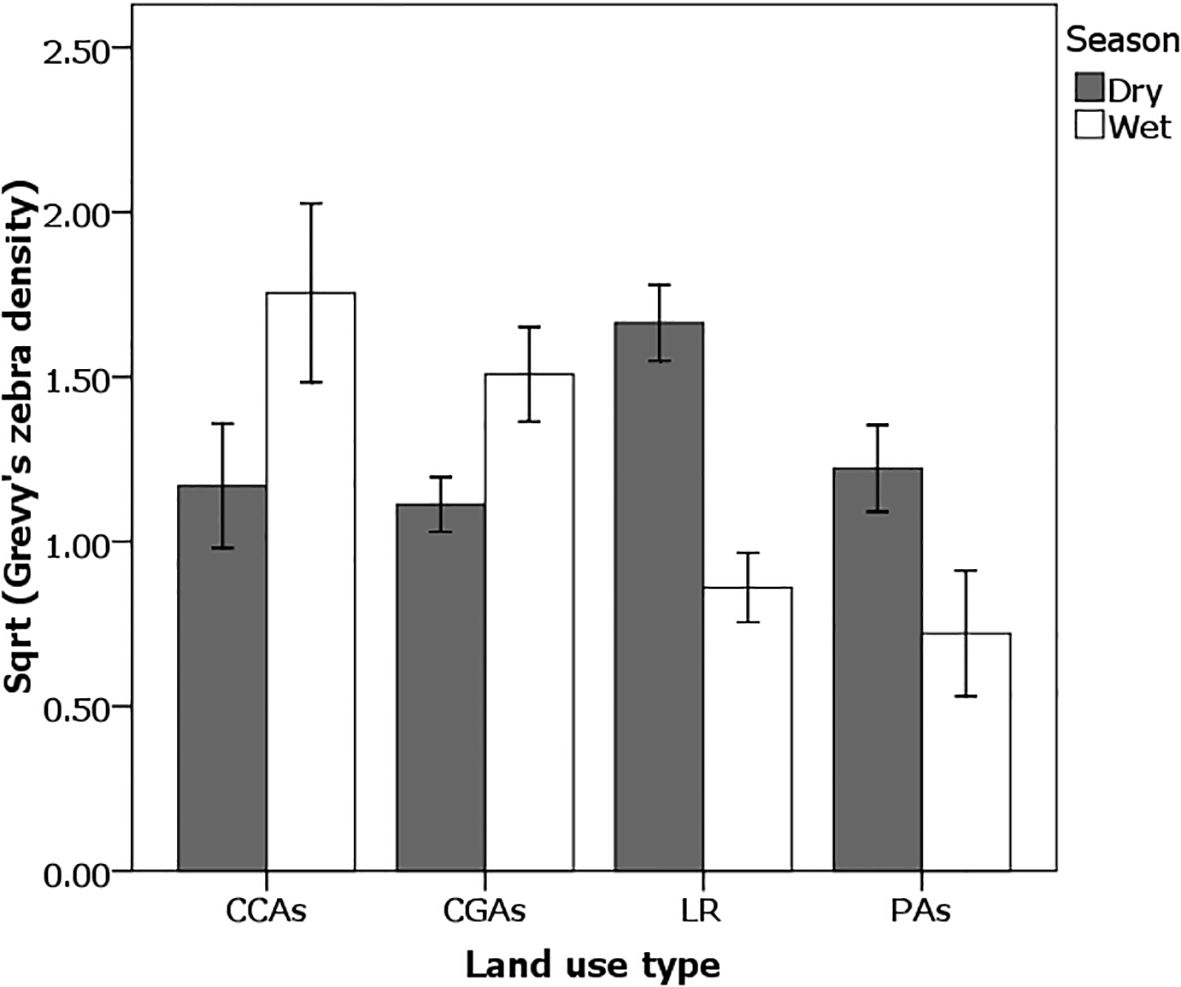
Figure 4. Density of Grevy’s zebras [Sqrt (numbers/km2)] was higher on pastoral lands [community conservation areas (CCAs) and community grazing areas (CGAs)] during the wet season (clear bars), whereas they were higher on Laikipia Commercial Ranches (LR) and Protected areas (PAs) during the dry season (dark bars). Effect tests: Wet season × Land use (ANOVA F3,48 = 9.14, p < 0.0001) and in Dry season × Land use (ANOVA F3,48 = 2.77, p = 0.04). Student’s t pairwise difference comparisons show that in the wet season, (CCAs = CGAs) > (LR = PAs); in the dry season, (LR > PAs > CCAs = CGA). Errors bars represent standard errors.
During the dry season, Grevy’s zebras were more dispersed than during the wet season. In addition, during dry periods, more sightings were recorded in the south, especially on Laikipia group ranch CCAs, Oldonyiro conservation areas (CCAs), Kipsing CGAs, Sessia–Barsalinga grazing areas (CGAs), and Samburu and Buffalo Springs National Reserves (PAs) than during the wet season (Figure 3).
When land use patterns are compared across seasons, some striking differences emerge in the way Grevy’s zebras are distributed (Figure 4). On average, the density of Grevy’s zebras was higher on pastoral lands (CGAs and CCAs) during the wet season (ANOVA F3,48 = 9.14, p < 0.0001) than on the Laikipia commercial ranches and conservancies of Mpala and Ol Jogi, or in PAs comprising the National Reserves of Samburu (SNR) and Buffalo Springs (BSNR). Overall, in the dry season, Laikipia commercial ranches and PAs had significantly higher densities compared to CCAs and CGAs (ANOVA F3,91 = 2.77, p < 0.05). Two-way ANOVA models show that these distributional patterns were strongly associated with vegetation patterns that changed by season across types of land use.
Figure 5 shows that across all sites, vegetation was of significantly higher quality during the wet growing season than it was during the dry season (ANOVA F1,382 = 29.47, p < 0.0001) when grasses were becoming senescent. Only during the wet season were the PC1 values for quality positive, and they only occurred on pastoral lands (ANOVA F3,382 = 24.68, p < 0.001). During the rains, pairwise comparisons show that both community grazing and conservation areas on pastoral lands contained significantly higher-quality vegetation than on the commercial ranches and the national PAs.
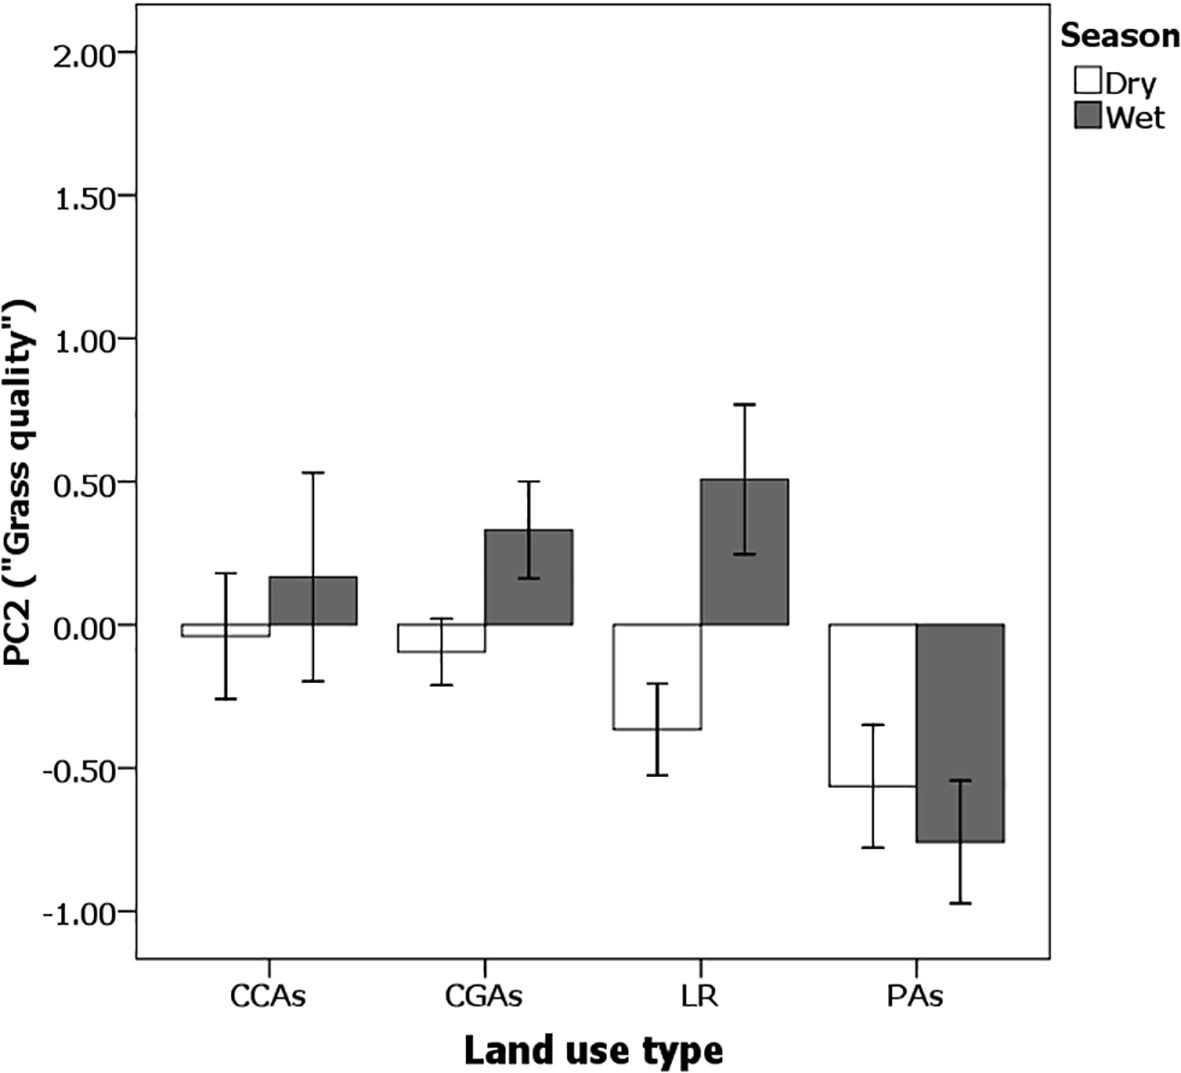
Figure 5. The principal component for “Quality” is always significantly higher during the wet season (dark bars) than during the dry season (light bars) (F1,382 = 29.47, p < 0.0001) and on pastoral lands as opposed to commercial ranches and national protected areas (F3,382 = 24.68, p < 0.0001; Season × Land use was not significant (F3,382 = 0.31, p < 0.9). Errors bars represent standard error.
Table 2 shows that grass height also varied across land use types. On Laikipia ranches (LR) and in National Reserves (PAs), vegetation was significantly higher than in CGAs and CCAs in both dry (ANOVA F3,249 = 22.34, p < 0.001; paired t-test) and wet seasons (ANOVA F3,126 = 8.39, p < 0.001; paired t-test). Grass height was lowest in CGAs in the wet season compared to all other land use types. Likewise, forb height varied significantly among different land use types. CCAs had the highest values than other sites during both dry (ANOVA F3,249 = 2.81, p < 0.05, paired t-test) and wet seasons (ANOVA F3,126 = 4.51, p < 0.01; paired t-test).

Table 2. Changes in grass height and forb’s height between land use types of the Samburu–Laikipia landscape in both dry and wet seasons.
Livestock numbers were highest in CGAs year-round (Figure 6). The resulting high grazing pressure suggests that high levels of livestock during the rainy season in these CGAs dramatically reduce grass and forb heights. Because soil moisture remains high during the rainy season, continually growing highly digestible short swards of high-quality grass appears to attract large numbers of Grevy’s zebras (Figure 6). It is interesting to note that even in CCAs, grass heights are shorter than on Laikipia ranchers or in PAs, suggesting that livestock are not completely excluded from such a situation. Once the rains cease and soil moisture drops, regrowth of heavily cropped grass ceases. With their large mouths and wide tooth rows, Grevy’s zebras cannot crop the very short grass swards that remain. Thus, like in the classic grazing succession scenario in which plains zebras are forced to leave catena apexes first before wildebeest and gazelles with smaller mouths (Vesey-FitzGerald, 1960), Grevy’s zebras in Kenya’s dry lands are also forced to leave these once highly productive areas, returning to previously abandoned lightly grazed landscapes—Laikipia ranches and PAs—where tall stands of senescing grasses are abundant.
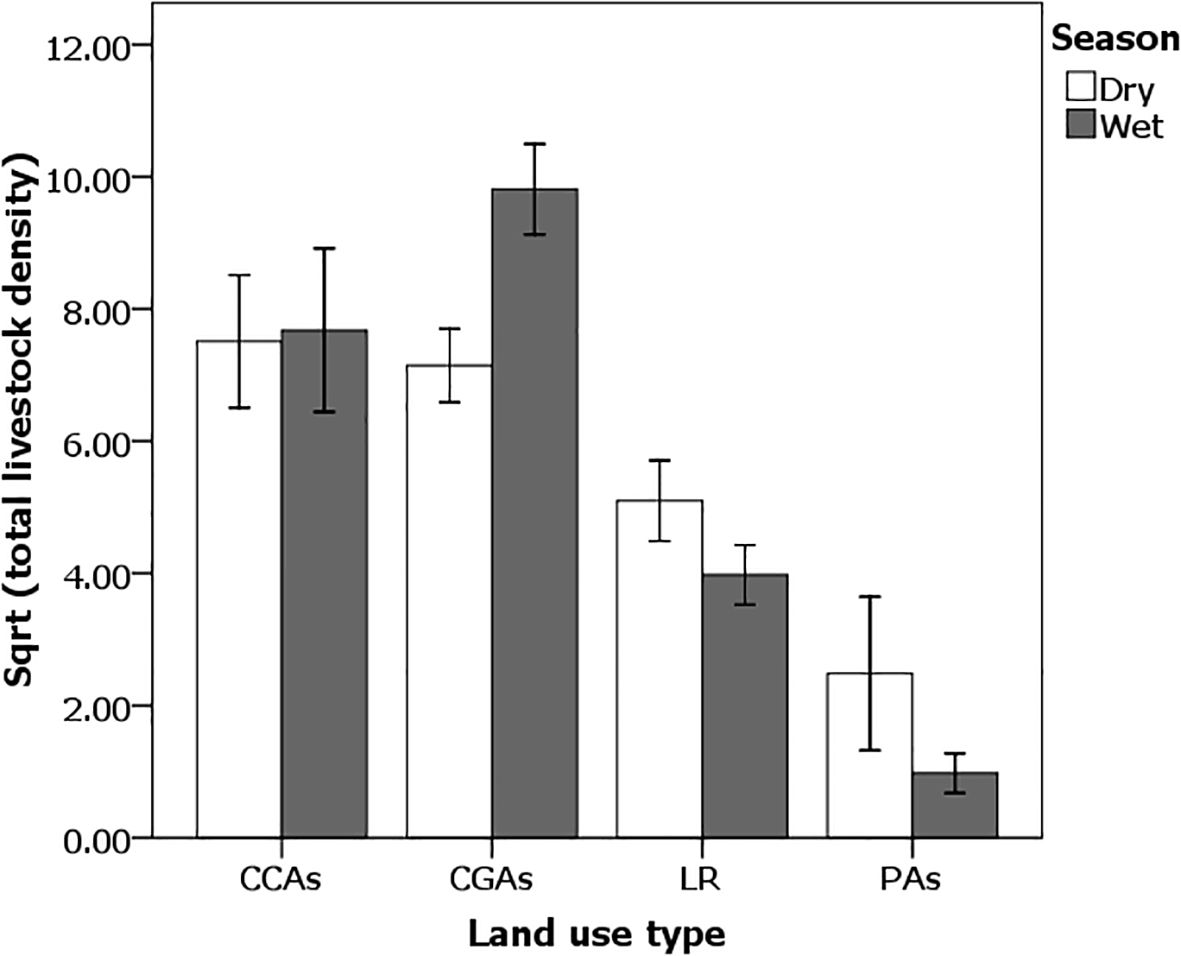
Figure 6. Livestock abundance density (Sqrt numbers/km2) during the wet season differs significantly by land use type (F3,47 = 29.97; p < 0.0001). Student’s t LMS pairwise differences: CGA > CCA > LR > PA. Errors bars represent standard error.
In general, the Samburu–Laikipia ecosystem is a mosaic landscape in which livestock densities are significantly higher on both pastoral community grazing (CGAs) and community conservation (CCAs) areas during both rainy (ANOVA F3,47 = 29.97; p < 0.0001) and dry seasons (ANOVA F3,97 = 8.76, p < 0.001; Figure 6) than on Laikipia commercial ranches (Mpala and Ol Jogi) or on National Reserve PAs. Yet, as Figure 7 illustrates, during the wet season, the highest densities of Grevy’s zebras co-occur with high densities of livestock on pastoralist lands (ANOVA F1,49 = 7.48; p < 0.001).
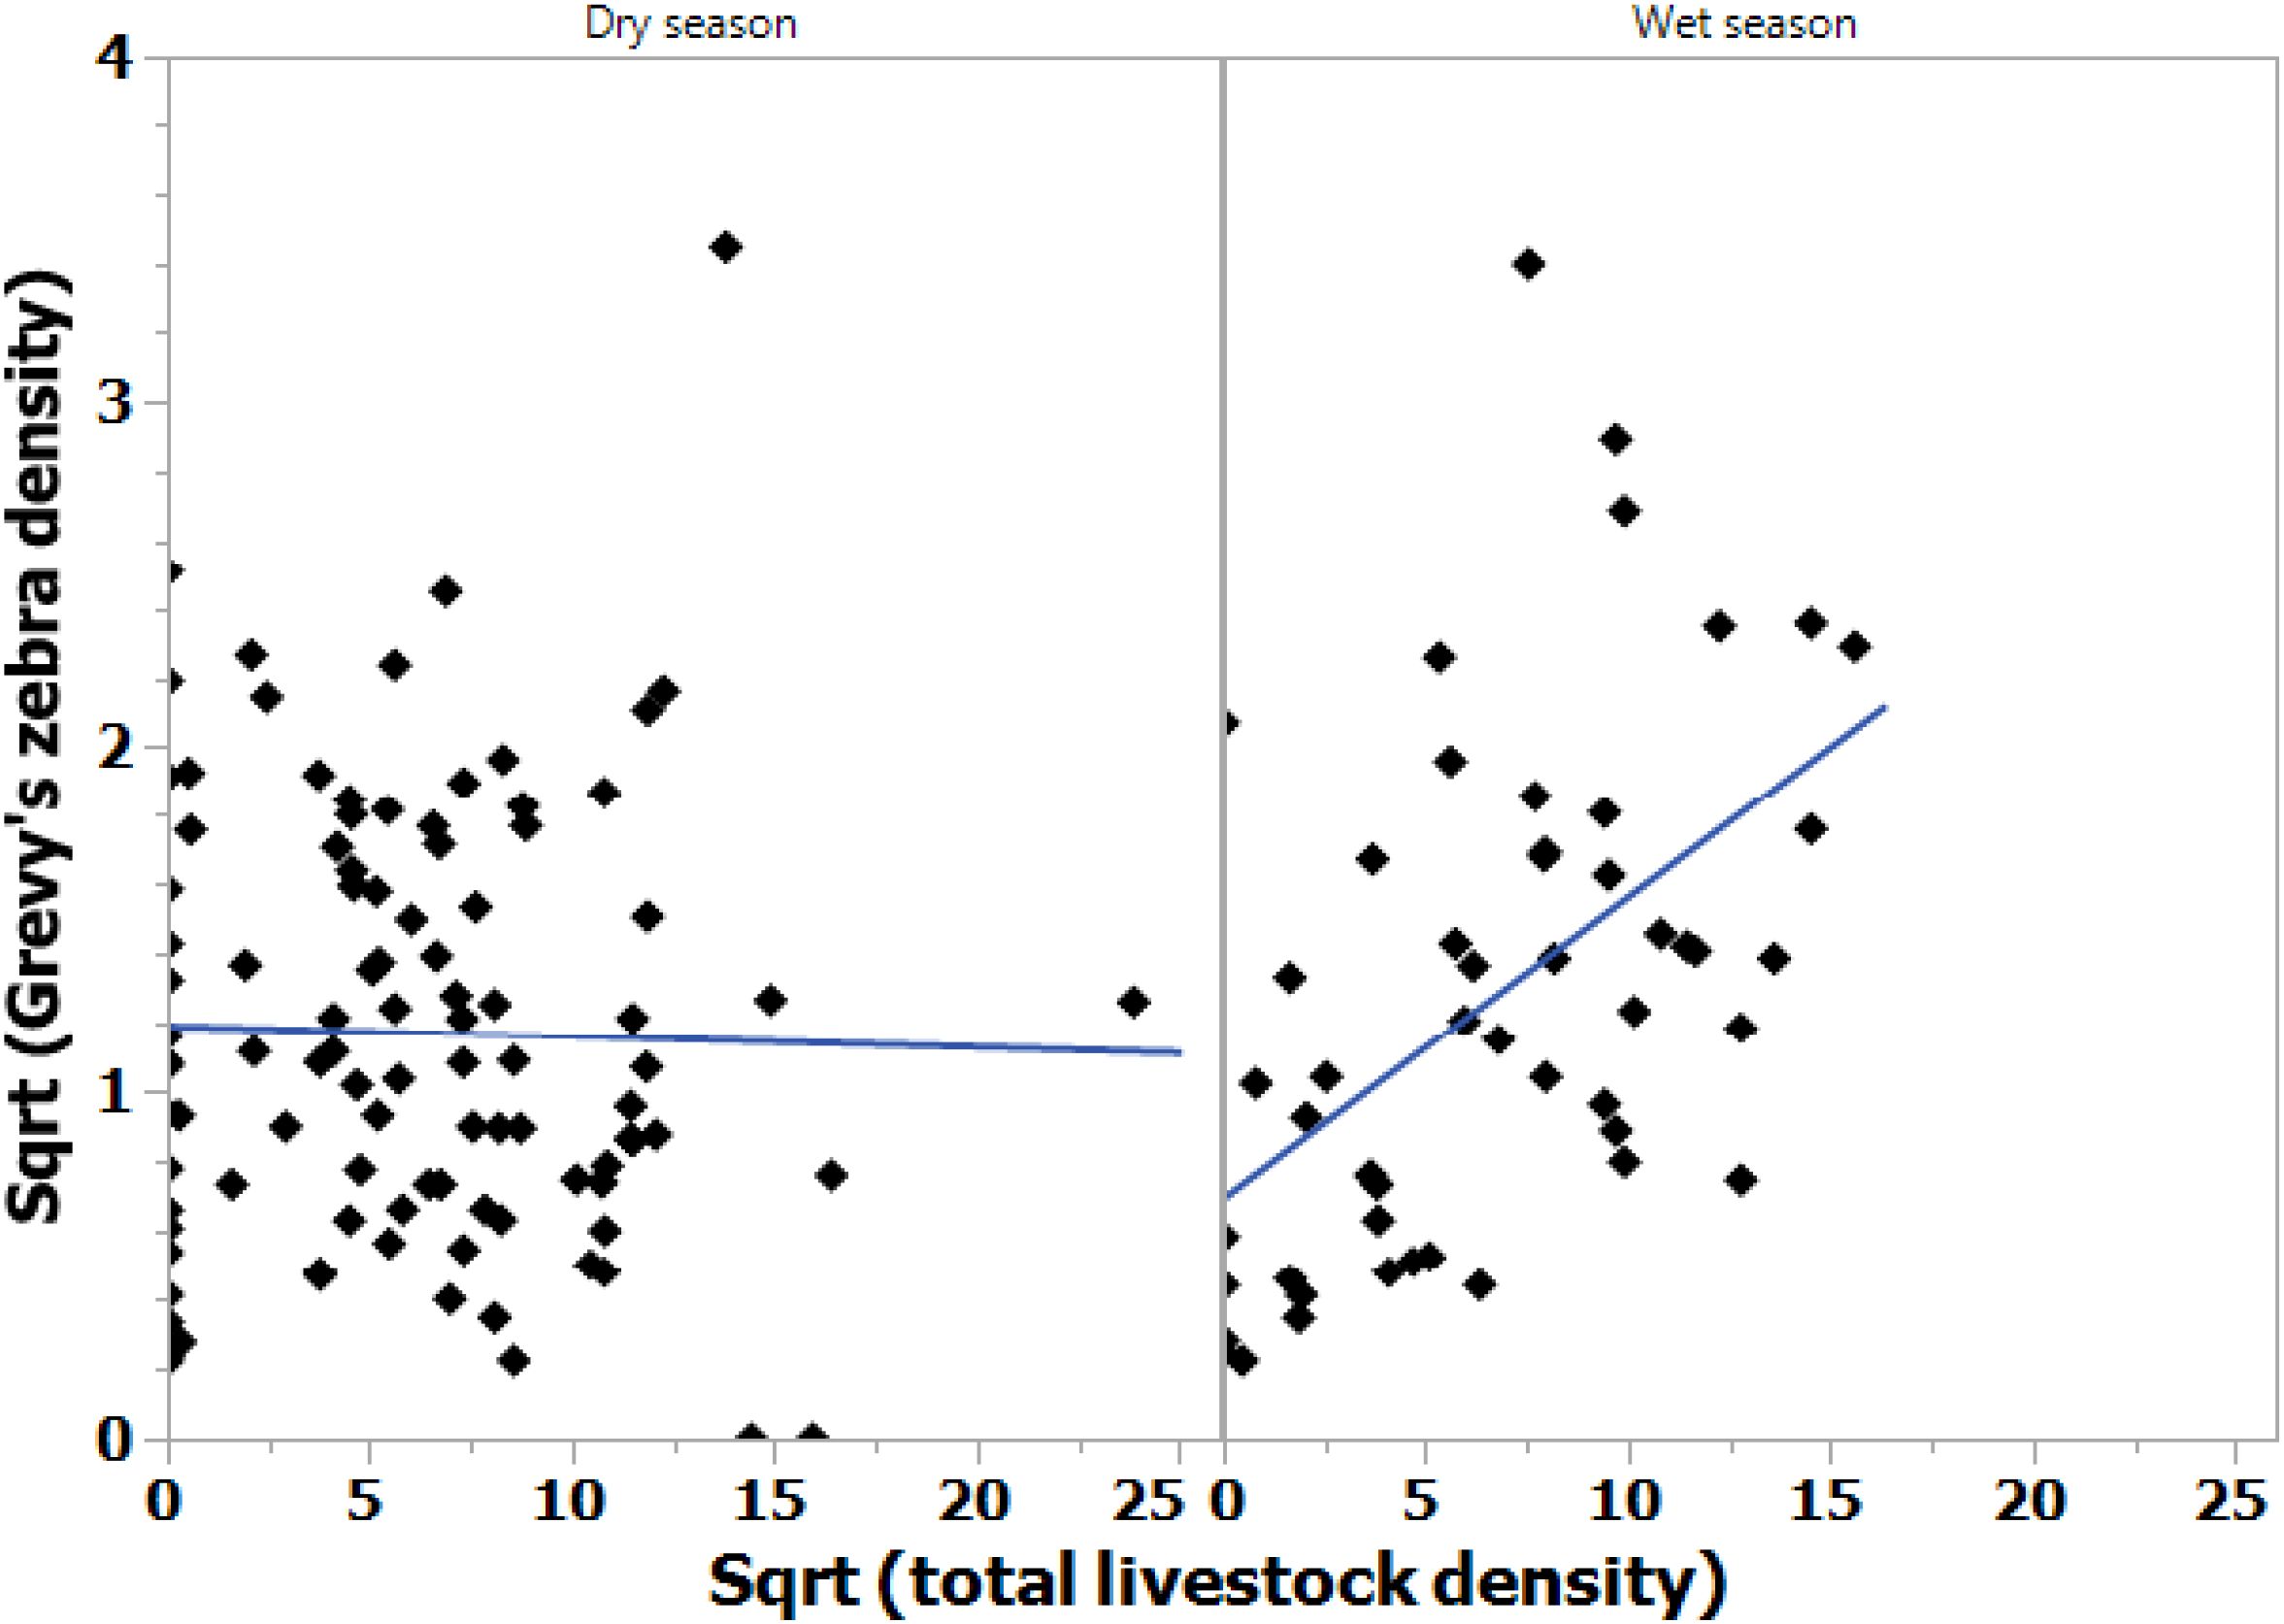
Figure 7. Grevy’s zebra densities increased with livestock densities during the wet seasons [Y = 0.69 + 0.087X (Model ANOVA F1,49 = 18.55, p < 0.001; right graph)], but not during the dry seasons (Model ANOVA F1,96 = 0.056, p > 0.05; left graph).
Consequently, it appears that Grevy’s zebra herds aggregate on the short grass swards of pastoral lands during the growing season where grazing is heavy in CGAs, and moderately heavy on lands intended to be set aside for establishing dry season “grass banks” for wildlife (CCAs). Such intense grazing appears to stimulate the regrowth of nutritious, highly digestible vegetation.
As shown in Figure 3, during the dry season, Grevy’s zebra densities on Laikipia’s commercial ranches and conservancies as well as in the national PAs increase, significantly exceeding densities on pastoral land CGAs and CCAs (ANOVA F7,154 = 4.75; p < 0.0001). What differentiates pastoral regions from commercial ranches and National Reserves (PAs) during the dry season is no longer vegetation quality but, instead, vegetation quantity. Figure 4 shows that during the dry season, the commercial ranches (LR) and national PAs have significantly more abundant vegetation (ANOVA F3,126 = 27.49, p < 0.001) than pastoralist grazing areas (CGAs), and because Grevy’s zebras are hindgut fermenters, they can process these large volumes of senescing grass. These grass banks act as dry season magnets for Grevy’s zebras, just as the short grass swards did during the wet season.
Thus, a mosaic landscape is created because two different styles of livestock herding co-exist. During the dry season, commercial ranches provide an abundance of low-quality senescing vegetation, while during the wet season, pastoral ranches provide an abundance of highly nutritious regenerating swards of short grasses (Figure 8). Because commercial ranches maintain low stocking rates of cattle and Grevy’s zebras migrate to the pastoralist ranches during the wet season, commercial ranches create “grass banks”, thus attracting and sustaining high densities of Grevy’s zebras after the rains cease and grasses stop growing (Figure 8).
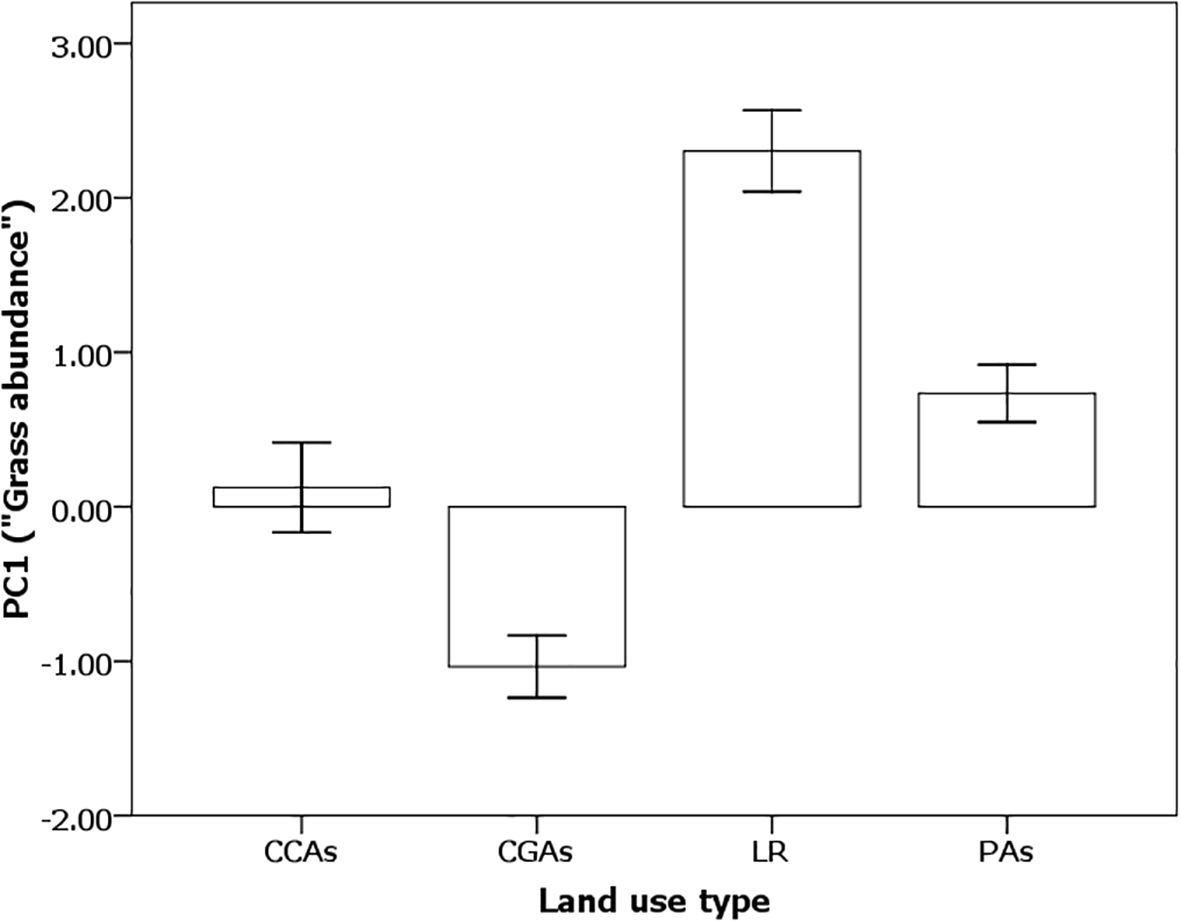
Figure 8. Principal component values for “abundance” were negative for pastoral lands (CCAs and CGAs) and positive for commercial ranches (LR) and national protected areas (PAs) during the dry season (F3,126 = 27.49, p < 0.0001). Student’s t-test LSM pairwise differences: LR > PAs = CCAs > CGAs. Errors bars represent standard error.
Influence of land use type and seasonality on Grevy’s zebra abundances by demographic and reproductive classes
Table 3 illustrates how the different demographic and reproductive classes of Grevy’s zebras occupied different land use types by season within the Samburu–Laikipia ecosystem. Overall, all reproductive classes tended to aggregate on pastoralist lands during the rainy season, generally favoring grazing areas (CGAs) over conservation areas (CCAs). During the dry season, however, different reproductive classes used these areas differentially. Territorial males were most concentrated in community grazing as well as Laikipia ranches and the PAs (ANOVA F3,97 = 6.23, p < 0.001). The density of bachelor males, however, tended to be more evenly distributed across the areas (ANOVA F3,97 = 0.14, p > 0.05) as were the density of juveniles (ANOVA F3,97 = 0.28, p > 0.05) and non-lactating females (ANOVA F3,97 = 1.00, p > 0.05), many of which would still be reproductively cycling. The density of lactating females, those needing the calories and large amounts of vegetation, remained significantly higher in CCAs and Laikipia ranches (LR) than in the other habitats that they tended to use equally (ANOVA F3,97 = 4.73, p < 0.01).
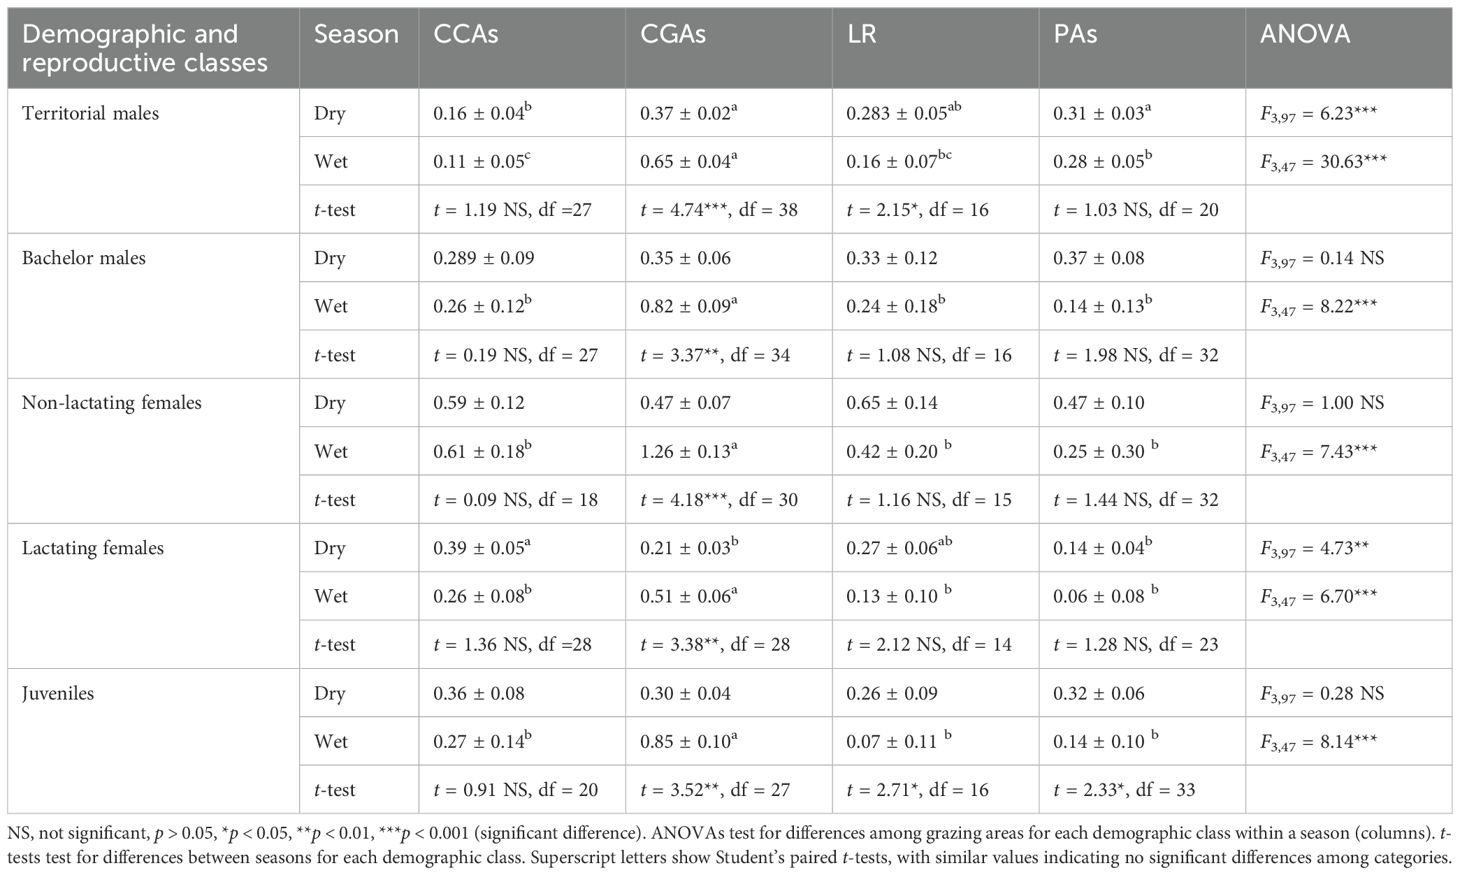
Table 3. Grevy’s zebra demographic and reproductive group’s density (#’s/km2 ± SE) variations between land use types of the Samburu–Laikipia landscape in both dry and wet seasons.
Even though dominant males typically defend territories year-round, in this ecosystem, territorial male densities showed seasonal shifts, with territorial males being highly concentrated during the wet season on pastoral grazing lands (CGAs) where both non-lactating and lactating females aggregated (Table 3). Not surprisingly, bachelor male density was also higher in these areas than elsewhere, giving them increased opportunities of mating (Table 3). During the dry season, non-lactating females, juveniles, and bachelor males spread themselves more evenly across the landscape than lactating females and territorial males, probably seeking areas where grass abundance was high or opportunities for younger, more subordinate bachelors were high. During dry periods, lactating females and territorial males were most concentrated on commercial ranches and in national and pastoral PAs where grass is abundant (Table 3).
Grevy’s zebra herd sizes
Not only did Grevy’s zebra density vary with season and land use type, so did Grevy’s zebra herd sizes too (Figure 9), with CGAs having the highest herd sizes, especially during rainy periods. Excluding solitary Grevy’s zebra (territorial males), herd sizes ranged from 2 to 32 zebras during the dry season (mean 7.99 ± 0.43 zebras/herd), while in the wet season, herd sizes were larger (mean 12.68 ± 0.98 zebras/herd), ranging from 2 to 63 individuals. The dry and wet season herd sizes were significantly different (two-tailed t-test = 4.59, p < 0.001, n = 1,019). At one point, a herd of 208 individuals was observed in West Gate Conservancy CGAs immediately after the start of a rainy season. In the dry season, herd sizes varied significantly among the land use types (ANOVA F3,92 = 3.18, p < 0.05) being larger on Laikipia ranches (LR) and in CGAs than in CCAs and national PAs (Figure 9). Despite the fact that dominant males typically defend territories year-round, in this ecosystem, territorial male densities showed seasonal shifts with territorial males being highly concentrated during the wet season on pastoral grazing lands where both lactating and non-lactating females aggregated (Table 3).
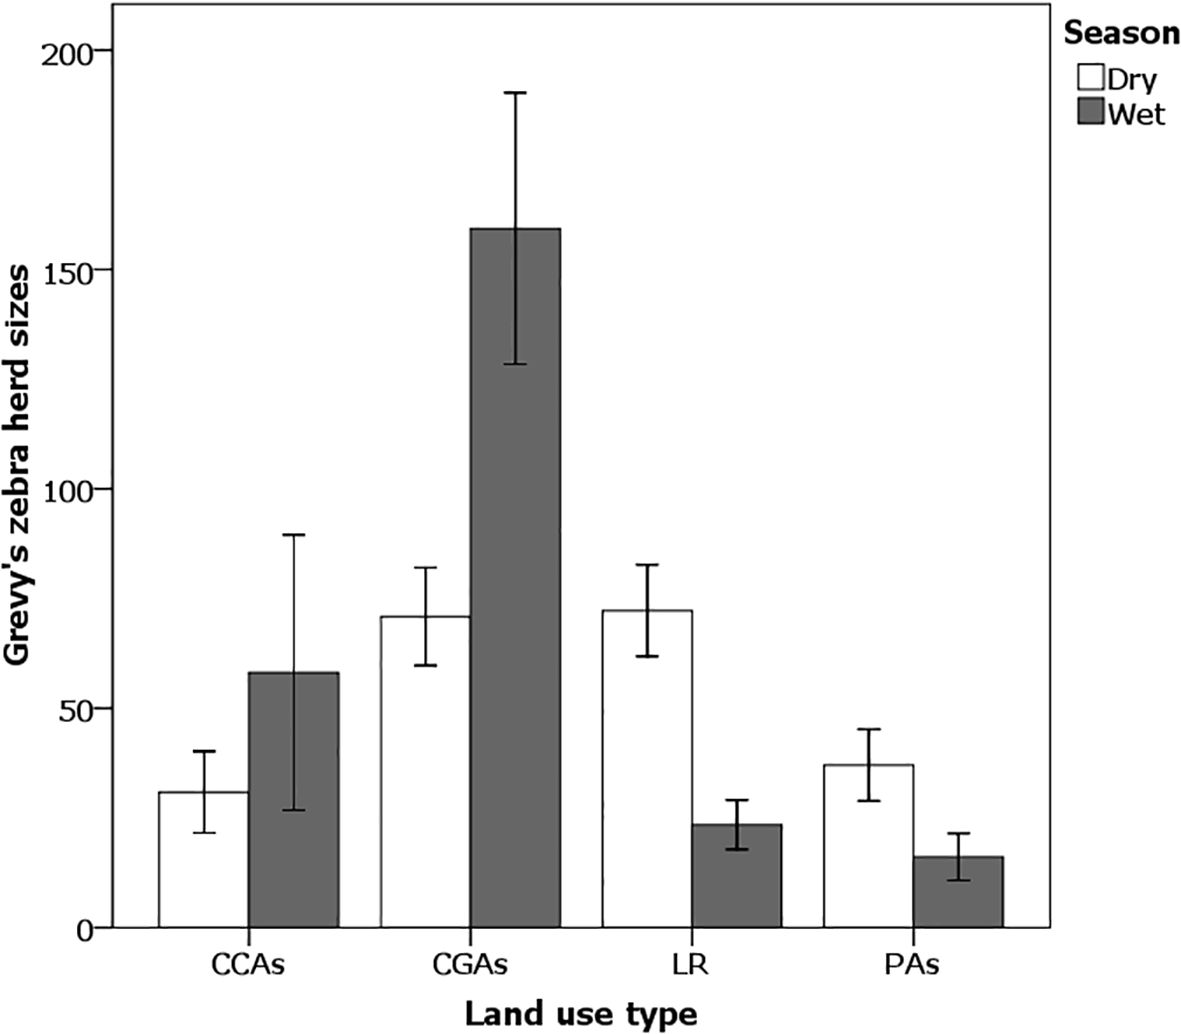
Figure 9. Seasonal variations in Grevy’s zebra herd size over different land use types on the Samburu–Laikipia landscape. Effect tests: Wet season × Land use (ANOVA F3,42 = 9.43, p < 0.01) and in the dry season (ANOVA F3,92 = 3.18, p < 0.05). Student’s t pairwise difference comparisons: Wet season (CGAs > LR = CCAs = PAs); Dry season (LR= CGAs > PAs = CCAs). Errors bars represent standard error.
Not surprisingly, bachelor male density was also higher there than elsewhere, giving them increased opportunities of mating. During the dry season, non-lactating females, juveniles (Table 3), and bachelor males spread themselves more evenly across the landscape than lactating females and territorial males. During dry periods, lactating females and territorial males were most concentrated on commercial ranches and in national and pastoral PAs.
During the wet season, herd sizes also varied significantly between the land use types (ANOVA F3,42 = 9.43, p < 0.001) with CGAs having the highest numbers on average (159.32 ± 30.93 zebras/herd), differing significantly from CCAs (58.13 ± 31.36 zebras/herd), PAs (16.11 ± 5.63 zebras/herd), and LR (23.43 ± 5.62 zebras/herd). Overall, the largest herds of Grevy’s zebra occurred during the rains when the rate of grass growth was high, even if the standing crop or height was low (Figure 9).
Discussion
The distribution and abundance of large herbivores are generally dependent on prevailing climate, interspecific biotic interactions, and human land use activities (du Toit, 1995; Bergstrom and Skarpe, 1999; Illius and O’Connor, 2000; Groom and Harris, 2009). Human activities themselves vary depending on how land is valued, thus imposing dynamic challenges for wildlife, which share these lands with people. In the wet season, higher herd sizes and densities of Grevy’s zebra were observed on pastoralist lands, especially in grazing areas. Principal component analyses showed that these areas scored high in “grass quality”. During dry periods, however, Grevy’s zebras were more sparsely distributed on these lands. Instead, they aggregated on commercial ranches such as Mpala and Ol Jogi and in National PAs, such as Buffalo Springs and Samburu National Reserves, where principal component analyses showed that grass “abundance” was high.
In many fission–fusion societies, like that of Grevy’s zebra (Ginsberg, 1988; Rubenstein, 1986; 1994), it is expected that individuals come together during times of resource abundance and form large herds that eventually split up during times of resources scarcity. During the wet season, we observed large herds, some comprising 200 individuals, whereas during the dry season, herds were smaller with few exceeding 60 individuals. While ecologists have tried to enumerate the benefits of living in large herds [see Rubenstein (1978), Fryxell and Sinclair (1988), and Juanica (2009)], for Grevy’s zebras that live in arid and semi-arid environments, large herds can only be sustained when resources are abundant and regenerating. Otherwise, large herds will fission unless populations can find large patches of underutilized vegetation. Though intraspecific competition for food and water is minimized in hind gut fermenting bulk feeders (Rubenstein, 2010), even during times of scarcity, competition does occur. Thus, splitting into small units and dispersing over a wider area during the dry periods when searching for underutilized vegetation may help reduce competition, especially among non-lactating females, bachelor males, and juveniles, which, in the Samburu–Laikipia ecosystem, often associate together (Tombak et al., 2025). Social flexibility with periodic tearing and re-stitching of the social fabric, as has occurred during this study, was driven by seasonal changes in resource availability (Wittemeyer et al., 2005; Rubenstein, 2010). What is novel about this study is that Grevy’s zebras, by virtue of their large body size, are able to move economically over large distances, thus enabling them to move to areas where they can benefit from the “green up” created by heavy livestock grazing during rainy periods (Schieltz and Rubenstein, 2016). Later, when these areas are no longer productive, Grevy’s zebras can move back to commercial ranches or PAs where reduced levels of livestock grazing have enabled the growth of forage that can be consumed during dry periods. As a result, Grevy’s zebras oscillate between areas of high biomass reserves during dry periods and less abundant, but rapidly growing swards, on pastoralist lands during wet periods.
Not surprisingly, different Grevy’s zebra reproductive classes also behaved differently in response to seasonal changes in rainfall and land use patterns because they differ in their physiological needs and susceptibility to predation as shown by Ginsberg (1988); Rubenstein (1994); Ruckstuhl and Neuhaus (2002); Sundaresan et al. (2007), and Kirathe et al. (2023). During the wet season, almost all Grevy’s zebra reproductive classes preferred pastoralist grazing areas like those found on Ngaroni, West Gate, and Sessia–Barsalinga community lands where water and food were abundant. During dry periods, however, differences among demographic classes emerged. Territorial males, lactating females, and their foals congregated in the CCAs of Oldonyiro, Kipsing, Sessia–Barsalinga, and Ngaroni while bachelor males, non-lactating females, and juveniles distributed themselves more evenly across the landscape. These differences emerge because dominant territorial males (Rubenstein, 2010) own territories near permanent water, limiting their movements and attracting lactating females and their young foals because of their high demands for drinking water as demonstrated by Rubenstein (1986). From there, females with young foals can wander within territories in search of areas rich in biomass to provide calories to nourish young foals. Other reproductive classes, less dependent on drinking water daily, wander farther and wider in search of abundant food during dry the season (Rubenstein, 2010) resulting in differences in habitat associations (Kirathe et al., 2023). Generally, different physiological demands are heightened during dry periods (Gersick and Rubenstein, 2017) as our findings shows for Grevy’s zebras.
In the past, while studying wildlife movements in PAs and less densely populated areas, Coe et al. (1976); East (1984); Owen-Smith and Ogutu (2003), and Ogutu et al. (2008) have shown that increases in rainfall directly increase vegetation productivity, leading to increases in large herbivore abundance. However, on shared landscapes where people living at relatively high densities and wildlife co-exist, the relationship is modulated by human land use practices. When different land use strategies create a mosaic consisting of areas in the wet season that are highly productive and areas in the dry season with abundant stocks of dry season vegetation, then large-bodied species, for which weight-specific costs of transport are low, can rotate among these areas seasonally. By accessing areas of high productivity when grass is growing and abandoning them when the swards are too short for efficient biting, then moving to dense grass banks, Grevy’s zebras can meet their nutritional needs throughout a year on mosaic landscapes where predation risks are low and proportional to numerical abundance (O’Brien et al., 2018). As long as the rains return seasonally to areas previously heavily grazed and rejuvenate the vegetation, then large-bodied species such as the Grevy’s zebra can return to them when the grass banks become exhausted, or when vegetation within them becomes nutritionally poor. For such a regional grazing rotation to be effective, a mosaic of habitat types must be maintained as well as corridors connecting them (Smith et al., 2022; Kirathe et al., 2023). Only in this way can a mobile, large-bodied herbivore such as the Grevy’s zebra sustain itself on a highly seasonal landscape shared with people raising livestock. While people have been perceived as the primary cause of the Grevy’s zebra’s demise in the past, our statistical findings suggest that people can become the means of reversing this trajectory.
Our study highlights the different ways in which pastoral herders and commercial ranchers together create a landscape mosaic that enables the migratory Grevy’s zebra to sustain itself on a landscape with strong seasonal spatial patterns of rainfall. The relationship between livestock and Grevy’s zebra appears to be facultative: where bovids create greener lawns that regenerate after grazing, these lawns can serve as magnets attracting and supporting large numbers of large grazing herbivores (Esmaeili et al., 2024). However, when grass regeneration ceases, Grevy’s zebras leave and return to less heavily grazed areas where Grevy’s and plains zebras as hindgut fermenters subsequently remove the stems and straw, supporting bovids that otherwise would have a hard time processing such inaccessible vegetation, and by changing the structure of the vegetation, bovids have an easier time feeding on the forbs they prefer (Odadi et al., 2011). This oscillating dynamic is very important for Grevy’s zebra conservation because they can benefit from feeding on short grass swards generated by heavy livestock grazing during the wet season. However, they can also facilitate grazing by livestock herds of local pastoralist communities (Odadi et al., 2011). This mutualism is precisely the outcome sought by the Northern Rangeland Trust (NRT, 2012) and the Grevy’s Zebra Trust (GZT) whose conservation campaigns attempt to foster tolerance of wildlife. By developing ecotourism ventures within community conservancies and wildlife scout monitoring programs, pastoralist communities earn income. However, the economic gains created by associating with Grevy’s zebras in terms of fast-growing and fatter and healthier cows (Odadi et al., 2011) are spread more widely throughout communities, thus broadening support for conserving endangered Grevy’s zebras.
The challenge now is to enlist the support of government and non-government organizations to develop policies and incentives that ensure that commercial ranchers, managers of National Reserves, and pastoralist herders will continue to work together to maintain a landscape mosaic that maintains the mutualistic interactions of wildlife and livestock. In this way, both human livelihoods and Grevy’s zebra population processes will be enhanced.
Data availability statement
The raw data supporting the conclusions of this article will be made available by the authors, without undue reservation.
Ethics statement
The animal study was approved by Princeton Univeristy IACUC. The study was also approved by Kenya Wildlife Service. The study was conducted in accordance with the local legislation and institutional requirements under the Wildlife Conservation and Management Act of Republic of Kenya (No. 4 of 2013).
Author contributions
DR: Conceptualization, Funding acquisition, Supervision, Writing – review & editing. JK: Conceptualization, Data curation, Formal Analysis, Investigation, Methodology, Writing – original draft, Writing – review & editing.
Funding
The author(s) declare financial support was received for the research and/or publication of this article. Financial support was from Princeton University and the US National Science Foundation grant (IIS-CXT) to DR.
Acknowledgments
We highly appreciate the assistance from Princeton University who provided financial support, analysis software, and field logistics, and the additional financial support provided by Rubenstein’s US National Science Foundation (NSF) grants (NSF IIS-CXT). In the field, assistance from Nicolas and Rikapo is highly appreciated. We are grateful to Mpala Ranch and Research Centre for providing a working bench. We highly acknowledge the Samburu community, the Laikipia community, and the Samburu National Reserve and Buffalo Springs National Reserve for allowing us to conduct the research on their land.
Conflict of interest
The authors declare that the research was conducted in the absence of any commercial or financial relationships that could be construed as a potential conflict of interest.
The author(s) declared that they were an editorial board member of Frontiers, at the time of submission. This had no impact on the peer review process and the final decision.
Generative AI statement
The author(s) declare that no Generative AI was used in the creation of this manuscript.
Publisher’s note
All claims expressed in this article are solely those of the authors and do not necessarily represent those of their affiliated organizations, or those of the publisher, the editors and the reviewers. Any product that may be evaluated in this article, or claim that may be made by its manufacturer, is not guaranteed or endorsed by the publisher.
References
Akaike H. (1974). A new look at the statistical model identification. IEEE Trans. Automat. Control 19, 716–723. doi: 10.1109/TAC.1974.1100705
Berger-Wolf T., Crall J., Holberg J., Parham J., Stewart C., Mackey B. L., et al. (2016). “The great grevy’s rally: the need, methods, findings, implications and next steps,” in The Great Grevy’s Zebra Rally Report. Unpublished Technical Report. doi: 10.1046/j.1365-2028.1999.00165.x
Bergstrom R. and Skarpe C. (1999). The abundance of large wild herbivores in a semi-arid savanna in relation to seasons, pans and livestock. Afr. J. Ecol. 37, 12–26.
Buckland S., Anderson D. R., and Burnham K. P. (2001). Introduction to Distance Sampling: Estimating Abundance of Biological Populations (Oxford: Oxford University Press).
Buckland S. T., Anderson D. R., Burnham K. P., and Laake J. L. (1993). Distance Sampling: Estimating Abundance of Biological Populations (London: Chapman & Hall). reprinted (1999) by Research Unit for Wildlife Population Assessment, St Andrews.
Burnham K. P. and Anderson D. R. (2002). Model Selection and Inference: A Practical Information-Theoretic Approach (New York: Springer-Verlag).
Coe M. J., Cumming D. H., and Phillipson J. (1976). Biomass and production of large African herbivores in relation to rainfall and primary production. Oecologia 22, 341–354. doi: 10.1007/BF00345312, PMID: 28308896
du Toit T. J. (1995). Determinants of the composition and distribution of wildlife communities in southern Africa. Ambio 24 (1), 2–6. doi: 10.1046/j.1365-2648.1995.21010164.x, PMID: 7897070
East R. (1984). Rainfall, soil nutrient status and biomass of large African savanna mammals. Afr. J. Ecol. 22, 245–270. doi: 10.1111/j.1365-2028.1984.tb00700.x
Esmaeili S., Hemami M. R., Kaczensky P., Schoenecker K. A., King S. R., Shahriari B., et al. (2024). Rainfall reduces the potential for competitive suppression of a globally endangered ungulate by livestock. Biol. Conserv. 292, 110476. doi: 10.1016/j.biocon.2024.110476
Estes R. D. (1997). “The behaviour guide to african mammals,” in Russel Friedman Books (USA: Russel Friedman Books).
Fretwell S. D. and Lucas H. L. (1970). On territorial behavior and other factors influencing habitat distribution in birds. Acta Biotheoretica 19, 16–36. doi: 10.1007/BF01601953
Fryxell J. M. and Sinclair A. R. E. (1988). Seasonal migration by white-eared kob in relation to resources. Afr. J. Ecol. 26, 17–31. doi: 10.1111/j.1365-2028.1988.tb01125.x
Gersick A. S. and Rubenstein D. I. (2017). Physiology modulates social flexibility and collective behaviour in equids and other large ungulates. Phil. Trans. R. Soc B 372. doi: 10.1098/rstb.2016.0241, PMID: 28673917
Ginsberg J. (1988). Social organization and mating strategies of an arid adapted equid: the Grevy’s zebra. (Unpublished Thesis). (Princeton University).
Grimsdell J. J. R. (1973). Age determination of the African buffalo, Syncerus caffer Sparrman. Afr. J. Ecol. 11 (1), 31–53.
Groom R. and Harris S. (2010). Factors affecting the distribution patterns of zebra and wildebeest in a resource-stressed environment. Afr. J. Ecol. 48, 159–168. doi: 10.1111/j.1365-2028.2009.01097.x
Illius A. W. and O’Connor T. G. (2000). Resource heterogeneity and ungulate population dynamics. Oikos 89, 283–294. doi: 10.1034/j.1600-0706.2000.890209.x
Jaetzold R. and Schmidt H. (1983). Farm Management Handbook of Kenya, Vol. II/B (Central Kenya: Ministry of Agriculture, Nairobi).
Jones P. G. J. (2011). Monitoring species abundance and distribution at the landscape scale. J. Appl. Ecol. 48, 9–13. doi: 10.1111/j.1365-2664.2010.01917.x
Juanica E. O. D. (2009). Herding tendency as an aggregating factor in a binary mixture of social entities. Ecol. Model. 220, 3521–3526. doi: 10.1016/j.ecolmodel.2009.06.030
Kirathe J. N., Githaiga J. M., Chira R. M., and Rubenstein I. D. (2023). Habitat selection by Grevy’s zebra (Equus grevyi): Conservation Implications. Afr J. Ecol. 1, 1–16. doi: 10.1111/aje.13229
Kramer C. Y. (1956). Extension of multiple range tests to group means with unequal numbers of replications. Biometrics 12, 309–310. doi: 10.2307/3001469
Moehlman P. D., Rubenstein D. I., and Kebede F. (2008). Equus grevyi. In: IUCN 2011. IUCN Red List of Threatened Species. Version 2011.2. Available online at: https://www.iucnredlist.org/apps/redlist/details/7950/0
Norton-Griffiths M. (1978). Counting animals (No. 1). Serengeti Ecological Monitoring Programme, African Wildlife Leadership Foundation.
O’Brien T. G., Kinnaird M. F., Ekwanga S., Wilmers C., Williams T., Oriol-Cotterill A., et al. (2018). Resolving a conservation dilemma: Vulnerable lions eating endangered zebras. PloS One 13, e0201983. doi: 10.1371/journal.pone.0201983, PMID: 30157200
Odadi W. O., Karachi M. K., Abdulrazak S. A., and Young P. T. (2011). African wild ungulates compete with or facilitate cattle depending on season. Science 333, 1753–1755. doi: 10.1126/science.1208468, PMID: 21940896
Ogutu J. O., Piepho H.-P., Dublin T. H., Bhola N., and Reid S. R. (2008). Rainfall influences on ungulate population abundance in the Mara-Serengeti ecosystem. J. Anim. Ecol. 77, 814–829. doi: 10.1111/j.1365-2656.2008.01392.x, PMID: 18422558
Oustalet E. (1882). Une nouvelle espece de Zebre. Le Zebre de Grevy (Equus grevyi). La Nature Paris 10, 12–14.
Owen-Smith N., Mason R. D., and Ogutu J. O. (2005). Correlates of survival rates for 10 African ungulate populations: density, rainfall and predation. J. Anim. Ecol. 74, 774–788. doi: 10.1111/j.1365-2656.2005.00974.x
Owen-Smith N. and Ogutu J. O. (2003). “Rainfall influences on ungulate population dynamics,” in The Kruger Experience: Ecology and Management of Savanna Heterogeneity. Eds. du Toit J., Rogers K., and Biggs H. C. (Island Press, Washington, DC, USA), 310–331.
Pratt D. J., Greenway P. J., and Gwynne M. D. (1966). A classification of East African rangeland, with an appendix on terminology. J. Appl. Ecol. 3, 369–382. doi: 10.2307/2401259
Pratt D. J. and Gwynne M. D. (1977). Range Management and Ecology in East Africa (London: Hodderand Stuoghton).
Richie E. G., Martin K. J., Krockenberger K. A., Garnett S., and Johnson N. C. (2008). Large-herbivore distribution and abundance: Intra- and interspecific niche variation in the tropics. Ecol. Monogr. 78, 105–122. doi: 10.1890/06-2117.1
Ritchie G. E., Martin K. J., Johnson N. C., and Fox J. B. (2009). Separating the influences of environment and species interactions on patterns of distribution and abundance: competition between large herbivores. J. Anim. Ecol. 78, 724–731. doi: 10.1111/j.1365-2656.2008.01520.x, PMID: 19175695
Rubenstein D. I. (1978). “On predation, competition, and the advantages of group living.” in Social behavior, (Boston, MA: Springer US), 205–231.
Rubenstein D. I. (1986). “Ecology and sociality in horses and zebras,” in Ecological Aspects of Social Evolution. Eds. Rubenstein D. I. and Wrangham R. W. (Princeton University Press, Princeton), 282–302.
Rubenstein D. I. (1994). “The ecology of female social behavior in horses, zebras, and asses,” in Animal Societies: Individuals, Interactions, and Organization. Eds. Jarman P. and Rossiter A. (Kyoto University Press, Kyoto (Japan), 13–28.
Rubenstein D. I. (2010). “Ecology, social behavior, and conservation in zebras,” in Advances in the Study Behavior: Behavioral Ecology of Tropical Animals, vol. 42 . Ed. Macedo R. (Elsevier Press, Oxford, UK), 231258.
Rubenstein D. I., Low M. B., Davidson Z. D., Kebede F., and King S. R. B. (2016). “Equus grevyi,” in The IUCN Red List of Threatened Species 2016. (IUCN Global Species Programme, the IUCN Species Survival Commission (SSC) and the IUCN Red List Partnership; Gland, Switzerland.) doi: 10.2305/IUCN.UK.2016-3.RLTS.T7950A89624491.en
Ruckstuhl K. E. and Neuhaus P. (2002). Sexual segregation in ungulates: a comparative test of three hypotheses. Biol. Rev. 77, 77–96. doi: 10.1017/S1464793101005814. Cambridge Philosophical Society., PMID: 11911375
Schieltz J. M. and Rubenstein D. I. (2016). Evidence based review: Positive versus negative effects of livestock grazing on wildlife. What do we really know? Environ. Res. Lett. 11, 113003. doi: 10.1088/1748-9326/11/11/113003
Scholes R. J. and Archer S. R. (1997). Tree-grass interactions in savannas. Ann. Rev. Ecol. Syst. 28, 517–544. doi: 10.1146/annurev.ecolsys.28.1.517
Smith C. V., Gilbert T. C., Woodfine T., Kraaijeveld A., Chege G., Kimiti D., et al. (2022). Population and habitat connectivity of Grevy’s zebra Equus grevyi, a threatened large herbivore in degraded rangelands. Biol. Conserv. 274, 109711. doi: 10.1016/j.biocon.2022.109711
Sundaresan R. S., Fischhoff R. I., Helen M., Hartung M. H., Akilong P., and Rubenstein R. I. (2007). Habitat choice of Grevy’s zebras (Equus grevyi) in Laikipia, Kenya. Afr. J. Ecol. 46 (3), 359–364. doi: 10.1111/j.1365-2028.2007.00848.x
Thomas L., Buckland S. T., Rexstad E. A., Laake J. L., Strindberg S., Hedley S. L., et al. (2010). Distance software: design and analysis of distance sampling surveys for estimating population size. J. Appl. Ecol. 47, 5–14. doi: 10.1111/j.1365-2664.2009.01737.x, PMID: 20383262
Tombak K. J., Nonnamaker L., Parham J. R., Stewart C. V., Warungu R., and Rubenstein D. I. (2025). Darwin’s hostile forces shape social scaling in equids: a comparison of group size dynamics in Grevy’s and plains zebras. Anim. Behav. 224, 123158. doi: 10.1016/j.anbehav.2025.123158
Tukey J. (1953). “A problem of multiple comparisons,” (Princeton University). Dittoed manuscript of 396 pages. 16 (2), 88–97.
Vesey-FitzGerald D. F. (1960). Grazing succession among East African game animals. J. Mammal. 41, 161–172. doi: 10.2307/1376351
Williams S. D. (1998). Grevy’s zebra: Ecology in a Heterogeneous Environment. Zoological Society of London, London.
Williams S. D. (2002). “Status and action plan for Grevy’s zebra (Equus grevyi),” in Zebras, Asses and Horses. Ed. Williams P. D. (IUCN, Gland, Switzerland and Cambridge), 11–27.
Wittemeyer G., Douglas-Hamilton I., and Getz W. M. (2005). The socioecology of elephants: analysis of the processes creating multitiered social structures. Anim. Behav. 69, 1357–1371. doi: 10.1016/j.anbehav.2004.08.018
Keywords: distance sampling, density, grazing, movements, pastoralist, Grevy's zebras, grass banks, mosaic landscapes
Citation: Kirathe JN and Rubenstein DI (2025) Conservation of the endangered Grevy’s zebra: the influence of land use patterns on distribution and abundance in the Samburu–Laikipia landscape, Kenya. Front. Conserv. Sci. 6:1582057. doi: 10.3389/fcosc.2025.1582057
Received: 23 February 2025; Accepted: 08 July 2025;
Published: 15 August 2025.
Edited by:
Saeideh Esmaeili, Colorado State University, United StatesReviewed by:
Timothy C. Haas, University of Wisconsin–Milwaukee, United StatesDipanjan Naha, Cheetah Conservation Fund, Namibia
Copyright © 2025 Kirathe and Rubenstein. This is an open-access article distributed under the terms of the Creative Commons Attribution License (CC BY). The use, distribution or reproduction in other forums is permitted, provided the original author(s) and the copyright owner(s) are credited and that the original publication in this journal is cited, in accordance with accepted academic practice. No use, distribution or reproduction is permitted which does not comply with these terms.
*Correspondence: Daniel I. Rubenstein, ZGlyQHByaW5jZXRvbi5lZHU=
 Joseph Nderitu Kirathe
 Daniel I. Rubenstein