 Nishan Baral
 Suraj Joshi
 Nitant Rai3
- 1Institute of Forestry, Tribhuwan University, Kathmandu, Nepal
- 2Global Institute for Interdisciplinary Studies, Kathmandu, Nepal
- 3Virginia Polytechnic Institute and State University, Forest Resources and Environmental Conservation, Blacksburg, VA, United States
- 4Bird Conservation Nepal, Kathmandu, Nepal
- 5Institute of Forestry, School of Forestry and Natural Resource Management, Tribhuwan University, Kathmandu, Nepal
Nepal has a total of nine species of vultures. White-rumped vulture, Gyps bengalensis, is distributed throughout South Asian countries. It is mostly confined to tropical and sub-tropical regions. South Asian countries have recorded a decline of more than 97% of three resident species, including the white-rumped vulture, since the mid-1990s. The study focused on predicting the breeding habitat suitability of white-rumped vultures in the Nawalparasi East and Rupandehi districts in the central lowland of Nepal, where vulture restaurants have been operating. The site visit for the study was conducted in December–January 2021. A total of 52 nests were recorded in the study area. Using the MaxEnt approach, the generated model resulted in a mean area under the curve (AUC) of 0.950 with a standard deviation of 0.011 and a true skill statistics (TSS) value of 0.8207, indicating good model robustness. The average of the 10 models’ “maximum test sensitivity plus specificity Cloglog threshold” value was 0.5784. Using this, a binary map was produced, and it was found that 96.88 km2 (3.82%) of the total of 2,532 km2 area was suitable breeding habitat for the white-rumped vulture. The categorical variable land use–land cover (LULC), with category “forest” with positive correlation and category “agricultural land” with negative correlation, had the highest contribution in the model building, with 50.5% contribution, so it was the most important variable for breeding habitat selection by white-rumped vulture. It was followed by biome with category “tropical subtropical grassland, savannas, and shrubland” with 21.8% and Euclidean distance from water source with 12.8% as other top contributors. The contribution of forest was attributed to the presence of suitable trees for nesting and the absence of carcasses in the open field due to the tradition of burying dead cattle, which was suggested to be the reason for the negative correlation based on various studies. Furthermore, easy detectability of carcasses in grassland and savanna, appropriate humidity for hatching of eggs, and depositing carcasses near water bodies were suggested to be major reasons for the contribution of these variables based on reviewed literature and research works. Based on these results, the study recommended that vulture management sectors focus on the management of these variables, prioritizing accordingly to conserve the white-rumped vulture.
1 Introduction
Vultures actively contribute to ecosystems, economies, and cultures and are considered to be top scavengers (Ogada et al., 2011). They perform an important role in cleaning up nature by tearing meat from carcasses before it rots, thus preventing the spread of diseases that would affect other living things (Iqbal et al., 2011). There are a total of 23 species of vultures globally, of which South Asia has a recorded presence of nine species of vultures, all of which have also been documented in Nepal (BCN and DNPWC, 2011). Among these, the white-rumped vulture (Gyps bengalensis), which is listed by the International Union for Conservation of Nature (IUCN) in the critically endangered list (BirdLife International, 2021), is found in the tropical and sub-tropical regions of Nepal (Ferguson-Lees and Christie, 2001; BirdLife International, 2021). Currently, the maximum estimated population of white-rumped vultures in Nepal is 2,000 (BCN and DNPWC, 2011; Inskipp et al., 2016), while the average population is 1,000 (Inskipp et al., 2016). They are common and widespread up to 1,000 m and appear less frequently up to 1,800 m (Grimmett et al., 2016; Inskipp et al., 2016). They breed in colonies and primarily nest in tall trees (Majgaonkar et al., 2018; Bhattacharya and Talukdar, 2024). They inhabit mostly the plains and less frequently the hilly regions and use light woodland, villages, cities, and open areas (BirdLife International, 2021).
Assessing suitable habitats and identifying the variables that affect the habitat of species are important factors in conservation ecology, and they help to create the action plan for the recovery and maintenance of the natural structure of the avian population (Habibzadeh and Ludwig, 2019; Banda and Tassie, 2018; Nursamsi et al., 2018; D’Addario et al., 2019; Kanth et al., 2020). For the avian population, the quantity and quality of available breeding habitats are important factors for their population to reproduce and thrive in nature. As available habitat decreases, so does the availability of nesting sites (Cody, 1985), which can be dangerous, especially for long-lived organisms that use the same nests for multiple consecutive years (Krüger, 2002; Krüger et al., 2015). Thus, understanding the factors affecting successful nesting is essential for designing effective wildlife management interventions (Gray, 1997; Sutherland and Green, 2004) and ex situ conservation measures, including species reintroduction (Donazar et al., 1993). To better comprehend the habitat needs of a species, modeling its habitat suitability proves to be an effective tool (Guisan and Zimmermann, 2000; Phillips et al., 2006; Drew et al., 2011; Thapa et al., 2018; Jha et al., 2020). The habitat suitability model’s goal is to define, for a specific species, the factors that best define its spatial range by identifying the environmental factors that limit its distribution (Guisan and Thuiller, 2005; Soberon and Peterson, 2005). MaxEnt is a widely used software for habitat suitability modeling, with increasing importance in conservation biology. MaxEnt uses a machine learning algorithm that is based on the principle of maximum entropy to estimate the probability distribution of species occurrence based on observation in relation to environmental variables (Norouzzadeh et al., 2018).
Nepal is one of the most important areas on Earth for raptor conservation, especially in the context of vulture declines (Prakash et al., 2012). The country, despite its small size, contains six of the 10 most critically Important Bird and Biodiversity Areas (IBAs) for raptors and contains the 10th greatest number of declining raptor species of all nations (42 species; McClure et al., 2018). In fact, the concept of Vulture Safe Feeding Zones (VSFZs) was first successfully implemented in Nepal with the establishment of the Kawasoti Jatayu restaurant (Chaudhary et al., 2010). Since then, seven VSFZs were established between 2006 and 2013 (DNPWC and DoFSC, 2023; Bhusal, 2018). These VSFZs provide safe food to vultures to reduce their likelihood of being exposed to poisoned carcasses (Chaudhary et al., 2010) and to mitigate one of the critical threats to the raptors’ survival (Ogada et al., 2011). At these sites, old and unproductive cows are collected from nearby villages and kept for at least 7 days to ensure that they are diclofenac-free, and then the cows are fed to vultures after their natural death (DNPWC and DoFSC, 2023).
In this study, we decided to select the region around the first vulture restaurant, the Kawasoti Jatayu restaurant, and another as its nearest vulture restaurant, the Gaidahawa Jatayu restaurant, to study the factors affecting the selection of breeding habitat by white-rumped vultures. Through the use of MaxEnt modeling, this study aimed to predict the breeding habitat suitability of white-rumped vultures in the Nawalparasi East and Rupandehi districts in the central lowland of Nepal, where the selected vulture restaurants have been actively working for vulture conservation. Current research (Kimsing Thungwon et al., 2022; Jha and Jha, 2021a, 2021b) has focused mostly on identifying and modeling the suitability of the general habitat of the vulture based on their presence at feeding and roosting sites and merely considers the breeding sites when predicting suitable habitats. The limited studies like those of Rana et al. (2019); Moradiya and Goswami (2021), and Majgaonkar et al. (2018) examined the breeding site of the white-rumped vulture but focused on studying the characteristics of the nesting site rather than modeling and studying variables that impact the nesting sites, like that conducted by Bhusal et al. (2020) and Bhattacharya and Talukdar (2024), which predicted other suitable habitats that could be conserved in order to broaden the option for nesting by the white-rumped vultures. Hence, our research aims to fill this gap in research by modeling the breeding habitat of the white-rumped vulture by determining the relative importance of bioclimatic, environmental, and anthropogenic variables contributing to its breeding habitat selection. The information thus obtained on the species’ current breeding habitat distribution and potential suitable habitat can provide valuable insight for management and conservation efforts, as well as support further research on the ecology of the white-rumped vulture in the study area.
2 Materials and methods
2.1 Study area
The study area was selected based on the presence of Vulture Safe Feeding Zones in the central lowland of Nepal. The study area (Figure 1) covered the Nawalparasi East (1,331 km2) and Rupandehi (1,401 km2) districts, where the Kawasoti Jatayu (vulture) restaurant and Gaidahawa Jatayu (vulture) restaurant are located, respectively. Both districts are in the Terai region of Nepal, which is located in a sub-tropical climatic zone characterized by hot and humid summers, intense monsoon rains, and dry winters (DFRS, 2014). The districts consist of a low-lying region with natural mixed hardwood forests dominated by Shorea robusta, Terminalia tomentosa, and Adina cordifolia (FRTC, 2021). The boundary of the study area was derived from the shapefile of the districts of Nepal; the local administrative political boundary of Nepal was downloaded using data provided in Nepal - Subnational Administrative Boundaries - Humanitarian Data Exchange, 2023; and the boundaries of respective districts of the study area were clipped.
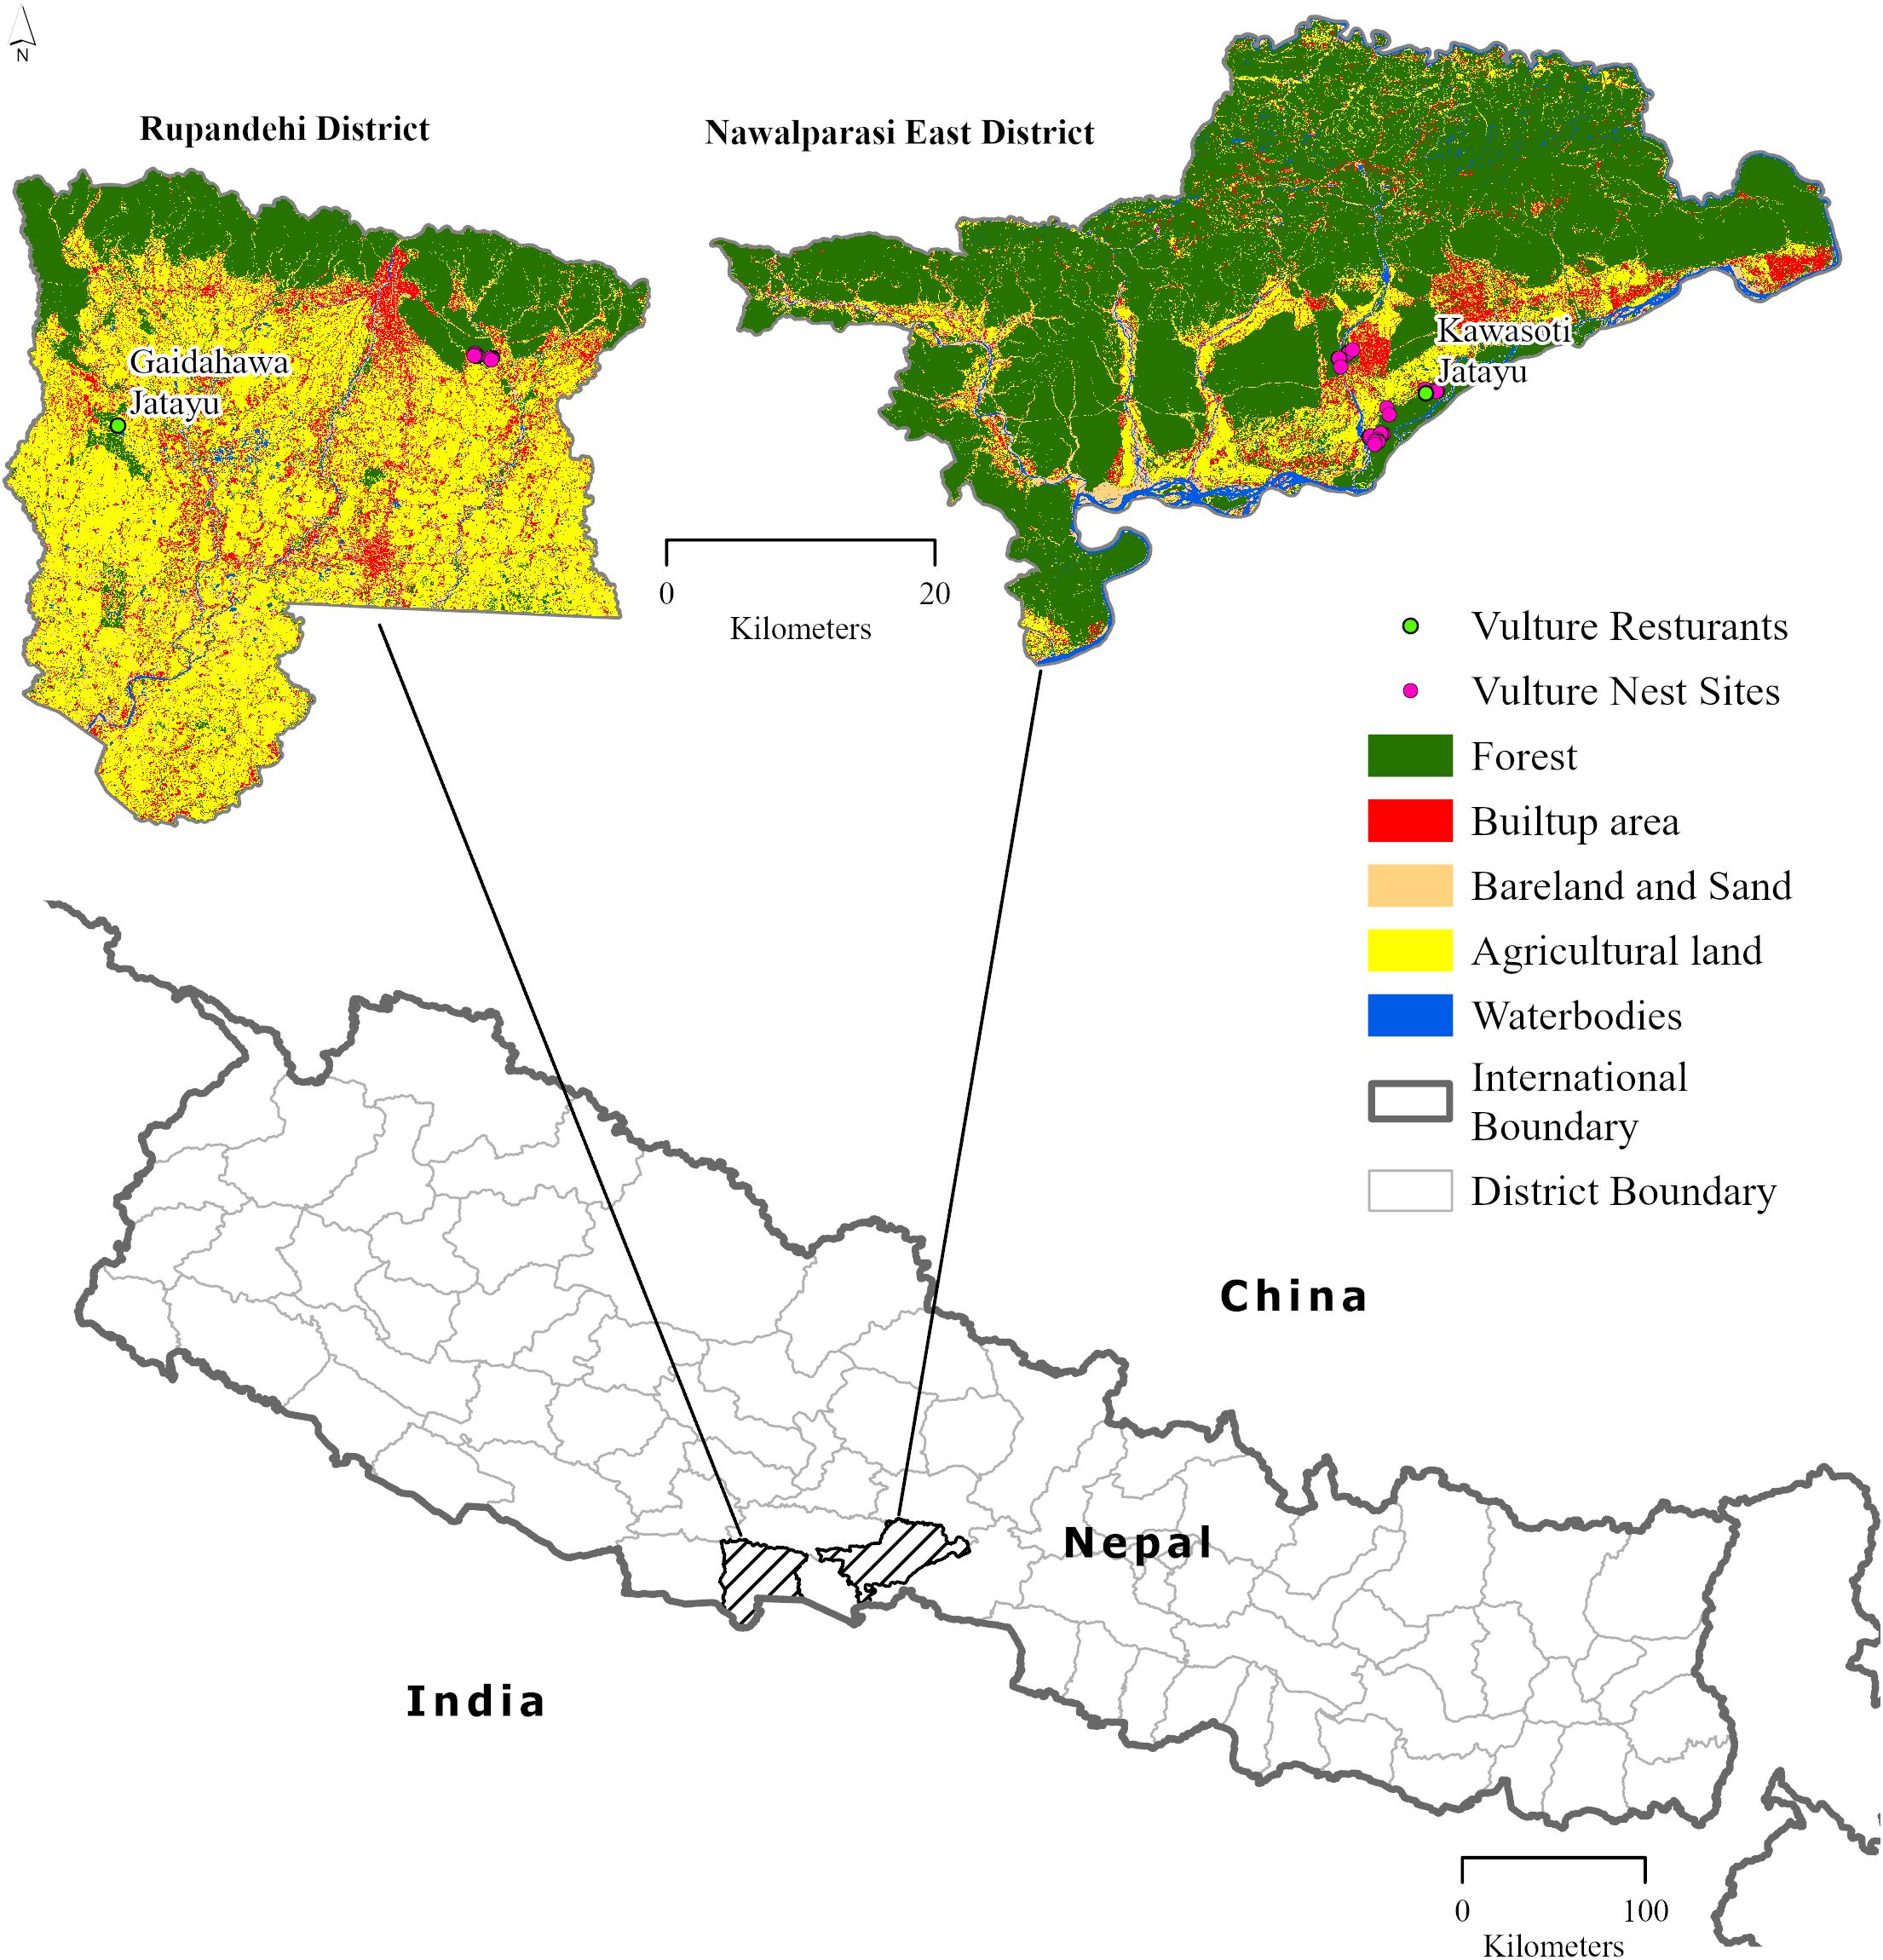
Figure 1. Study area map of research on habitat suitability of white-rumped vulture presented in the land use–land cover map.
2.2 Nesting location identification and observation
Using the white-rumped vulture breed from October to April (Baral et al., 2005), we conducted the nest observation for this study in December–January 2021, when most of the vultures had already set themselves on sitting in the nest for incubation, so that the breeding habitat can be more precisely identified.
The nesting sites were located based on the method adapted by Murn et al. (2014). They were located via a thorough search of the study area by following white-rumped vultures to their roost locations during the breeding season, when the vultures roost in their nests mostly after laying eggs. Furthermore, fresh droppings below the nesting trees were another significant mark in identifying an active nest and searching for roosting vultures. Also, members of the management committee of the Kawasoti Jatayu restaurant were used to guide us to the existing and probable nesting sites of the vulture inside the Chitwan National Park. Vulture nests and the vultures roosting in them were identified and viewed using a pair of binoculars (Bushnell NatureView 10*48) and recorded or photographed using a camera (Nikon Coolpix P900). The geographic position of all nesting trees was recorded using a hand-held GPS device (Garmin Etrex® 10), and coordinates were recorded as a single record in case of multiple nests in a single tree.
Phillips et al. (2009) suggested that the paucity of presence records for many species of interest makes discarding records unfavorable. With only 52 presence points that mostly clumped in certain areas as vultures nest in colonies (Majgaonkar et al., 2018; Bhattacharya and Talukdar, 2024), spatial filtering of presence points would leave our model with a very small number of presence points, thus reducing the precision of modeling. Therefore, with a limited number of coordinates, we opted against spatial filtering, which is generally used to reduce overfitting of the model (Boria et al., 2014), and we used all the collected nest locations for our species distribution modeling.
2.3 Nesting/breeding habitat variables
The choice of predictor variables is the central step in species distribution modeling (SDM) because the choice drives the modeled spatial distribution output (Araújo and Guisan, 2006). An organism’s habitat is the combination of the space it inhabits and all eco-factors in that space, including the abiotic environment (Yi et al., 2016). Therefore, we selected sets of variables based on various studies that suggest that the studies should be centered on bioclimatic variables (Bhusal et al., 2020) and environmental variables such as the topography and land use–land cover of the region (Jha and Jha, 2021a). These variables also affect food availability, thus affecting the habitat selection by vultures (Margalida et al., 2007; Krüger et al., 2015; KC et al., 2019). Guided by variables used in these studies, we decided to select the following variables to model the breeding habitat suitability of the white-rumped vulture.
The 19 bioclimatic variables of 30 arc-sec (~1 km) that represent the climatic factors derived from monthly temperature and precipitation data and aggregated across the temporal range of 1970 to 2000 (Fick and Hijmans, 2017) were downloaded from www.worldclim.org. To find the influence of land use and land cover, raster images of 30-m ground resolution of all the bands from Landsat8–9 OLITIRS C2 L2 from 14 to 19 October 2021, which were the images from the nearest date to field visit for study with the least cloud cover, were downloaded from the United States Geological Survey (USGS) via the Earth Explorer portal [Earth Resources Observation and Science (EROS) Center, 2020]. They were used to develop a land use–land cover (LULC) map (Figure 1) of the study area using a random tree classification technique, which is one of the most widely used techniques (Rodriguez-Galiano et al., 2012; Gislason et al., 2006). It was built with an accuracy of 97.2%, which was calculated using a confusion matrix that provides a class-by-class breakdown of the number of accurate and inaccurate predictions made by a classifier to reveal the classifier’s performance (Swaminathan and Tantri, 2024). Furthermore, an Normalized Difference Vegetation Index (NDVI) raster image of the study area was also created using the raster calculator tool in ArcMap 10.8 with the same set of satellite images that were used to develop the LULC map. Euclidean distance from the road, water source, and from VSFZs was created using the Euclidean Distance tool in ArcMap 10.8 with the shapefile of the major highways and waterways of Nepal provided by Humanitarian Data Exchange (Humanitarian Data Exchange, 2015a, 2015b) and coordinates of VSFZs that were collected during the field visit. We used the globally available human footprint index dataset for 2009, which represents the relative human influence in each terrestrial biome, expressed as a percentage at a 1 km × 1 km grid level (Venter et al., 2018). Furthermore, the Digital Elevation Model was derived from the Shuttle Radar Topography Mission (SRTM) (http://earthexplorer.usgs.gov) at 30-m resolution (USGS, 2006), and elevation, slope, and aspect were prepared using respective tools in ArcMap 10.8. The shapefile of terrestrial biomes of the world was downloaded from www.worldwildlife.org/publications/terrestrial-ecoregions-of-the-world (Olson et al., 2001), clipped within the extent of the study area, and converted into a raster image using the conversion tool in ArcMap 10.8.
All the variables were projected to the WGS 1984 geographic coordinate system (GCS) and then clipped to the same extent using a shapefile of the boundary of the study area. Finally, all the layers were rescaled to ~1 arc-sec (~30-m) ground resolution. These were then converted to “ASCII” format files using ArcMap 10.8.
The total number of environmental variables was 29, but most of them were removed due to multicollinearity (Phillips et al., 2004) by following the approach suggested by Dormann et al. (2013) to minimize collinearity and thus the overfitting of the model. Predictors with a correlation coefficient above 7 (Pearson’s > 0.7) were eliminated. The correlation analysis for the environmental predictors was performed using the SDMtoolbox (Brown, 2014) in ArcMap 10.8 (Fourcade et al., 2014). The remaining variables were then used to build the pre-analysis model, environmental variables without any contribution to modeling were removed from the final MaxEnt model (Yang et al., 2020), and the remaining seven variables were used for final modeling.
2.4 Model building
The study used the MaxEnt approach to model the nesting habitat using the MaxEnt Graphical User Interface (GUI) (Jaynes, 1957). The model uses presence-only data and estimates the distribution of a species by identifying the probability distribution of maximum entropy across the study area (Dudík et al., 2007; Phillips et al., 2006). Presence-only data are a valuable resource and can be used to model the same ecological relationships as with presence–absence data, if the biases are dealt with satisfactorily (Elith et al., 2010). To deal with the biases, a bias file was created in ArcMap 10.8 as per the suggestion of Phillips et al. (2009), who wrote an approach to reduce overfitting by manipulating the background data. Hence, the research by Ferrier (2002) was followed, which stated that if presence data are only taken from easily surveyed portions of the study region, then background data should be taken from the same areas. This is because if the species occupies particular habitats within the sampled space, the MaxEnt model will highlight these habitats rather than just areas that are more heavily sampled. Therefore, a bias file was created based on the presence records of the vultures overlaid with a shapefile of all the municipalities of the study area so that the pseudo-absences are taken from the same areas as the presence. Furthermore, the default random background selection point of 10,000 was created within this bias file as per the suggestions by Phillips and Dudik (2008) and further rectified by Barbet-Massin et al. (2012), who found that predictive accuracy was higher with approximately 10,000 background pseudo-absences for modeling using MaxEnt.
Anderson and Gonzalez (2011) stated that the quality of MaxEnt’s output depends on the optimization or adjustment of various parameters within MaxEnt’s settings. Akaike’s information criterion (AIC) determines the fitness of the model statistically, and the model with the lowest delta AICc is the best fit model. Therefore, the delta AICc value was estimated using the “ENMevaluate” command in RStudio (Muscarella et al., 2014; Warren and Seifert, 2011), and the values of other parameters associated with the lowest delta AICc were selected and used in the MaxEnt setting. In the MaxEnt GUI, three parameters (linear, quadratic, and hinge features) were combined under the feature combination suggested by the AICc value, and the “cloglog” output format was selected. The option of showing the exponent in the response curve was selected for easier interpretation of the response curve. Additionally, other setting parameters were optimized: random test percentage set to 25%, regularization multiplier set to 4 as per the AICc value, and maximum iteration set to 5,000 times. Bootstrap replication run type was selected with replicates set to 10. The jackknife test was selected to regularize the training gain for variable importance. The MaxEnt software produced a continuous probability distribution of the species’ habitat, along with different threshold options for distinguishing between suitable and unsuitable areas. There are different threshold choices to distinguish suitable habitats from unsuitable ones, and for this study, the chosen threshold was the “maximum test sensitivity plus specificity logistic threshold”, with the output format being “cloglog”. This enhanced the discrimination ability of the presence-based distribution based on the background points. This choice was based on the research by Jiménez-Valverde and Lobo (2007) and Liu et al. (2013).
2.5 Model evaluation
The robustness of the models was analyzed as per the value of model evaluators called area under the curve (AUC) and true skill statistics (TSS).
The area under the receiver operating characteristic curve is a threshold-independent metric that measures the ability of a binary classifier to discriminate between positive and negative classes. AUC values range from 0 to 1, where 0.5 indicates that the performance is no better than random prediction, and values closer to 1 signify excellent discriminatory performance (Hanley and McNeil, 1982). For the purpose of model evaluation by AUC, various classifier ranges given by previous researchers are as follows: AUC (<0.6 = fail, 0.61–0.7 = poor, 0.71–0.8 = fair, 0.81–0.9 = good, and 0.91–1.00 = excellent; Swets, 1988; Elith et al., 2002; Heikkinen et al., 2006; Duan et al., 2014; Raina et al., 2014). The MaxEnt GUI provided the AUC value.
TSS is a widely used metric to evaluate the performance of binary classification models, especially in ecological niche modeling and species distribution modeling. It is calculated as the sum of sensitivity (true positive rate) and specificity (true negative rate) minus one:
TSS = Sensitivity + Specificity – 1.
TSS ranges from −1 to +1, where +1 indicates perfect agreement between observed and predicted classifications, 0 indicates performance no better than random, and negative values indicate worse than random prediction. It is preferred because it is independent of prevalence (i.e., proportion of presences to absences) and balances omission and commission errors (Allouche et al., 2006). We calculated TSS using RStudio (Posit team, 2025) with the pROC package (Robin et al., 2011).
2.6 Data analysis
The MaxEnt software provides maps in “.asc” format, which were then converted to a raster file using ArcMap 10.8; then, a binary reclassification based on the threshold given by the average of the 10 models’ “maximum test sensitivity plus specificity Cloglog threshold” value was conducted; and the suitable breeding area as predicted by MaxEnt was calculated using ArcMap 10.8. Data were interpreted and analyzed based on the output of the modeled raster map, response curve, and percent contribution of variables based on the result of the jackknife analysis.
3 Results
3.1 Model evaluation
The generated model of the white-rumped vulture in the study area resulted in a mean AUC of 10 replicated runs of 0.950 with a standard deviation of 0.011 (Figure 2) and a mean TSS of 10 replicated runs of 0.8133 with a standard deviation of 0.0126, which means that the model is fit and has higher accuracy in output. Therefore, we accepted and interpreted our results based on the output of this model.
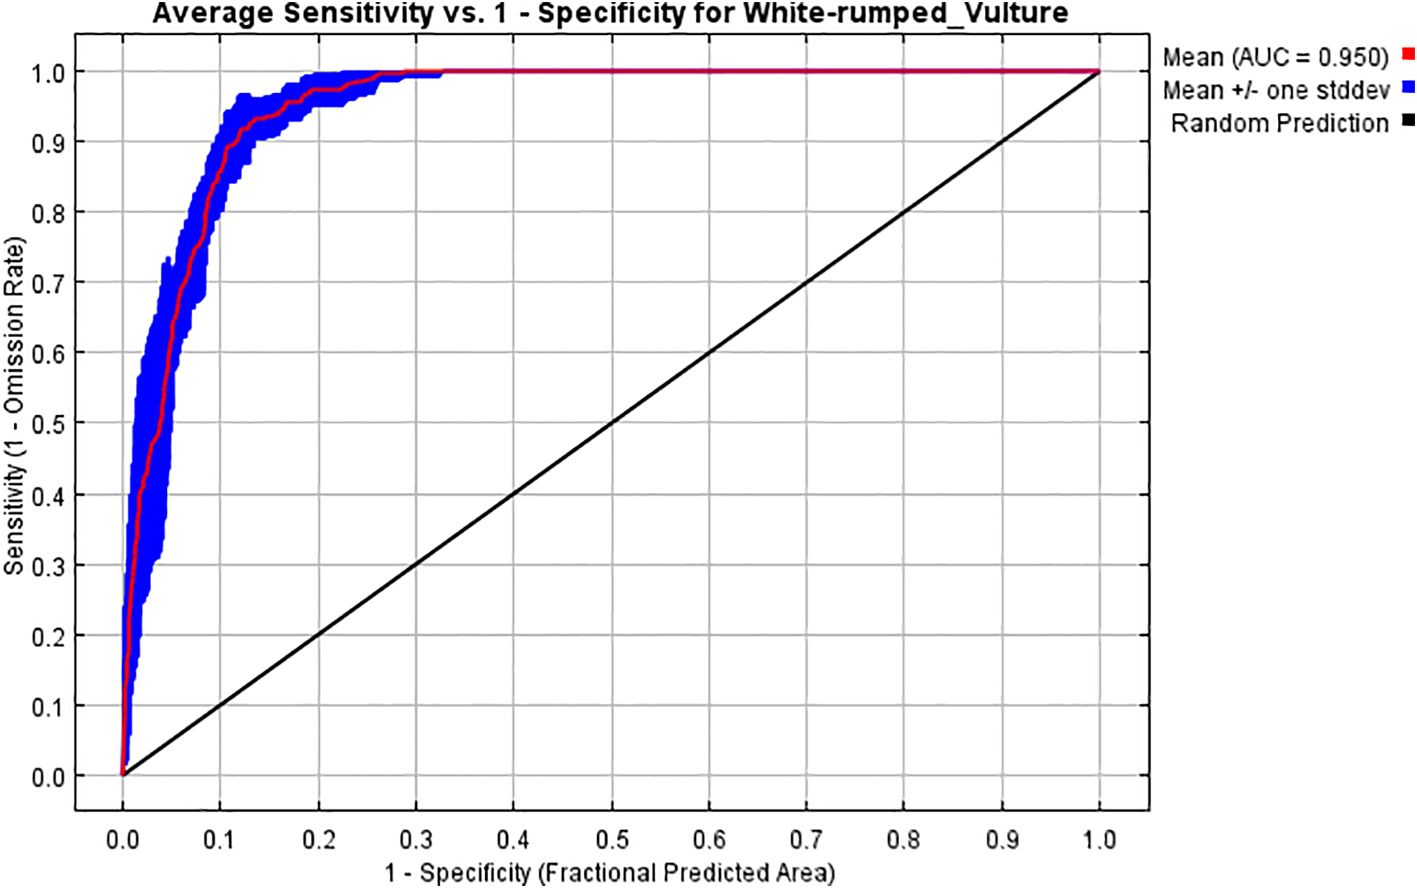
Figure 2. Average sensitivity vs. 1 − specificity for white-rumped vulture.
3.2 Habitat suitability
The study recorded a total of 52 vulture nests (no double nests in a single tree were recorded) from the two districts, with a total of 13 nest occurrences in Rupandehi and 39 nest occurrences in the Nawalparasi East district. The average of the 10 models’ “maximum test sensitivity plus specificity Cloglog threshold” value of 0.5784 was then used to delineate the probability of habitat suitability for the white-rumped vulture. Of the 2,532-km2 total area of the study site, 3.82% (i.e., 96.88 km2) was predicted to be a suitable habitat for the white-rumped vulture, while the remaining 96.18% (i.e., 2,435.12 km2) was predicted to be unsuitable for breeding of the white-rumped vulture (Figure 3).
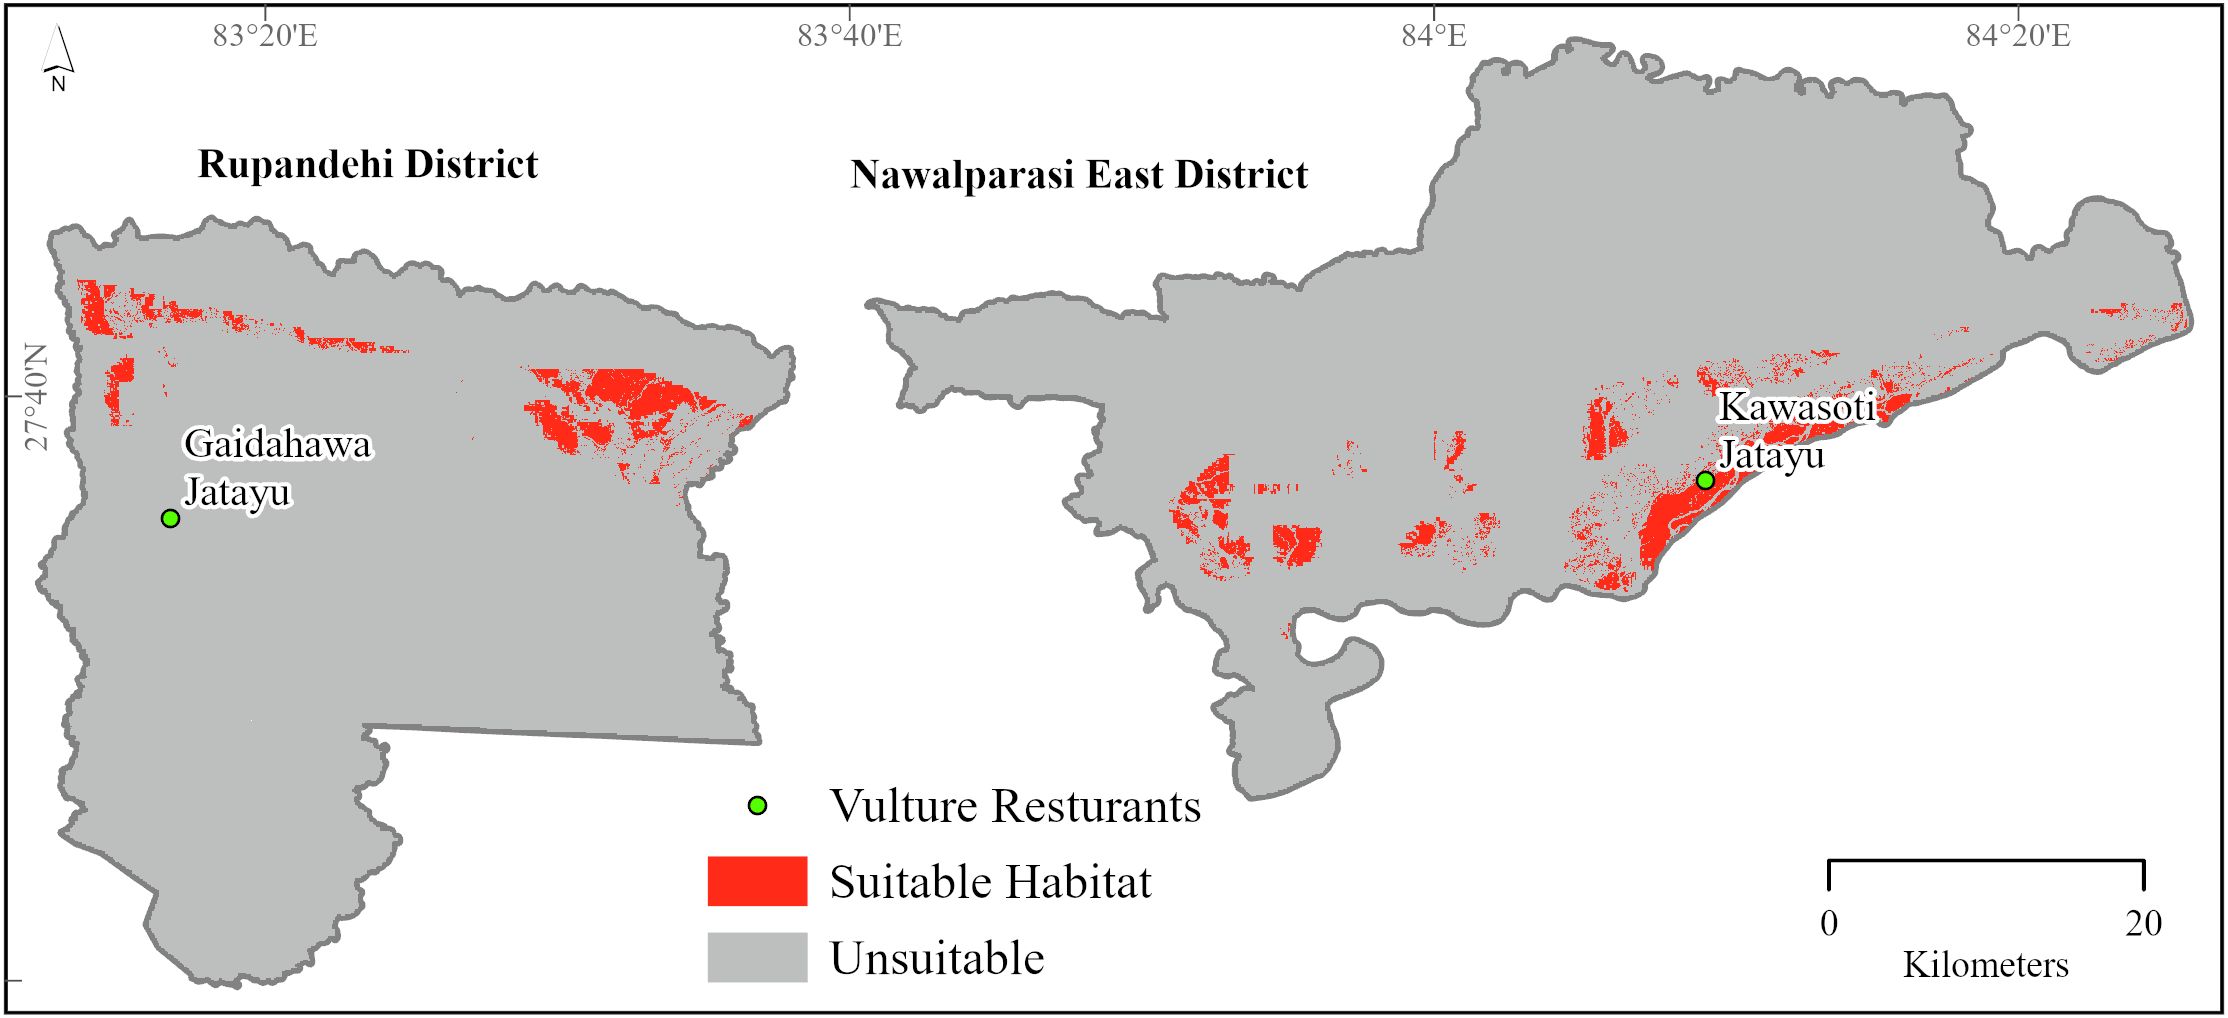
Figure 3. Habitat suitability of white-rumped vulture in Nawalparasi East and Rupandehi districts.
3.3 Percent contribution of variables
The study used a total of seven out of 29 variables after testing the collinearity and their contribution to the model by pre-running the model. This gave the result of the analysis of variable contribution (Table 1) derived from the jackknife test of regularization of training gain (Figure 4). The environmental variable with the highest gain when used in isolation was LULC, which therefore appears to have the most useful information by itself. The environmental variable that decreases the most gain when omitted is LULC, which therefore appears to have the most information that is not present in the other variables. The values shown are averages over replicate runs (Figure 4). This is explained further in terms of percent contribution, which shows that LULC has the highest percentage of relative contribution in the model with 50.5%, followed by biome with 21.8%, while Euclidean distance from vulture restaurants and the variable “aspect” had the least contribution on model building and hence breeding habitat selection with 2.8% and 1.7% respectively. The percent contribution of each variable is presented in Table 1.
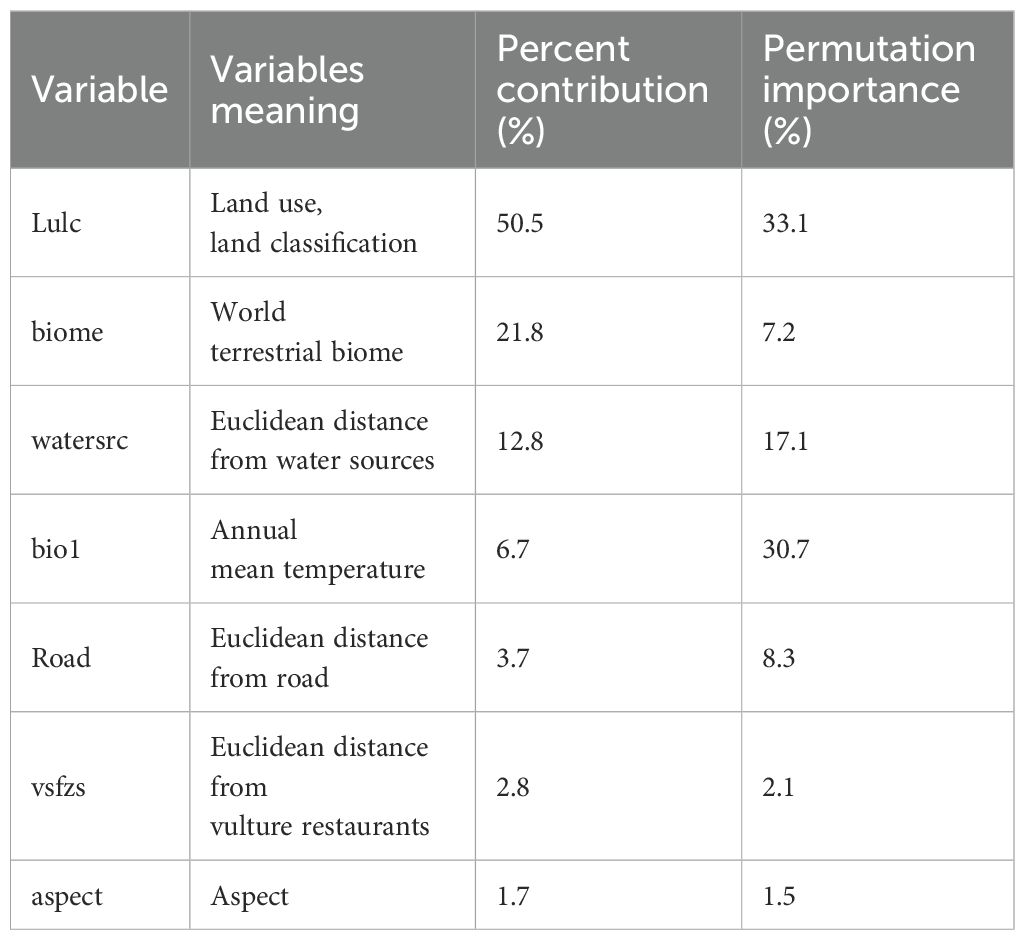
Table 1. Percent contribution and permutation importance of variables in modeling.
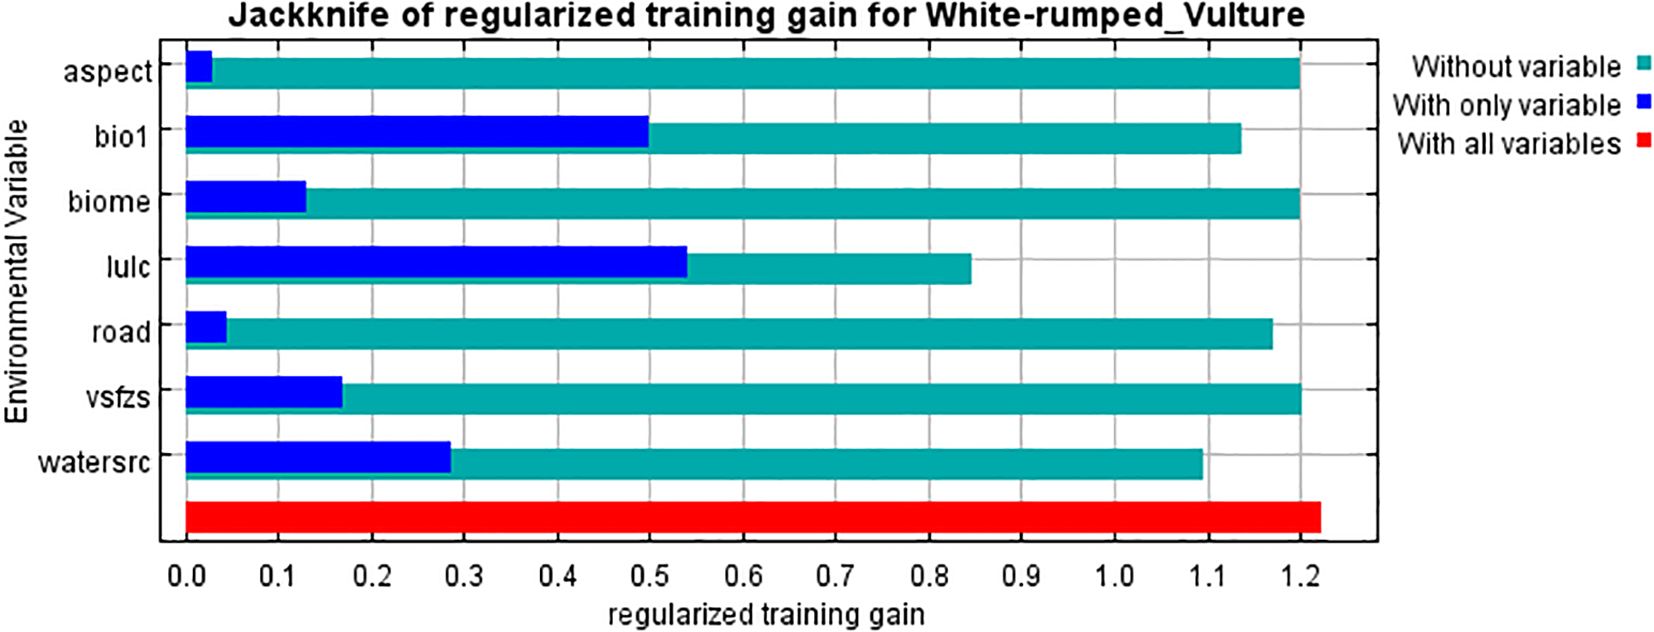
Figure 4. Result of jackknife of regularized training gain for white-rumped vulture.
The response graph of the categorical variable LULC (Figure 5), which had the highest contribution to model building according to the jackknife test, showed that the land use classification of “forest” has the highest contribution to breeding habitat selection by the white-rumped vulture and agricultural land although having a contribution to habitat modeling but shows a negative correlation with the breeding habitat selection by the white-rumped vulture. The response graph of the terrestrial biome (Figure 6), which has the second highest contribution in model building, shows that the terrestrial biome “tropical subtropical grassland, savannas, and shrubland” had the highest contribution to breeding habitat selection by the white-rumped vulture. Response curves of the variables “Euclidean distance from water sources” (Figure 7) and vulture restaurants (Figure 8) showed a negative correlation between the variables and habitat suitability. The response curve showed that breeding habitat suitability and the annual mean temperature (bio1) are positively correlated (Figure 9), with an increase in mean temperature up to 24.5°C having a positive relationship with vultures’ breeding habitat suitability. The response curve of “Euclidean distance to the road” (Figure 10) showed that breeding habitat suitability increases with an increase in distance but then gradually decreases with an increase in distance after reaching a point. The response curve of the variable “aspect” showed that western and northwestern aspects had the highest influence on habitat selection compared to other aspects (Figure 11).
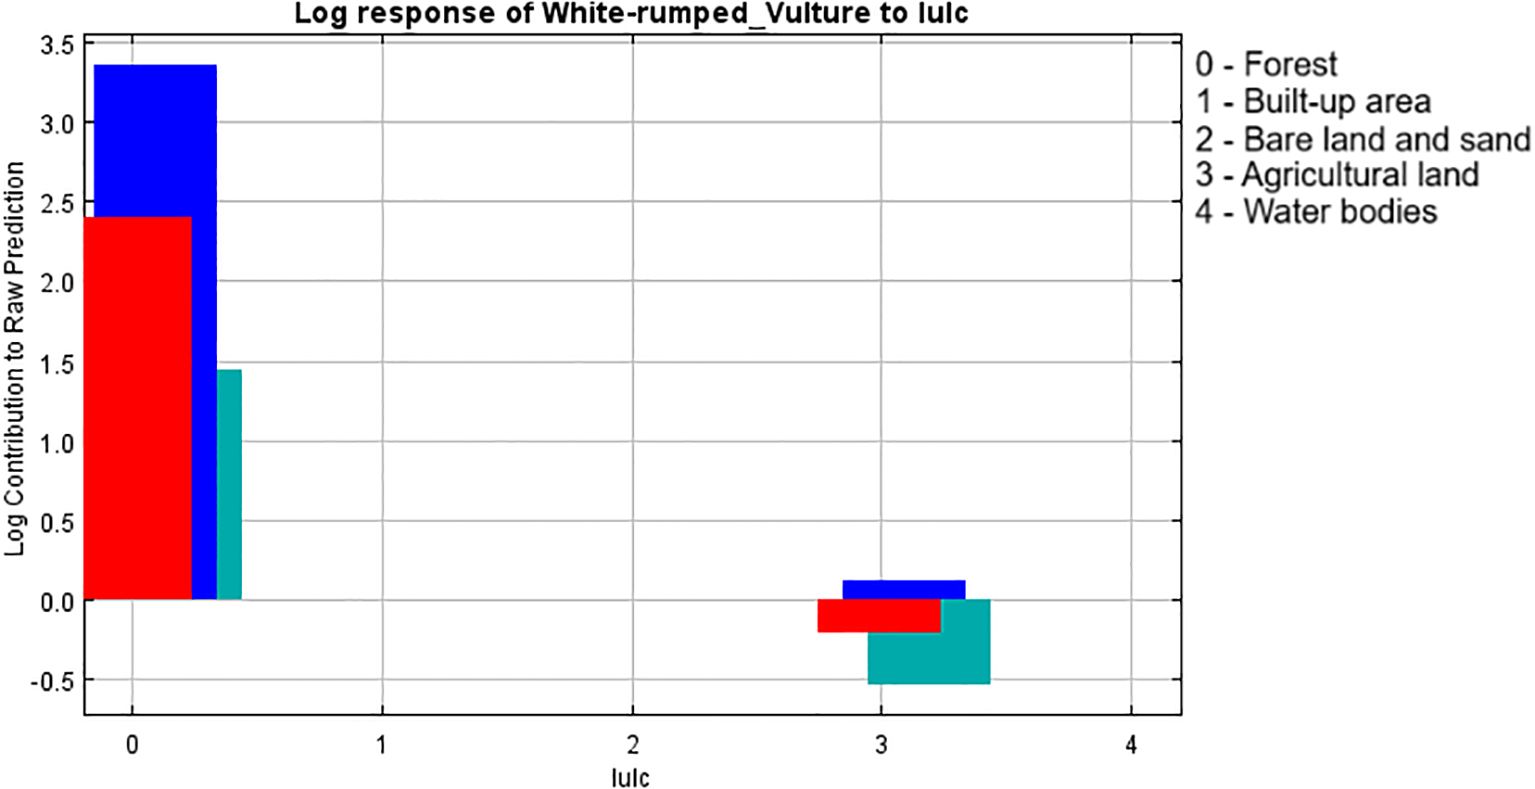
Figure 5. Response graph of LULC to breeding habitat. LULC, land use–land cover.
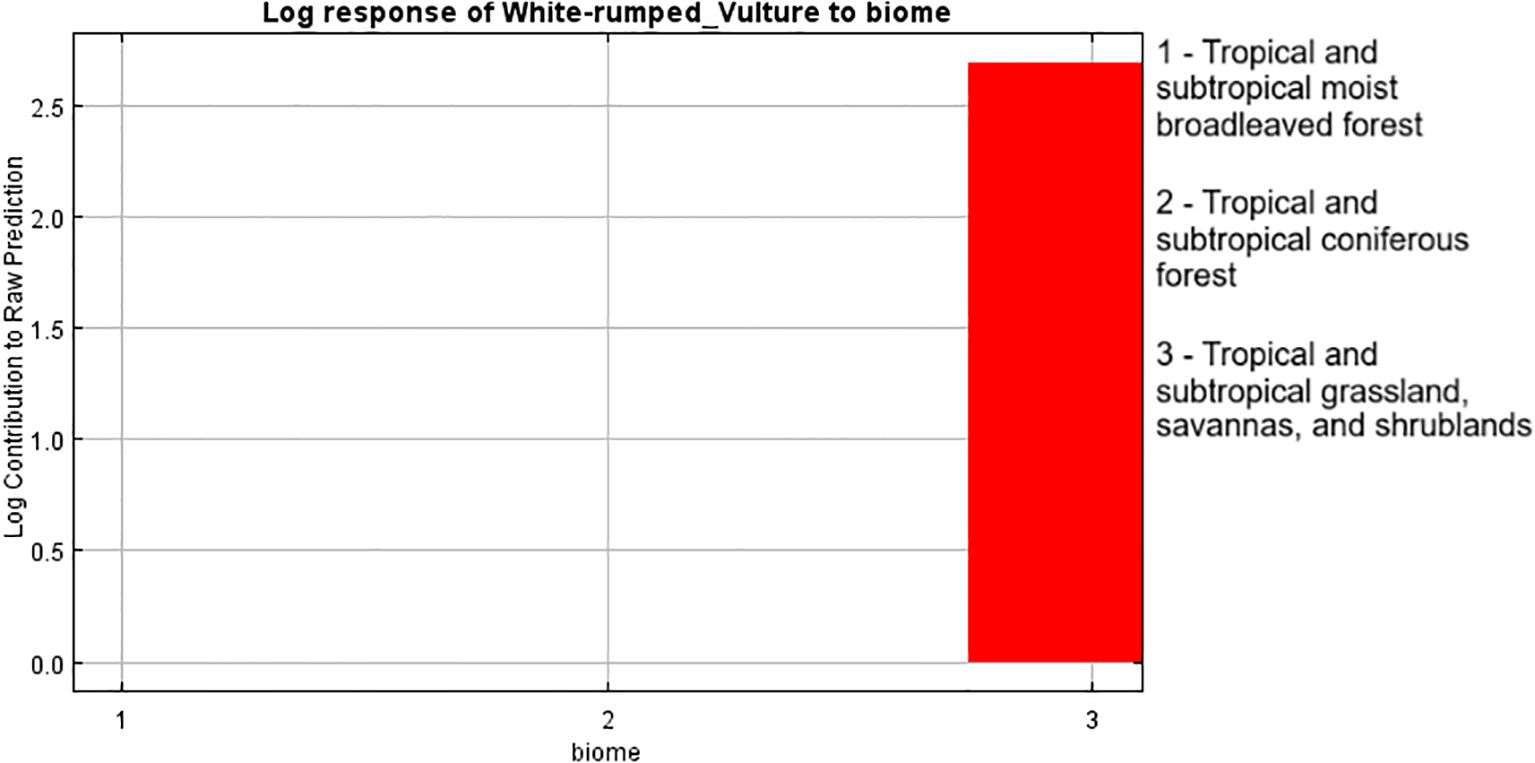
Figure 6. Response graph of terrestrial biomes to breeding habitat.
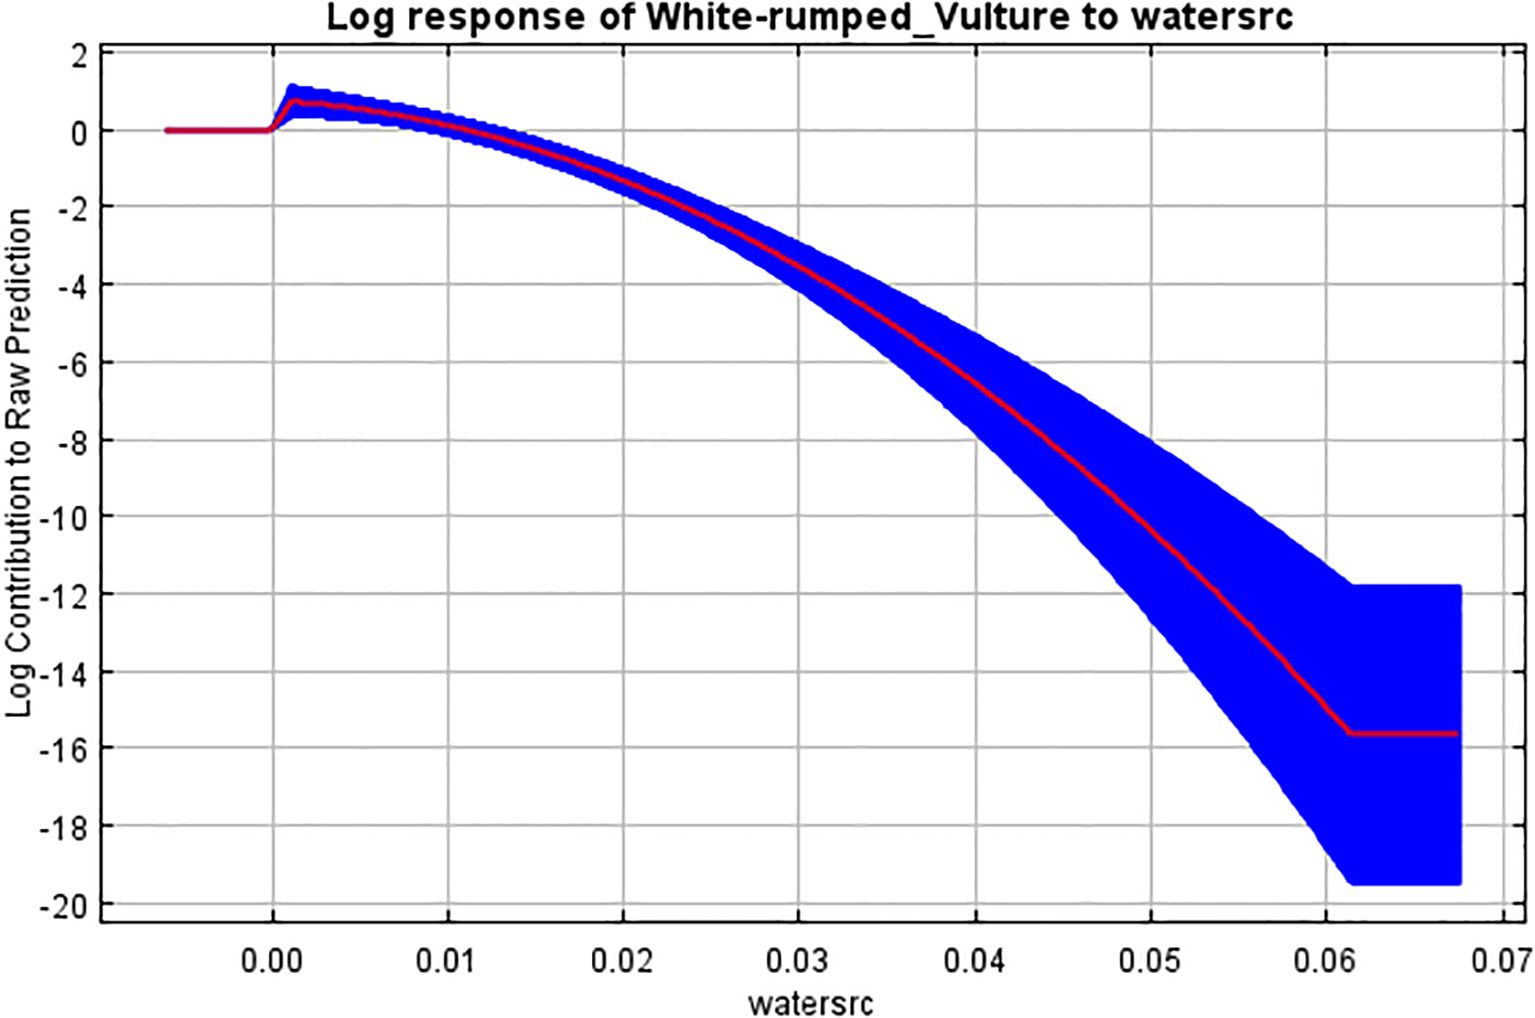
Figure 7. Response curve of Euclidean distance from water source to breeding habitat.
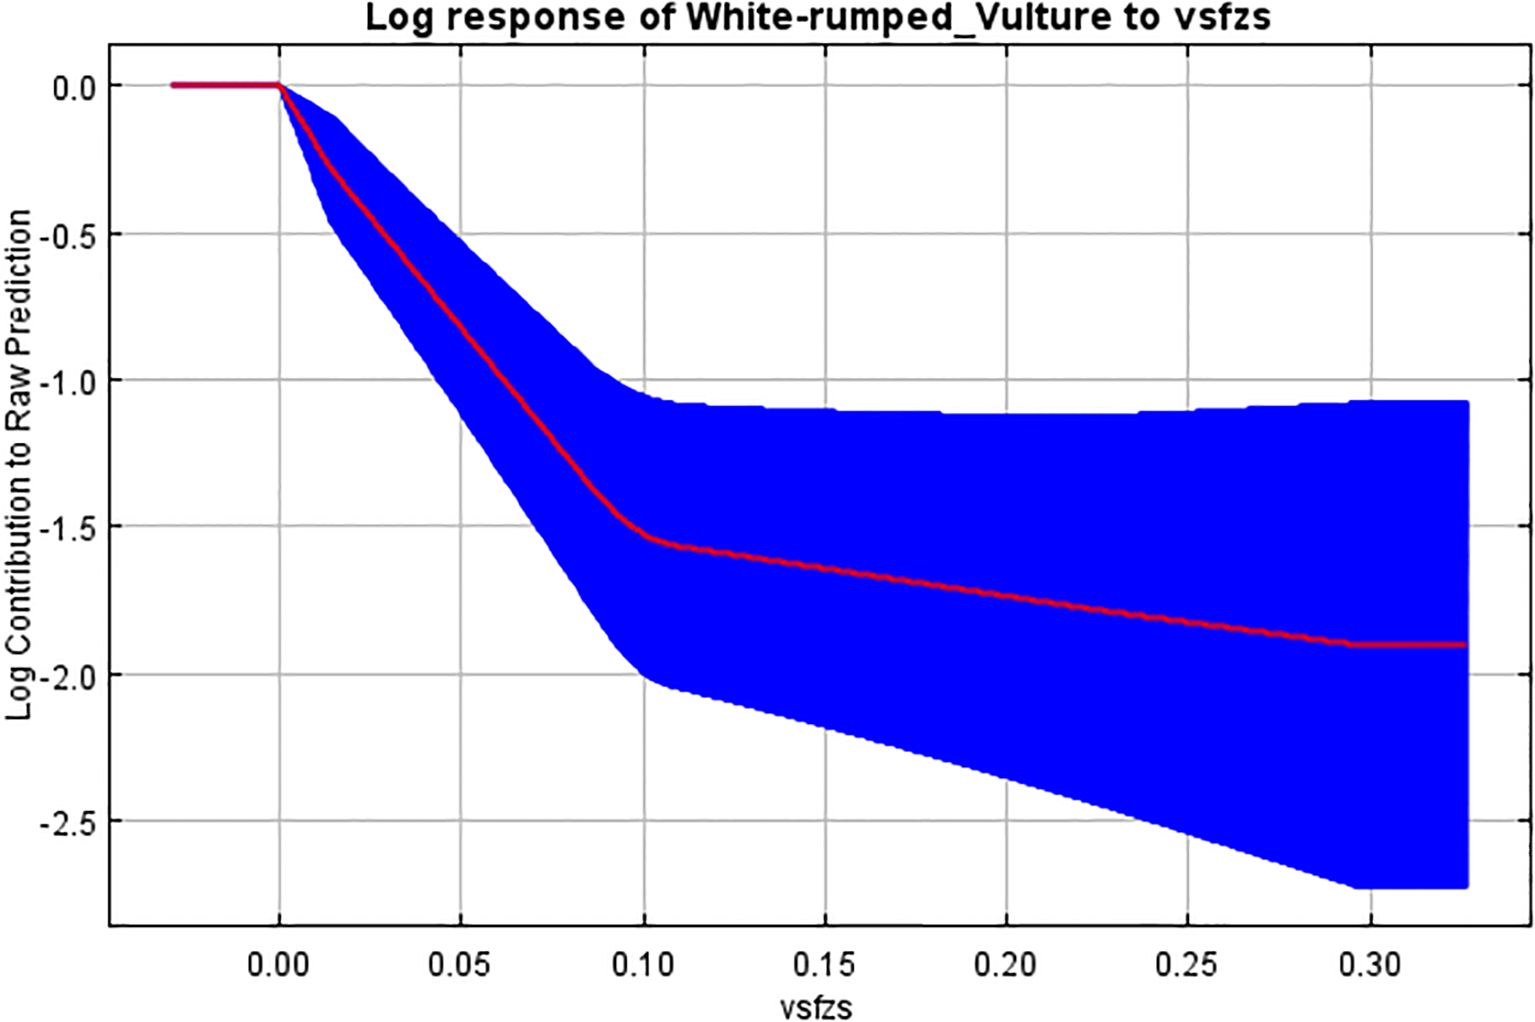
Figure 8. Response curve of Euclidean distance from vulture restaurant to breeding habitat.
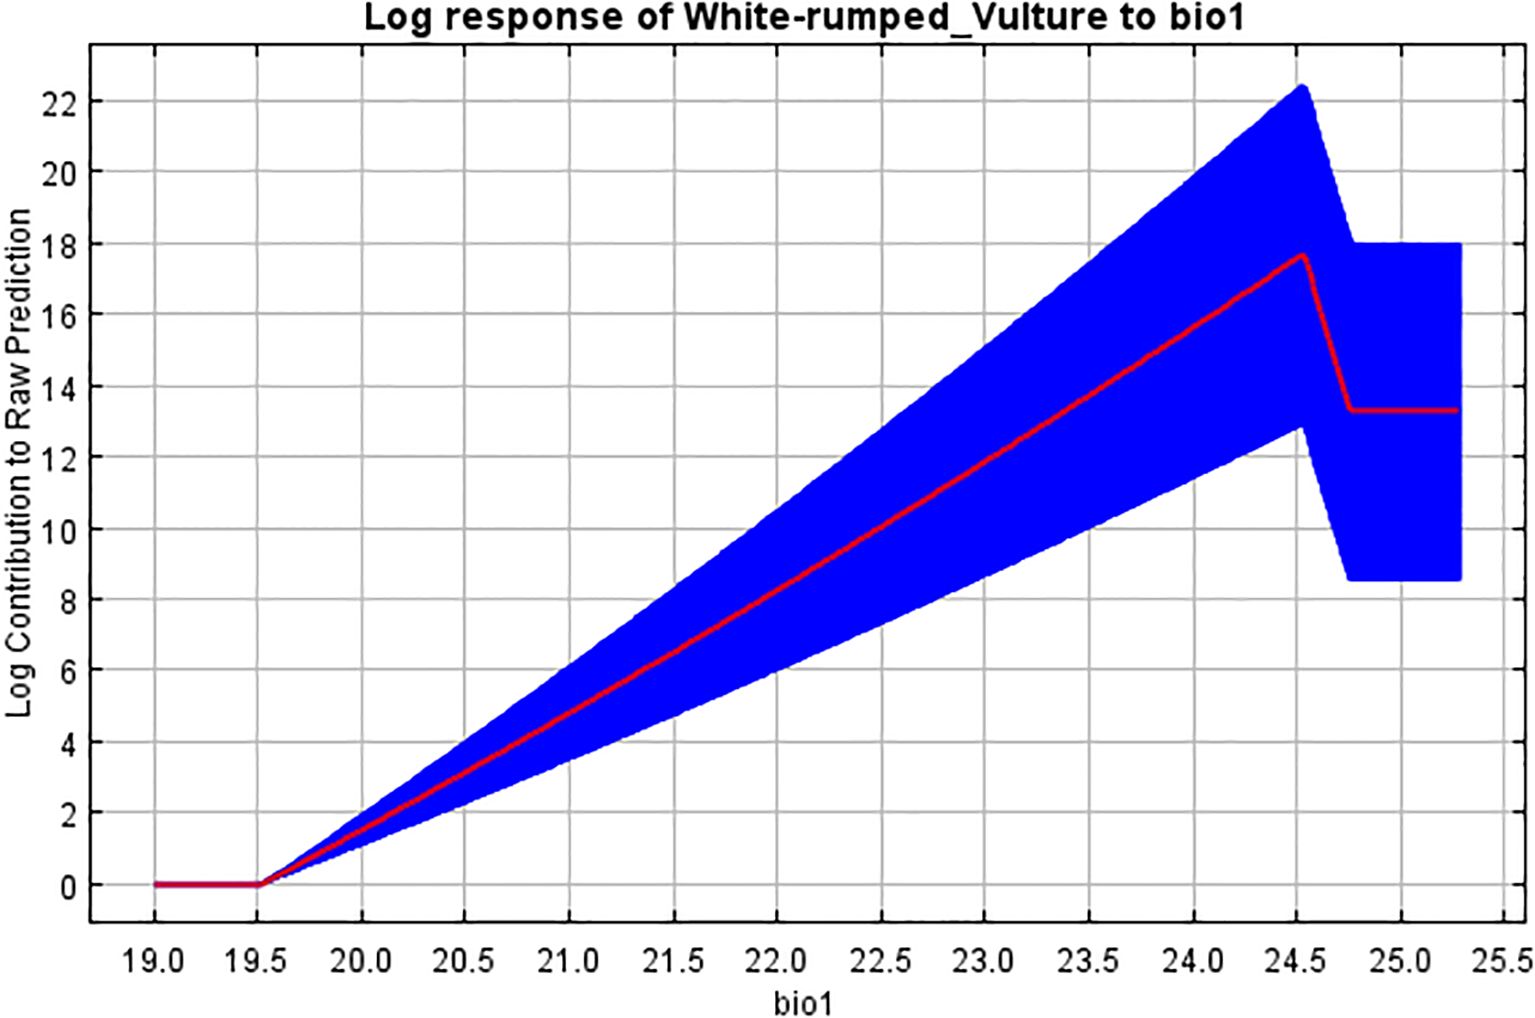
Figure 9. Response curve of mean annual temperature (bio1) to breeding habitat.
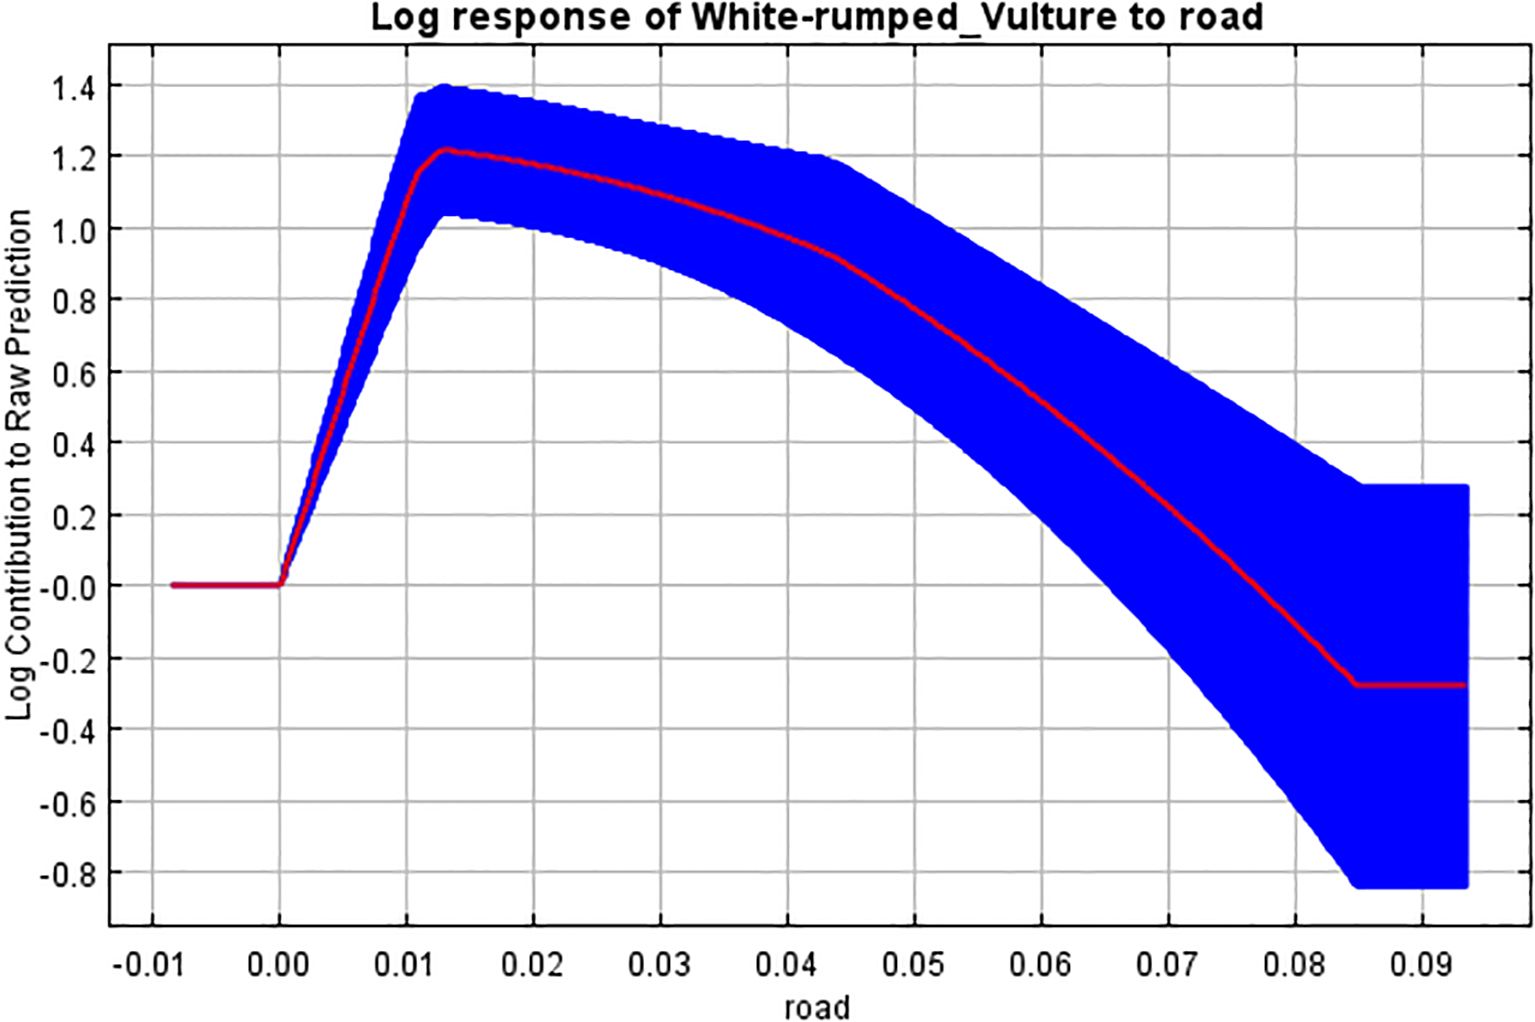
Figure 10. Response curve of Euclidean distance to road to breeding habitat.
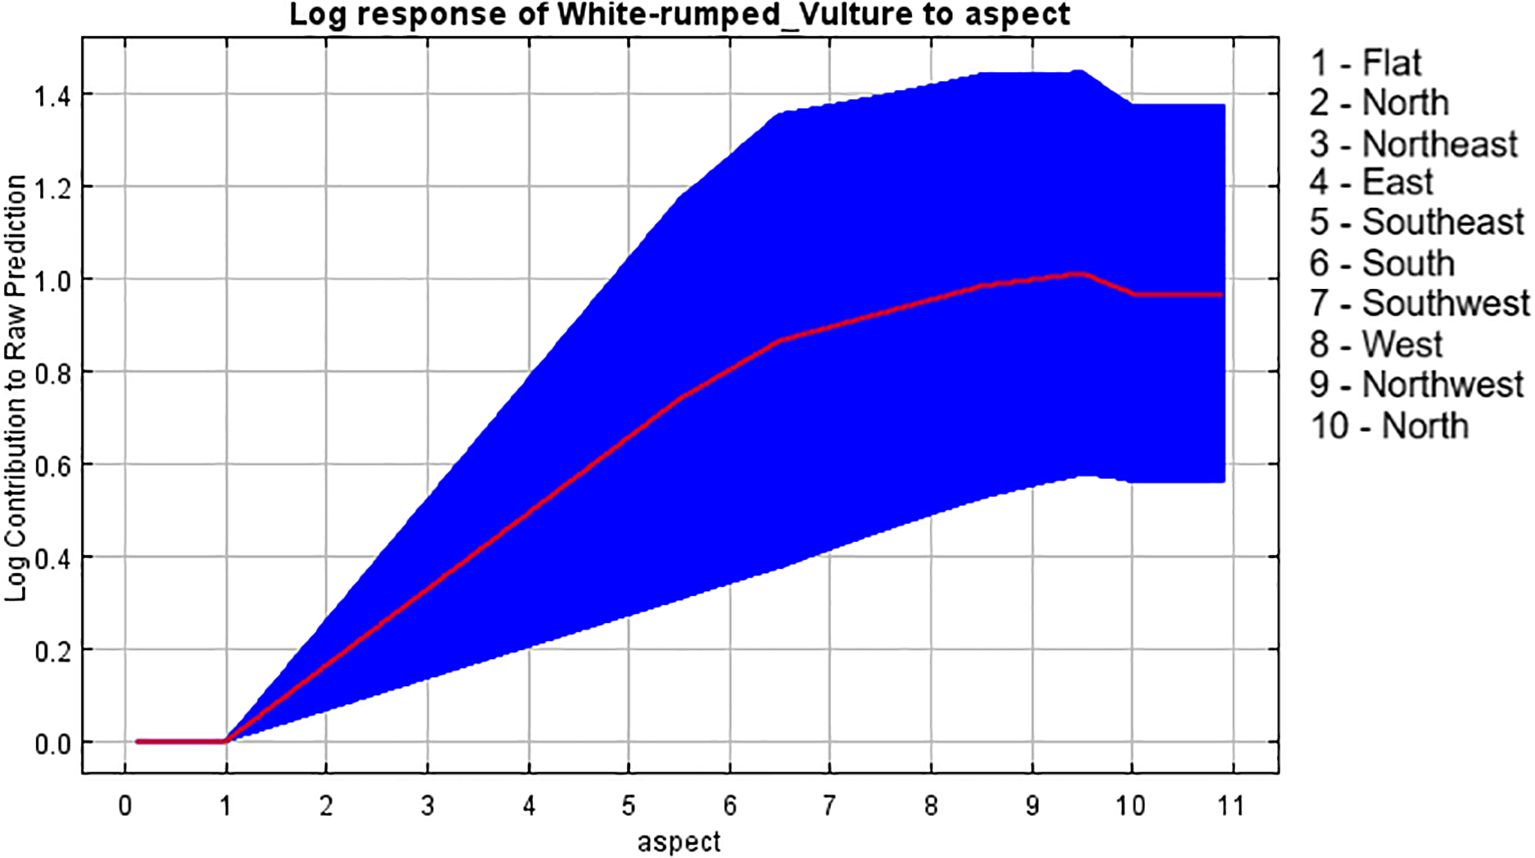
Figure 11. Response curve of aspect to breeding habitat.
4 Discussions
Most of the studies on the white-rumped vulture have focused on modeling only the general roosting or foraging habitat suitability (Kimsing Thungwon et al., 2022; Jha and Jha, 2021a, 2021b), with studies like Rana et al. (2019); Moradiya and Goswami (2021), and Majgaonkar et al. (2018) mostly focusing on breeding ecology rather than breeding habitat suitability, like the studies of Bhattacharya and Talukdar (2024) and Bhusal et al. (2020). Therefore, a need for a study related specifically to the potential suitability of the breeding habitat of white-rumped vultures and the factors that affect them was deemed important. Thus, a model was prepared, which had a high mean AUC value of 0.950 shown by the receiver operating characteristic (ROC) curve (which means that the suitable predicted area between the threshold line and the ROC is high and that the model is fit and has shown high performance to obtain an excellent output) (Swets, 1988; Elith et al., 2002; Heikkinen et al., 2006; Duan et al., 2014; Raina et al., 2014), and a mean TSS value of 0.8133 (which means that the model is fit and has shown good performance) (Allouche et al., 2006); consequently, the study proceeded to interpret the result based on the output of this model.
Modeling demonstrated that the most important variable in habitat suitability for breeding white-rumped vultures is the categorical variable LULC, with forest being the most important category from it, which is in line with similar studies by Jha and Jha (2021a); Kimsing Thungwon et al. (2022); Jha and Jha (2021b), and Jha et al. (2020), who reported that forest is the most important category to determine suitable habitats for breeding white-rumped vulture because of the presence of suitable trees. Similarly, Ramesh et al. (2011) and Navaneethan et al. (2015) also reported very low sightings of vultures in agricultural areas as compared to different types of forests and scrubland, which further justifies our result of agricultural land showing an inverse relationship with habitat selection. This may be because of the growing practice of burying carcasses rather than throwing them on open land, ultimately lessening the possibility of food provision for the vultures (Ghimire, 2018). Furthermore, domestic ungulates are available outside of forests, as a majority of cattle are being sold, resulting in the non-availability of carcass as vulture feed, and the unsold ungulates had the potential danger of diclofenac contamination, possibly forcing the vultures to avoid feeding on them, as reported by Jha (2015), which may further support our result of the negative relationship of breeding sites with agricultural land.
Another categorical variable, “biome”, was the second highest contributor in modeling, with the category “tropical subtropical grassland, savannas, and shrubland” having the highest contribution to breeding habitat selection by the white-rumped vulture. This shows the importance of open grassland, shrubland, and open forest in the selection of breeding sites by the white-rumped vulture. Researchers (Thakur and Narang, 2012; Ramakrishnan et al., 2014) have reported that lofty trees in open forests are often used for nest building by vultures, while Bhattacharya and Talukdar (2024) also reported the significance of shrub cover in nest site selection by white-rumped vultures. These preferences for open forests and wooded savannas for habitat selection, as suggested by reports (Ferguson-Lees and Christie, 2001; BirdLife International, 2021; Kimsing Thungwon et al., 2022), may be attributed to the fact that the vultures need a clearer ground cover where they can easily detect their food. Kimsing Thungwon et al. (2022) suggested that the white-rumped vulture, being an Old World vulture, relies heavily on its highly developed vision as the primary tool to find food sources in vast landscapes, so a clearer ground cover would be an easier option for vultures to find food.
Euclidean distance from the water source was our third-highest contributor to model building. The response curve shows a negative correlation to an increase in distance between the water source and the nesting area. Research by Kanaujia and Kushwaha (2014) reported that breeding colonies of vultures are mostly observed near rivers, canals, ponds, or even dams, which may be because water helps in maintaining the humidity for hatching of eggs (Wani et al., 2018). Other researchers (Bhattacharya and Talukdar, 2024; Jha and Jha, 2021a; Kanaujia and Kushwaha, 2014) in the past have further pointed out that easy availability of water sources after foraging could play an important role in the selection of nesting sites. This is because these areas can provide good opportunities for food sources in the form of cattle stock (Baral et al., 2005; KC et al., 2019; Lu et al., 2009) and dumpsites (Angelov et al., 2020; Navaneethan et al., 2015; Kumar et al., 2018) while also easing their behavior of bathing after foraging to clean themselves (Kimsing Thungwon et al., 2021).
The bioclimatic variable of mean annual temperature had a contribution of 6.7% in model building, with the response curve showing that an increase in temperature up to 24.5°C has a positive correlation with habitat selection. This was in line with the research by Kimsing Thungwon et al. (2022), who had a similar result of the contribution of temperature (for the warmest quarter).
Furthermore, the Euclidean distance from the road had an impact of 3.7% on our model building. It showed a positive relationship between an increase in distance and habitat selection to a point, with a gradual decrease in habitat selection with an increase in distance further than that point. Therefore, we can imply that the white-rumped vulture prefers nesting in sites with moderate human influence or anthropogenic activities, with an eventual decline when the disturbance is too high. This is in line with many studies stating that, although the vultures are known to be negatively affected by anthropogenic disturbances (Chomba and M’Simuko, 2013; Arkumarev et al., 2018), some prefer setting up colonies nearer human habitation (Jha, 2015; Henriques et al., 2018) and are attracted by the rural garbage dumps and the surrounding area where they could find easy food (McGrady et al., 2018; KC et al., 2019).
The Euclidean distance from the vulture restaurant also had an impact on our model building. This response curve showed a negative correlation with increasing distance from the nesting site. Reports have suggested that vulture populations may now be benefiting substantially from the integrated Vulture Safe Feeding Zones work (Bhusal, 2018). Studies have shown the impact of feeding stations in the recolonization of scavenging raptors (Rana et al., 2019; Mundy et al., 1992; Oro et al., 2008; Lieury et al., 2015). This correlation of the presence of active nests with distance from the feeding station could be because of the reduction in foraging time due to the availability of food at feeding stations, which reduces the risk of mortality (Snyder and Snyder, 2005).
Lastly, the bioenvironmental variable “aspect”, which had the least contribution to model building, showed that the aspect from south to northwestern slope had a higher influence on breeding habitat selection by vultures. A similar study by Sehgal et al. (2020) showed that nests were observed in the north and south directions more often. This may be because orientation may help to protect vultures from negative conditions like directional movement of cold winds and direct solar radiation, facilitating them to raise their body temperature after nocturnal dip, as temperature plays a key role in reproductive success during early breeding stages, helping to understand our result (Venkitachalam and Senthilnathan, 2015). Overall, all these research papers helped us to gain vital insights into the variables and their impact on the habitat suitability of the white-rumped vulture, in line with our research, helping us to establish conclusions and provide suggestions based on our research.
Therefore, we can strongly suggest that vulture restaurant management committees, division forest offices, national park offices, and all other concerned authorities should manage the habitat in such a way that the forest can have suitable sites for nesting. That includes management and maintenance of savannas and open wooded forest, promoting open spaces near the moderately dense forest as well as maintaining the water resources in and around the forest area, especially in the areas where the ponds and sources could dry up during the breeding season of vultures from October/November up to March/April. Furthermore, we would like to suggest continuing the work of vulture restaurants, which have been providing easy and safe food for the fostering of vultures, which can ultimately be vital during the breeding season. Lastly, we suggest that concerned authorities moderate the human pressure around vulture colonies during the breeding season.
This study satisfactorily uses rigorously selected factors that play important roles in vulture breeding habitat selection while also addressing key methodological issues of MaxEnt modeling to avoid an overfitted model by the use of regularization multiplier determined through AICc optimization, selection of predictive variables using two steps that are mentioned above, and use of bias file to limit the dispersal of pseudo-absence points. Therefore, despite a high AUC and TSS value, we have carefully avoided overfitting, and hence, the model has high predictive power, and its result is useful for interpretation and in suggesting its implications. However, our study has some limitations as well. We only used the MaxEnt modeling approach, considering its popularity and performance. However, efforts to use multiple distribution models and techniques, like the ensemble modeling technique, may add value to the current study. Furthermore, despite strong evidence of VSFZs supporting vultures’ breeding habitat, other research on other species of vultures suggests that breeding success may also be reduced due to the presence of non-breeding “floaters” in the vicinity of feeding sites (Carrete et al., 2006), and supplementary feeding during the chick-rearing stage may also affect breeding success (Margalida, 2010). These may be important factors contributing to vultures’ breeding ecology as well, and studies like ours that largely focus on remote sensing data may overlook these factors. Therefore, alternative research techniques should be used to add to the knowledge provided by our study before establishing a fixed set of plans to conserve vultures and their breeding habitat.
Data availability statement
The original contributions presented in the study are included in the article/Supplementary Material. Further inquiries can be directed to the corresponding author.
Ethics statement
The requirement of ethical approval was waived by Department of National Park and Wildlife Conservation, Nepal for the studies involving animals because a part of the study area was inside the national park. The studies were conducted in accordance with the local legislation and institutional requirements.
Author contributions
NB: Writing – review & editing, Data curation, Formal Analysis, Conceptualization, Writing – original draft, Methodology. SJ: Visualization, Data curation, Writing – review & editing. NR: Validation, Writing – review & editing. AJ: Writing – review & editing. KP: Writing – review & editing. SY: Writing – review & editing.
Funding
The author(s) declare that no financial support was received for the research and/or publication of this article.
Conflict of interest
The authors declare that the research was conducted in the absence of any commercial or financial relationships that could be construed as a potential conflict of interest.
Generative AI statement
The author(s) declare that no Generative AI was used in the creation of this manuscript.
Any alternative text (alt text) provided alongside figures in this article has been generated by Frontiers with the support of artificial intelligence and reasonable efforts have been made to ensure accuracy, including review by the authors wherever possible. If you identify any issues, please contact us.
Publisher’s note
All claims expressed in this article are solely those of the authors and do not necessarily represent those of their affiliated organizations, or those of the publisher, the editors and the reviewers. Any product that may be evaluated in this article, or claim that may be made by its manufacturer, is not guaranteed or endorsed by the publisher.
References
Allouche O., Tsoar A., and Kadmon R. (2006). Assessing the accuracy of species distribution models: prevalence, kappa and the true skill statistic (TSS). J. Appl. Ecol. 43, 1223–1232. doi: 10.1111/j.1365-2664.2006.01214.x
Anderson R. P. and Gonzalez I. (2011). Species-specific tuning increases robustness to sampling bias in models of species distributions: An implementation with Maxent. Ecol. Modeling 222, 2796–2811. doi: 10.1016/j.ecolmodel.2011.04.011
Angelov I., Bougain C., Schulze M., Sariri T. A., McGrady M., and Meyburg B. U. (2020). A globally-important stronghold in Oman for a resident population of the endangered Egyptian vulture Neophron percnopterus. Ardea 108, 73–82. doi: 10.5253/arde.v108i1.a4
Araújo M. B. and Guisan A. (2006). Five (or so) challenges for species distribution modelling. J. Biogeography 33, 1677–1688. doi: 10.1111/j.1365-2699.2006.01584.x
Arkumarev V., Dobrev V., Stoychev S., Dobrev D., Demerdzhiev D., and Nikolov S. C. (2018). Breeding performance and population trend of the Egyptian Vulture Neophron percnopterus in Bulgaria: Conservation implications. Ornis Fennica 95, 15–127. doi: 10.51812/of.133935
Banda L. B. and Tassie N. (2018). Modeling the distribution of four-bird species under climate change in Ethiopia. Ethiopian J. Biol. Sci. 17, 1–17.
Baral N., Gautam R., and Tamang B. (2005). Population status and breeding ecology of White-rumped Vulture Gyps bengalensis in Rampur Valley, Nepal. Forktail 21, 87–91.
Barbet-Massin M., Jiguet F., Albert C. H., and Thuiller W. (2012). Selecting pseudo-absences for species distribution models: how, where and how many? Methods Ecol. Evol. 3, 327–338. doi: 10.1111/j.2041-210X.2011.00172.x
BCN and DNPWC (2011). The State of Nepal’s Birds 2010. Bird Conservation Nepal and Department of National Parks and Wildlife Conservation, Kathmandu. (Kathmandu, Nepal: Bird Conservation Nepal).
Bhattacharya M. and Talukdar G. (2024). Nest site selection and threats to nesting colonies of White-rumped Vulture (Gyps bengalensis) in Himachal Pradesh. For. Ecol. Management 573. doi: 10.1016/j.foreco.2024.122335
Bhusal K. P. (2018). Vulture Safe Zone: a landscape level approach to save the threatened vultures in Nepal. Himalayan Nat. 1, 25–26.
Bhusal K. P., Chaudhary I. P., Dangaura H. L., Joshi A. B., Rana D. B., and Ghimire S. (2020). Habitat mapping of White-rumped Vulture Gyps bengalensis, in Terai arc landscape of Nepal. Minivet 3), 10–16.
BirdLife International (2021). Species factsheet: White-rumped Vulture Gyps bengalensis. Available online at: https://datazone.birdlife.org/species/factsheet/white-rumped-vulture-gyps-bengalensis (Accessed January 22, 2023).
Boria R. A., Olson L. E., Goodman S. M., and Anderson R. P. (2014). Spatial filtering to reduce sampling bias can improve the performance of ecological niche models. Ecol. Modell 275, 73–77. doi: 10.1016/j.ecolmodel.2013.12.012
Brown J. L. (2014). SDMtoolbox: A python-based GIS toolkit for landscape genetic, biogeographic and species distribution model analyses. Methods Ecol. Evol. 5, 694–700. doi: 10.1111/2041-210X.12200
Carrete M., Donazar J., Margalida A., and Bertran J. (2006). Linking ecology, behaviour and conservation: does habitat saturation changes mating system in bearded vultures? Biol. Lett. 2, 624–627. doi: 10.1098/rsbl.2006.0498
Chaudhary A., Chaudhary D. B., Baral H. S., Cuthbert R., Chaudhary I., and Nepali Y. B. (2010). “Influence of safe feeding site on vultures and their nest numbers at Vulture Safe Zone, Nawalparasi,” in Proceedings of the First National Youth Conference on Environment. (Kathmandu, Nepal: Nepal Youth Council). 1–6.
Chomba C. and M’Simuko E. (2013). Nesting patterns of raptors; White backed vulture (Gyps africanus) and African fish eagle (Haliaeetus vocifer), in Lochinvar National Park on the Kafue flats, Zambia. Open J. Ecol. 3, 325–330. doi: 10.4236/oje.2013.35037
D’Addario M., Monroy-Vilchis O., Zarco-González M. M., and Santos-Fita D. (2019). Potential distribution of Aquila chrysaetos Mexico: Implications for conservation. Avian Biol. Res. 12, 33–41. doi: 10.1177/1758155918823424
DFRS (2014). Terai Forests of Nepal, (2010–2012). Forest Resource Assessment Nepal Project, Department of Forest Research and Survey. (Kathmandu, Nepal: Department of Forest Research and Survey).
DNPWC and DoFSC (2023). Vulture Conservation Action Plan, (2023-2027). (Kathmandu: Department of National Parks and Wildlife Conservation and Department of Forests and Soil Conservation).
Donazar J. A., Hiraldo F., and Bustamante J. (1993). Factors influencing nest-site selection, breeding density and breeding success in the Bearded Vulture (Gypaetus barbatus). J. Appl. Ecol. 30, 504–514. doi: 10.2307/2404190
Dormann C. F., Elith J., Bacher S., Buchmann C., Carl G., Carré G., et al. (2013). Collinearity: a review of methods to deal with it and a simulation study evaluating their performance. Ecography 36, 27–46. doi: 10.1111/j.1600-0587.2012.07348.x
Drew C. A., Wiersma Y. F., and Huettmann F. (2011). Predictive species and habitat modeling in landscape ecology. 1st (Verlag New York: Springer), 313. Available online at: https://www.springer.com/gp/book/9781441973894 (Accessed January 25, 2023).
Duan R. Y., Kong X. Q., Huang M. Y., Fan W. Y., and Wang Z. G. (2014). The predictive performance and stability of six species distribution models. PloS One 9, e112764. doi: 10.1371/journal.pone.0112764
Dudík M., Phillips S. J., and Schapire R. E. (2007). Maximum entropy density estimation with generalized regularization and an application to species distribution modeling. J. Mach. Learn. Res. 8, 1217–1260.
Earth Resources Observation and Science (EROS) Center (2020). Landsat 8–9 Operational Land Imager/Thermal Infrared Sensor Level-2, Collection 2 [dataset]. U.S. Geological Survey, Acquired October 14–19, 2021. (Sioux Falls, USA: U.S. Geological Survey). doi: 10.5066/P9OGBGM6
Elith J., Burgman M. A., and Regan H. M. (2002). Mapping epistemic uncertainties and vague concepts in predictions of species distributions. Ecol. Modeling 157, 313–329. doi: 10.1016/S0304-3800(02)00202-8
Elith J., Phillips S. J., Hastie T., Dudík M., Chee Y. E., and Yates C. J. (2010). A statistical explanation of MaxEnt for ecologists. Diversity Distributions 17, 43–57. doi: 10.1111/j.1472-4642.2010.00725.x
Ferrier S. (2002). Mapping spatial pattern in biodiversity for regional conservation planning: where to from here? Funk V, editor. Syst. Biol. 51, 331–363. doi: 10.1080/10635150252899806
Fick S. E. and Hijmans R. J. (2017). WorldClim 2: new 1km spatial resolution climate surfaces for global land areas. Int. J. Climatol. 37, 4302–4315. doi: 10.1002/joc.5086
Fourcade Y., Engler J., Rödder D., and Secondi J. (2014). Mapping species distributions with MaxEnt using a geographically biased sample of presence data: a performance assessment of methods for correcting sampling bias. PloS One 9, e97122. doi: 10.1371/journal.pone.0097122
FRTC (2021). Vegetation Types of Nepal: a report based on review of literature and expert knowledge. EFTMP Technical Working Document, No. 2. Ecosystem and Forest Types Mapping Program (EFTMP) (Kathmandu, Nepal: Forest Research and Training Centre (FRTC).
Ghimire P. (2018). Distribution Abundance and Habitat Evaluation of Asian Vultures in Kaligandaki Corridor, Nepal. Download: thesis.pdf (tucl.edu.np). (Kathmandu: Tribhuvan University).
Gislason P. O., Benediktsson J. A., and Sveinsson J. R. (2006). Random forests for land cover classification. Pattern Recognit. Lett. 27, 294–300. doi: 10.1016/j.patrec.2005.08.011
Gray P. A. (1997). “Wildlife 2000: Modeling Habitat Relationships of Terrestrial Vertebrates”. In The Canadian Field-Naturalist eds. Verner J., Morrison M. L., and Ralph John C. [Review]. 101 (4), 639–640. doi: 10.5962/p.356019
Guisan A. and Thuiller W. (2005). Predicting species distribution: offering more than simple habitat models. Ecol. Lett. 8, 993–1009. doi: 10.1111/j.1461-0248.2005.00792.x
Guisan A. and Zimmermann N. E. (2000). Predictive habitat distribution models in ecology. Ecol. Model. 135, 147–186. doi: 10.1016/S0304-3800(00)00354-9
Habibzadeh N. and Ludwig T. (2019). Ensemble of small models for estimating potential abundance of Caucasian grouse (Lyrurus mlokosiewiczi) in Iran. Ornis Fennica 96, 77–89. doi: 10.51812/of.133949
Hanley J. A. and McNeil B. J. (1982). The meaning and use of the area under a receiver operating characteristic (ROC) curve. Radiology 143, 29–36. doi: 10.1148/radiology.143.1.7063747
Heikkinen R. K., Luoto M., Araújo M. B., Virkkala R., Thuiller W., and Sykes M. T. (2006). Methods and uncertainties in bioclimatic envelope modeling under climate change. Prog. Phys. Geogr. 30, 1–27. doi: 10.1177/0309133306071957
Henriques M., Granadeiro J. P., Monteiro H., Nuno A., Lecoq M., Cardoso P., et al. (2018). Not in wilderness: African vulture strongholds remain in areas with high human density. PloS One 13, e0190594. doi: 10.1371/journal.pone.0190594
Humanitarian Data Exchange (2015a). Nepal road network. Humanitarian Data Exchange. (The Hague, Netherlands). Available online at: https://data.humdata.org/dataset/Nepal-road-network (Accessed July 20, 2021).
Humanitarian Data Exchange (2015b). Nepal Watercourses (Humanitarian Data Exchange). Available online at: https://data.humdata.org/dataset/Nepal-watercourses-rivers (Accessed July 20, 2021).
Inskipp C., Baral H. S., Phuyal S., Bhatt T. R., Khatiwada M., Inskipp T., et al. (2016). The status of Nepal’s Birds: The national red list series. Zoological Society of London, UK. (London, UK: World Wide Fund for Nature).
Iqbal S., Khan U., and Murn C. (2011). Vulture Population and Status Survey, Pakistan. World Wide Fund for Nature- Pakistan. (Lahore, Pakistan: World Wide Fund for Nature). 11.
Jaynes E. T. (1957). Information theory and statistical mechanics. Phys. Rev. 106, 620–630. doi: 10.1103/PhysRev.106.620
Jha K. K. (2015). Distribution of vultures in Uttar Pradesh, India. J. Threatened Taxa 7, 6750–6763. doi: 10.11609/JoTT.o3319.6750-63
Jha K. K., Cambell M. O., and Jha R. (2020). Vultures, their population status and some ecological aspects in an Indian stronghold. Notulae Sci. Biol. 12, 124–142. doi: 10.15835/nsb12110547
Jha K. K. and Jha R. (2021a). Study of vulture habitat suitability and impact of climate change in central India using Maxent. J. Resour. Ecol. 12, 30–42. doi: 10.5814/j.issn.1674-764x.2021.01.004
Jha R. and Jha K. K. (2021b). Habitat prediction modeling for vulture conservation in Gangetic-Thar-Deccan region of India. Environ. Monit. Assess. 193, 532. doi: 10.1007/s10661-021-09323-4
Jiménez-Valverde A. and Lobo J. M. (2007). Threshold criteria for conversion of probability of species presence to either–or presence–absence. Acta Oecol. 31, 361–369.
Kanaujia A. and Kushwaha S. (2014). Relationship between water bodies and vulture populations in Bundelkhand, India. Species 11, 6–19.
Kanth D. R., Narendra M. K., Krishna B. G., and Ravali B. (2020). MAXENT Modeling and mapping of Passer domesticus species distribution in Guntur Region. Indian J. Ecol. 47, 64–70.
KC K. B., Koju N. P., Bhusal K. P., Low M., Ghimire S. K., Ranabhat R., et al. (2019). Factors influencing the presence of the endangered Egyptian vulture Neophron percnopterus in Rukum, Nepal. Global Ecol. Conserv. 20, e00727. doi: 10.1016/j.gecco.2019.e00727
Kimsing Thungwon A., Biju T., Ngukir J., and Mize D. (2021). Vultures in India: A review. Int. Res. J. Biol. Sci. 10, 70–78.
Kimsing Thungwon A., Ngukir J., Biju T., and Mize D. (2022). White-rumped vulture’s habitat suitability prediction using maxEnt in Arunachal Pradesh. Asian J. Biol. 15, 18–30. doi: 10.9734/AJOB/2022/v15i130229
Krüger O. (2002). Analysis of nest occupancy and nest reproduction in two sympatric raptors: common buzzard Buteo buteo and goshawk Accipiter gentilis. Ecography 25, 523–532. doi: 10.1034/j.1600-0587.2002.250502.x
Krüger S. C., Simmons R. E., and Amar A. (2015). Anthropogenic activities influence the abandonment of Bearded Vulture (Gypaetus barbatus) territories in southern Africa. Condor 117, 94–107. doi: 10.1650/CONDOR-14-121.1
Kumar A., Mishra S., Yadav R., Sinha A., and Kanaujia A. (2018). Vultures of pilibhit tiger reserve (PTR), Uttar Pradesh. Adv. Biores. 9, 135–144.
Lieury N., Gallardo M., Ponchon C., Besnard A., and Millon A. (2015). Relative contribution of local demography and immigration in the recovery of a geographically isolated population of the endangered Egyptian vulture. Biol. Conserv. 191, 349–356. doi: 10.1016/j.biocon.2015.07.008
Liu C., White M., and Newell G. (2013). Selecting thresholds for the prediction of species occurrence with presence-only data. J. Biogeogr. 40 (4), 778–789. doi: 10.1111/jbi.12058
Lu X., Ke D., Zeng X., Gong G., and Ci R. (2009). Status, ecology, and conservation of the Himalayan griffon Gyps himalayensis (Aves, Accipitridae) in the Tibetan plateau. Ambio 38, 166–173. doi: 10.1579/0044-7447-38.3.166
Majgaonkar I., Bowden C. G. R., and Quader S. (2018). Nesting success and nest-site selection of white-rumped vultures (Gyps bengalensis) in Western Maharashtra, India. J. Raptor Res. 52, 431–442. doi: 10.3356/JRR-17-26.1
Margalida A. (2010). Supplementary feeding during the chick-rearing period is ineffective inincreasing the breeding success in the bearded vulture (Gypaetus barbatus). Eur. J. Wildl. Res. 56, 673–678. doi: 10.1007/s10344-010-0366-0
Margalida A., García D., and Cortés-Avizanda A. (2007). Factors influencing the breeding density of Bearded vultures, Egyptian vultures and Eurasian griffon vultures in Catalonia (NE Spain): Management implications. Anim. Biodivers. Conserv. 30, 189–200. doi: 10.32800/abc.2007.30.0189
McClure C. J. W., Westrip J. R. S., Johnson J. A., Schulwitz S. E., Virani M. Z., Davies R., et al. (2018). State of the world’s raptors: Distributions, threats, and conservation recommendations. Biol. Conserv. 227, 390–402. doi: 10.1016/j.biocon.2018.08.012
McGrady M. J., Karelus D. L., Rayaleh H. A., Willson M. S., Meyburg B.-U., Oli M. K., et al. (2018). Home ranges and movements of Egyptian Vultures Neophron percnopterus in relation to rubbish dumps in Oman and the Horn of Africa. Bird Study 65, 544–556. doi: 10.1080/000636572018.1561648
Moradiya M. and Goswami A. P. (2021). To study nesting of white-backed vultures (Gyps bengalensis) in Surendrangar and Bhavnagar districts of Gujarat, India. J. Entomol. Zool. Stud. 9, 1834–1837.
Mundy P., Butchart D., Ledger J., and Piper S. (1992). The Vultures of Africa (London: Academic Press).
Murn C., Saeed U., Khan U., and Iqbal S. (2014). Population and spatial breeding dynamics of a Critically Endangered Oriental White-backed Vulture Gyps bengalensis colony in Sindh Province, Pakistan (: Bird Conservation International).
Muscarella R., Galante P. J., Soley-Guardia M., Boria R. A., Kass J. M., Uriarte M., et al. (2014). ENMeval: An R package for conducting spatially independent evaluations and estimating optimal model complexity for Maxent ecological niche models. Methods Ecol. Evol. 5, 1198–1205. doi: 10.1111/2041-210X.12261
Navaneethan B., Sankar K., Qureshi Q., and Manjrekar M. (2015). The status of vultures in Bandhavgarh tiger reserve, Madhya Pradesh, central India. J. Threatened Taxa 7, 8134–8138. doi: 10.11609/jott.2428.7.14.8134-8138
Nepal - Subnational Administrative Boundaries - Humanitarian Data Exchange (2023). Nepal - Subnational Administrative Boundaries - Humanitarian Data Exchange. Available online at: https://data.humdata.org/dataset/cod-ab-npl (Accessed July 20, 2021).
Norouzzadeh M. S., Nguyen A., Kosmala M., Swanson A., Palmer M. S., Packer C., et al. (2018). Automatically identifying, counting, and describing wild animals in camera-trap images with deep learning. Proc. Natl. Acad. Sci. U.S.A. 115, E5716–E5725. doi: 10.1073/pnas.1719367115
Nursamsi I., Partasasmita R., Cundaningsih N., and Ramadhani H. S. (2018). Modeling the predicted suitable habitat distribution of Javan hawk eagle Nisaetus bartelsi in the Java Island, Indonesia. Biodivers. J. Biol. Diversity 19, 1539–1551. doi: 10.13057/biodiv/d190447
Ogada D. L., Keesing F., and Virani M. Z. (2011). Dropping dead: Causes and consequences of vulture population declines worldwide. Ann. New York Acad. Sci. 1249, 57–71. doi: 10.1111/j.1749-6632.2011.06293.x
Olson D. M., Dinerstein E., Wikramanayake E. D., Burgess N. D., Powell G. V. N., Underwood E. C., et al. (2001). Terrestrial ecoregions of the world: A new map of life on Earth. BioScience 51, 933–938. doi: 10.1641/0006-3568(2001)051[0933:TEOTWA]2.0.CO;2
Oro D., Margalida A., Carrete M., Heredia R., and Donázar J. A. (2008). Testing the goodness of supplementary feeding to enhance population viability in an endangered vulture. PloS One 3, 4084–4085. doi: 10.1371/journal.pone.0004084
Phillips S. J., Anderson R. P., and Schapire R. E. (2004). “A maximum entropy approach to species distribution modeling,” in Proceedings of the Twenty-First International Conference on Machine Learning (ACM Press, New York), 472–486.
Phillips S. J., Anderson R. P., and Schapire R. E. (2006). Maximum entropy modeling of species geographic distributions. Ecol. Model. 190, 231–259. doi: 10.1016/j.ecolmodel.2005.03.026
Phillips S. J. and Dudík M. (2008). Modeling of species distributions with Maxent: new extensions and a comprehensive evaluation. Ecography 31, 161–175. doi: 10.1111/j.0906-7590.2008.5203.x
Phillips S. J., Dudík M., Elith J., Graham C. H., Lehmann A., Leathwick J., et al. (2009). Sample selection bias and presence-only distribution models: implications for background and pseudo-absence data. Ecol. Appl. 19, 181–197. doi: 10.1890/07-2153.1
Posit Team. (2025). RStudio: Integrated Development Environment for R. (Boston, MA: Posit Software, PBC). Available online at: http://www.posit.co/ (Accessed January 1, 2025).
Prakash V., Bishwakarma M. C., Chaudhary A., Cuthbert R., Dave R., Kulkarni M., et al. (2012). The population decline of Gyps vultures in India and Nepal has slowed since veterinary use of diclofenac was banned. PloS One 7, e49118. doi: 10.1371/journal.pone.0049118
Raina N., Khuman Y. S. C., Rao K. S., and Sreekesh S. (2014). Comparative analysis of species distribution modeling of Daphne papyracea in Dabka watershed Nainital district, Uttarakhand. J. Environ. Earth Sci. 4, 9–29.
Ramakrishnan B., Kannan G., Samson A., Ramkumar K., and Ramasubramanian S. (2014). Nesting of White-rumped vulture (Gyps bengalensis) in the Segur Plateau of the Nilgiri north forest division, Tamilnadu, India. Indian Forester 140, 1014–1018.
Ramesh T., Sankar K., and Qureshi Q. (2011). Status of vultures in mudumalai tiger reserve, Western Ghats, India. Forktail 27, 96–97.
Rana D. B., Chaudhary I. P., Dangaura H. L., Joshi A. B., and Bhusal K. P. (2019). Monitoring of nest and breeding status of White-rumped Vulture (Gyps bengalensis) in Nepal. Bird Conserv. Nepal 8, 28–31.
Robin X., Turck N., Hainard A., Hainard N., Lisacek F., and Sancheze J. -C., (2011). pROC: an open-source package for R and S+ to analyze and compare ROC curves. BMC Bioinf. 12, 77. doi: 10.1186/1471-2105-12-77
Rodriguez-Galiano V. F., Ghimire B., Rogan J., Chica-Olmo M., and Rigol-Sanchez J. P. (2012). An assessment of the effectiveness of a random forest classifier for land-cover classification. ISPRS J. Photogramm. Remote Sens. 67, 93–104. doi: 10.1016/j.isprsjprs.2011.11.002
Sehgal A., Kumar K., Rajan R., and Hore U. (2020). Nest records, nest site selection of Gyps bengalensis White-rumped Vulture and the role of feeding station in Kangra, Himachal Pradesh. bioRxiv. doi: 10.1101/2020.07.29.218362
Snyder N. F. and Snyder H. A. (2005). Condor conservation in a changing world Introduction to the California condor, Introduction to the California condo 81 (US: University of California Press).
Soberon J. and Peterson A. T. (2005). Interpretation of models of fundamental ecological niches and species distributional areas. Biodivers. Inf. 2, 1–10. doi: 10.17161/bi.v2i0.4
Sutherland W. J. and Green R. E. (2004). Habitat assessment. Bird ecology and conservation (Oxford: Oxford University Press), 251–268.
Swaminathan S. and Tantri B.R. (2024). Confusion matrix−based performance evaluation metrics. Afr. J. Biomed. Res. 27, 4023–4031. doi: 10.53555/AJBR.v27i4S.4345
Swets K. (1988). Measuring the accuracy of diagnostic systems. Science 240, 1285–1293. doi: 10.1126/science.3287615
Thakur M. L. and Narang S. K. (2012). Population status and habitat-use pattern of Indian White-backed Vulture (Gyps bengalensis) in Himachal Pradesh, India. J. Ecol. Natural Environ. 4, 173–181. doi: 10.5897/jene11.103
Thapa A., Wu R., Hu Y., Nie Y., Singh P. B., Khatiwada J. R., et al. (2018). Predicting the potential distribution of the endangered Red panda across its entire range using MaxEnt modeling. Ecol. Evol. 8, 10542–10554. doi: 10.1002/ece3.4526
U.S. Geological Survey (2006). Shuttle Radar Topography Mission (SRTM) Digital Elevation Data (Reston, USA: U.S. Department of the Interior). doi: 10.5066/F7PR7TFT
Venkitachalam R. and Senthilnathan S. (2015). Breeding record of Indian vulture (Gyps indicus) in moyar valley, Tamil Nadu, India. Curr. Sci. 109, 258–259.
Venter O., Sanderson E. W., Magrach A., Allan J. R., Beher J., Jones K. R., et al. (2018). Last of the Wild Project, Version 3 (LWP-3): 2009 Human Footprint 2018 release [Raster dataset, Version 2018.00] (NASA Socioeconomic Data and Applications Center (SEDAC). doi: 10.7927/H46T0JQ4
Wani H. M., Bhat B. A., Fazil M. F., Shansaz U. H., Haq I. U., and Bhat R. A. (2018). Status of vultures in India: A review. Int. J. Adv. Sci. Res. Manage. 3, 181–187.
Warren D. L. and Seifert S. N. (2011). Ecological niche modeling in Maxent: The importance of model complexity and the performance of model selection criteria. Ecol. Appl. 21, 335–342. doi: 10.1890/10-1171.1
Yang N., Ma D., Zhong X., Yang K., Zhou Z., Zhou H., et al. (2020). Habitat suitability assessment of blue eared-pheasant based on MaxEnt modeling in Wanglang National Nature Reserve, Sichuan Province. Acta Ecol. Sin. 40, 1–9.
Keywords: breeding habitat 1, MaxEnt 2, species distribution modeling 3, white-rumped vulture 4, LULC (land use land cover)
Citation: Baral N, Joshi S, Rai N, Joshi AB, Poudel K and Yadav SK (2025) Breeding habitat suitability modeling of white-rumped vulture (Gyps bengalensis, Gmelin JF, 1788) in proximity to vulture restaurants in central lowland of Nepal. Front. Conserv. Sci. 6:1645493. doi: 10.3389/fcosc.2025.1645493
Received: 11 June 2025; Accepted: 24 July 2025;
Published: 20 August 2025.
Edited by:
Carlos R Ruiz-Miranda, Universidade Estadual do Norte Fluminense, BrazilReviewed by:
Radhika Jha, Wildlife Institute of India, IndiaSudhir Ranjan Choudhury, Guru Ghasidas Vishwavidyalaya, India
Copyright © 2025 Baral, Joshi, Rai, Joshi, Poudel and Yadav. This is an open-access article distributed under the terms of the Creative Commons Attribution License (CC BY). The use, distribution or reproduction in other forums is permitted, provided the original author(s) and the copyright owner(s) are credited and that the original publication in this journal is cited, in accordance with accepted academic practice. No use, distribution or reproduction is permitted which does not comply with these terms.
*Correspondence: Nishan Baral, Tmk1NjdzaGFuQGdtYWlsLmNvbQ==, TmlzaGFuLmJhcmFsQGdpaXMuZWR1Lm5w