 Joe J. Figel1,2*
 M. Ibnu Akbar2,3Kamal Khairi2,4Darmansyah2Muhammad Pian1Supiyandi2Suhaili2Zainal Abidin2M. Randa Aritanoga2Karim Ali1Reduan1Rhomadani1Ilham Haris1Rija1,3Irhamdani1Hermansyah1Irwan Yoga2,5Eliyin S. Hut3
- 1Hutan Harimau, Padang, Indonesia
- 2Gayo Hijau Lestari, Takengon, Indonesia
- 3Universitas Gajah Putih, Takengon, Indonesia
- 4Leuser International Foundation, Banda Aceh, Indonesia
- 5Dinas Pendidikan dan Kebudayaan, Takengon, Indonesia
Density is a fundamental parameter for monitoring animal populations and determining actions for habitat management. We investigated sex-specific densities of critically endangered Sumatran tigers (Panthera tigris sumatrae) in provincially protected forests outside the National Park system in the Leuser Ecosystem of Indonesia. Sumatran tiger camera trap studies are characterized by imprecise density estimates derived from excessively sparse 90-day datasets, reflecting the challenges of obtaining adequate sample sizes on this rainforest carnivore. We overcame this obstacle with strategic reconnaissance, recruitment of highly skilled forest rangers, and deployment of infrequently used professional-grade camera traps. We used closed population spatial capture-recapture (SCR) models based on data from 52–64 paired camera stations to estimate densities of male and female Sumatran tigers, comparing results between 90-day and 180-day sessions. Camera trapping for 12-months (June–December 2023 and May–November 2024) accumulated 282 identifiable photographs, including 245 recaptures, of 27 adult tigers (14 females, 12 males, and 1 individual of unknown sex); average captures (recaptures) were 85 (67) and 141 (123) for the 90 and 180-day periods, respectively. Cumulatively, these results represent the most robust single-study Sumatran tiger camera trap dataset. During the 90-day sessions, sex-specific tiger densities ranged from 0.97 (± 0.37)–1.83 (± 0.59) female and 0.56 (± 0.22)–0.61 (± 0.29) male tigers. During the 180-day sessions, estimates were only negligibly more precise, ranging from 0.94 (± 0.33)–1.76 (± 0.54) female and 0.41 (± 0.15)–0.50 (± 0.22) male tigers. Across both years, densities were 1.42–2.35 tigers/100 km², about 2.5–4.1 times greater than the most recent estimates in the mountains of Gunung Leuser National Park. Our results support prioritization of spatial over temporal sampling for population monitoring of rare and elusive species as expanding the trap array resulted in greater precision of density estimates than extending the sampling period.
1 Introduction
Habitat loss and degradation, combined with poaching and prey depletion, continues to spur range contractions of tigers (Panthera tigris), already lost from ~90–95% of their historical distribution (Sanderson et al., 2023). Most tiger populations now occur in India where, bucking the trend of range-wide declines, several cases of significant tiger recoveries have followed commendable boosts in protection (Harihar et al., 2020; Karanth et al., 2020). Beyond protected areas in the productive habitats of South Asia, tiger status is mostly ominous, particularly in the rainforests of Southeast Asia (Sanderson et al., 2023). Although it contains ~33% of tiger habitats range-wide, Southeast Asia has already lost tigers entirely from the countries of Vietnam, Cambodia, and Laos (Sanderson et al., 2023). The species distribution is now restricted to 10 Asian countries.
In Sumatra, where recent work has generated more detailed distribution maps for the island’s critically endangered tigers (Goodrich et al., 2022), assessments on the status and trends of their populations remain limited by the absence of reliable data on population densities. Consequently, the range of the most recent Sumatran tiger (Panthera tigris sumatrae) population estimate (173–883 tigers) (Goodrich et al., 2022) varies by >500% and is essentially meaningless as a basis for monitoring evaluation and conservation planning.
The Sumatran tiger is an apex predator and rainforest-adapted species that has regulating effects on prey populations and sympatric carnivores (Karanth and Sunquist, 1995; Widodo et al., 2022). It also holds significant cultural significance among people in Sumatra’s forest-edge villages (Kartika, 2023). Due to their high metabolic demands, Sumatran tigers require access to expansive habitats stocked with abundant prey (Linkie et al., 2006). Monitoring of the species’ population trends can therefore provide crucial indicators of ecosystem health in Sumatran tropical rain forests, among the most biodiverse biomes on the planet (IUCN, 2004; BBTNGL, 2025).
The reliability of species status assessments is dependent on the availability of accurate and precise estimates of demographic parameters, both of which have been persistently challenging to obtain for Sumatran tigers. Unbiased density estimates require adequate data, including sufficient sample sizes of distinct individuals and recaptures, both of which are rarely attainable for this rainforest carnivore. If density estimates are robust, with sufficient precision to detect significant change across study areas or through time, they can be compared with results from other surveys (Karanth and Nichols, 2017). If density estimates are constrained by biased representation of tiger habitats or lack precision, then unfounded extrapolation can result in erroneous inference (Gopalaswamy et al., 2019). Increasing sampling effort can overcome these issues, but it is beset by logistical challenges, prohibitive costs, and potential violations of key population estimation assumptions (Royle et al., 2013).
Despite 60-70% of remaining Sumatran tiger habitats occurring outside nationally-designated protected areas, all spatial capture-recapture (SCR) density estimates (n=18) focused exclusively on the species’ populations inside National Parks and Wildlife Reserves (Linkie et al., 2006; Wibisono et al., 2009; Sunarto et al., 2013; Pusparini et al., 2018). A previous attempt to estimate tiger density in Gunung Leuser National Park used single (i.e., unpaired) cameras that resulted in only ten photographs of five individual tigers (Luskin et al., 2017) Besides significant reductions in detection probabilities, use of single cameras that photograph only one flank of passing tigers inevitably reduces tiger identification datasets thereby causing greater bias in density estimates (O’Connor et al., 2017). The most recent Sumatran tiger population assessment in Gunung Leuser National Park, based on sample sizes of 4–8 individuals detected during four sampling periods, estimated densities of 0.40 (± 0.19 SD)–0.73 (± 0.42) tigers/100 km² in mountainous terrain of the park’s interior (Hadi et al., 2025).
Following the methods of pioneering tiger capture-recapture studies in India (Karanth, 1995), where the species’ densities are ~5–10 times higher than those in tropical rainforests, most tiger density estimates range-wide are derived from 2–3 month sampling periods (Goodrich et al., 2022). This timeframe is required to satisfy the key assumption of demographic population closure (Otis et al., 1978; Karanth and Nichols, 2017). Compared to the productive savannahs, grasslands, and deciduous forests of the Indian subcontinent, Sumatra’s extensive tracts of predominantly mountainous rainforests, lower prey biomass, and lower tiger densities create conditions that present numerous logistical challenges. Hence, there are context-dependent trade-offs between meeting population closure and obtaining sufficient sample sizes of tigers.
Sample size challenges are further magnified considering the seldom-obtained need for sex-specific population parameters. Tigers are polygamous and males do not contribute to the nursing and parental care of cubs, which makes females the most significant contributors to the species’ population dynamics (Smith et al., 1987; Harihar et al., 2020). Female tigers are also more philopatric and have smaller home ranges than males (Smith, 1993; Simchareon et al., 2014). Female home range size generally varies inversely with their densities which, in turn, can be used to evaluate local carrying capacity for the species (Majumder et al., 2012; Simchareon et al., 2014). Estimation of female densities is therefore crucial for tiger population monitoring.
Despite the importance of distinguishing female and male tigers, most Sumatran tiger camera-trap studies do not report sex ratios and female-specific densities have yet to be estimated. Sex differences are challenging to obtain due to the need for adequate sample sizes of male and female tigers (Duangchantrasiri et al., 2024). Recent camera-trap studies on large felids have advocated for longer sampling sessions to increase numbers of captures and recaptures despite higher risks of violating the closure assumption (Dupont et al., 2019; Harmsen et al., 2020).
Our objectives were to 1) estimate sex-specific population densities of Sumatran tigers; 2) compare tiger density and movement estimates based on varying survey efforts in space (e.g., trap array size) and time (e.g., standard 90-day sessions and extended 180-day sessions); and 3) estimate naïve occupancy and relative abundance indices of main tiger prey, competing carnivores, and – as an index of human disturbance and protection – humans in three categories: hunters, unarmed villagers, and rangers.
2 Materials and methods
2.1 Study area
The Leuser Ecosystem (hereafter Leuser) is part of the largest contiguous tiger habitat remaining in Sumatra. Found in the island’s provinces of Aceh and North Sumatra, the ecosystem spans 2.65 million hectares (ha) of lowland (0–300 m), hill (301–800 m), submontane (801-1400), montane (1401-2000), and upper montane (2001 +) forest (BBTNGL, 2025). Significant tracts of threatened peat swamp forests flank the ecosystem’s western boundary. Collectively, Leuser’s habitats store an estimated 1.6 billion tons of carbon (Roberts et al., 2025). In Leuser’s core lies the 8,303 km² Gunung Leuser National Park, which is part of the “Tropical Rainforest Heritage of Sumatra” UNESCO World Heritage site (IUCN, 2004). Leuser is considered a National Strategic Area for its environmental protection function (under Law No. 26/2007 juncto Law No. 26/2008).
Leuser supports populations of four ungulate species, all prey of tigers – sambar (Rusa unicolor), wild pig (Sus scrofa), southern red muntjac (Muntiacus muntjac) and serow (Capricornis sumatraensis). Tiger presence is strongly associated, in particular, with the availability of sambar; this ~130 kg cervid is a preferred prey of tigers range-wide (Karanth and Sunquist, 1995; Simchareon et al., 2018) but is largely absent from all but the most inaccessible or best protected sites in Southeast Asia (Steinmetz et al., 2021; Widodo et al., 2022). Sympatric carnivores sharing some prey preferences with tigers in Leuser include clouded leopard (Neofelis diardi) and dhole (Cuon alpinus) (Figel et al., 2024).
Leuser is critical for tiger conservation because it contains the largest expanses of unfragmented forests remaining in Sumatra. Approximately 44% of this indispensable ecosystem meets the criteria of an “intact forest landscape,” (hereafter intact forest) defined as forests that “exhibit no remotely detected signs of human activity or habitat fragmentation and are large enough to maintain all native biological diversity, including viable populations of wide-ranging species” (Potapov et al., 2013). The northern forests of Leuser also form part of key, yet tenuous, connections with the adjacent Ulu Masen Ecosystem (Figel et al., 2024). Combined, these two ecosystems comprise a contiguous 3.6 million ha expanse of tiger-occupied forests, the largest such landscape in Sumatra and the second-largest in southeast Asia (Sanderson et al., 2023).
Despite its paramount importance, Leuser is persistently threatened by habitat conversion from illegal logging, road and oil palm plantation development, and gold mining and the instability caused by the socio-ecological disasters that these activities exacerbate (Supriatna et al., 2017; Lubis et al., 2024). The region is further imperiled by chronic poaching, particularly in areas insufficiently patrolled by rangers (Figel et al., 2021, 2024).
We conducted this study in nationally unprotected forests in Leuser’s northern stretches in Aceh Province, Sumatra. Mean elevation in our study area was 693 meters above sea level (range 117–1955 meters). Landcover types include protection forest (hutan lindung), production forest (hutan produksi), and agricultural areas (area penggunaan lain). Whereas the ‘protection forest’ designation strictly prohibits logging or any other extractive activity, permitted logging operations are permissible in production forests. Soil type in our study area is comprised mainly of ultisols and complex entisols-inceptisols. Average annual rainfall is 1,800–2,500 mm. The major habitat type is tropical moist broadleaf forest, where rainfall occurs throughout the year. However, there is a distinct drier season from June–August; this three-month period generally receives only ~10–12% of annual rainfall. Conversely, 35–40% of annual rainfall generally falls October-December (BBTNGL, 2025).
2.2 Data collection
We conducted reconnaissance in the study area using 34 paired cameras from March–May 2023. The main objectives of this exploratory survey were to maximize probabilities of detecting tigers by locating optimal sites for camera-trap installation and to identify the most skilled local collaborators from selected forest-edge communities for subsequential hire as rangers. We were also interested to gain a better understanding of tiger sex-ratios and habitat use.
Following the 3-month reconnaissance, we covered the refined study area with 4 x 4 km grid cells and installed 1–2 paired camera stations in each cell. This grid cell size, standardized according to the best available data on Sumatran tiger movements, ensures there are no holes in the trap array where individual tigers may be undetectable during the sampling (Wibisono et al., 2009; Figel et al., 2024). We used infrared, professional-grade cameras manufactured by Reconyx (Holmen, WI, USA–HC600, PC800, HF2x, and XR6 models) and Spartan (Duluth, GA, USA–SR2-BK model).To simultaneously photograph both flanks of passing tigers, we positioned cameras at heights of 40–45 cm on trees opposite each other along forest trails. To maximize photographic detections of tigers, we placed cameras along their known travel pathways, as determined by the reconnaissance and innate ranger knowledge of the study area. To avoid damage from high humidity, we placed fresh desiccant sheets inside cameras before each session. All sampling was completed upon receiving national and regional permits.
To ensure images remain secured, we used encrypted DigiKey® (Thief River Falls, MN, USA) SD cards that require a user password to ‘unlock’ images before downloading. As researchers working on a highly persecuted and critically endangered species, we considered it our professional responsibility to use this measure of enhanced data security, particularly when working with rangers with whom we had not previously collaborated.
In 2023, we maintained cameras at 59 stations from June–December; 70% of the stations were in lowland and hill forests at elevations below 800 meters. With an average trap spacing of 1.64 km, the 2023 trap array spanned 308 km². Land cover in the 2023 polygon was comprised of 70% protection forest, 17% production forest, and 13% farming areas. Intact forest comprised 26% of the protection forest and18% of the polygon overall.
In 2024, we installed cameras at 73 stations and ran them from May–November; 68% of the stations were in lowland and hill forests. For the 2024 sessions, average trap spacing was 1.51 km, and the extra 14 stations expanded the trap array to 600 km². Land cover in the 2024 polygon was comprised of 50% protection forest, 36% production forest, and 14% farming areas. Intact forest comprised 18% of the protection forest, and 9% of the polygon overall.
We completed surveys comprised of two 90-day sampling periods (hereafter sessions) and two 180-day sampling sessions. The 90-day time frame is commonly used in tiger capture-recapture studies to minimize the potential for violating the key assumption of population closure, which implies that the study population does not experience change (e.g., births, deaths, immigration, and emigration) during the study period. Given the 10–15 year lifespan of wild tigers, sampling over short durations of the standard 90-day sessions increases the likelihood of demographic closure (Sunquist, 1981; Karanth and Nichols, 2017). However, studies of more sparsely distributed populations (such as tigers in Sumatran rainforests) may require extended sampling to obtain adequate captures and recaptures (Dupont et al., 2019; Harmsen et al., 2020). Thus, we used the 180-day sessions to provide a clear basis for comparison.
2.3 Data analysis
A single observer, with 20 years of experience identifying individuals of marked animals from camera-trap images, identified tigers based on visual analysis of their unique stripe patterns (Figure 1). To test reliability of the identification, a second observer analyzed a random subset of 40% of the tiger images. We focused on side flanks and hind legs because these positions enabled more reliable identification. We assigned sex to tigers based on the presence of visible genitalia.
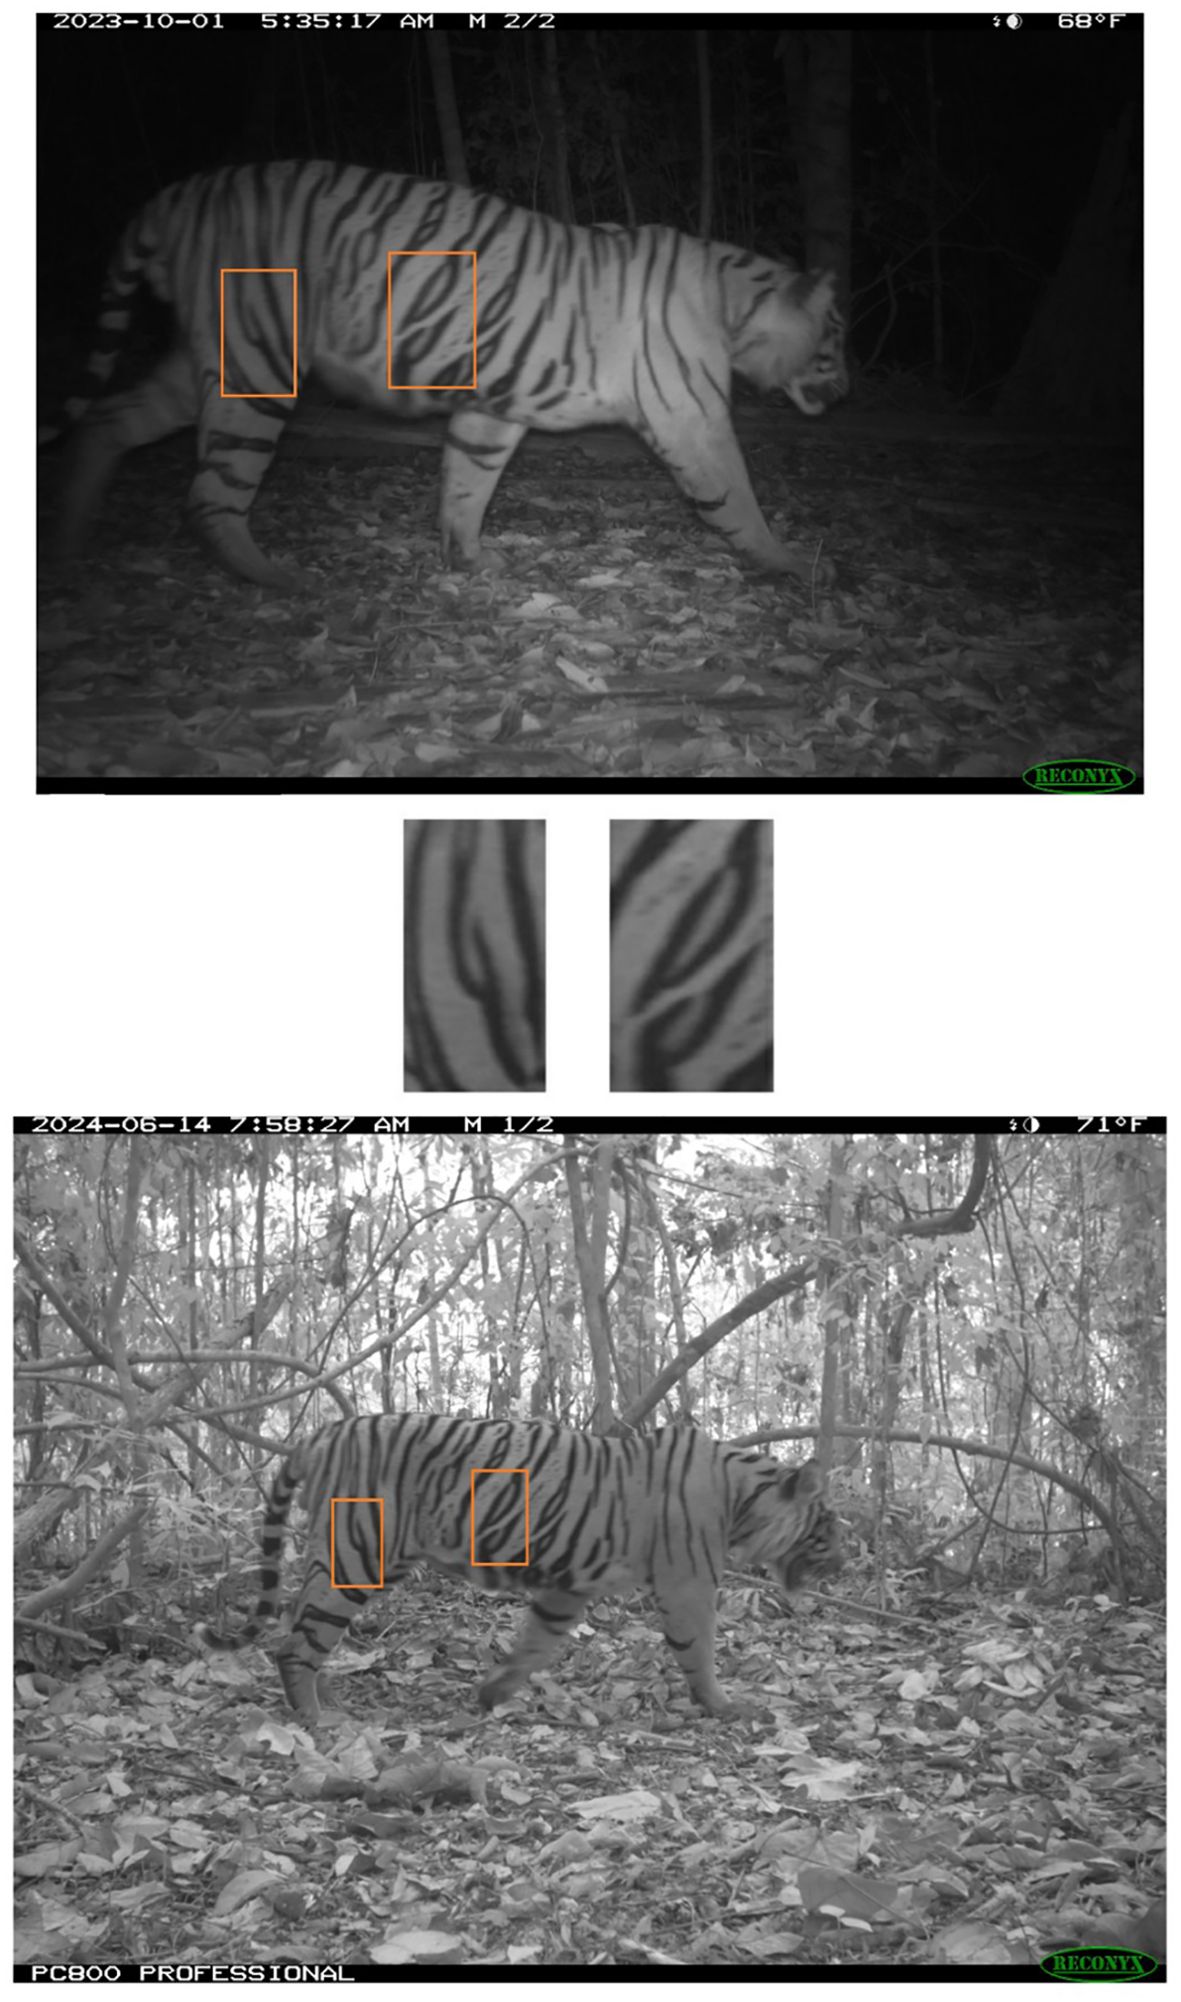
Figure 1. Determining identification of individual tigers based on stripe patterns on the flank and hind leg. This male tiger was photographed during both sampling years in the Leuser Ecosystem.
We compiled encounter histories for all tigers photo-captured at camera-trap locations using 1-day sampling occasions over two sampling sessions of 180 days, subsampling into two 90-day sessions.
In R v4.5.0, we used the spatially-explicit capture-recapture (SECR) package to obtain estimates of tiger density (D) based on spatial encounter data of individuals. The density estimates are based on the number of individuals photo-captured, the frequency at which they are photo-captured, and distances they move within the trap array during the sampling session (Royle et al., 2013). The SECR package, which follows a maximum-likelihood framework, also integrates detections of individuals across multiple cameras to estimate an “activity center” for each animal. Detection is modelled as a decreasing function of distance between an animal’s activity center and a given trap (Efford, 2024). The first input file for SECR included information (UTM coordinates) on trap locations and a matrix indicating the functional status of the trap: active (1) or inactive (0) on each occasion. The second file contained information on individual tigers photo-captured including the occasion (1–90 and 1–180 for the standard and extended sessions) and camera (detector) of captures.
These captures (observations) are assumed to be Bernoulli (binary) outcomes:
where pi,j,k is the probability of encountering individual i in trap j and occasion k, which is dependent on the distance between the trap location (xj) and the activity center (si) of the individual, as follows:
Besides densities, SECR estimates detection probability (g0) and sigma (σ), a spatial scale parameter that indexes animal movements and is related to the radius of an individual’s home range size (Efford, 2024). Accurate estimation of σ, which is based on captures of individuals at different locations across the camera-trap array, is dependent on adequate spatial recaptures that sufficiently sample the animals’ movement (Royle et al., 2013). If the number of sampled individuals remains constant between sessions but they exhibit greater movements, densities generally decrease. If, on the other hand, there are more individuals photo-captured between sessions, but their movements remain similar, densities would be expected to increase. This inverse relationship between densities and σ is consistent among camera-trap studies and validated by telemetry data (Sharma et al., 2010; Sunarto et al., 2013; Hadi et al., 2025).
We began the model selection process by using Akaike’s Information Criterion corrected for small sample size (AICc) to compare two detection functions (HN=half-normal and EX=negative exponential) that best fit the observed data. We did not consider the hazard rate (HR) detection function because it requires an extra parameter and is recommended only for study areas fully surrounded by natural or artificial boundaries (Efford, 2025), conditions inapplicable to ours. Generally, density estimates are insensitive to the specific detection function (Efford et al., 2009). However, estimates of σ – which serves as a metric of home range size (Royle et al., 2013) – will vary significantly depending on use of the HN or EX functions.
We fitted a null model (D~1, g0~1, sigma~1) with two separate detection functions: HN and EX. The null model assumes uniform distribution of activity centers throughout the region of interest, known as the state space (S) (Royle et al., 2013):
In total, our candidate set of models included the null model (D~1, g0~1, sigma~1) and a local trap response model that considered an individual’s previous detection at a specific site (D~1, g0~bk, sigma~1). The bk predictor assumes that the animal responds differently at site-specific traps after first capture (Efford, 2024). We did not use white-flash cameras nor did we use attractants at camera stations. Therefore, we did not expect any direct behavioral response to placement of our cameras per se. Trap-specific behavioral responses are generally associated with baits or lures used to attract animals (Royle et al., 2011). However, it is plausible that cameras may have been unknowingly placed near microhabitat features favored by individual tigers (e.g., a den for sheltering cubs or a favored hunting spot near a saltlick), thereby affecting influence of the bk predictor.
Estimates of tiger home range size and ranging behavior vary considerably between males and females (Smith, 1993; Simchareon et al., 2014); these differences affect capture probabilities and therefore warrant sex-specific analyses. To account for these important differences between sexes and reduce potential for biased estimates, we ran separate analyses for femaleand male densities.
To define the state space for our study area we used the function “suggest.buffer,” which resulted in recommended buffer widths of 8.1–9.9 km for females and 15–16 km for males in the 2023 sampling session. For the 2024 sampling sessions, when we expanded the trap array to 600 km², the recommended buffer widths were 8.8–9 km for females and 14.7–17 km for males. The resulting state space contained sampling areas of 1,560 km² in 2023 and 2,676 km² in 2024; these areas represent 6% and 10.3% of the entire Leuser Ecosystem. The state space must be sufficiently large to include the activity centers of all tigers exposed to detection on the camera-traps (Royle et al., 2013).
For sympatric carnivores, prey, and humans, we estimated naïve occupancy based on the proportion of cameras where a species or person was detected. We also calculated a relative abundance index (RAI) for each as the number of independent detections per 100 camera trap-nights. For estimating species-habitat relationships, RAI can be an informative state variable to guide management (Karanth and Nichols, 2017). Detections were considered independent if photographs taken at the same camera-trap location were separated by ≥ 60 minutes.Humans carrying firearms were categorized as “hunters” and unarmed humans were classified as “villagers.” Rangers were distinguished based on their uniforms and use of 65-80-L hiking backpacks, both of which are not worn by hunters and villagers.
3 Results
Our study accumulated 15,746 trap nights (TN) and amassed 318 Sumatran tiger photographs, of which 282 (88.7%) were deemed sufficiently clear by both observers to enable individual identification. Based on this sample, our analysis of unique stripe patterns identified 27 adult tigers—14 females, 12 males, and 1 individual of unknown sex (Table 1). During the 2023 90-day sampling session, we documented three distinct sets of cubs (Figure 2). One pair of male cubs dispersed and both individuals were photographed as adults in 2024.
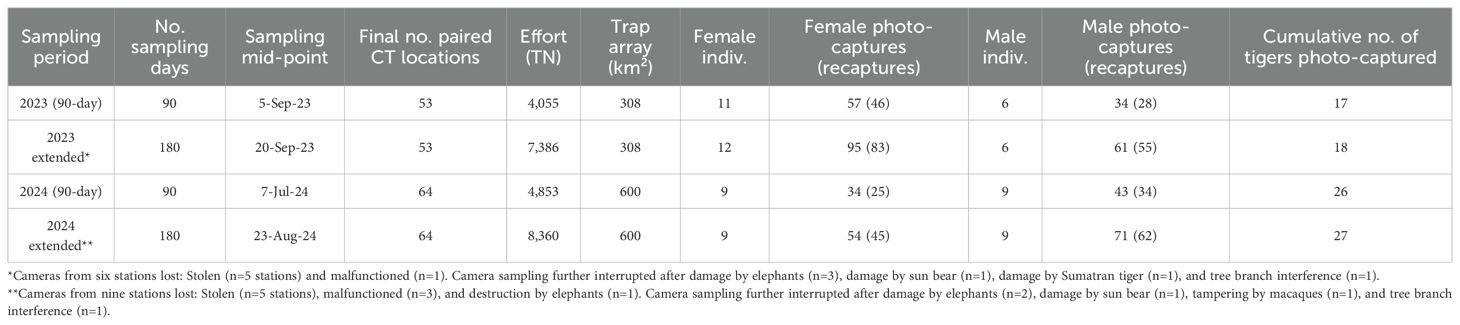
Table 1. Details of Sumatran tiger camera-trap surveys in the Leuser Ecosystem, 2023–2024.
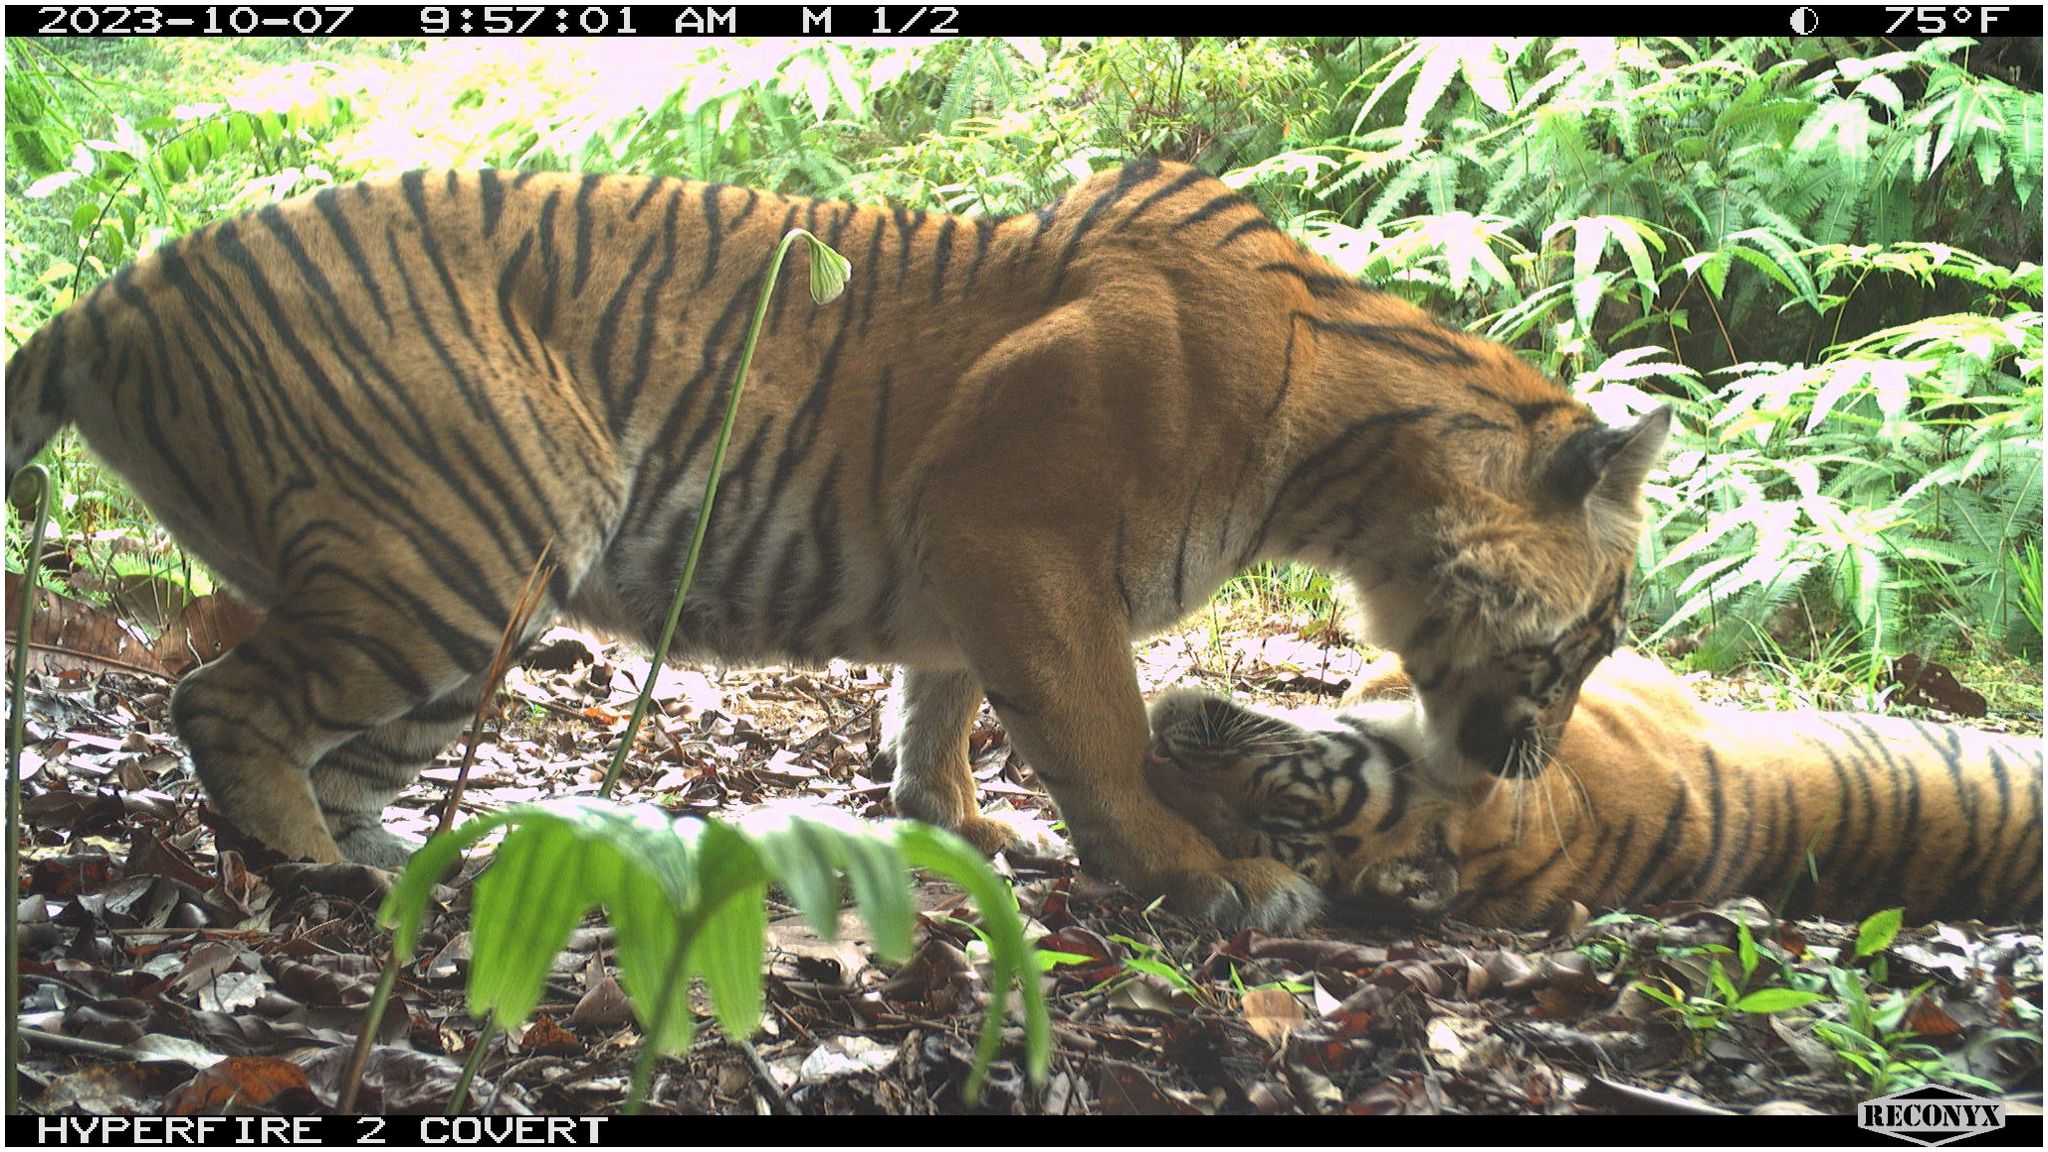
Figure 2. A resident female Sumatran tiger grooming one of her two large male cubs in the Leuser Ecosystem in October 2023. The cub dispersed and was recorded in June 2024 at a straight-line distance of 6.2 km from the site of this photograph.
Tigers were detected by 34 of the 53 (64%) cameras in 2023 and by 38 of the 64 (59%) cameras in 2024. Six of the females (43%) and three of the males (25%) were photographed during the first and last months of our surveys, exhibiting tenures of ≥18 months throughout the study. In contrast, four of the females (29%) and five of the males (42%) were photo-captured ≤ three times throughout the sampling.
Comparing the sexes, female detection probabilities (g0) were ~2 times higher than males in the 2023 90-day sampling sessions but detection probabilities were nearly identical between the sexes during the 180-day sampling sessions. Detection probabilities declined by 50% for both sexes in 2024 as the polygon doubled in size, encompassing 2.1 times greater proportion of production forest: g0 of female tigers were 0.046 (0.016) in 2023 and 0.024 (0.009) in 2024. Comparing the sampling sessions, female g0 were 54–63% lower in the 180-day sessions while male g0 were similar during both sessions.
Between sexes, estimates of female densities were consistently higher among sampling sessions, ranging from 0.92 (SE 0.34) in the 2024 180-day session to 1.80 (0.59) tigers/100 km² in the 2023 90-day session (Tables 2, 3). Estimates of male densities were more precise, ranging from 0.33 (SE 0.16) in the 2024 90-day sampling to 0.61 (0.29) tigers/100 km² in the 2023 90-day session (Figure 3).
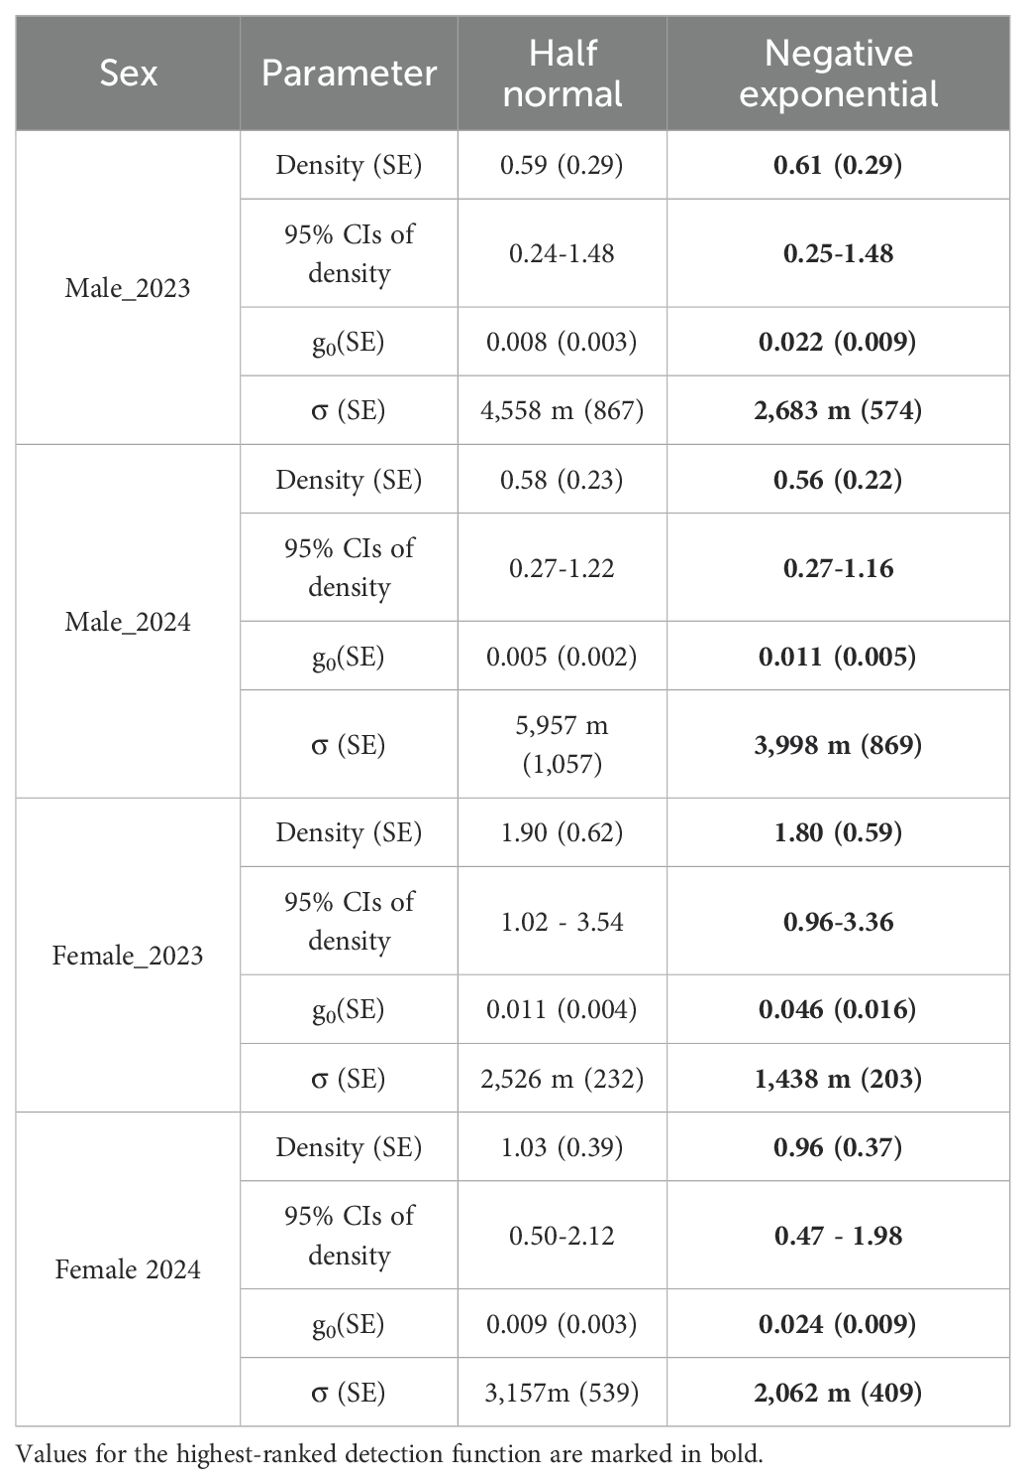
Table 2. Parameter estimates from two detection functions for male and female Sumatran tiger density estimates in the Leuser Ecosystem, 90-day, 2023–2024.
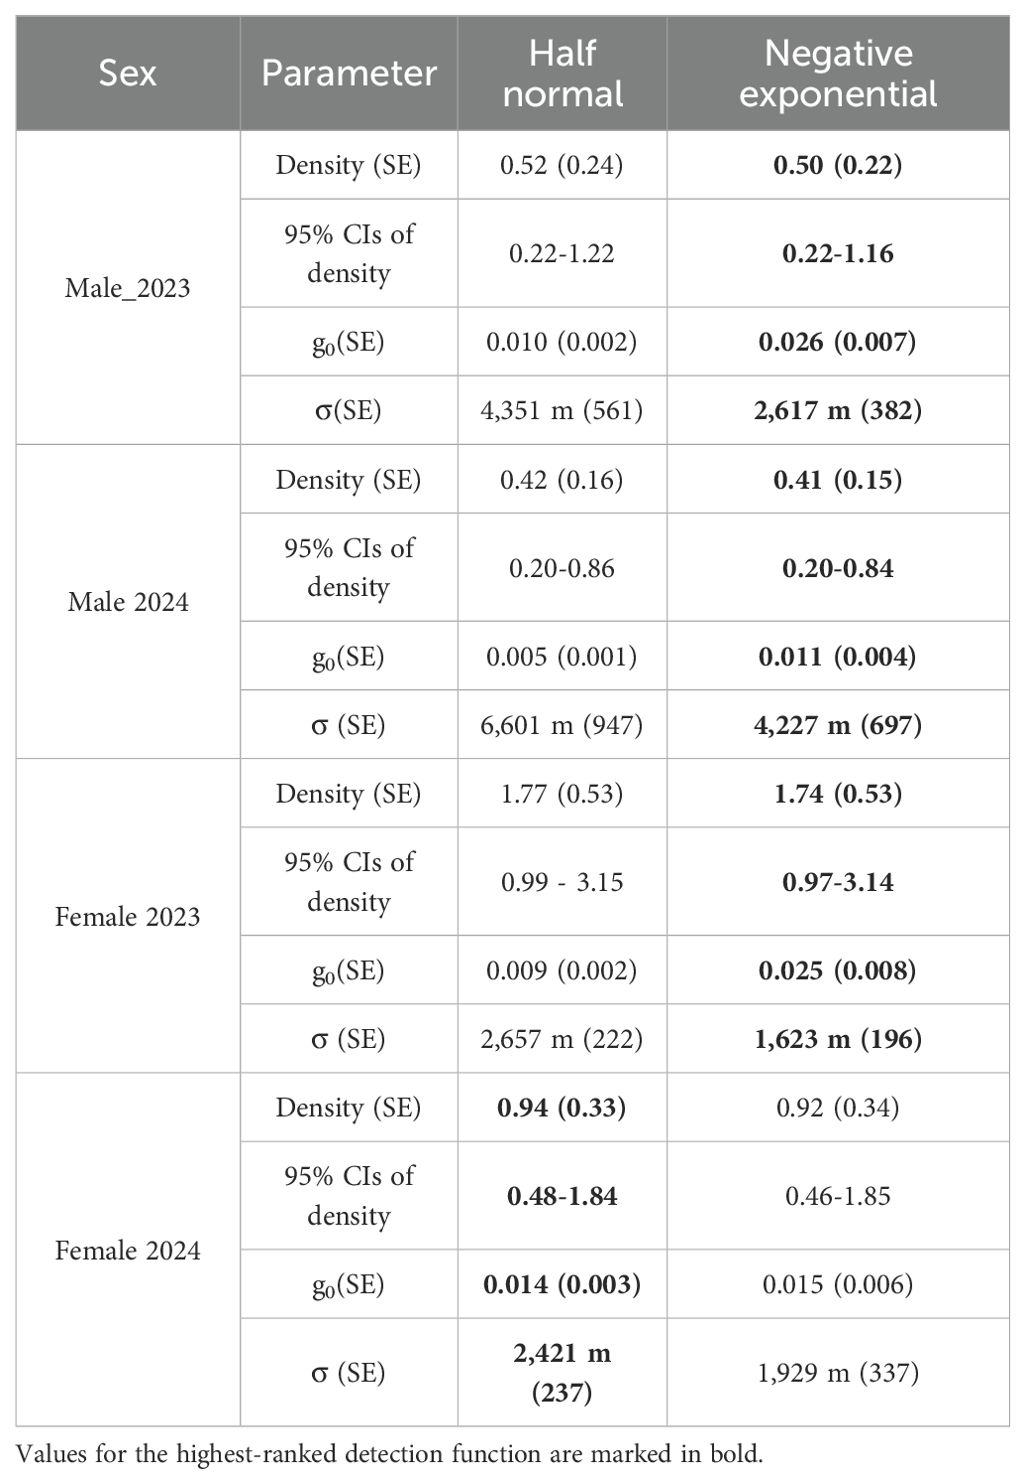
Table 3. Parameter estimates from two detection functions for male and female Sumatran tiger density estimates during the 180-day sessions in the Leuser Ecosystem, 2023–2024.
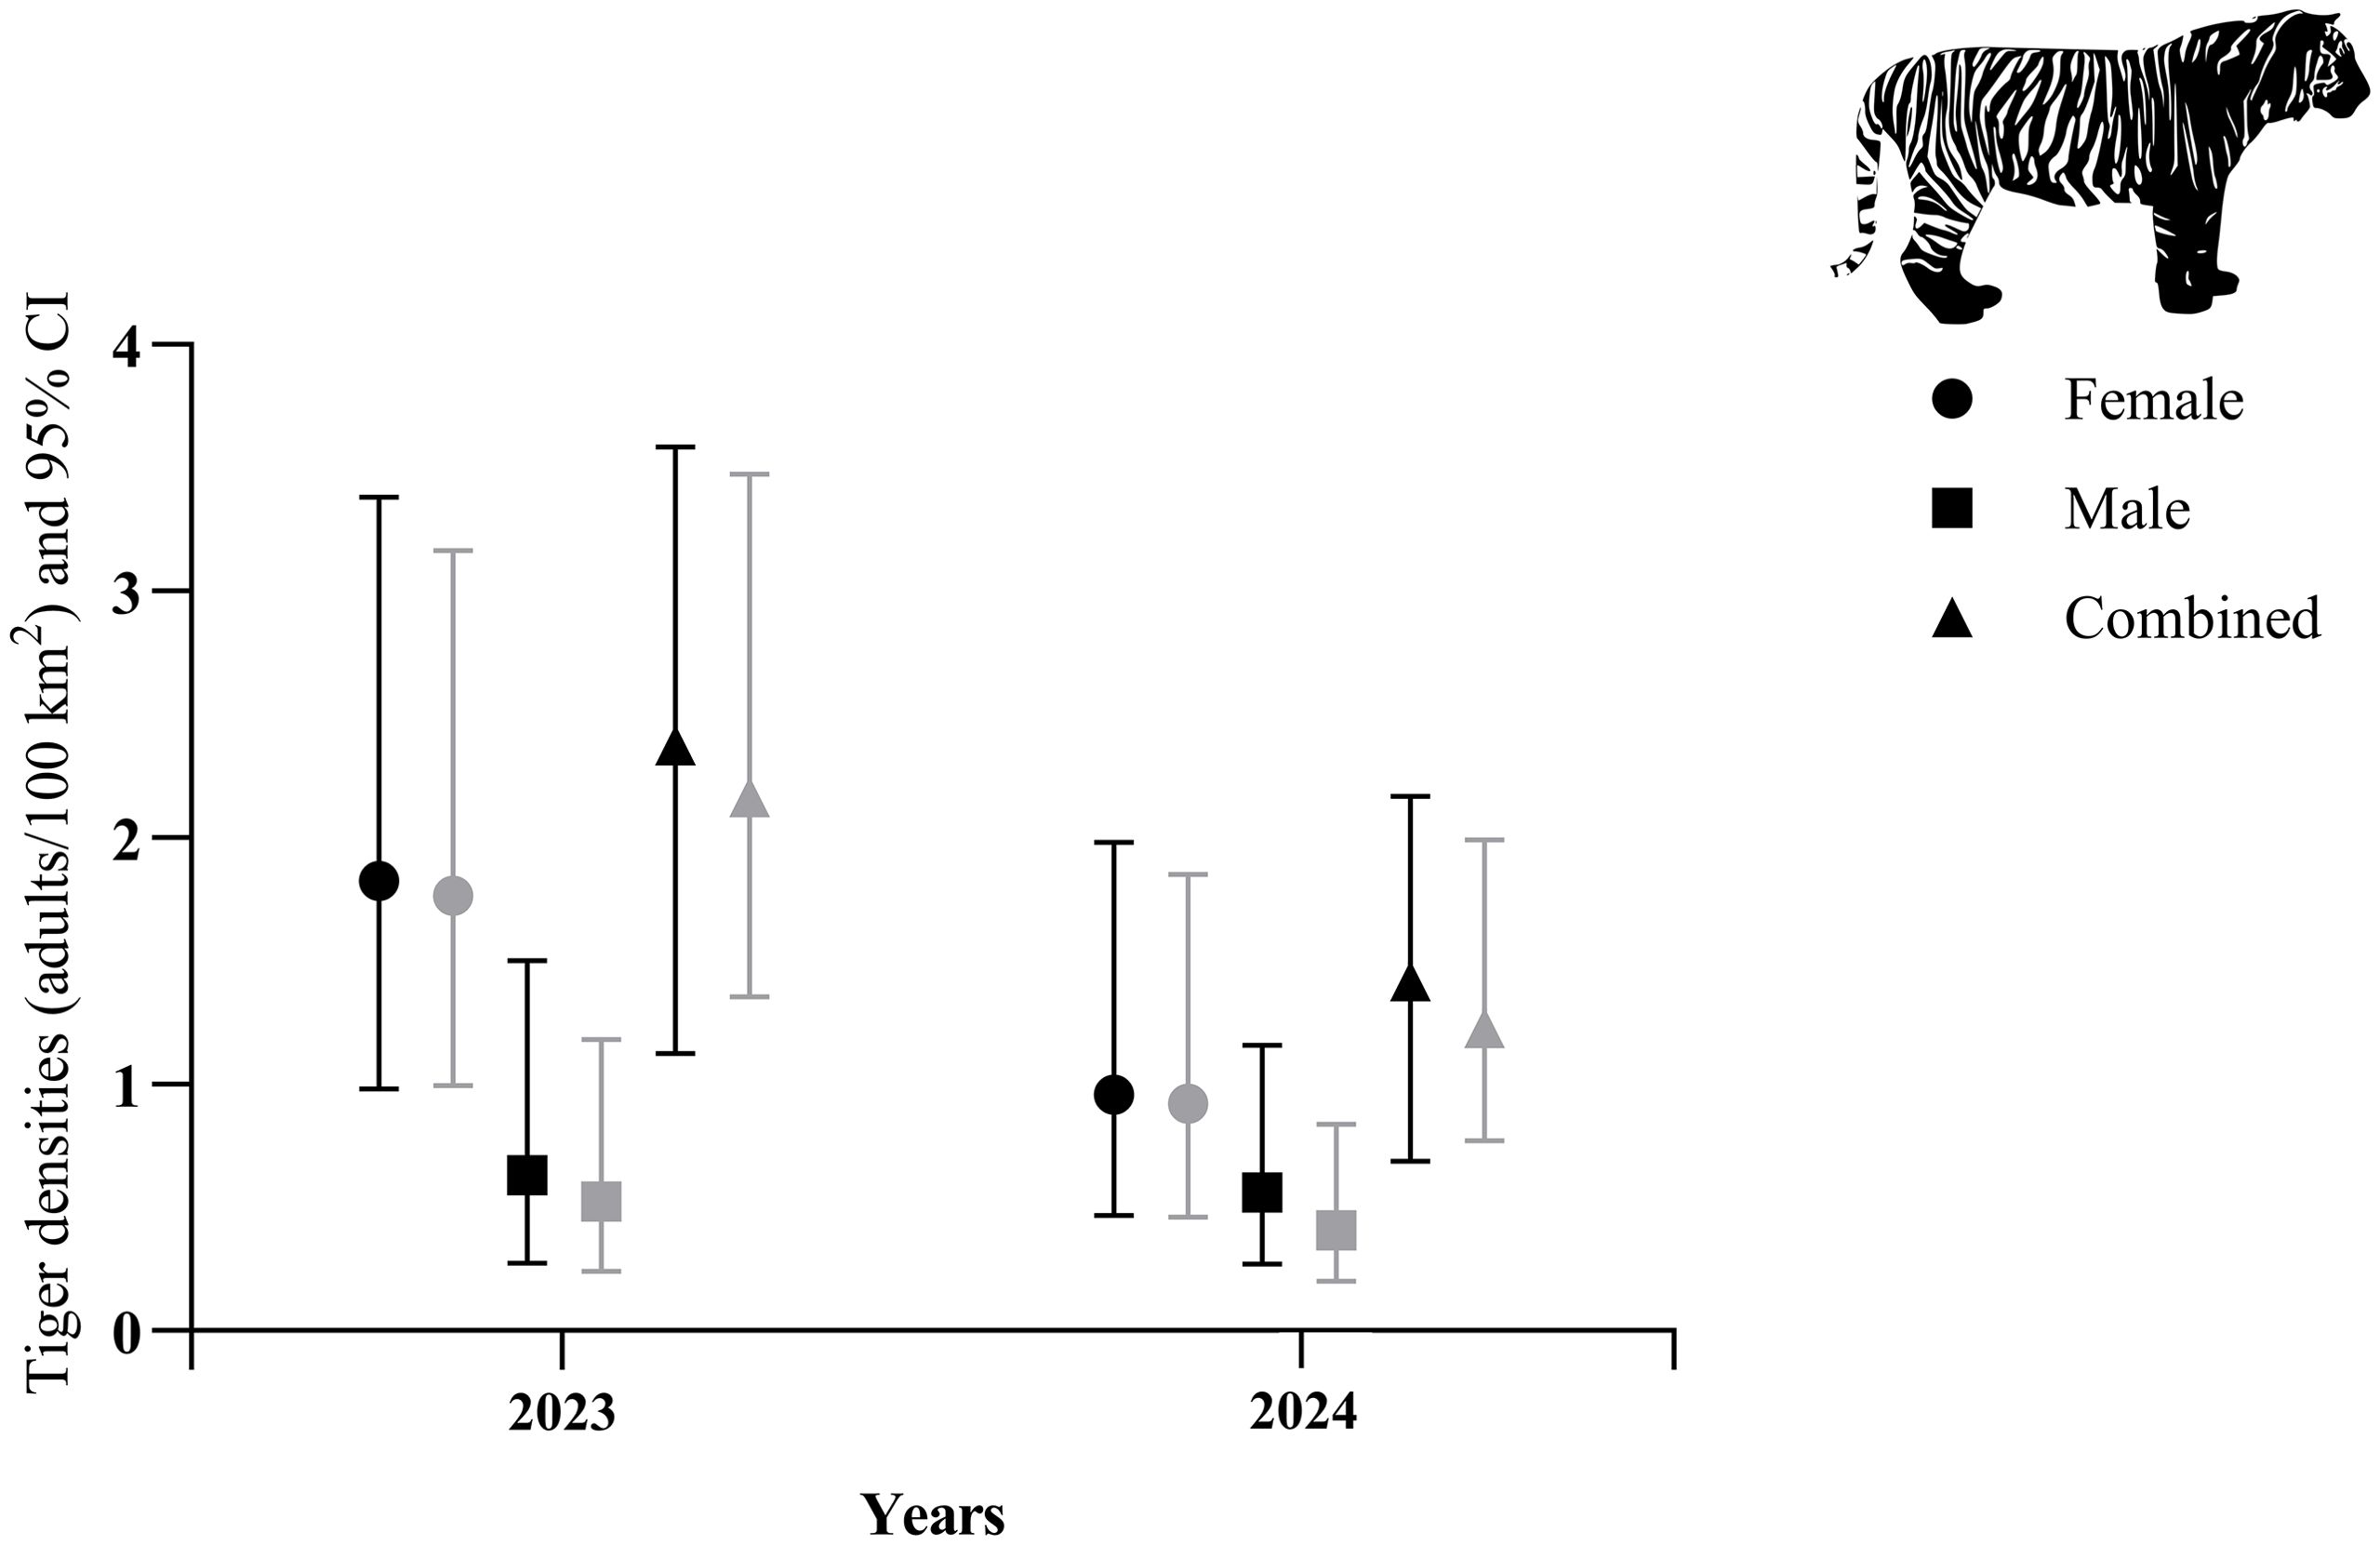
Figure 3. Densities of male and female Sumatran tigers in the Leuser Ecosystem, 2023–2024. Data are separated by 90-day (black symbols) and 180-day (gray symbols) sampling sessions. The vector graphic is from phylopic.org.
3.1 Estimates of female densities and movements
For the 90-day sessions, detection rates of individual female tigers ranged from 1–12 (mean =5.2) and from 1–9 (mean = 2.3) during the 2023 and 2024 sessions, respectively. Four of the females were detected only once during both years. For the 180-day sessions, detection rates of individual female tigers ranged from 1–15 (mean =7.9) and from 1–13 (mean = 6) during the 2023 and 2024 sessions, respectively. Two of the females were detected only once during the longer session in 2023 and, in 2024, one female was detected only once.
Based on AICc, the null models with the EX detection function were the highest ranked for the female tiger data from both 90-day sessions (Table 2). However, for the 2023 180-day session, the best fit model allowed g0 to vary by behavioral response (bk). For the 2024 180-day session, the best fit model was the HN detection function that allowed g0 to vary by behavioral response (bk). However, we also report estimates of σ from the model containing the HN detection function because it was within 2 delta AIC of the top-ranked model.
Estimated female densities for the 90-day sessions were 1.80 individuals/100 km² (95% confidence interval 0.96–3.36) in 2023 and 0.96 individuals/100 km² (95% confidence interval 0.47–1.98) in 2024. For the 180-day sessions, estimated female densities were 1.74 individuals/100 km² (95% confidence interval 0.97–3.14) in 2023 and 0.92 individuals/100 km² (95% confidence interval 0.46–1.85) in 2024.
The σ parameter in the SCR EX model indicated the movements of female tigers ranged from 1.44 ± 0.20 to 2.06 ± 0.41 km in the 90-day sessions and 1.62 ± 0.20 km in the 2023 180-day session. For the 2024 180-day session, the HN model indicated movements of 2.4 ± 0.24 km.
3.2 Estimates of male densities and movements
Detection rates of individual male tigers ranged from 2–10 (mean=5.7) and from 1–15 (mean =4.8) during both 90-day sessions. All males were detected at least twice during the 2023 sampling while four of the males were detected only once in 2024. During the 180-day sessions, these values ranged from 2–17 (mean=10.2) and from 1–22 (mean =7.9). All males were detected at least twice in 2023 but three of the males were detected only once during the longer sampling in 2024.
For male tigers in both sessions of 2023, the null models with the EX function were the highest ranked. For male tigers in both 2024 sessions, learned behavioral response influenced capture probability, with the local trap response model (bk) ranking highest.
Estimated male densities during the 90-day sessions were 0.61 individuals/100 km² (95% confidence interval 0.25–1.48) in 2023 and 0.56 individuals/100 km² (95% confidence interval 0.27-1.16) in 2024. For the 180-day sessions, male densities were 0.50 individuals/100 km² (95% confidence interval 0.22–1.16) in 2023 and 0.41 individuals/100 km² (95% confidence interval 0.20-0.84).
The σ parameter in the SCR EX model indicated the movements of male tigers ranged from 2.68 km ± 0.57 km to 4 km ± 0.87 km in the 90-day sessions and 2.62 km ± 0.38 to 4.23 ± 0.70 km in the 180-day sessions.
3.3 Naïve occupancy and relative abundance of prey and sympatric carnivores
During the 90-day sampling sessions1, we recorded at least one of the four ungulate prey species at 94% and 100% of the camera stations in 2023 and 2024. Cumulatively, sambar, wild pig, serow, and muntjac were detected at 24, 38, 4, and 50 camera stations, resulting in naïve occupancies of 0.45, 0.72, 0.08, and 0.94, respectively (Table 4). The highest RAI was recorded for muntjac (16.46 captures/100 TN) and the lowest for serow (0.08/100 TN). RAI for sambar and wild pig was 1.61 and 3.88 captures/100 TN.
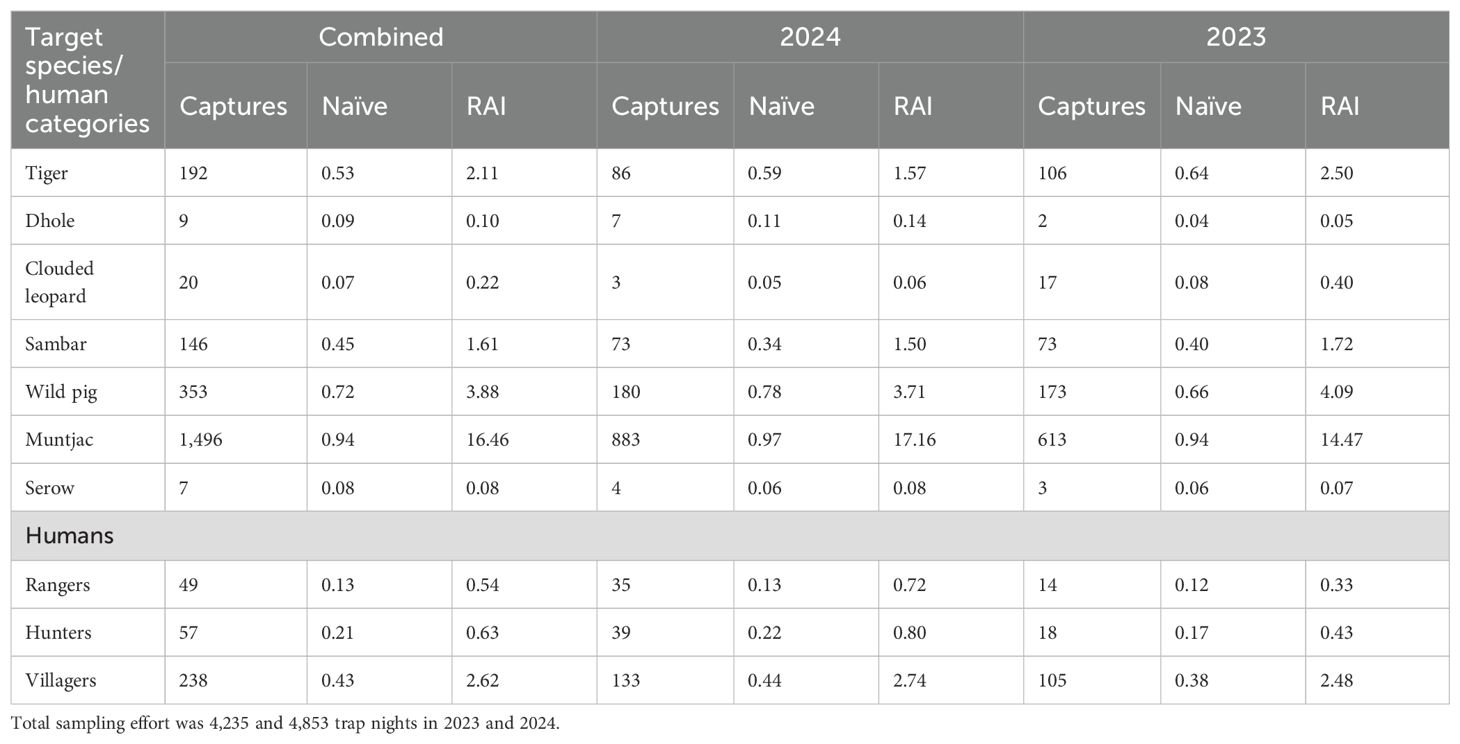
Table 4. Camera-trap derived (90-day sessions) naïve occupancy and relative abundance indices (RAI) for Sumatran tigers and competing carnivores, main prey species, and humans in the Leuser Ecosystem, Sumatra, Indonesia, 2023 and 2024.
Two competing carnivores that have overlapping prey preferences with tigers, the Sunda clouded leopard and dhole, were detected 20 and 9 times during the 90-day sessions. Naïve occupancies for clouded leopard (0.07) and dhole (0.09) were >five times lower than those for Sumatran tiger.
3.4 Human detection rates on cameras
Hunters and villagers were detected more frequently than rangers during all sessions. Across stations, we recorded rangers at 13% while hunters and villagers were detected at 21% and 43%. Overall, the RAI for rangers was 0.54 detections/100 TN. The RAI for hunters and villagers was 0.63 and 2.62 detections/100 TN.
4 Discussion
We estimated densities of Sumatran tigers based on the most robust dataset of the species collected to date, comprised of 282 photographs of 27 individuals collected over two 3-month and two 6-month subsampled sessions between July 2023–November 2024. Our results, nearly triple the average number of records obtained during previous 90-day Sumatran tiger surveys, are testament to a combination of factors including, foremost, successful efforts of the Aceh government to maintain critical tiger habitats in the form of extensive forest cover. Amidst intense pressures from agricultural and extractive industries, Aceh remains nearly 60% forested and prey populations are among the healthiest in Sumatra (Global Forest Watch, 2021; Figel et al., 2024). Our results further highlight the importance of conducting strategic reconnaissance surveys and use of durable professional-grade camera-traps installed in collaboration with highly skilled forest guides.
To place our dataset in greater context, the average results from published Sumatran tiger 90-day SCR surveys (n=18) are 27.67 photo-captures and 6.83 individuals. Recaptures are generally unreported in the Sumatran tiger camera-trap literature. Only three studies (17%), all in Bukit Barisan Selatan National Park, documented ≥ 10 tigers in any single survey (Luskin et al., 2017; Pusparini et al., 2018) and five of the studies (28%) documented ≤ 5 individuals (Sunarto et al., 2013; Hadi et al., 2025). Sparse datasets comprised of captures from fewer than 5 individuals regularly produce imprecise and unreliable estimates unsuitable for monitoring tiger population trends (Karanth and Nichols, 2017).
Our results build on the importance of estimating female demographic parameters, which hold crucial importance for tiger population vitality (Harihar et al., 2020). Survival and fecundity of breeding females are among the most important factors determining the species’ population growth (Smith, 1993; Harihar et al., 2020). Higher female densities are reflective of healthy tiger social system dynamics and higher quality habitats (Sunquist, 1981; Smith, 1993; Bisht et al., 2019). In landscapes with ample prey, female tigers can raise 3 or 4 litters – about 6–10 cubs – during territorial tenures lasting, on average, 8–10 years (Sunquist, 1981; Harihar et al., 2020). These ecological traits have shaped global tiger conservation strategies through, for example, the identification of source sites, whereby breeding females produce a surplus of tigers that disperse from sufficiently protected natal territories (Harihar et al., 2018).
Despite their importance for revealing key demographic parameters such as survival, recruitment, tenure and population growth rate, long-term studies – informed by continuous yearly sampling (Duangchantrasiri et al., 2024) – are lacking on Sumatran tigers. These data can only be obtained with durable professional camera-traps capable of withstanding yearly sampling in humid tropical rainforests. Many Sumatran tiger camera-trap surveys appear to favor the use of Bushnell Trophy cams (e.g., Luskin et al., 2017; Saputra et al., 2025), a recreational-grade camera-trap prone to malfunctioning and breakdown (Newey et al., 2015). The frequency of grainy and overexposed images produced by these cameras (e.g., Figure 2 in Saputra et al., 2025) may enable species identification for presence-absence surveys but individual identification is frequently hampered by the camera’s infrared flash which does not adequately “freeze” the animal in motion (McHenry et al., 2025). The result is a poorer dataset comprised of excessive proportions of blurry or overexposed images that inhibit identification of individual tigers. As further evidence of the low durability and various limitations of recreational-grade cameras, tiger researchers in Thailand structurally modified the Bushnell models (Simasathien et al., 2015).
The relatively high number of male and female, including breeding female, tigers we recorded are suggestive of an adequate prey base in Leuser. Lower elevations generally support greater populations of prey, which is one of the main predictors of tiger abundance (Karanth et al., 2004; Simchareon et al., 2014). Two recent studies of Sumatran tigers and their prey in Aceh independently documented negative correlations between sambar habitat use and elevation (Figel et al., 2024; Hadi et al., 2025). Wild pig and sambar occupied only 10% of the sampled area in Gunung Leuser National Park (Hadi et al., 2025), a mountainous protected area where ~88% of the landmass is comprised of habitats exceeding 600 meters in elevation (Supriatna and Margules, 2022). In stark contrast, we documented naïve occupancy rates at least four times greater for sambar and seven times greater for pig in our lower elevation study area. Maintaining these prey populations, which are vulnerable to diseases such as African Swine Fever (Luskin et al., 2023), will be critical for tiger conservation in Leuser.
Among all Sumatran tiger SCR density estimates to date, only in an “Intensive Protection Zone” patrolled by 12 ranger teams in a protected area of south Sumatra, did tiger density (2.80 individuals/100 km², 95% CI 1.7–4.4) (Pusparini et al., 2018) exceed our highest estimate (2.35 individuals/100 km², 95% CI 1.10–3.56). The persistence of tigers and their prey in Leuser will depend on consistent patrolling by trained rangers. Effective ranger patrols deter poaching and logging, both of which are generally more intense in lowland areas due to their greater accessibility and susceptibility to human disturbances (Supriatna et al., 2017; Lubis et al., 2023). Agricultural conversion in lowland areas has also triggered disproportionate rates of human-tiger conflict, one of the main threats to Sumatran tigers (Figel et al., 2023a).
At present, our study area is patrolled by rangers from two organizations: Forum Konservasi Leuser and Hutan Harimau. Combined density of these patrollers in our study area is approximately 2.5 rangers/100 km² which, although better than most areas of Sumatra, is still ~four times lower than required target numbers to maintain tiger populations in rainforests (Figel et al., 2024; Gray et al., 2024). Besides patrols, the rangers are imperative for executing camera trap surveys (Braczkowski et al., 2024).
To increase alignment with the species’ ecology, our data on tiger movements from Leuser could inform adjustments of standardized Sumatran tiger survey protocols. Following advancements in optimal camera survey designs for estimating density, which recommend trap spacings of 1.5–2.5 times σ (Royle et al., 2017), the size of sampling polygons for Sumatran tigers could be doubled by separating camera stations at distances of 4–6 km, rather than the 2–3 km spacing used currently.
In SCR survey designs, there is a compromise between obtaining sufficient recaptures and robust sample sizes of individuals (Royle et al., 2013). Our results are consistent with recommendations to prioritize increasing the latter. In a review of 137 studies that combined camera-trapping with SCR-based density estimation, the number of individuals in the sample was the single most important variable for producing precise density estimates (Palmero et al., 2023). Thus, achieving higher precision for Sumatran tiger density estimates will inevitably require increasing the spatial extent of sampling particularly since male home ranges are almost exclusively nonoverlapping and female home ranges exhibit limited overlap (Simchareon et al., 2014). This aspect of tiger ecology may also explain how temporal extension of sampling yields diminishing returns in precision, as tiger territoriality dictates their movements in the sampling polygon (Smith et al., 1987; Chanchani et al., 2018).
The 180-day sessions also increase the likelihood of including transients in the analysis, which inflates density estimates, lowers detection probability, and severely biases estimation of σ (Pradel et al., 1997; Larrucea et al., 2007; Palmero et al., 2023). These transients, i.e., non-resident animals without established home ranges, can comprise at least 18% of tiger populations (Karanth et al., 2006). Including these transients also increases potential for violation of closure, further decreasing precision of estimates (Kendall, 1999). We recognize the limitations of identifying transients from camera-trap data but the single detections for 17% of the females and 22% of the males suggests that the population was not closed to immigration.
The dilemma of transients provides further justification for increasing the size of the trap array and sampling over shorter periods. If there are resource restrictions such as insufficient cameras, the study area can be subdivided into 2–4 blocks of trapping stations with cameras in each block run for 2–4 weeks (Royle et al., 2009). Then cameras are moved to the next block for another 2–4 weeks and the process repeated until all blocks are sampled. The number of blocks and sampling duration will depend on availability of resources, terrain of the study area, densities of the tiger population, among other factors. In SCR analyses, capture data from a “block” trap design can be used without issue because the data matrix specifies trap status (e.g., active or inactive) during each sample (Karanth and Nichols, 2017; Efford, 2024).
Interestingly, after our polygon doubled in size in 2024, we detected 18% fewer females and their recaptures declined by 46% while the number of males detected increased by 33% and their recaptures increased by 18%. We believe there are at least two plausible explanations for this discrepancy. First, females in Leuser appear more reliant on intact forests, consistent with breeding female dependence on inviolate forests at tiger recovery sites in India (Harihar et al., 2020). As the polygon encompassed 2.1 times greater proportion of disturbed production forest when it expanded to 600 km² in 2024, the proportion of intact protected forest decreased from 18% to 9% of the overall polygon. Secondly, male large carnivores generally exhibit greater tolerance for fragmented areas as they commonly increase their movements and home range sizes in disturbed landscapes where essential resources are more scarcely distributed (Smith, 1993; Morato et al., 2016; Snider et al., 2021). Movements of males were ~1.5 greater in 2024 while those of females were 1.25-1.43 greater.
Although still widespread in Leuser, Sumatran tigers are intensely persecuted in the ecosystem (Figel et al., 2023b). From 2010–2019, law enforcement staff in Leuser responded to 26 cases of tiger trafficking and patrol teams removed 780 snares, which entangled at least nine tigers (Hadi et al., 2025). We observed signs of incursions, including armed hunters captured on our cameras, throughout our study area. Besides illegal logging activity, some people enter the protected forests to fish, collect honey and, of concern for tiger conservation, to hunt sambar and muntjac. Sumatran tigers may be especially vulnerable to human-induced prey depletion because, even in the best conditions, their rainforest habitats do not support the prodigious ungulate biomass found in the savannahs, grasslands, and deciduous forests of mainland Asia (Karanth et al., 2004; Steinmetz et al., 2021).
5 Conclusions
The number of our records and the balanced sex ratio are indicative of an important breeding population of Sumatran tigers in Leuser. With maintained protection, the population could serve as a key source for adjacent forests where tiger status is more precarious (Figel et al., 2024). Our study further reveals the disparity in tiger densities between Gunung Leuser National Park and our study area that lies outside the National Park system. We provide evidence that supports the need for increasing spatial extent of Sumatran tiger surveys, maintaining shorter sampling durations, and for sampling of intact hill and lowland forests outside National Parks. Additional surveys, which deploy durable camera equipment and use skilled rangers guided by reconnaissance, are likely to reveal critical habitats for Sumatran tigers in these areas.
Data availability statement
The datasets presented in this article are not readily available because: data sharing for this critically endangered species will take place selectively on a case-by-case basis following agreement with partner data owners from DLHK. Requests to access the datasets should be directed to am9lLmZpZ2VsQGZ1bGJyaWdodG1haWwub3Jn.
Ethics statement
The animal study was approved by Ethical Clearance # 182/KE.02/SK/09/2023 from Badan Riset dan Inovasi Nasional (BRIN), Indonesia. The study was conducted in accordance with the local legislation and institutional requirements.
Author contributions
JF: Writing – original draft, Supervision, Formal Analysis, Writing – review & editing, Data curation, Software, Methodology, Conceptualization, Resources, Project administration, Visualization, Validation, Funding acquisition, Investigation. MA: Funding acquisition, Writing – review & editing, Supervision, Resources, Visualization, Project administration. KK: Writing – review & editing, Supervision, Investigation, Project administration. D: Supervision, Project administration, Investigation, Writing – review & editing. Suh: Investigation, Writing – review & editing. Sup: Investigation, Writing – review & editing. ZA: Investigation, Writing – review & editing. MA: Investigation, Writing – review & editing. KA: Project administration, Investigation, Writing – review & editing. MP: Supervision, Conceptualization, Project administration, Investigation, Writing – review & editing. Re: Visualization, Investigation, Writing – review & editing. Rh: Investigation, Writing – review & editing. IH: Investigation, Writing – review & editing. Ri: Investigation, Writing – review & editing. I: Investigation, Writing – review & editing. H: Investigation, Writing – review & editing. IY: Supervision, Writing – review & editing. EH: Supervision, Writing – review & editing.
Funding
The author(s) declare financial support was received for the research and/or publication of this article. Funding for tiger surveys was provided by the American Indonesian Exchange Foundation (the bi-national Fulbright Commission for Indonesia), Point Defiance Zoo and Aquarium, Memphis Zoological Society, and several private donors. The funders were not involved in study design, collection, analysis, interpretation of data, the writing of this article, or the decision to submit it for publication.
Acknowledgments
We are grateful to Bapak A. Hanan and Bapak Muhammad Daud of Aceh’s Department of Environment and Forestry. The Leuser International Foundation helped secure regional research permits in 2023. Dewi Wahyuni, Lukmanul Hakim, Hasri, May Deni Saputra, Iqbal Nauli, and Ishaq assisted with ranger patrols in 2023. We thank all donors who supported patrols for our rangers and any other organization’s rangers in the Leuser Ecosystem. J.J.F. received permit # 629/SIP/IV/FR/10/2023 from Badan Riset dan Inovasi Nasional (BRIN), Indonesia.
Conflict of interest
The authors declare that the research was conducted in the absence of any commercial or financial relationships that could be construed as a potential conflict of interest.
Generative AI statement
The author(s) declare that no Generative AI was used in the creation of this manuscript.
Any alternative text (alt text) provided alongside figures in this article has been generated by Frontiers with the support of artificial intelligence and reasonable efforts have been made to ensure accuracy, including review by the authors wherever possible. If you identify any issues, please contact us.
Publisher’s note
All claims expressed in this article are solely those of the authors and do not necessarily represent those of their affiliated organizations, or those of the publisher, the editors and the reviewers. Any product that may be evaluated in this article, or claim that may be made by its manufacturer, is not guaranteed or endorsed by the publisher.
Supplementary material
The Supplementary Material for this article can be found online at: https://www.frontiersin.org/articles/10.3389/fcosc.2025.1691233/full#supplementary-material
Footnotes
- ^ Results for the 180-day sampling sessions are presented in Supplementary Table 1.
References
BBTNGL (2025). Kondisi Umum. Balai Besar Taman Nasional Gunung Leuser. Available online at: https://tngunungleuser.ksdae.menlhk.go.id/profile/kondisi-umum (Accessed July 30, 2025).
Bisht S., Banerjee S., Qureshi Q., and Jhala Y. (2019). Demography of a high-density tiger population and its implications for tiger recovery. J. Appl. Ecol. 56, 1725–1740. doi: 10.1111/1365-2664.13410
Braczkowski A. R., Namukose L., Musobozi S., Cornille O., Mudumba T., Drileyo G., et al. (2024). Rangers on the frontline of wildlife monitoring: a case study on African lions in Uganda’s Nile Delta. Commun. Biol. 7, 1308. doi: 10.1038/s42003-024-06796-0
Chanchani P., Gerber B. D., and Noon B. R. (2018). Elevated potential for intraspecific competition in territorial carnivores occupying fragmented landscapes. Biol. Conserv. 227, 275–283. doi: 10.1016/j.biocon.2018.08.017
Duangchantrasiri S., Sornsa M., Jathanna D., Jornburom P., Pattanavibool A., Simcharoen S., et al. (2024). Rigorous assessment of a unique tiger recovery in Southeast Asia based on photographic capture-recapture modeling of population dynamics. Glob. Ecol. Conserv. 53, e03016. doi: 10.1016/j.gecco.2024.e03016
Dupont P., Milleret C., Gimenez O., and Bischof R. (2019). Population closure and the bias-precision trade-off in spatial capture-recapture. Methods Ecol. Evol. 10, 661–672. doi: 10.1111/2041-210X.13158
Efford M. G. (2024). secr: Spatially explicit capture-recapture models. R Package version 4.6.6. Available online at: https://cran.r-project.org/web/packages/secr/index.html (Accessed June 20, 2025).
Efford M. G. (2025). Habitat masks in secr 5.2. Available online at: https://www.otago.ac.nz/density/pdfs/secr-habitatmasks.pdf (Accessed June 20, 2025).
Efford M. G., Dawson D. K., and Borchers D. L. (2009). Population density estimated from locations of individuals on a passive detector array. Ecology 90, 2676–2682. doi: 10.1890/08-1735.1
Figel J. J., Hambal M., Krisna I., Putra R., and Yansyah D. (2021). Malignant snare traps threaten an irreplaceable megafauna community. Trop. Conserv. Sci. 14, 194008292198918. doi: 10.1177/1940082921989187
Figel J. J., Safriansyah R., Baabud S. F., and Herman Z. (2023a). Clustered conflicts in disturbed lowlands characterize human-tiger interactions in Aceh, Indonesia. Wildl. Lett. 1, 83–91. doi: 10.1002/wll2.12016
Figel J. J., Safriansyah R., Baabud S. F., and Herman Z. (2023b). Snaring in a stronghold: poaching and bycatch of critically endangered tigers in northern Sumatra, Indonesia. Biol. Conserv. 286, 110274. doi: 10.1016/j.biocon.2023.110274
Figel J. J., Safriansyah R., Baabud S. F., and Hambal M. (2024). Intact, under-patrolled forests harbor widespread prey but a male-biased tiger population in the Ulu Masen Ecosystem, Sumatra, Indonesia. Sci. Rep. 14, 23612. doi: 10.1038/s41598-024-75503-0
Global Forest Watch (2021). World Resources Institute. Available online at: https://www.globalforestwatch.org/dashboards/country/IDN/1/ (Accessed September 25, 2025).
Goodrich J. M., Wibisono H., Miquelle D., Lynam A. J., Sanderson E., Chapman S., et al. (2022). Panthera tigris. IUCN Red List Threatened Species 2022, e.T15955A214862019. doi: 10.2305/IUCN.UK.2022-1.RLTS.T15955A214862019.en
Gopalaswamy A. M., Karanth K. U., Delampady M., and Stenseth N. C. (2019). How sampling-based overdispersion reveals India’s tiger monitoring orthodoxy. Conserv. Sci. Pract. 1, e128. doi: 10.1111/csp2.128
Gray T. N. E., Belecky M., Singh R., Moreto W. D., and Chapman S. (2024). Insufficient numbers and poor working conditions for rangers protecting tigers. Conserv. Sci. Pract. 6, e13157. doi: 10.1111/csp2.13157
Hadi A. N., Mardhiah U., Suryometaram S. S., Hussein S., Ginting Y., Trihangga A., et al. (2025). Evaluating the efficacy of an integrated law enforcement approach to safeguarding Sumatran tigers and their prey. J. Environ. Manage. 378, 124759. doi: 10.1016/j.jenvman.2025.124759
Harihar A., Chanchani P., Borah J., Crouthers R. J., Darman Y., Gray T. N. E., et al. (2018). Recovery planning towards doubling wild tiger numbers: Detailing 18 recovery sites from across the range. PloS One 13, e0207114. doi: 10.1371/journal.pone.0207114
Harihar A., Pandav B., Ghosh-Harihar M., and Goodrich J. (2020). Demographic and ecological correlates of a recovering tiger population: Lessons learnt from 13-years of monitoring. Biol. Conserv. 252, 108848. doi: 10.1016/j.biocon.2020.108848
Harmsen B. J., Foster R. J., and Quigley H. (2020). Spatially explicit capture recapture density estimates: Robustness, accuracy and precision in a long-term study of jaguars. PloS One 15, e0227468. doi: 10.1371/journal.pone.0227468
IUCN (2004). World Heritage Nomination – IUCN Technical Evaluation. Tropical Rainforest Heritage of Sumatra, Indonesia, ID No. 1167 (Gland, Switzerland: IUCN). Available online at: https://whc.unesco.org/en/list/1167/.
Karanth K. U. (1995). Estimating tiger populations from camera-trap data using capture-recapture models. Biol. Conserv. 71, 333–338. doi: 10.1016/0006-3207(94)00057-W
Karanth K. U., Kumar N. S., and Karanth K. K. (2020). Tigers against the odds: Applying macro-ecology to species recovery in India. Biol. Conserv. 252, 108846. doi: 10.1016/j.biocon.2020.108846
Karanth K. U. and Nichols J. D. (2017). Methods for monitoring tiger and prey populations (Singapore: Springer).
Karanth K. U., Nichols J. D., Kumar N. S., and Hines J. E. (2006). Assessing tiger population dynamics using photographic capture-recapture sampling. Ecology 87, 2925–2937. doi: 10.1890/0012-9658(2006)87[2925:ATPDUP]2.0.CO;2
Karanth K. U., Nichols J. D., Kumar N. S., Link W. A., and Hines J. E. (2004). Tigers and their prey: predicting carnivore densities from prey abundance. Proc. Natl. Acad. Sci. U.S.A. 101, 4854–4858. doi: 10.1073/pnas.0306210101
Karanth K. U. and Sunquist M. E. (1995). Prey selection by tiger, leopard and dhole in tropical forests. J. Anim. Ecol. 64, 439–450. doi: 10.2307/5647
Kartika E. C. (2023). Multiple anthropogenic pressures: challenges for tiger conservation (Wageningen, Netherlands: Wildlife Ecology & Conservation Group, Wageningen University).
Kendall W. L. (1999). Robustness of closed capture-recapture methods to violations of the closure assumption. Ecology 80, 2517–2525. doi: 10.1890/0012-9658(1999)080[2517:ROCCRM]2.0.CO;2
Larrucea E. S., Brussard P. F., Jaeger M. M., and Barrett R. H. (2007). Cameras, coyotes, and the assumption of equal detectability. J. Wildl Manage. 71, 1682–1689. doi: 10.2193/2006-407
Linkie M., Chapron G., Martyr D. J., Holden J., and Leader-Williams N. (2006). Assessing the viability of tiger subpopulations in a fragmented landscape. J. Appl. Ecol. 43, 576–586. doi: 10.1111/j.1365-2664.2006.01153.x
Lubis M. I., Lee J. S. H., Rahmat U. M., Tarmizi, Ramadiyanta E., Melvern D., et al. (2023). Planning for megafauna recovery in the tropical rainforests of Sumatra. Front. Ecol. Evol. 11. doi: 10.3389/fevo.2023.1174708
Lubis M. I., Linkie M., and Lee J. S. H. (2024). Tropical forest cover, oil palm plantations, and precipitation drive flooding events in Aceh, Indonesia, and hit the poorest people hardest. PloS One 19, e0311759. doi: 10.1371/journal.pone.0311759
Luskin M. S., Albert W. R., and Tobler M. W. (2017). Sumatran tiger survival threatened by deforestation despite increasing densities in parks. Nat. Commun. 8, 1783. doi: 10.1038/s41467-017-01656-4
Luskin M. S., Moore J. H., Mendes C. P., Nasardin M. B., Onuma M., and Davies S. J. (2023). The mass mortality of Asia’s native pigs induced by African swine fever. Wildl. Lett. 1, 8–14. doi: 10.1002/wll2.12009
Majumder A., Basu S., Sankar K., Qureshi Q., Jhala Y. V., Nigam P., et al. (2012). Home ranges of the radio-collared Bengal tigers in Pench Tiger Reserve, Madhya Pradesh, central India. Wildl Biol. Pract. 8, 36–49. doi: 10.2461/wbp.2012.8.4
McHenry R., Mitchell L. J., Marshall C., Smart J., de Raad A. L., and Andersen R. (2025). Fox on the run – cheaper camera traps fail to detect fast-moving mesopredators. Ecol. Evol. 15, e70958. doi: 10.1002/ece3.70958
Morato R. G., Stabach J. A., Fleming C. H., Calabrese J. M., de Paula R. C., Ferraz K. M. P. M., et al. (2016). Space use and movement of a neotropical top predator: the endangered jaguar. PloS One 11, e0168176. doi: 10.1371/journal.pone.0168176
Newey S., Davidson P., Nazir S., Fairhurst G., Verdicchio F., Irvine R. J., et al. (2015). Limitations of recreational camera traps for wildlife management and conservation research: a practitioner’s perspective. Ambio 44, 624–635. doi: 10.1007/s13280-015-0713-1
O’Connor K. M., Nathan L. R., Liberati M. R., Tingley M. W., Vokoun J. C., and Rittenhouse T. A. G. (2017). Camera trap arrays improve detection probability of wildlife: Investigating study design considerations using an empirical dataset. PloS One 12, e0175684. doi: 10.1371/journal.pone.0175684
Otis D. L., Burnham K. P., White G. C., and Anderson D. R. (1978). Statistical inference from capture data on closed animal populations. Wildlife Monogr. 62, 3135.
Palmero S., Premier J., Kramer-SChadt S., Monterroso P., and Heurich M. (2023). Sampling variables and their thresholds for the precise estimation of wild felid population density with camera traps and spatial capture-recapture methods. Mamm. Rev. 53, 223–237. doi: 10.1111/mam.12320
Potapov P., Hansen M. C., Laestadius L., Turubanova S., Yaroshenko A., Thies C., et al. (2013). The last frontiers of wilderness: Tracking loss of intact forest landscapes from 2000 to 2013. Sci. Adv. 3, e1600821. doi: 10.1126/sciadv.1600821
Pradel R., Hines J. E., Lebreton J. D., and Nichols J. D. (1997). Capture-recapture survival models taking account of transients. Biometrics 53, 60–72. doi: 10.2307/2533097
Pusparini W., Batubara T., Surahmat F., Ardiantiono, Sugiharti T., Muslich M., et al. (2018). A pathway to recovery: the Critically Endangered Sumatran tiger in an ‘in danger’ UNESCO World Heritage Site. Oryx 52, 25–34. doi: 10.1017/S0030605317001144
Roberts N. J., Harihar A., Zhou X., She W., and Jiang G. (2025). Global tiger density linked with forest carbon stock, top-down and bottom-up. Glob. Change Biol. 31, e70191. doi: 10.1111/gcb.70191
Royle J. A., Chandler R. B., Sollmann R., and Gardner B. (2013). Spatial capture-recapture (Cambridge: Academic Press).
Royle J. A., Gopalaswamy A. M., Dorazio R. M., Nichols J. D., Jathanna D., Parameshwaran R., et al. (2017). “Concepts: assessing tiger population dynamics using capture-recapture sampling,” in Methods for Monitoring Tiger and Prey Populations. Eds. Karanth K. U. and Nichols J. D. (Singapore: Springer), 163–189.
Royle J. A., Magoun A. J., Gardner B., Valkenburg P., and Lowell R. E. (2011). Density estimation in a wolverine population using spatial capture-recapture models. J. Wild. Manage. 75, 604–611. doi: 10.1002/jwmg.79
Royle J. A., Nichols J. D., Karanth K. U., and Gopalaswamy A. M. (2009). A hierarchical model for estimating density in camera-trap studies. J. Appl. Ecol. 46, 118–127. doi: 10.1111/j.1365-2664.2008.01578.x
Sanderson E. W., Miquelle D. G., Fisher K., Harihar A., Clark C., Moy J., et al. (2023). Range-wide trends in tiger conservation landscapes 2001–2020. Front. Conserv. Sci. 4. doi: 10.3389/fcosc.2023.1191280
Saputra M. H., Widyastuti S., Kuswanda W., Nugraha R. T. P., Helmanto H., Anugrah N., et al. (2025). Tracking Sumatran tiger distribution in Gunung Leuser National Park: the influence of prey presence and environmental variables on habitat selection. Nat. Conserv. 59, 43–64. doi: 10.3897/natureconservation.59.144262
Sharma R. K., Jhala Y., Qureshi Q., Vattakaven J., Gopal R., and Nayak K. (2010). Evaluating capture–recapture population and density estimation of tigers in a population with known parameters. Anim. Conserv. 13, 94–103. doi: 10.1111/j.1469-1795.2009.00305.x
Simasathien C., Jansang A., Jaikaeo C., Kheawwan N., Phonphoem A., and Duangchantrasiri S. (2015). Camera trap synchronization for wildlife monitoring system. International Conference on Information and Convergence Technology for Smart Society (Bangkok, Thailand: ICICTS).
Simchareon A., Savini T., Gale G. A., Simcharoen S., Duangchantrasiri S., Pakpien S., et al. (2014). Female tiger home range size and prey abundance: important metrics for management. Oryx 48, 370–377. doi: 10.1017/S0030605312001408
Simchareon A., Simcharoen S., Duangchantrasiri S., Bump J., and Smith J. L. D. (2018). Tiger and leopard diets in western Thailand: evidence for overlap and potential consequences. Food Webs 15, e00085. doi: 10.1016/j.fooweb.2018.e00085
Smith J. L. D. (1993). The role of dispersal in structuring the Chitwan tiger population. Behaviour 124, 165–195. doi: 10.1163/156853993X00560
Smith J. L. D., McDougal C., and Sunquist M. E. (1987). “Female land tenure system in tigers,” in Tigers of the World: The Biology, Biopolitics, Management, and Conservation of an Endangered Species. Eds. Tilson R. L. and Seal U. S. (Park Ridge, NJ, USA: Noyes Public.).
Snider M. H., Athreya V. R., Balme G. A., Bidner L. R., Farhadinia M. S., Fattebert J., et al. (2021). Home range variation in leopards living across the human density gradient. J. Mammal. 102, 1138–1148. doi: 10.1093/jmammal/gyab068
Steinmetz R., Seuaturien N., Intanajitjuy P., Inrueang P., and Prempree K. (2021). The effects of prey depletion on dietary niches of sympatric apex predators in Southeast Asia. Integr. Zool. 16, 19–32. doi: 10.1111/1749-4877.12461
Sunarto, Kelly M. J., Klenzendorf S., Vaughan M. R., Zulfahmi, Hutajulu M. B., et al. (2013). Threatened predator on the equator: multi-point abundance estimates of the tiger in central Sumatra. Oryx 47, 211–220. doi: 10.1017/S0030605311001530
Sunquist M. E. (1981). The social organization of tigers in Royal Chitawan National Park, Nepal. Smithson. Contrib. Zool. 336, 1–98. doi: 10.5479/si.00810282.336
Supriatna J., Dwiyahreni A. A., Winarni N., Mariati S., and Margules C. (2017). Deforestation of primate habitat on Sumatra and adjacent islands, Indonesia. Primate Conserv. 31, 71–82.
Supriatna J. and Margules C. (2022). The national parks of Indonesia (Jakarta: Yayasan Pustaka Obor).
Wibisono H. T., Figel J. J., Arif S. M., Ario A., and Lubis A. H. (2009). Preliminary survey of the Sumatran tiger in a new Indonesian protected area: Batang Gadis National Park. Oryx 43, 634–638. doi: 10.1017/S003060530999055X
Keywords: camera traps, density, Leuser Ecosystem, rain forest, spatial capture-recapture, Sumatran tiger
Citation: Figel JJ, Akbar MI, Khairi K, Darmansyah, Pian M, Supiyandi, Suhaili, Abidin Z, Aritanoga MR, Ali K, Reduan, Rhomadani, Haris I, Rija, Irhamdani, Hermansyah, Yoga I and Hut ES (2025) Sumatran tiger density estimates in the Leuser Ecosystem, Sumatra, Indonesia. Front. Conserv. Sci. 6:1691233. doi: 10.3389/fcosc.2025.1691233
Received: 23 August 2025; Accepted: 06 October 2025;
Published: 04 December 2025.
Edited by:
David R. Breininger, University of Central Florida, United StatesReviewed by:
Muhammad Irfansyah Lubis, National Research and Innovation Agency, IndonesiaGunardi Winarno, Fakultas Kedokteran Universitas Lampung, Indonesia
Copyright © 2025 Figel, Akbar, Khairi, Darmansyah, Pian, Supiyandi, Suhaili, Abidin, Aritanoga, Ali, Reduan, Rhomadani, Haris, Rija, Irhamdani, Hermansyah, Yoga and Hut. This is an open-access article distributed under the terms of the Creative Commons Attribution License (CC BY). The use, distribution or reproduction in other forums is permitted, provided the original author(s) and the copyright owner(s) are credited and that the original publication in this journal is cited, in accordance with accepted academic practice. No use, distribution or reproduction is permitted which does not comply with these terms.
*Correspondence: Joe J. Figel, am9lLmZpZ2VsQGZ1bGJyaWdodG1haWwub3Jn