Abstract
Nitrate removal via microbial denitrification in floodplains is an important ecosystem service that can potentially help mitigate anthropogenic nitrogen inputs from rivers. However, floodplain denitrification estimates can vary by four orders of magnitude, making it difficult to quantify the social value of floodplain nitrogen mitigation potential. Constraining floodplain denitrification rates requires innovative experiments that mimic overland flooding of oxic water vs. infiltration of sometimes anoxic hyporheic waters to bound the rates. We incubated soils of varying textures and corresponding hydraulic connectivity from four field sites across the Dogtooth Bend of the middle Mississippi River, contrasting their varied rates of denitrification using novel deep injection compared to traditional surface delivery of oxic or anoxic river water. Averaged across all soil types, denitrification rates as nitrogen (N) gas production followed an anoxic-injection hierarchy of anoxic deep > anoxic surface > oxic deep > oxic surface treatments. Rates in sand ranged from 101 to 592 mg N/m2/day compared to diffusion-limited clay, which ranged from 166 to 448 mg N/m2/day. The chemical stoichiometry of nitrate (NO3-N) loss to N gain indicated apparent nitrification that replaced approximately 62% of N removed by denitrification even in anoxic treatments, modifying net rates for oxic-surface-injection vs. anoxic-deep-injection treatments to 31 to 176 (sand) and 81 to 162 mg N/m2/day (clay), respectively. Combining net denitrification bounds with the daily inundation exceedance probabilities for the 140 km2 of connected floodplain at Dogtooth Bend indicates, on average, between 70 and 385 tons of N may be removed annually from floodwater during the growing year. While the potential nitrogen removal equates to a small percentage ( ≤ 0.06%) of the river's nitrogen load, economically, the estimated monetary value of N mitigation is worth US$156–$4,106/ha/growing season compared to net profits for soybeans and corn of US$79 and US$88/ha/yr, respectively. Thus, N mitigation across the Dogtooth Bend could rival the agricultural use of floodplain lands.
1 Introduction
The Mississippi River drains more than 3.2 million km2 of primarily human-dominated landscapes, resulting in the river carrying a substantial amount of nutrients. The average annual total nitrogen (TN) concentrations along the Mississippi River commonly reach or exceed 3.0 mg/L (Stackpoole et al., 2021; Houser et al., 2022). These sometimes eutrophic nutrient concentrations greatly contribute to large algal blooms in the northern Gulf of Mexico that subsequently decompose, leading to coastal hypoxia. Hypoxic conditions can drop dissolved oxygen (DO) levels to <1 mg/L, creating a “dead zone” (Rabalais et al., 2002; Liu et al., 2010; Cheng et al., 2022) that encompassed, on average, approximately 15,000 km2 of the northern Gulf of Mexico between 2017 and 2021 (NOAA, 2022). Such hypoxia disrupts pelagic and benthic food web dynamics and, thus, poses both economic and ecological concerns for both the Mississippi River and the northern Gulf of Mexico. Globally, eutrophic conditions within rivers that can lead to coastal hypoxia are common when rivers drain human-dominated landscapes (Diaz and Rosenberg, 2008; Breitburg et al., 2018; Wurtsbaugh et al., 2019). The economic costs related to elevated nitrogen loads in rivers and other water bodies are attributed to more than $70 billion in annual damages for the United States alone (Sobota et al., 2015).
Floodplain reconnection, where a flood mitigation levee is either removed or breached to enhance the lateral connection between the river and its floodplain, is increasingly recognized for the ecosystem services it provides to society via nutrient processing and retention that improves water quality downstream to minimize impacts on coastal hypoxia in the United States and Europe (Gordon et al., 2020). Additional benefits include floodwater storage, enhanced riverine habitat, and biodiversity to consequently improve the ecosystem health of the channels, backwaters, and floodplains of river corridors (Opperman et al., 2009; Guida et al., 2016b; Shadie et al., 2018; Tullos, 2018; Eros and Bányai, 2020; Knox et al., 2022). Those additional benefits could add further societal value that likely surpasses those gained from nutrient processing in floodplains. However, evaluations of many ecosystem services cannot be monetized and do not allow for intercomparisons of services for those that support the highest socioeconomic value (Kok et al., 2025).
Floodplain soil denitrification carries its own challenges as rates range by four orders of magnitude. Direct measures of floodplain soil denitrification rates either along the Mississippi or its levee-lined tributaries are limited, but those that do exist range from near 0 up to 36 mg N/m2/day (Theriot et al., 2013; Hurst et al., 2016). Broadening the pool of potential denitrification rates to floodplains of large temperate rivers from California and Europe increases the potential range in rates to >1,000 mg N/m2/day (Pinay et al., 2007; Welti et al., 2012; Hoagland et al., 2019; Hinshaw et al., 2020). Quantifying the extremes of denitrification rates depends on the extent to which floodplain or wetland soils and sediments (hereafter referred to as floodplain soils for ease of communication) consume or bind high levels of nutrients when river waters flow through them via biotic and abiotic processes (Hoagland et al., 2019; Upreti et al., 2021; Cheng et al., 2022). Microbial denitrification is stimulated by flood pulses that saturate soils, fill air spaces, and prompt anaerobic conditions while also introducing additional nutrients (Groffman and Tiedje, 1988; Kaden et al., 2021) that mix with the hyporheic zone. The hyporheic zone is the region of soil and porous space beneath, extending alongside a riverbed and below floodplains during flood events, where shallow groundwater and surface water mix. In summer, sustained floodplain inundation with unrestricted diffusion (via soil hydraulics) of NO3-N-rich waters through sand and silt establishes favorable environmental conditions with warm waters with low oxygen levels (Upreti et al., 2021). Even at the same temperature, denitrification rates can contrast sharply for short-duration inundation by oxic waters, with limited penetration into clay-rich floodplain soils. Thus, patterns of flooding and soil hydraulics play an important role in establishing the conditions conducive to geochemical nutrient fluxes and the anaerobic communities of microbiota that thrive therein (Kaden et al., 2021; Li et al., 2022).
A 2016 levee breach of the Len Small-Fayville Levee (hereafter the Len Small Levee) along the middle Mississippi River at Dogtooth Bend and the decision not to repair the levee (Olson and Speidel, 2020) provided an opportunity to assess the nitrogen mitigation potential of the recently reconnected floodplain along this river segment (Figure 1A). For this study, we monetize the benefit transfer of floodplain denitrification to directly compare profits yielded by crops that have been consistently farmed in these Dogtooth Bend floodplains since the late 19th century. Valuations that compare placing the land into conservation easements for denitrification provide information for science-based decision-making about whether denitrification covers the cost of not farming floodplains. Moreover, as a consequence of the breach, Dogtooth Bend is an area of active interest among federal agencies aiming to work toward more balanced management of the Mississippi River and its floodplain for flood risk reduction, navigation, nutrient retention, and other floodplain services [e.g., U.S. Army Corps of Engineers (USACE, 2022), the U.S. Department of Agriculture's (USDA, 2019), and National Resource Conservation Service (NRC)].
Figure 1
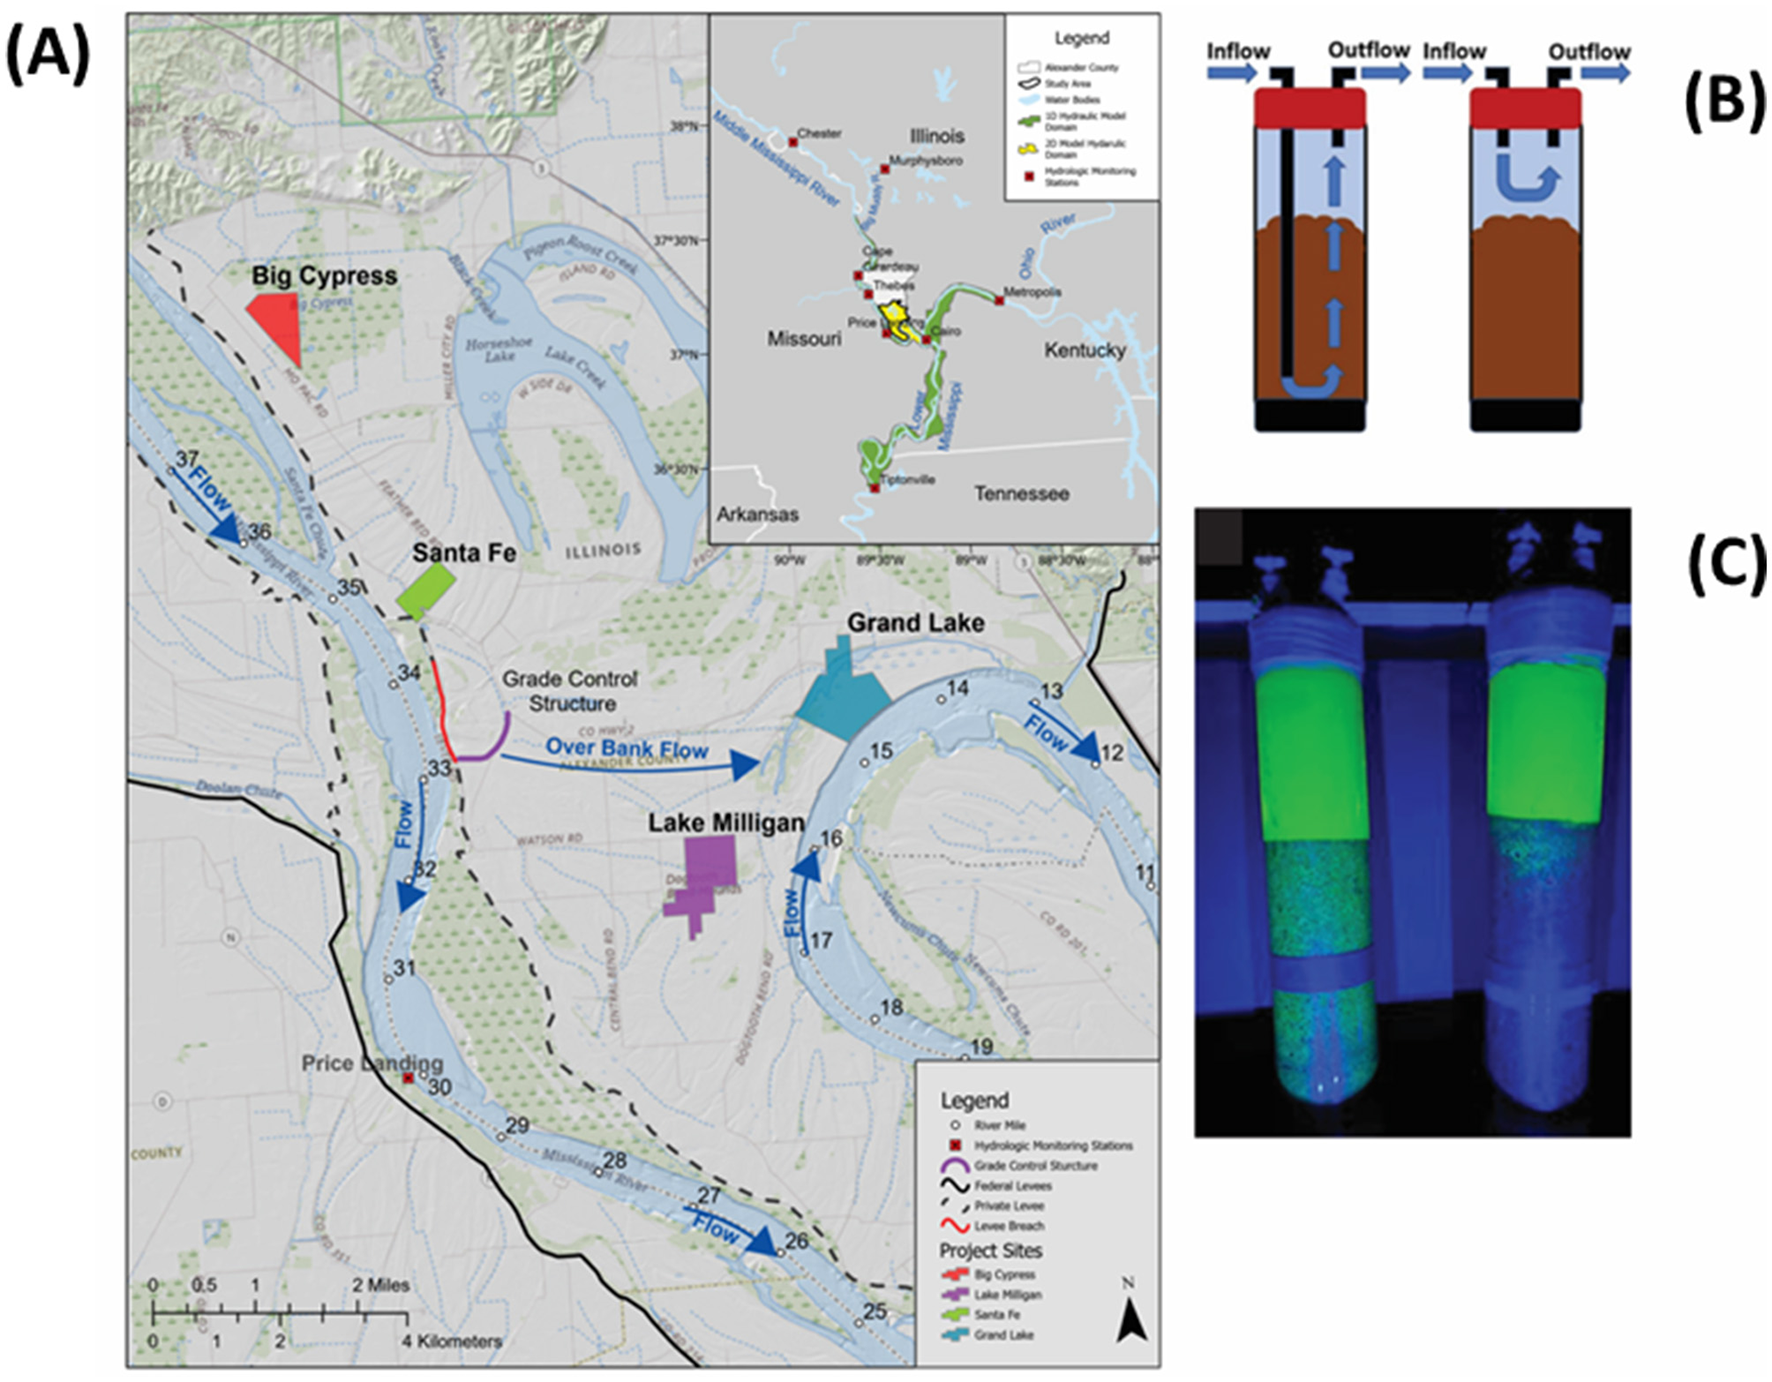
Dogtooth Bend map and incubation methods. (A) Inset shows the extent of the one- and two-dimensional hydrodynamic model domains, the major hydrologic stations used in the development of the model, and delineates Alexander County, Illinois. (A) Maps field site locations, levees, the 2016 levee breach, water bodies, and the grade control structure. Arrows indicate the flow direction of the Mississippi River and the principal flow direction of the overbank flow through the levee breach. (B) Shows methods of injecting water into the base or top of sediment cores. (C) Shows the results of a 96-h incubation of sediment with rhodamine dye brightly coloring the water column. Cores on the left possess a deep injection straw; those on the right lack the straw. In cores lacking the straw, inflow water, injected to the core top, cycles near the sediment surface with less infiltration.
The major challenges in using this opportunity to assess the nitrogen mitigation potential in Dogtooth Bend floodplains are quantifying the extremes of denitrification depending on soil types and inundation patterns, estimating gross and net denitrification as affected by competing forms of microbial respiration (denitrification vs. nitrification), and using those values in landscape scale assessments to evaluate trade-offs between managing floodplains for the various services they can provide to society.
To better understand the influence of soil types and inundation patterns on nitrogen dynamics in floodplain soils, we employed a novel incubation methodology, switching from standard laboratory incubations that inject river waters only from the top of soil cores (e.g., Lazar et al., 2015; Li et al., 2021) to supplying either oxic or anoxic waters delivered to either the surface or via deep injection to the base of the core (Figure 1B). This experimental design facilitates greater nutrient delivery to the entire volume of the soil core, engaging a larger microbial community (see rhodamine dye delivery throughout the soil with deep injection; Figure 1C). We also estimated the net denitrification by investigating concomitant nitrification rates based on coupled denitrification–nitrification studies (Kana et al., 1998; Kreiling et al., 2011) and studies that show optimal nitrification can occur at hypoxic DO levels of 1.5 mg/L (Wild Jr et al., 1971; Kholdebarin and Oertli, 1977; Jianlong and Ning, 2004) and is not limited until DO drops to 0.3 mg/L (Stenstrom and Poduska, 1980).
Applying the biogeochemical findings to inform the trade-offs between competing ecosystem services that floodplains provide to society requires an evaluation that realistically bounds the maximal and minimal potential nitrogen-removal benefits at the appropriate scale. Ideally, these measurements should be made at the reach (<1 km) to segment (10s km) river scale as, at these scales, floodplain-reconnection projects are most economical or politically feasible (Sparks et al., 2005; Remo et al., 2016; Serra-Llobet et al., 2022). Similarly, an appropriate temporal dimension should be applied to avoid over- or underestimating denitrification. Here we limit our analysis to the growing season for this study's geographic location (April 1–October 30), which corresponds to enhanced biological activity relative to the rest of the year and the period when riverine inundation of floodplains is common. Land-use decisions are commonly based on the market value of a given use. For non-market services such as nutrient mitigation (retention or processing), an ecosystem service valuation framework can be applied where biophysical measurement of the ecosystem service is quantified (e.g., rate of denitrification) and then monetized using a benefit transfer that has social welfare value(s) (Murray et al., 2009; Jenkins et al., 2010).
Thus, the specific objectives for this study were to (1) investigate denitrification rates in incubation cores capturing the breadth of environmental conditions (i.e., overland flooding of oxic surface waters vs. the flow of sometimes anoxic hyporheic waters) as mediated by soil characteristics, (2) balance gross denitrification as N2 production relative to NO3-N loss from incubations that surprisingly showed concomitant nitrification to develop an environmentally relevant estimate of net denitrification, and (3) develop a landscape modeling framework employing the daily inundation exceedance probabilities during the growing season for the 140 km2 of river-connected floodplain that comprises Dogtooth Bend to provide realistic bounds for the floodplain soil denitrification at the landscape scale aimed at helping to inform floodplain management and policy.
2 Materials and methods
2.1 Field sites
This study focuses on a formerly levee-protected floodplain along a segment of the middle Mississippi River at Dogtooth Bend located near the southern tip of Illinois (Figure 1A). The reconnection of the Dogtooth Bend floodplain to the river was the result of the 2016 breaching of the Len Small Levee, during a large magnitude flood (approximately 1% annual exceedance probability) and the subsequent decision not to repair the levee. The USACE's decision not to repair the levee was based on a cost–benefit assessment indicating that estimated repair costs outweighed flood risk reduction benefits (Olson and Speidel, 2020). As of 2019, the land cover across Dogtooth Bend was dominated by floodplain agriculture (65%), with substantial areas of wetlands and open water (30%). The remainder of the area was developed or barren land (5%; Dewitz and U. S. Geological Survey, 2021).
The TN concentrations along the middle Mississippi River have been measured just upstream of the Big Muddy River Confluence since 1992 by the U.S. Geologic Survey (USGS). The long-term (1994–2019) mean concentration of TN for this river segment is 3.01 mg/L (Houser et al., 2022). Combining this mean concentration with the USGS (2024) average annual flow volume (215 m3 × 109/yr) for the same period at the nearest discharge hydrological monitoring station at Chester, Illinois, yields an average annual TN load of 648,000 tons/yr.
Soil and water samples for laboratory incubations were collected at four wetland locations across Dogtooth Bend (Figure 1A). These sites were chosen to represent the array of river inundation frequencies (i.e., lateral hydrologic connectivity) and floodplain soil types found across the bend. Site selection was somewhat constrained by private ownership of nearly all the property within Dogtooth Bend, which led to partnering with willing landowners. Information for field sites regarding riverine inundation likelihood and local source waters to the assessed wetlands are identified in Remo and Giri (2024) and are summarized in Table 1.
Table 1
| Field site | Inundation likelihood | Primary hydrologic input |
|---|---|---|
| Big Cypress | ~10% (10-year floodplain) | River waters reach site via flooding through the levee breach into Horseshoe Lake, and across wetlands from the east. Also, frequently inundated by local runoff or groundwater pumped to the surface for waterfowl hunting in fall and early winter. |
| Grand Lake | >80% (<1.25-year floodplain) | This site has never been disconnected from Mississippi River inundation. Also frequently inundated by runoff from adjacent agricultural fields located north and west. |
| Lake Milligan | ~50% (2-year floodplain) | Located approximately 5 km down gradient of the levee breach, river water flows within an actively forming cutoff channel traversing the Bend toward river mile 16. Surface runoff comes from surrounding agricultural fields and a road drainage system directing surface water into this site. |
| Santa Fe | ~80% (1.25-year floodplain) | River water flows through the breach and northward through a lake created by the 1993 levee breach. Local surface water from agricultural lands on the north arrives via a culvert that spans a levee access road east of the site. |
Summary of field site characteristics and hydrologic input.
Inundation likelihood is based on a 10-year hydraulic model of the area by Remo and Giri (2024).
2.2 Field sampling and core incubation conditions
For laboratory incubations, soil cores from wetland sites were collected in triplicate. To retain the integrity of soil stratigraphy and minimize disturbance, cores were collected in acrylic sleeves, which were prewashed with 98% ethanol for microbial sanitation, inserted inside a steel corer (Giddings Machine Co, Windsor, CO), driven into the ground, and immediately capped at each end. We retrofitted top caps with non-reactive plastic spigots and a rigid polyethylene tubing straw sealed in place with aquarium-grade silicone (Pentair Aquatic Ecosystems, Atlanta, GA). After the headspaces were filled with ambient wetland water in the field (temperature range 26–30°C), the water-saturated cores were transported to the laboratory on ice. Incubations began 1 day after collection. To standardize experimental conditions, all incubations were conducted with unfiltered Mississippi River water collected just upriver of Dogtooth Bend at Thebes, Illinois, on the same day as the soil core collection (Figure 1A).
To address how denitrification rates vary with oxygen levels and hydrologic delivery via infiltration from overland flooding or hyporheic flows, a total of 48 wetland cores were incubated. From each site, 12 cores were divided into 4 treatments, with 3 replicates per treatment in a 2 × 2 factorial design for a total of 48 cores (oxic vs. anoxic water with either surface or deep injection; Figures 1B, C), and 96-h incubations were conducted in the dark in an environmental chamber at 30°C. While we acknowledge the selected temperature of 30°C is near the upper temperature bound for river water and site surface water, this temperature was chosen and held constant for optimal assessment of microbial activity under varying oxic and anoxic treatments (average monthly temperatures in the Mississippi River and site surface waters ranged from 13.0 ± 2.5°C in April to 28.2 ± 1.3°C in July, with average maximum temperatures reaching 31.9 ± 3.9°C; Supplementary Table S1).
Oxic conditions were maintained by aquarium bubblers inserted into water supply carboys (20–25 bubbles/min). For anoxic incubations, we lowered DO levels to < 1.0 mg/L by sparging unfiltered river water with inert helium gas (ultra-high grade, 99.99% pure, AirGas, Inc.). Helium sparging is superior to other degassing methods, such as boiling or heated vacuum filtration (Degenhardt et al., 2004), and does not denature natural dissolved organic matter. To prevent negative atmospheric pressure or oxygen intrusion into the anoxic carboys when water was discharged into incubation cores from those anoxic carboys, argon-filled balloons were fitted to their sealed caps. Sparging and pressure equalization with inert argon balloons are common protocols when incubating anaerobic microbial cultures (Strobel, 2009). As an inert gas, argon (Ar) is unaffected by oxygen, is unreactive with water, and its solubility varies only with barometric pressure, temperature, and salinity (Hamme and Emerson, 2004; Haynes, 2016), which we took into account during analyses (see Section 2.5). To adjust for any Ar molecule displacement by helium sparging, we normalized Ar gas concentrations to those observed in oxic treatments from the same field site subject to identical incubation conditions of barometric pressure, temperature, and salinity. DO and temperatures in all supply carboys were monitored with MiniDOT loggers (Precision Measurement Engineering, Inc., Vista, CA). Inflow and outflow waters were collected for analyses at the onset of incubations and every 24 h thereafter. Findings for inflow nutrient concentrations and subsequent changes during incubation are presented in the Results section (see Section 3.2). Incubation flows were 0.5 mL/min, except during collection of outflow waters when we briefly increased flow to 2.5 mL/min to collect samples rapidly while limiting potential error caused by waters equalizing with the atmosphere.
2.3 Incubation water analyses
Laboratory analyses of waters from 96-h incubations included measures of N2 gas by membrane inlet mass spectrometry (MIMS; Bay Instruments, Easton, MD). For N2 gas analyses, we collected 7 analytical replicates in 12-mL exetainer vials from each core (n = 21 total per treatment). Water samples were immediately preserved with 100 μL of 50% ZnCl2, capped with no headspace, and checked to ensure no bubbles were entrapped. For nutrients and other factors, samples of inflow and outflow waters from each core were collected in 125-mL non-reactive high-density polyethylene bottles, immediately filtered (glass fiber filters, 0.7 μm GF/F, ashed at 500°C for 2 h) and preserved (5% trace metal grade nitric acid for metal analyses) or frozen (−4°C) until analyzed. Frozen samples were analyzed for nutrients, pH, and alkalinity within 24 h of thawing and were stored for < 4 weeks before analysis. Additional analyses included pH, alkalinity by acid titration, dissolved organic carbon (DOC) by catalytic combustion, and total nitrogen by chemiluminescence (Shimadzu). NO3-N, ammonia (NH3-N), and soluble reactive phosphate (PO4) were measured colorimetrically (Hach 4,000 DR spectrometer, Loveland, CO) according to United States Environmental Protection Agency (EPA) Methods or EPA-Compliant Methods 8,507, 350.2, and 365.1. While the concentration of N is constant, at the pH levels herein most NH3-N is in the form of ammonium (NH4-N), so for simplicity, we apply the term NH4-N. Metals were analyzed by inductively coupled plasma mass spectrometry (analyses: XSeries II, Thermo Fisher Scientific, Inc.). For all analyses, quality assurance and quality check protocols included sample duplicates, sample spikes, and external quality checks according to standard methods (APHA, 2017).
2.4 Dissolved gas analyses with MIMS
We measured dissolved N2 gas in the waters collected from soil incubations using a MIMS equipped with a redox furnace to remove oxygen (O2) from the gas stream before introducing them to the mass spectrometer. MIMS analysis was chosen because it does not require adding labeled isotopes (Smith et al., 2006), restricting enzymatic activity (Smith et al., 2006; Almaraz et al., 2020), or disrupting the stratigraphy of the soil core (Almaraz et al., 2020). Removing O2 during the analysis is important because N2 concentration is artificially inflated by 2.5% during MIMS analyses for each 1% increase in O2 saturation (Kana et al., 1994). Each data point is an average of three replicate water samples. Each water sample value is produced from the average of six analytical replicate exetainers, following an initial (seventh) burn-in replicate (total n = 21; MIMS analytical replicates for the three core replicates). Gases were analyzed using a two-point calibration of ultrapure water in water baths equilibrated with atmospheric saturation of gases set at 27°C and 33°C (i.e., 3°C above and below observed 30°C water temperatures in the field samples and the incubation temperature). Following an initial calibration, the MIMS was recalibrated every 12 samples, with a concluding calibration.
2.5 Data analysis of MIMS signals
To convert electronic signals from the MIMS, we used the R-statistical software (R Core Team, 2021) and the R-package Mimsy, which adjusts for temperature and barometric pressure (Kelly, 2020) in RStudio (RStudio Team, 2020). Results for each replicate were downloaded into Microsoft Excel and analyzed as molar ratios of nitrogen to argon (N2:Ar) because the ratios are more stable than the absolute values of N2 (Reisinger et al., 2016) and multiplied by the ideal Ar concentration at observed barometric pressure and temperature. This Ar correction step adjusts each sample for the distinction between ideal and observed Ar gas saturation and converts the ratio to N2 or O2 molar concentrations (Equation 1):
Although denitrification rates were calculated relative to both surface area and soil volume for comparison to denitrification rates in virtually all other studies, herein we report denitrification rates relative to the surface area of soil (Equation 2) and only discuss rates relative to soil volume with the appropriate adjustment to Equation 2 for Supplementary material 1 (for interest, rates as surface area vs. volume yielded R2 values ≥ 0.89; see Supplementary Figure S1). Denitrification rates were averaged across values measured at 48-, 72-, and 96-h intervals of the 96-h incubation. Values from the first 24 h were excluded because this acclimation period includes high metabolic variability within the microbial community that is potentially less representative of subsequent metabolic activity (Evans et al., 2021), possibly due to variable soil inundation upon collection at each site. Denitrification rates included a base flow rate of 0.5 mL/min and a relatively brief period of increased collection rate of 2.5 mL/min.
2.6 Post-incubation soil core processing
To fully understand soil distinctions that contribute to context-dependent variation among field sites, after incubation cores were analyzed for soil volume, dry and wet mass, bulk density, particle density, porosity, ash-free dry mass, and soil texture. For soil volume, the total water volume of overlying water plus water that dripped from soils suspended in cheesecloth for 24 h was subtracted from 850 mL, the volume of acrylic incubation sleeves. Dry mass and ash-free dry mass of subsequently homogenized soils were determined using standard methods: dry mass (consistent mass at 50°C) and ash-free dry mass (dry mass – mass ashed for 24 h at 500°C). Bulk density, particle density, and soil porosity were determined following protocols described in Grossman and Reinsch (2002), with porosity evaluated as the percentage of bulk to particle density. Soil textures were determined by the relative amounts of sand, silt, and clay using the Bouyoucos hydrometer methods modified from Goh et al. (2009).
2.7 Statistical analyses
Microsoft Excel was used for descriptive statistics or stoichiometric correlations. Many variables covaried and were not normally distributed; thus, for hypothesis testing and statistical inference analyses, we turned to permutational non-parametric multivariate approaches (PRIMER ver.7 and PERMANOVA+; PRIMER-e, Plymouth, UK). In these approaches, distinct centroids (“signatures”) of denitrification rates per surface area for each site and treatment were created from Euclidean distances using Huygens theorem (i.e., the sum of squared distances from individual points to their centroid is equal to the sum of the squared interpoint distances divided by the number of points), yielding signatures developed from centroids, not a geographic distance (Anderson et al., 2008). Those centroids were then used to generate resemblance matrices for permutational analyses. Permutation analyses are similar in approach to Monte Carlo simulations that converge on patterns through repeated randomized sampling from a distribution (Mantel, 1967; Hope, 1968). The relationship between Monte Carlo and permutation tests is discussed in detail by Anderson and Robinson (2003). In contrast to sampling from a distribution, permutation analyses generate comparisons by sampling within the resemblance matrix of assigned groups vs. randomly assigned matrices repeated 999 times (999 permutations). This approach produces familiar F-statistics, p-values, and R2 measures (Anderson and Walsh, 2013).
For hypothesis testing of differences among denitrification rates, we compared the treatments using permutational multivariate analysis of variance (PERMANOVA; Anderson and Ter Braak, 2003). Main-effects tests using PERMANOVA (the permutational form of an analysis of variance) evaluated the overall differences between field sites, followed by independent pairwise t-tests using PERMANOVA to investigate effects within treatments for each field site. Given the variability of environmental samples and natural waters, our acceptance criterion for significance was alpha < 0.10.
For inference testing of the relationships between denitrification rates relative to context-dependent variables and their magnitude of influence, we conducted distance-based redundancy analyses. These analyses place the signatures for each incubation treatment in non-metric multidimensional space, which is based on distance-based linear models (DistLMs) that are multivariate-multilinear regressions (Anderson et al., 2004). This approach uses information from each individual replicate of each treatment to capture even subtle distinctions within each resemblance matrix and evaluate complex systems (Kraft et al., 2011). DistLM models test the significance of each environmental factor and quantify how much variance in denitrification each explains. R2 values of individual explanatory factors are not additive because of covariance. In other words, each explanatory variable is evaluated relative to its contributions relative to other independent variables with covariance considered to avoid over-fitting. We only included factors that were individually significant (α < 0.10) in the DistLM models. The best model selection for DistLMs was determined by the Akaike information criterion for small sample sizes (AICc) changed by < 2 units. Predictor variables included DO, soil characteristics, and the consumption or liberation rates of biologically active compounds (NO3-N, NH4-N, PO4, and DOC).
2.8 Calculation of N mitigation potential across Dogtooth Bend and comparison of its social value to floodplain agriculture
There are two principal ways in which reconnected floodplains and their wetlands can mitigate environmental damage from N releases: (1) forgone nitrogen losses associated with runoff from crop cultivation and (2) removal of NO3 by denitrification. In this article, we focus solely on the soil denitrification pathway for N mitigation, and in the following, we describe the methodological steps taken to assess the N mitigation potential across Dogtooth Bend. In this approach, we attempted to bound the potential amount of NO3 removed from river water by the floodplain soils and their microbiological communities when inundated by floodwaters. The primary assumption for this modeling approach is the measured soil denitrification rates reflect the amount of NO3 that can be removed from the river water when the floodplain is inundated.
In this study, nitrogen mitigation is monetized through a benefit transfer approach using N mitigation prices estimated for the Mississippi River valley by Ribaudo et al. (2005). The results from Ribaudo et al.'s (2005) study were selected for the benefit transfer because it is one of the few studies that produces a marginal price for nitrogen mitigation and the estimates are relevant to our study area. For their study, Ribaudo et al. (2005) employ the U.S. Agricultural Sector Mathematical Program model to investigate the potential for nitrogen credit trading in the entire Mississippi River watershed by modeling the interaction between agricultural non-point sources and wastewater treatment plant point sources that were required to reduce N emissions. In the Ribaudo et al. (2005) model, users can provide N reduction credits using four approaches: changing fertilizer application rates, changing production practices, growing different crops, or retiring cropland. While restoring floodplains and their wetlands is not included as a mitigation option in this model, the cost of the alternative approaches does capture the avoided costs of achieving the given amount of water quality improvements in another way when floodplain reconnection is undertaken in the region, thus providing a marginal value for N mitigation outcomes (Jenkins et al., 2010).
To demonstrate the importance of this and future floodplain nutrient services research to floodplain management and policy, we estimate the potential bounds for the N mitigation service value (i.e., social benefit) for floodplain soils and compare it to agriculture profits for the Dogtooth Bend region (e.g., market values). First, the N mitigation potential associated with river inundation of the Dogtooth Bend floodplain using a simplified approach intended to place this floodplain service into context. This was accomplished by modeling inundation across a range of daily exceedance probabilities (DEPs) in which the Dogtooth Bend floodplain inundation is modeled using an existing one- and two-dimensional hydrodynamic model of the Mississippi–Ohio River confluence region and combining these DEPs with our denitrification rates to estimate annual N mitigation. The Dogtooth Bend Region was modeled in two dimensions to provide a realistic simulation of floodplain inundation, while the river channels were modeled in one dimension to reduce the model's computational requirements (Figure 1A). The details of this calibrated and validated hydrodynamic model constructed using the USACE Hydrologic Engineering Centers River Analysis System (HEC-RAS v. 6.3.1) model are more fully described by Remo and Giri (2024). The HEC-RAS model assumes a fixed-channel geometry and does not account for groundwater fluxes.
For the inundation modeling used in this work, we employed the Remo and Giri (2024) post-breach with grade-control structure model, which represents near-present-day conditions (circa 2020) within our Dogtooth Bend study area. The validation results for this model show the average uncertainties with water-surface elevation (WSEL) predictions were, on average, within ±0.3 m, which is typical of well-constructed hydrodynamic models for the Mississippi–Ohio River confluence region (Gaines et al., 2021; Remo and Giri, 2024). To determine the DEP for the inundation of the Dogtooth Bend floodplain, we modeled 50 years of daily discharge data (water years 1972–2022) using the hydrodynamic model to generate WSELs. Using these WSELs, we then calculated the DEP at the Price Landing Hydrologic Monitoring Station for the growing season (April 1–October 30; Figure 1A). Flood inundation extents from the river were generated for Dogtooth Bend at WSEL increments of 0.3 m for the 0.3%−20% DEP (approximately 1–70 days of inundation annually) using the tools within HEC-RAS.
Using the inundation extent maps from HEC-RAS, we generated a map of the number of days the floodplain across the Dogtooth Bend study area is expected to be inundated. To create this map, we first exported the inundation extent maps from HEC-RAS into ArcGIS Pro software (v 3.2.2). Then in ArcGIS Pro, DEPs were assigned to each inundation extent map. Next, the inundation extent maps were combined to create a continuous map of DEPs of inundation across the Dogtooth Bend floodplain; then, these probabilities were converted into the number of days inundated for each square meter of the floodplain for the growing season.
Next, we used our net denitrification rates to calculate minimum, average, and maximum bounds for average N mitigation during the growing season across the Dogtooth Bend floodplain by multiplying the rates by the number of days inundated. We estimate the value of floodplain soil N mitigation using Mississippi River valley price estimates for N mitigation credits from Ribaudo et al. (2005). We use this study's N mitigation credit prices because it is one of the few studies in the literature that calculates a marginal price for N mitigation (Jenkins et al., 2010). The cost of the marginal trade for the Mississippi River valley is estimated at US$20.71/kg N, and using the U. S. Bureau of Labor Statistics (2024) Consumer Price Index inflation calculator, inflating the price to 2024 U.S. dollars results in a value of US$36.96/kg N. The bounds in N mitigation values are estimated by using the lowest and highest N credit prices generated by Ribaudo et al. (2005) which are US$33.38–$155.18/kg N in 2024. Using our denitrification rates, we estimate the average annual net denitrification and multiply the range of N credit prices to develop a range of net present values for the N mitigation service across Dogtooth Bend. Finally, we normalize the N mitigation service estimates by area to arrive at an annualized value by area ($/ha/yr) to compare to the potential agricultural profit of the floodplain lands across Dogtooth Bend.
We estimated profit from agricultural lands across Dogtooth Bend by using historical yield data for corn and soybeans, annual crop prices, and production costs. Corn and soybean crops were chosen for this analysis because these are the common crops grown on floodplain lands in southern Illinois. Historical corn and soybean yield data for the period (2018–2022) were compiled from the USDA (2024) National Agricultural Statistic Service database for Alexander County, Illinois, where Dogtooth Bend is located. We obtained prices for corn and soybean and the associated agricultural production costs for the same period for southern Illinois from Schnitkey and Paulson (2024). Corn and soybean prices and production costs for each year were inflated to 2024 U.S. dollars using the U. S. Bureau of Labor Statistics (2024) Consumer Price Index inflation calculator. We then calculated the agricultural profit by multiplying the average yield by its price and subtracting the production costs.
3 Results
3.1 Variation among soil characteristics in field sites
Field sites within the Dogtooth Bend are underlain by varying mixtures of sand, silt, and clay that govern infiltration into and through floodplain soils across the research area (Table 2). The soil at the Big Cypress wetland consisted primarily of clay (approximately 70%) and had the highest percentage of organic material (10%) observed across the four sites. At the Grand Lake site, the soils are composed of a clay loam containing the second-highest organic content (7%). The soil at the Lake Milligan site is composed of silty clay loam that possesses nearly equal amounts of silt and clay (approximately 37%), with approximately 5 % organic content. The Santa Fe site is underlain by the sandiest soil observed across our field sites, having nearly 90% sand with the least amount of organic material (<2%).
Table 2
| Field site | Dominant texture | Sand (%) | Silt (%) | Clay (%) | Bulk density (g/cm3) | Particle density (g/cm3) | Porosity (%) | AFDM (%) |
|---|---|---|---|---|---|---|---|---|
| Big Cypress | Clay | 7.55 ± 0.65 | 20.11 ± 0.63 | 72.34 ± 0.77 | 0.82 ± 0.03 | 2.44 ± 0.03 | 0.66 ± 0.01 | 10.28 ± 0.60 |
| Grand Lake | Clay Loam | 28.96 ± 4.18 | 31.66 ± 2.18 | 39.38 ± 2.93 | 0.87 ± 0.04 | 2.52 ± 0.02 | 0.66 ± 0.01 | 7.25 ± 0.63 |
| Lake Milligan | Silty Clay Loam | 25.57 ± 1.92 | 36.98 ± 1.50 | 37.45 ± 0.97 | 1.24 ± 0.01 | 2.59 ± 0.04 | 0.52 ± 0.01 | 4.71 ± 0.11 |
| Santa Fe | Sand | 88.28 ± 3.67 | 5.42 ± 2.69 | 6.30 ± 1.06 | 1.41 ± 0.06 | 2.66 ± 0.02 | 0.47 ± 0.02 | 1.48 ± 0.37 |
Results of soil analyses for each field site as dominant texture classification and averages ±SE for sand, bulk density, particle density, porosity, and ash-free dry mass (AFDM).
3.2 Initial and changes in N gas and nitrogenous solutes during incubations
In the following section, we present initial concentrations of N gas or solutes in inflow waters with gains or losses in absolute concentrations during incubations (Table 3) for direct comparisons with other studies. In addition, we also report the rates of changes in nitrogenous components by treatment type and among field site soils (Figure 2, Table 4) for use in landscape models.
Table 3
| Inflow or outflow waters | N gas (mg) | NO3-N (mg/L) | NH4-N (mg/L) | PO4 (mg/L) | pH | Alkalinity (as mg CaCO3/L) | DOC (mg/L) | TN (mg/L) |
|---|---|---|---|---|---|---|---|---|
| Inflow | ||||||||
| Anoxic | 11.37 ± 0.09 | 0.67 ± 0.05 | 0.03 ± 0.01 | 0.43 ± 0.02 | 9.20 ± 0.09 | 107.9 ± 3.6 | 2.94 ± 0.15 | 0.98 ± 0.16 |
| Oxic | 12.00 ± 0.07 | 0.51 ± 0.06 | 0.02 ± 0.01 | 0.44 ± 0.01 | 8.99 ± 0.08 | 107.3 ± 2.9 | 3.45 ± 0.25 | 1.26 ± 0.11 |
| Outflow | ||||||||
| Anoxic Deep | 12.53 ± 0.08 (+1.16 ± 0.08) | 0.25 ± 0.03 (−0.42 ± 0.04) | 0.44 ± 0.08 (+0.41 ± 0.04) | 0.42 ± 0.04 | 8.70 ± 0.07 | 112.3 ± 5.3 | 7.79 ± 0.36 | 0.46 ± 0.07 |
| Anoxic Surface | 12.33 ± 0.04 (+0.95 ± 0.07) | 0.30 ± 0.03 (−0.37 ± 0.04) | 0.16 ± 0.03 (+0.13 ± 0.02) | 0.26 ± 0.02 | 8.70 ± 0.07 | 104.0 ± 3.1 | 7.64 ± 0.28 | 0.27 ± 0.02 |
| Oxic Deep | 12.71 ± 0.08 (+0.70 ± 0.07) | 0.27 ± 0.03 (−0.24 ± 0.05) | 0.69 ± 0.16 (+0.67 ± 0.08) | 0.42 ± 0.06 | 8.52 ± 0.06 | 112.5 ± 4.2 | 10.34 ± 0.63 | 0.66 ± 0.09 |
| [-1pt] Oxic Surface | 12.55 ± 0.05 (+0.55 ± 0.06) | 0.27 ± 0.04 (−0.24 ± 0.05) | 0.16 ± 0.02 (+0.14 ± 0.01) | 0.18 ± 0.02 | 8.47 ± 0.05 | 105.1 ± 2.4 | 9.12 ± 0.50 | 0.66 ± 0.25 |
Inflow and outflow concentrations of N gas and solutes during incubations as averages ±SE for treatment types.
Parenthetic values below nitrogenous species indicate absolute gain or loss in N for comparison between N gas and NO3-N. Fluxes were used to generate rates using Equation 1. Inflow water for all incubations was conducted with Mississippi River water that was collected at Thebes, Illinois, on the same day as the soil cores.
DOC, ; TN, total nitrogen.
Figure 2
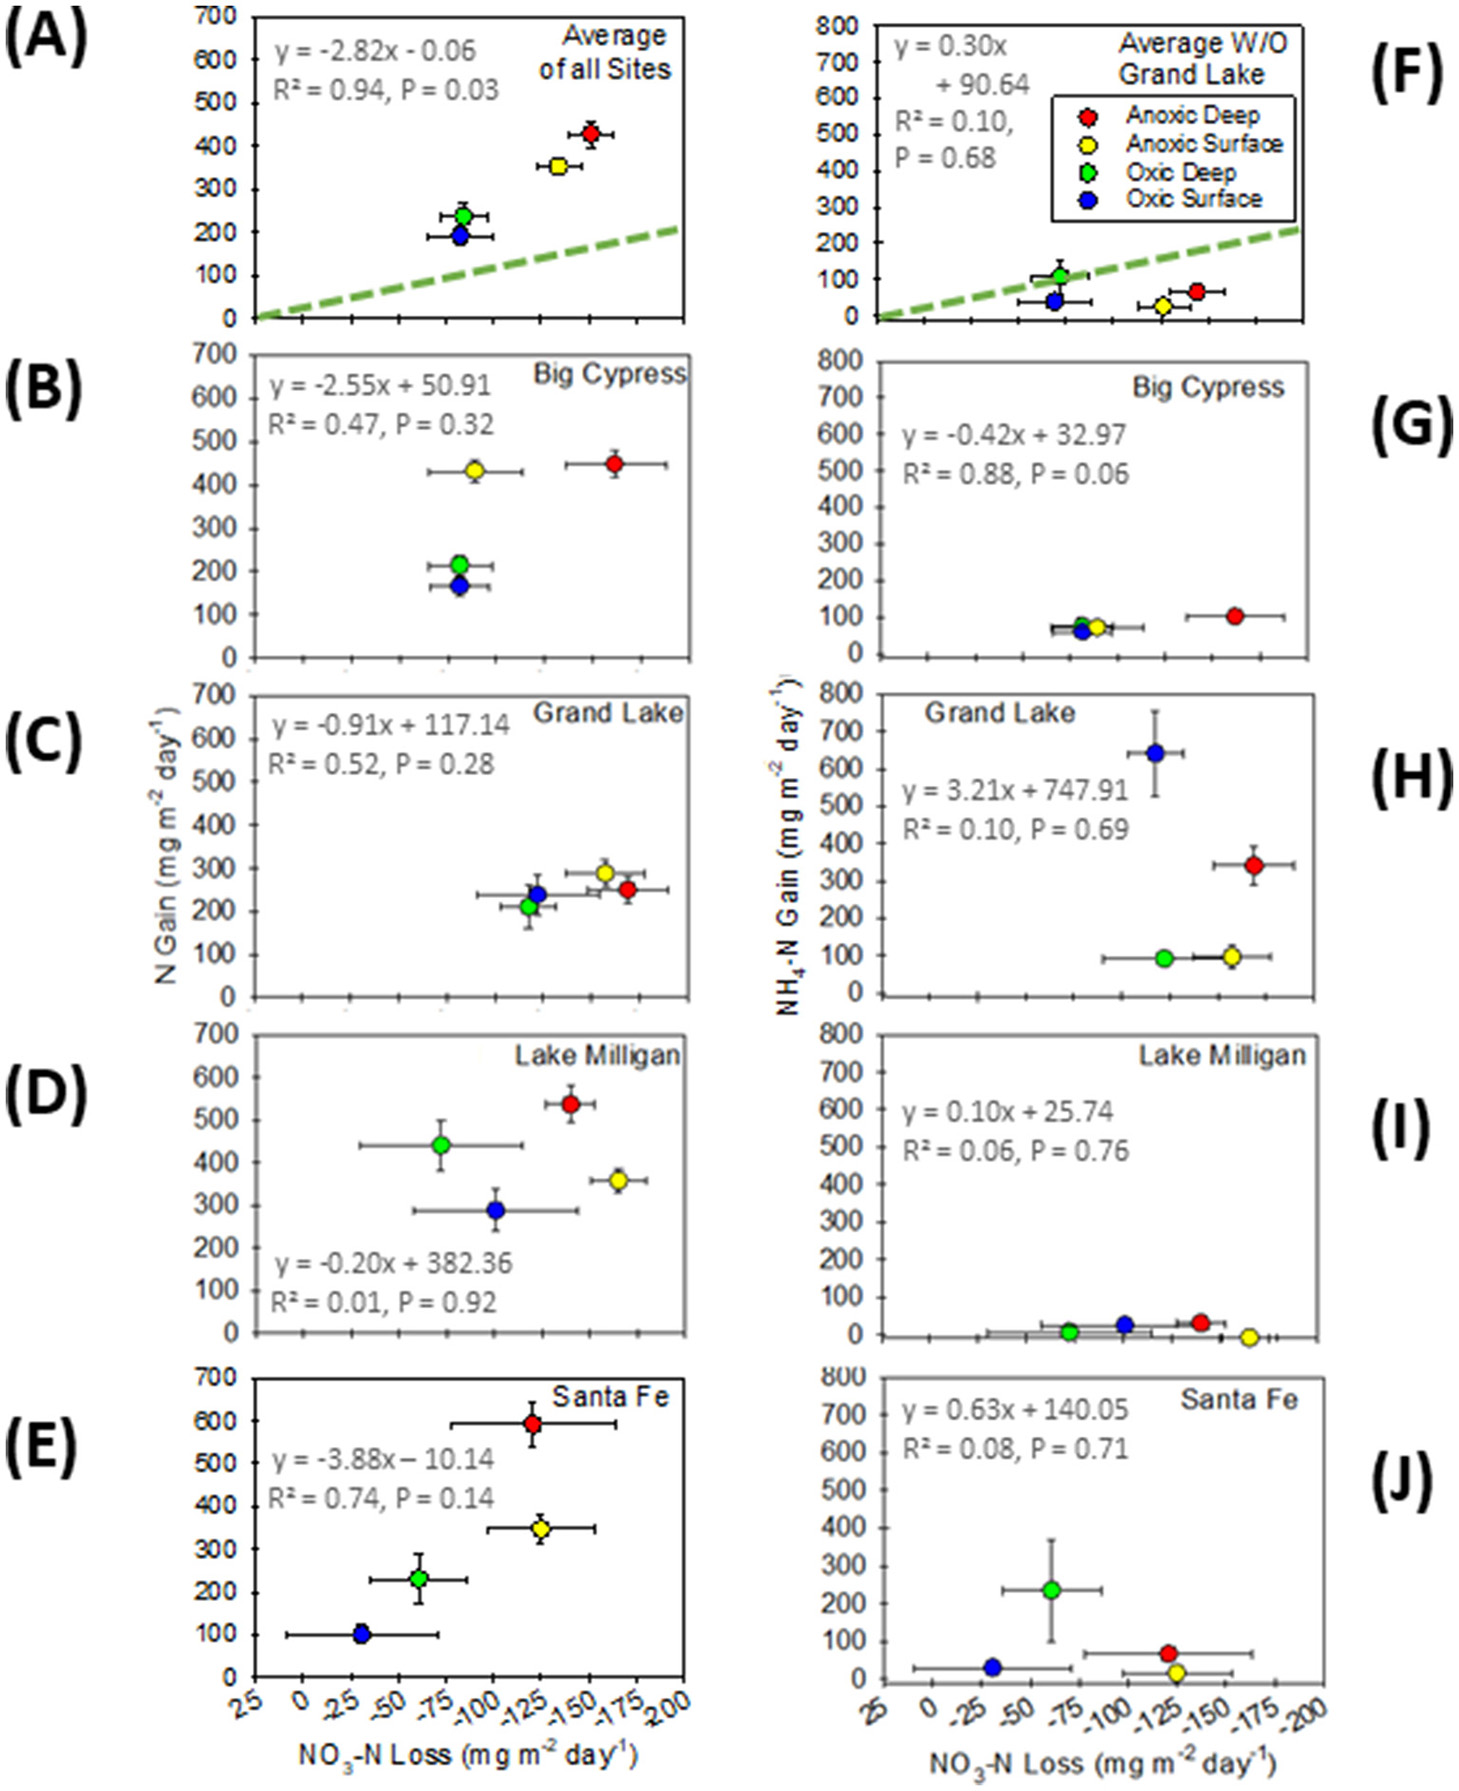
NO3-N loss rates relative to denitrification rates as N gas production (A–E) and NO3-N loss rates relative to NH4-N gain rates during incubations (F–J). (A, F) show rate averages for treatments across all field sites followed by findings for each field site individually. The bold diagonal lines show the expected 1:1 stoichiometric relationship between denitrification or potential dissimilatory nitrate reduction to ammonia and NO3-N loss. (F) Excludes Grand Lake data from the NH4-N averages. Error bars = SE, representing variance in outflow collected at 24-h intervals.
Table 4
| Rate bounds | Uncharacterized soil | Clay (Big Cypress) | Silty clay loam (Lake Milligan) | Sand (Santa Fe) |
|---|---|---|---|---|
| A. Gross denitrification as N gas production rate | ||||
| Maximal | 429.58 ± 29.72 | 448.00 ± 30.05 | 536.83 ± 42.93 | 592.14 ± 52.85 |
| Minimal | 190.29 ± 20.60 | 166.17 ± 21.26 | 288.88 ± 49.95 | 100.81 ± 21.78 |
| B. Observed NO 3 -N loss rate | ||||
| Maximal | −151.25 + 11.75 | −161.83 ± 25.75 | −165.24 ± 14.20 | −124.87 ± 27.72 |
| Minimal | −82.81 + 16.99 | −81.43 ± 15.17 | −72.11 ± 42.26 | −30.76 ± 40.09 |
| C. Apparent concomitant nitrification rate: stoichiometric schism between N gas gain and NO 3 -N loss | ||||
| Maximal | 270.78 ± 30.67 | 340.91 ± 34.66 | 396.81 ± 44.57 | 416.48 ± 12.11 |
| Minimal | 100.72 ± 24.71 | 84.74 ± 30.03 | 147.94 ± 47.66 | 70.05 ± 56.92 |
| D. Net denitrification rate as N gas minus apparent nitrification | ||||
| Maximal | 158.8 ± 10.68 | 161.83 ± 25.75 | 165.24 ± 14.20 | * 175.66 ± 31.75 |
| Minimal | 84.35 ± 12.33 | 81.43 ± 15.17 | 72.11 ± 42.26 | * 30.76 ± 40.09 |
The stoichiometric comparison between gross denitrification gain as N gas production (panel A) relative to NO3-N loss rates (panel B) yielded the apparent nitrification (panel C) with an overall approximately 1:0.62 ratio of denitrification to apparent nitrification.
Thus, panel D shows the net denitrification rates that are approximately 62% lower average NO3-N loss than the expected 1:1 ratio in N gas production to NO3-N loss rates (see Figure 3). For gross and net calculations, we show the maximal (anoxic deep injections) and minimal rates (oxic surface delivery) based on uncharacterized soil incubations (averages across all soil types) and for the dominant soil textures observed in cores from Big Cypress (clay), Lake Milligan (silty clay loam), and Santa Fe (sand; see Table 2 for soil percentages). All units are mg N m−2 day−1. Values from different treatments may not add up due to rounding.
Most conservative values were used in monetary valuation (Table 6).
3.2.1 Range of denitrification across 2 × 2 factorial treatment types
As would be expected, the presence of oxygen largely governed anaerobic denitrification, however, distinctions in soil characteristics among field sites also exerted substantial influence (Table 4, Figure 2). Overall, we observed a denitrification hierarchy in which anoxic-deep-injection cores (AD cores) simulating hyporheic infiltration outpaced anoxic-surface-delivery cores (AS cores). AS cores also exceeded oxic-deep-injection cores (OD cores) and oxic-surface-delivery cores (OS cores; Figure 2A). Thus, average denitrification rates across all sites, despite variation in dominant soil composition, followed an anoxic-injection hierarchy of AD > AS > OD ≥ OS (p ≤ 0.004) (Denitrification rates when calculated in terms of soil volume covaried tightly with those calculated by surface area. See Supplementary material 3 and Supplementary Figure S2 with an R2 = 0.916. Herein, however, we present all findings as rates by surface area for comparison to other studies).
Regarding site-specific distinctions in denitrification rates, context-dependent patterns varied among soil types. For the sandy soils at the Santa Fe site, the denitrification hierarchy persisted (Figure 2E, Supplementary Table S3). In sharp contrast, the Big Cypress clay soils had low permeability regardless of injection type. Consequently, only oxic vs. anoxic treatments differed significantly irrespective of surface vs. deep injection delivery (Figure 2B). Lake Milligan incubations with an even mix of clay, silt, and sand mostly followed the hierarchy with the interesting exception of oxic surface injections, where hypothetically high aerobic respiration rapidly consumed DO, triggering anaerobic conditions conducive to elevated denitrification rates (Figure 2D). Unexpectedly, the clay loam at the Grand Lake site did not fit the observed trends of other sites. Denitrification was very low and did not differ among treatments (Figure 2C). This suggests that some factor or factors, other than soil type, influence denitrification at the Grand Lake site.
3.2.2 Stoichiometry of N2 production relative to NO3-N loss: evidence for concurrent nitrification
For stoichiometric comparisons during incubations, we report N gas production and compared ratios of N gas production to changes in other nitrogenous molecules in the nitrogen cycle. Theoretically, N gas production equal to NO3-N loss indicates that denitrification (Supplementary Figure S1, Process 1) is responsible for all NO3-N loss. If N gas production is greater than NO3-N loss, then another reaction, such as nitrification, is producing NO3-N (Supplementary Figure S1, Process 3). Overall, our stoichiometric findings indicate simultaneous production of NO3-N via concomitant nitrification during incubations that apparently replenished NO3-N resulting in much lower losses in outflows than expected (for more detail, see Supplementary material 4, Supplementary Tables S3, S4, Supplementary Figure S3).
With respect to concentrations, we observed a tremendous disparity in N gas concentration gains relative to NO3-N concentration losses. Table 3 shows that average increases in N gas concentrations, followed by the anoxic-injection hierarchy of treatments with AD > AS > OD > OS (AD of ±1.16 trending down to OS of ±0.55 mg N) and loss of NO3-N concentration in outflow waters, followed a similar hierarchy of AD > AS > OD = OS, the ratio of N produced to NO3-N loss averaged 2.6:1. That is, NO3-N loss was only 38.3 ± 1.9% (Avg ±SE; range 34%−43%) of the amount on N produced during incubations.
For rates, Figure 2A shows that NO3-N loss rates averaged across all field sites roughly approximated the anoxic-injection hierarchy by treatment type as N gas production (i.e., AD ≥ AS > OD ≥ OS), although neither surface- nor deep-injection treatments differed significantly, only whether conditions were oxic or anoxic. Consistent with the findings for concentrations, NO3-N loss rates were far less than a 1:1 ratio with N gas production (shown as a line in Figure 2A) and fell just below a 3:1 ratio. Table 4 illustrates the stoichiometric disparity in NO3-N loss rates across treatments. As an example, in sand (i.e., the Santa Fe cores), the maximal (i.e., anoxic-deep) gross denitrification as N gas production was 592.14 mg N/m2/day, whereas the NO3-N loss rate was only −124.87 mg N/m2/day. This disparity resulted in an unaccounted-for NO3-N loss rate of 416.48 mg N/m2/day, yielding a net NO3-N removal of 175.66 mg N/m2/day. The most parsimonious explanation is the concurrent production of NO3-N by nitrification.
Concurrent nitrification varied among site-specific distinctions in soil types. Although N production to NO3-N loss rates were well above a 1:1 ratio, only the sandy Santa Fe site soils broadly follow the hierarchy of the most productive denitrification treatments consuming the greatest amount of NO3-N (Figure 2E). For Big Cypress, the anoxic deep cores had approximately twofold higher NO3-N loss rates compared to all other treatments, suggesting less concurrent nitrification deep into the clay soils with virtually identical nitrification in the anoxic surface and all oxic incubations (Figure 2B). Lake Milligan further broke from the hierarchy in that the consumption of NO3-N followed a pattern of AS ≥ AD ≥ OD ≥ OS, where only anoxic surface and oxic deep did not overlap, meaning that the trend was for greater NO3-N loss from surface injections but overlapped with their respective deep treatments (Figure 2D). Of all field sites, Grand Lake, with the lowest rate of denitrification, also had NO3-N loss rates of approximately 2:1 that came closer to the 1:1 ratio with denitrification because anoxic deep treatments had greater loss rates than the oxic surface treatments, indicating more concurrent nitrification in oxic surface cores (Figure 2C).
3.3 Changes in other context-dependent factors during incubations
Using natural water for all incubations collected on 1 day from the Mississippi River meant that inflow concentrations of NO3-N, NH4-N, PO4, pH, alkalinity, DOC, or TN did not vary appreciably (Table 3). We report them to show that conditions were conducive to denitrification and levels were not limiting. In all cases, nutrients in inflow waters met or exceeded eutrophic levels (Wetzel, 2001) with abundant DOC concentrations.
3.3.1 Changes in PO4, DOC, DOC:NO3-N, DOC:TN, and PO4 during incubations
Averaged according to treatment types, PO4 outflow concentrations were significantly lower in surface delivery treatments (Table 3) and showed the same pattern of significant loss when measured as PO4 rates (Supplementary material 5, Supplementary Table S6). However, a comparison of PO4 dynamics among field sites revealed more complex interactions with few clear-cut patterns (Supplementary Figures S4A–E). Mechanisms that mediate PO4 dynamics include decomposition release from organic compounds, luxury uptake by the microbial community, adsorption to organic soils, and adsorption to cations, such as calcium or oxidized iron under oxic conditions (Gachter and Meyer, 1993). These actively competing uptake and release mechanisms were imposed during incubations and are certainly influenced by soil types (Hallberg et al., 2024).
During the incubations, average DOC concentrations in outflows consistently increased 2- to 3-fold from approximately 3 mg/L in inflow waters during incubations (Table 3). Similarly, the rates of DOC production were consistent with flushing from organic-rich soils and greater release from oxidative respiration in the oxic treatments (Supplementary material 5, Supplementary Table S6, Supplementary Figures S4F–J). Certainly decomposition and release from adsorption to soils containing ample organic matter as indicated by high percentages of ash-free dry mass, 1.5%−10.2% of soil (Table 2) likely all contribute.
Compared to C:N relationship of 60:7 (8.57 ratio) reported for microbial biomass (Cleveland and Liptzin, 2007), initial DOC:NO3-N or DOC:TN ratios (averages ± SE) of 6.30 ± 0.63 and 3.19 ± 0.08, respectively, in inflow water from the Mississippi River were very low (Supplementary Table S6). The absolute concentrations of DOC and NO3-N (Table 2), as well as these low ratios, indicate that in our incubations, N was not initially limiting and that abundant stores of carbon exist in the soil. Outflow ratios, however, increased among different treatments from 40 to 64 (DOC:NO3-N) and from 27 to 43 (DOC:TN), reflecting both DOC release and overall uptake of nitrogen minerals during incubations. For more detailed information on these aspects of ecological stoichiometry, see Supplementary material 6, Supplementary Tables S6, S7.
3.3.2 Changes in pH, alkalinity, and metals
Other context-dependent environmental factors co-varied with denitrification to varying degrees and potential inferences (Table 3). Throughout the incubations, pH in outflows remained basic but dropped significantly from inflow averages (approximately 9.1) down to outflow averages between 8.5 and 8.7 depending on the treatment across all wetland sites, which is consistent with microbial decomposition. Alkalinity did not change significantly during incubations, but deep injections trended higher than surface injections. The results of metals analyses (Supplementary Material 7, Supplementary Table S9) indicate low but toxic levels of arsenic and lead in inflow water from the Mississippi relative to criteria protective of freshwater life (USEPA, 2009). Relative to drinking water criteria (USEPA, 2018) or agriculture water quality limits (Marshack, 2016), aluminum, iron, nickel, copper, and zinc levels were below all toxicity criteria. Furthermore, sodium, magnesium, potassium, and calcium were abundant in concentration and apparently did not limit microbial growth (Supplementary Table S10).
3.4 Inferences from DistLM models of denitrification covariates
Table 5 summarizes the best AICc models from DistLM analyses of how much variation in the denitrification rates was explained by soil and geochemical factors (see Supplementary material 8 for individual models, showing increasing R2 values and, with the addition of new explanatory variables, the corresponding changes in AICc values). Factors included in the best AICc model are shown in bold and underlined. We present other factors that increased R2 values by 0%−3% because they were individually significant even though they did not add inference to the best AICc models.
Table 5
| Geochemical rates | Environ. | Soil or organic characteristics | ||||||||||||||
|---|---|---|---|---|---|---|---|---|---|---|---|---|---|---|---|---|
| DistLM models for: | R 2 for best AICc model | R 2 for all factors | NO 3 -N (mg/m 2 /day) | NH 4 -N (mg/m 2 /day) | PO 4 (m mg/m 2 /day) | DOC (mg/m 2 /day) | Temp (°C) | DO (mg/L) | Bulk dens. (g/cm 3 ) | Particle dens. (g/cm 3 ) | Porosity | Soil vol. (cm 3 ) | AFDM (%) | Sand (%) | Clay (%) | Silt (%) |
| A. All sites | 0.34 | 0.34 | 0.03 | 0.07 | 0.03 | 0.23 | 0.05 | 0.05 | 0.02 | 0.07 | ||||||
| B. Treatments | ||||||||||||||||
| Anox. Deep | 0.83 | 0.85 | 0.22 | 0.11 | 0.28 | 0.28 | 0.33 | 0.25 | 0.22 | 0.20 | 0.27 | |||||
| Anox. Surf. | 0.27 | 0.28 | 0.18 | 0.07 | 0.17 | |||||||||||
| Oxic Deep | 0.09 | 0.09 | 0.09 | 0.06 | 0.03 | |||||||||||
| Oxic Surf. | 0.61 | 0.69 | 0.10 | 0.11 | 0.11 | 0.20 | 0.14 | 0.21 | 0.10 | 0.15 | 0.12 | 0.25 | 0.12 | 0.31 | ||
| C. Sites | ||||||||||||||||
| Big Cypress | 0.71 | 0.75 | 0.25 | 0.68 | 0.22 | 0.19 | 0.11 | 0.09 | ||||||||
| Grand Lake | 0.19 | 0.21 | 0.12 | 0.08 | 0.09 | 0.07 | ||||||||||
| Lake Milligan | 0.45 | 0.48 | 0.27 | 0.20 | 0.14 | 0.07 | 0.07 | |||||||||
| Santa Fe | 0.63 | 0.67 | 0.14 | 0.36 | 0.11 | 0.29 | 0.18 | 0.16 | 0.25 | |||||||
Distance-based linear (DistLM) models yielding the best Akaike information criterion for small sample sizes (AICc) models and the percentages of denitrification rates explained by geochemical rates, temperature, DO, or independent soil variables. Sections show DistLM model results for: A. All sites, B. Treatment types, and C. Field sites. R2 values are not additive because of covariance.
Bold underlined data show factors included in the best AICc models. Non-bold factors while individually significant (α ≤ 0.1) had little (1%−3%) or no effect on the R2 for all factors when included (details in Supplemental material 8). DOC, ; DO, dissolved oxygen; AFDM, ash-free dry mass.
3.4.1 DistLM analyses results across all sites irrespective of treatment types
For all sites and treatments combined, the best AICc model explained 34% of the variation in denitrification rates (Table 5, panel A). Among individual explanatory factors, DO levels in inflow waters alone explained 23% of the total variation, while the rate of change in PO4 and soil characteristics explained an additional 11% when accounting for covariation.
3.4.2 DistLM analyses by treatment type
Among treatment types (Table 5, panel B), the best AICc models explained 61%−83% of the variation in denitrification for oxic surface and anoxic deep incubation cores, respectively. In these same cores, NH4-N release rates were significant, explaining 10%−22% of variation as well as the release rates of DOC, potentially reflecting microbial activity. The aspects of soil that govern flow worked in concert to explain most of those high i2 values, both of which dwarfed the low R2 values of 0.27 and 0.09 for anoxic surface and oxic deep injection cores, respectively. In all treatments, the PO4 rate explained 9%−18% of denitrification, likely due to an interplay of abiotic processes (i.e., adsorption and release from mineral particles depending on DO levels) and biotic processes (e.g., luxury uptake or decompositional release) as discussed earlier (see Supplementary material 5 for interesting patterns in PO4 and DOC). DO was only correlated with oxic surface treatments, where it explained 20% of the variability in denitrification, likely depending on infiltration governed by soil characteristics.
3.4.3 Site-specific DistLM results
For three of the four sites, a mixture of mainly PO4 rates, environmental conditions (temperature and DO), and soil characteristics explained high percentages of the variation in denitrification rates that overall ranged from 63% to 71%. The reasons might be inferred from different soil types among the individual field sites. Dissolved oxygen was an important factor for clay soils at Big Cypress, explaining 68% of denitrification relative to distinctions between oxic and anoxic treatments irrespective of injection mode. In sand-rich cores at Santa Fe, DO explained 36% of denitrification. For both sites at which DO was important, many soil characteristics that correspond with flow were also significant, especially particle density. Possibly because of the nearly equal amounts of clay, silt, and sand in the soils from Lake Milligan, only the percentage of sand was significant with most variation explained by temperature and PO4 uptake rates (Supplementary Figure S4). Incubations from Grand Lake were an exception to clear covariates, with, at best, 12% of variation explained by temperature and even less by DO, sand, or silt, comprising a low best AICc model R2 of 19%. The overall low inference at Grand Lake from DistLMs is not unexpected because denitrification rates did not differ among treatment types (Figure 2C), but the finding of high NH4-N production despite consistent denitrification suggests that an interplay of ammonification and other microbially mediated mechanisms is involved.
The finding that temperature, which we monitored with loggers sensitive to variations of 0.05°C, explained 12%−14% of denitrification in the clay loam sites (Grand Lake, Lake Milligan) was unexpected because we held it to consistent temperatures by conducting incubations in an environmental chamber averaging from 30.5°C to 30.8°C (range: 29.9–30.9°C; see Supplementary Table S2).
3.5 Inundation frequency, N mitigation potential, and comparison of N mitigation value to agricultural revenue and profit
The hydrologic analysis and hydrodynamic modeling have allowed us to determine the frequency of river inundation across the Dogtooth Bend floodplain. The frequency of inundation generally increases from the northwest, where, on average, the land is inundated < 3 days, to the southeast across the Bend, where low-lying river-connected areas are inundated >30 days during the growing season. The areas with extended periods of inundation (>30 days) include the levee breach complex (river mile [RM] 33 to 34), the cutoff channel, and back swamp areas between RM 13 and 20 (Figure 3A). Figure 3B shows the pattern of denitrification using the average soil denitrification rate across Dogtooth Bend. Figure 4 shows the distribution of soil textures across the study area. Comparing the inundation frequencies shown in Figure 3 with the soil textures shown in Figure 4, the area with the highest inundation frequency is where soil textures foster moderate denitrification rates (i.e., silt and clay mixtures). Multiplying the net denitrification rates for the lower bound and upper bound (see rates for sand in Table 4) and the average denitrification rate between the two bounds by our model of inundation frequency (Figure 3B) provides N mitigation bounds for the growing season of 68.3 and 385.3 tons of N, with an average of 226.8 tons of N (Table 6). This equates to between 0.01% and 0.06% of the total annual N load of the middle Mississippi River (648,000 tons/yr).
Figure 3
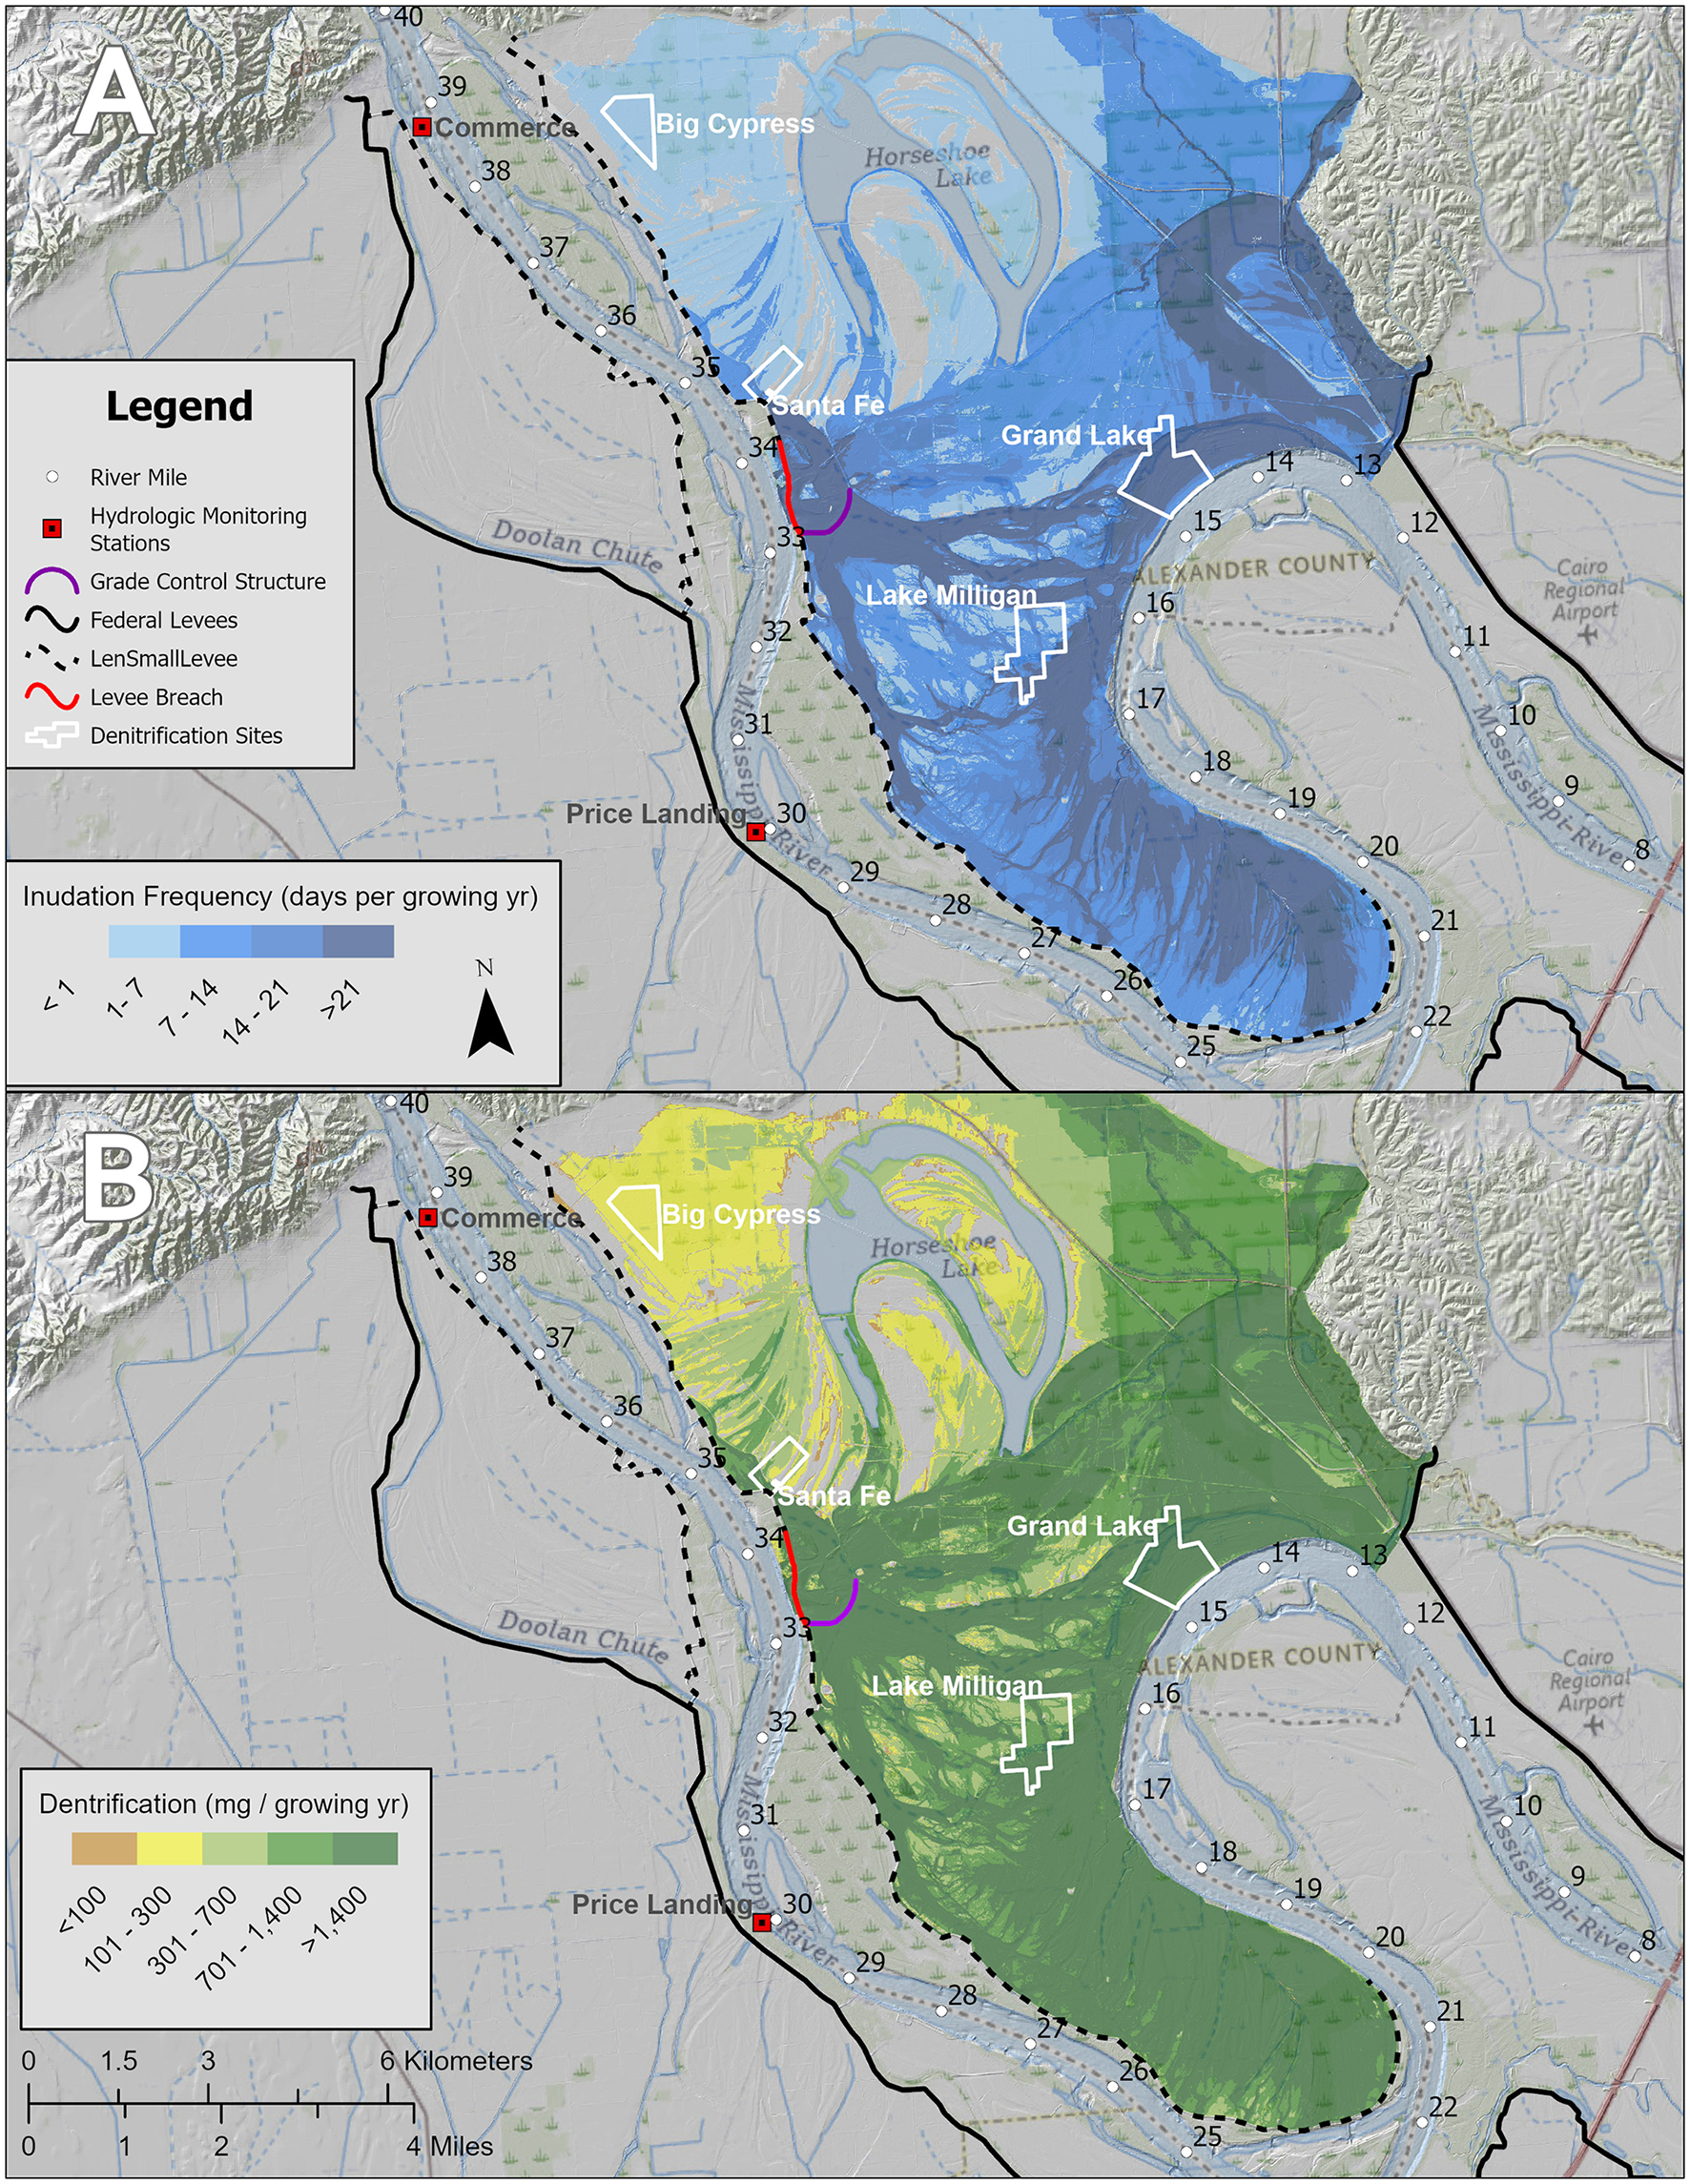
(A) Is the inundation frequency in days per the growing season (April 1–November 1) for river conditions circa 2022 with the levee breach and grade control structure in place. (B) Is the average annual denitrification rate in mg/per growing season across using the average value of denitrification rates estimated in this study with the estimated average annual inundation frequency. In (A), the areas within the darkest shade of blue represent the most frequently inundated portion of the Dogtooth Bend Floodplain with an inundation frequency ≥7% daily exceedance probability.
Figure 4
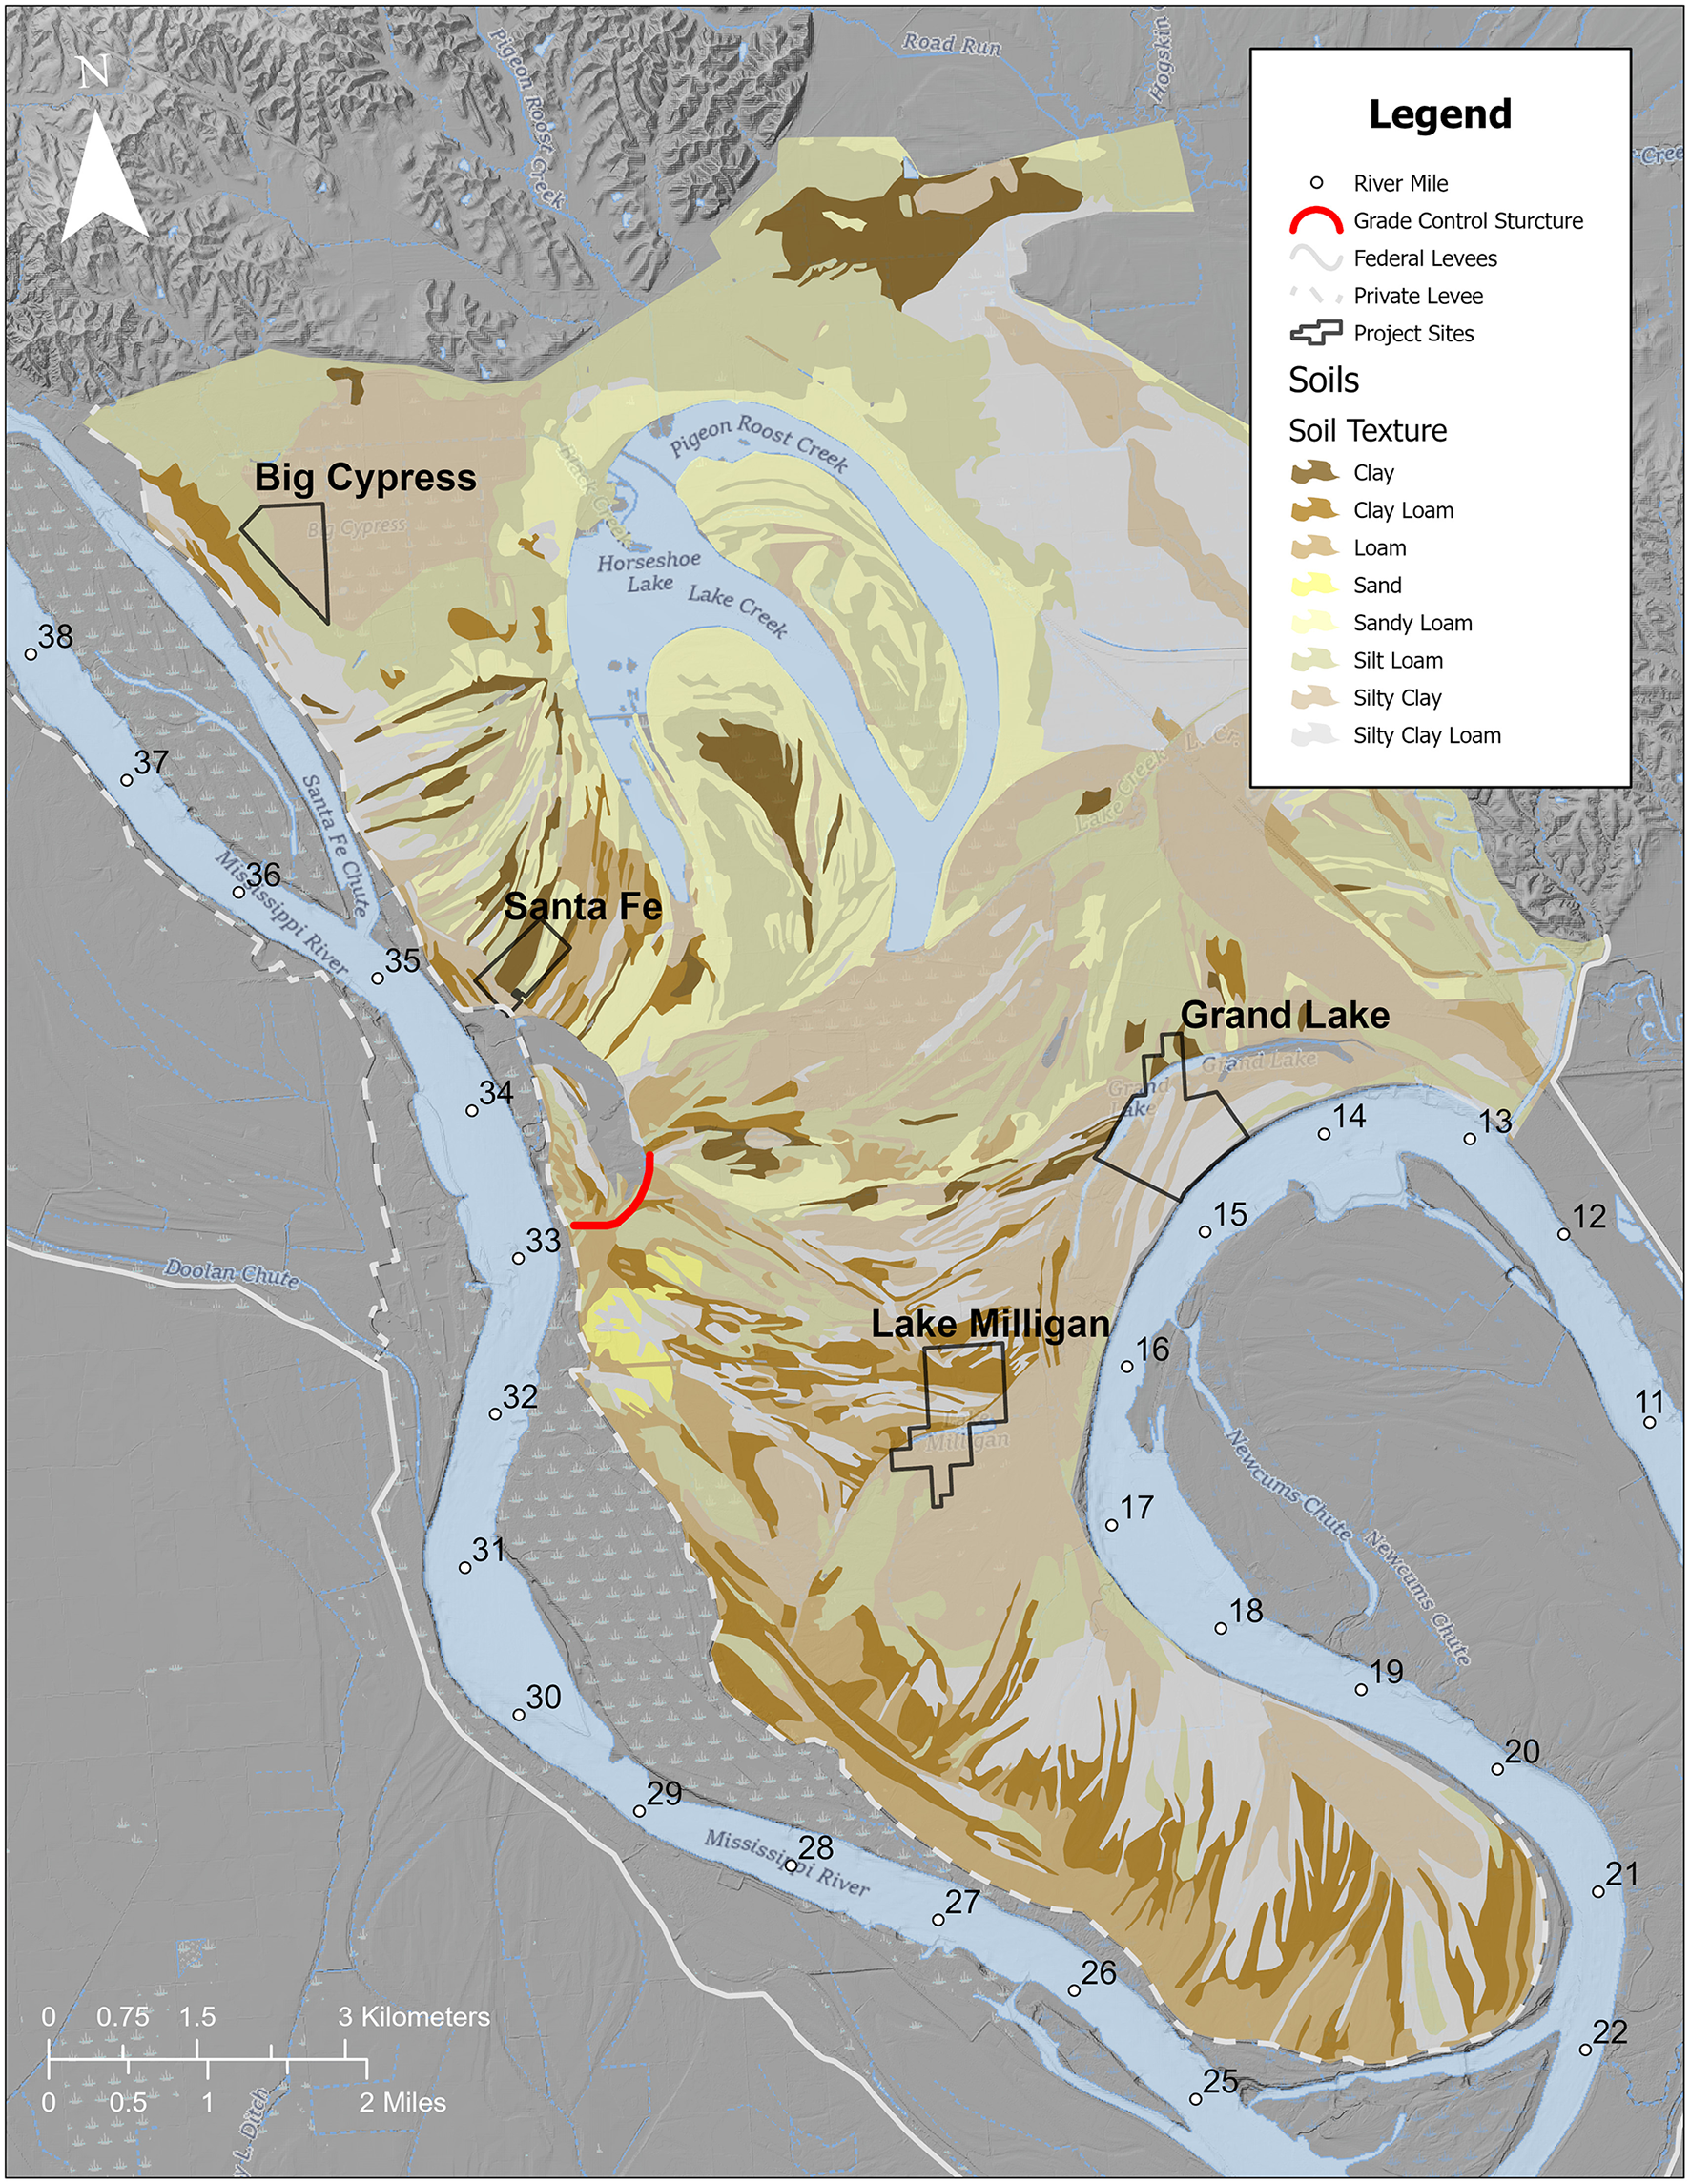
Map of soil textures across Dogtooth Bend from the USDA (2006), Nations Resource Conservation Service's Soil Survey Geographic Database.
Table 6
| Scenario | Net denitrification rate (N mg/m2/day) | Average annual net denitrification (tonnes N/growing season) | % Measured total river nitrogen load | Cost of marginal N credit ($/kg N) | Net present value N mitigation service ($ million) | Annualized value of N mitigation service ($/ha/growing season) |
|---|---|---|---|---|---|---|
| Lower bound | 31* | 68.3 | 0.01% | $ 33.38 | $ 2.28 | $ 156.44 |
| Average value | 103 | 226.8 | 0.04% | $ 36.96 | $ 8.38 | $ 575.54 |
| Upper bound | 175* | 385.3 | 0.06% | $ 155.18 | $ 59.80 | $ 4,105.67 |
Lower bound, average, and upper bounds for denitrification rates and subsequent calculations for net denitrification relative to total river load and monetary valuation (cost of marginal N credit from Ribaudo et al., 2005; in 2024 U.S. dollars).
Maximal and minimal net denitrification rates for sand, which encompasses rates in all other soil textures in Table 4.
Using our N mitigation bounds and Ribaudo et al.'s (2005) N mitigation credit prices, we estimate the net present value of this service across Dogtooth Bend to be between $2.3 and $59.8 million or $156–$4,106 per hectare for a growing season (Table 6). We also estimated revenues and profits for agricultural lands in corn and soybean production in Alexander County, Illinois, in which Dogtooth Bend is located. For the 2018–2022 period, the average revenue for corn was US$390 a hectare and US$265 for soybeans in Alexander County. The average profit for corn and soybean for this period was US$88 and US$79 per hectare, respectively (Table 7). It was interesting to note that profits from corn and soybeans were about half of our estimated N mitigation service value and fell within the range of revenue generated by these crops.
Table 7
| Year | Crop | Yield (tonnes/ha) | Price ($/tonnes) | Revenue ($/ha) | Non-land costs* ($/ha) | Profit ($/ha) |
|---|---|---|---|---|---|---|
| 2022 | Corn | 1.67 | $ 262.01 | $ 436.84 | $ 345.43 | $ 91.41 |
| 2021 | Corn | 1.83 | $ 270.00 | $ 493.45 | $ 285.41 | $ 208.04 |
| 2020 | Corn | 1.87 | $ 211.51 | $ 395.04 | $ 289.58 | $ 105.46 |
| 2019 | Corn | 1.48 | $ 83.65 | $ 272.21 | $ 299.48 | $ −27.27 |
| 2018 | Corn | 1.94 | $ 181.42 | $ 351.33 | $ 288.52 | $ 62.81 |
| Average | 1.76 | $ 221.72 | $ 389.77 | $ 301.68 | $ 88.09 | |
| 2022 | Soybean | 0.57 | $ 543.44 | $ 307.05 | $ 197.60 | $ 109.45 |
| 2021 | Soybean | 0.64 | $ 567.69 | $ 365.76 | $ 199.98 | $ 165.78 |
| 2020 | Soybean | 0.54 | $ 487.96 | $ 261.72 | $ 163.65 | $ 98.07 |
| 2019 | Soybean | 0.43 | $ 414.10 | $ 178.33 | $ 172.29 | $ 6.03 |
| 2018 | Soybean | 0.51 | $ 412.26 | $ 211.14 | $ 193.77 | $ 17.36 |
| Average | 0.54 | $ 485.09 | $ 264.80 | $ 185.46 | $ 79.34 |
Corn and Soybean yield, price (USDA, 2024), revenue, non-land-costs (Schnitkey and Paulson, 2024), and profit in Alexander County, Illinois, for the 2018–2022 period in 2024 U.S. dollars.
Non-land costs are summed costs from (1) direct costs of production of the crop, (2) costs of power machinery operations, and (3) overhead costs for general farm operation.
4 Discussion
4.1 Simulation of overland flooding and hyporheic infiltration: effects of oxygenation and hydraulic delivery on denitrification rates
The primary factor distinguishing denitrification rates at our Dogtooth Bend study sites is the condition under which the source water is introduced into the soil cores. Among the extremes of environmental conditions that we simulated using laboratory incubations, anoxic water injected deep into cores to represent the flow of anoxic hyporheic pushed through the soil at high river levels produced the highest denitrification rates on average (Figure 2A). While hyporheic water has a higher probability of anoxia, we also tested denitrification in oxic hyporheic conditions that produced intermediate rates. The lowest denitrification rates occurred in soil cores receiving oxic water on the surface to simulate overland flooding. On average, this established a denitrification hierarchy for treatments across cores and among field sites from highest to lowest rates as AD > AS > OD > OS. This observation persists across soil types represented in cores from individual field sites, with exceptions at Grand Lake and Lake Milligan sites, which have silty clay loam soils with intermediate hydrologic conductivity relative to the sandy soils at the Santa Fe site and clay soil at the Big Cypress site. To more fully understand what factors influence denitrification and what factors may cause deviations in the hierarchy of denitrification rates, we assessed the context-dependent soil characteristics.
4.1.1 Soil-mediated variation in denitrification averaged across all sites and treatments
The results of the DistLM analyses indicated that soil size (sand and silt) particle density, DO levels, and PO4 dynamics were significantly correlated to rates of denitrification across all treatments (Table 5A). Flow velocity (the movement of a particle in slow-moving liquids) depends on fluid density (that in this case was unchanging for the shared feed water from the Mississippi River), particle density, and particle size (Jackson et al., 2014). Thus, it is reasonable that anaerobic denitrification is largely explained by soil characteristics that govern flow velocity and delivery of DO as illustrated most clearly in the contrast between anoxic deep vs. oxic surface treatments and to varying degrees in all site-specific DistLM analyses. While this finding is not new, from a modeling perspective, this suggests incorporating not only inundation frequencies but also soil information into a floodplain model for a maximal and minimal N mitigation assessment. Section 4.5 provides refined predictions of this service across the landscape.
4.1.2 Soil-mediated variation in denitrification among field sites
The Santa Fe site with an average of nearly 90% sand exemplifies one hydraulic end member of the relatively higher hydraulic conductivity with lower water storage, higher infiltration, and hyporheic flow rates. As a result, the denitrification rates within these soils followed the anoxic-injection hierarchy (Figure 2E). The difference in deep injection alone is a prime example of the enhanced diffusion and delivery of NO3-N-rich water through sandy soils. The importance of enhanced diffusion and delivery through sandy soils was supported by the DistLM analyses' results in which particle density alone explained 29% of the variation in denitrification (Table 5, panel C). Other corresponding soil characteristics, including the percentage of clay, were also significant.
The opposite end member was the Big Cypress site, where the soil was composed chiefly of clay, which has both a strong capillary effect and is prone to channelization but only whether waters were oxic or anoxic (Table 2). Thus, the injection method made no difference in denitrification for cores from this site (Figure 2B). While Big Cypress differs starkly from the sandy Santa Fe site, many of the same environmental drivers were significant in the DistLM analyses (Table 5, panel C). Like Santa Fe, particle density was significant for Big Cypress and individually accounted for 22% of the variation in denitrification rates during incubations. The clayey soils at the Big Cypress site hypothetically inhibited the formation of a more robust microbial community because many of the soil particles were < 10 μm (DeFlaun and Mayer, 1983). Comparing the anoxic deep injections, fine particle size in combination with low hydrologic conductivity limiting the diffusion of nutrient-rich surface water likely prevented Big Cypress from reaching the 20%−30% higher denitrification rates of the Lake Milligan (Figure 2C) and Santa Fe (Figure 2D) sites.
Lake Milligan embodies the idea put forth by Harvey et al. (2019) that intermediate hydraulic connectivity in soils best facilitates biogeochemical reactions because it balances residence time with contact with ores from the other field sites because a large volume of biologically active soils. The soil incubations from Lake Milligan had significant distinctions in denitrification rates between surface- and deep-injection treatments, indicating that the nutrient-rich source water permeated the core when introduced from the bottom. Thus, deep delivery facilitated greater nutrient transfer without the channelization that limited the clay-dominated Big Cypress cores. Interestingly, unlike the sand- or clay-rich sites of Santa Fe and Big Cypress, no soil characteristics were statistically significant for Lake Milligan (Table 5C), possibly due to soil particles large enough for optimal microbial growth while still offering soil depressions to protect from excessive flow (DeFlaun and Mayer, 1983); thus, the soil characteristics apparently were not limiting denitrification. At Lake Milligan, the balance between intermediate hydraulic connectivity and microbial habitat may explain why mainly DOC and PO4, along with temperature, explained 68% of the total variation in denitrification rates.
The incubations of Grand Lake soils (Figure 2C) did not follow many trends established for the cores from the other field sites because they lacked distinct denitrification rates among injection types, which stands at odds with those in Lake Milligan cores, despite their similar soil characteristics (Table 2). Stable denitrification rates concurrent with extreme changes in other nitrogenous components are likely by-products of differences in nitrification and other unidentified forms of heterotrophic respiration that seemingly dominate the Grand Lake cores. The unexpected patterns highlight the need for additional research using other isotopic, genomic, and molecular techniques.
4.2 Chemical stoichiometry
4.2.1 Stoichiometric evidence for concurrent nitrification
To fully quantify the societal value of denitrification in floodplains, we compared the stoichiometry of N gas production rates to the loss of NO3-N. Compared to the theoretical 1:1 ratio, NO3-N loss rates were approximately one-third that of N gas production (approximately 2.6:1). The most parsimonious explanation is concurrent nitrification that replenished approximately 62% of the NO3-N during incubations. Microbial communities within the soil can form tight flocs with microbial consortia containing both nitrifiers and denitrifiers (Casey et al., 1995; Van Cleemput and Samater, 1995; Philips et al., 2002). Moreover, as described earlier, nitrification has maximal rates at 1.5 mg DO/L at 30°C (Wild Jr et al., 1971; Kholdebarin and Oertli, 1977; Jianlong and Ning, 2004) and only becomes limited below 0.3–0.5 mg DO/L (Wild Jr et al., 1971; Stenstrom and Poduska, 1980). While DO levels in the anoxic inflow water averaged ≤1 mg/L (Table 2) and despite the probability of some aerobic respiration in the soil cores, O2 must have remained above 0.3–0.5 mg/L in microenvironments because the proportion of apparent nitrification relative to denitrification was comparable between oxic and anoxic cores (Table 3). Relatively high nitrification rates were somewhat of a surprise; however, this finding is similar to rates reported in other studies. Kreiling et al. (2011) estimated mean annual nitrification rates of 266 mg N/m2/day at their field site in the backwaters of the Upper Mississippi River, which is similar to the apparent rate of average nitrification in anoxic-deep-injection treatments herein (Table 4). Richardson et al. (2004) found that nitrification was nearly equal to denitrification, 6,986 ± 428 tons/yr and 6,939 ± 342 tons/year respectively, in Navigation Pool 8 of the Upper Mississippi River. In a more recent study, Richardson et al. (2019) further highlight nitrification being closely coupled with denitrification in the riparian sediments of the Mississippi River and the adjacent St. Croix River, but like our study, they found that denitrification rates often outcompete nitrification rates. On the Mississippi River, average denitrification rates were 10 μg-N/cm2/h (2,400 mg-N/m2/day) compared to potential nitrification of 2.94 μg-N/cm2/h (706 mg-N/m2/day), meaning that nitrification could replace 30% of NO3-N. For cores from the St. Croix River, denitrification averaged 2.4 μg-N/cm2/h (576 mg-N/m2/day) and nitrification averaged 0.49 μg-N/cm2/h (118 mg-N/m2/day), meaning that nitrification was approximately 20% of the denitrification rate. Given the variation in denitrification estimates using acetylene inhibition assays compared to MIMS analysis (Bernot et al., 2003; Groffman et al., 2006), their absolute rates are reasonably similar and demonstrate a significant level of concurrent nitrification as we show herein. The high incubation temperature used in our experiment could have not only facilitated elevated denitrification, which is a trend commonly observed in rates during summer months (Richardson et al., 2004), but also stimulated increased nitrification rates in the same field sites (Strauss et al., 2004; Richardson et al., 2019). They found that the best predictors for denitrification were pore water NO3-N, porosity, and nitrification.
Like our study, these predictors emphasize the importance of sediment structure. Porosity is the important factor here as it allows NO3-N-rich surface water to flow into the sediment, fueling denitrification as well as nitrification (Richardson et al., 2019). Moreover, nitrification can be triggered by the depletion of readily available NO3-N in the injected water, causing a switch to coupled nitrification–denitrification (Kana et al., 1998; Kreiling et al., 2011). While not directly evaluated in our study, the natural variation in wetting and drying cycles between our field sites may prime some for paired nitrification–denitrification as it cultivates a community of facultative microbes who can more readily switch between oxic and anoxic processes, particularly sites with sandy soils as it would more readily change state (Tomasek et al., 2019). As a result, a field site rich in sand, like our Santa Fe site, would possess the greatest nitrification and denitrification rates, which appears to be true (Table 4).
4.2.2 Lack of stoichiometric evidence for other pathways of nitrate removal
Many alternate metabolic routes involve intermediates (NH4-N, NO3-N, NO2, NO, and N2O) in the nitrogen cycle that result in the production of N2 and, thus, can obscure a true 1:1 stoichiometric relationship between NO3-N and N gas production. We evaluated evidence of dissimilatory nitrate reduction to ammonia (DNRA; Supplementary Figure S1, Process 2), looking for covariance between NO3-N loss and NH4-N gains. Shortcut biological nitrogen removal (SBNR; Supplementary Figure S1, Process 5) sidesteps NO3-N, converting ammonium to nitrite (NO2) and eventually to N2 gas. Anammox (Figure 2, Process 6) converts NO3-N and NH4 to N2. Finally, incomplete denitrification halts the conversion of NO3-N at an intermediate step to produce the powerful greenhouse gas nitrous oxide (N2O).
Regarding a potential stoichiometric relationship between NH4-N relative to NO3-N as evidence for DNRA, covariance between the sometimes-exponential increases in NH4-N concentrations with NO3-N loss (Table 3) or covariance in those rates (Figures 2F–J) could indicate that DNRA played a role in some incubations. It did not. The most parsimonious explanation for NH4-N production independent of NO3-N levels is the ammonification of organic nitrogen (Supplementary Figure S1, Process 4). Aerobic respiration is the most efficient form of NH4-N production, but all aerobic and anaerobic forms of microbial heterotrophic respiration produce it. For the most part, we cannot quantify the potential effects of these processes because we lack isotopic analyses of NH4-N with labeled 15N, molecular markers, or direct measures of nitrogenous intermediates, such as NO2, nitric oxic (NO), or N2O. While we cannot rule out the influence of any components of the nitrogen cycle, for those interested, we explore the potential presence and impact of alternate pathways in the nitrogen cycle more fully in Supplementary material 8.
4.3 Inferences from DistLM analyses: environmental drivers aside from soil characteristics that affect denitrification
Aside from evaluating the role of soil type, which strongly affected oxygen delivery, and nitrogenous compounds in denitrification, we also employed inferences from DistLM analyses to consider how other site-dependent geochemical factors might limit or promote denitrification. As expected, dissolved oxygen levels explained many of the denitrification rates for all treatments combined (Table 5A; R2 = 23%) and among sites (Table 5C) with high clay (Big Cypress; R2 = 68%) and high sand soils (Santa Fe; R2 = 36%). This finding corresponds to several significant soil characteristics that block or promote hydraulic flow in deep-injection treatments vs. oxic surface injections, contributing greatly to the best AICc models, with R2 values of 83% and 61%, respectively (Table 5B).
For dynamics in NH4-N, PO4, and DOC rates, DistLM inferences explained relatively low, 9%−27% of the variance in denitrification rates, and varied depending on treatment and field site (Table 5). Temperature explained small percentages of denitrification for Grand Lake and Lake Milligan, possibly related to their hydrologic conductivity, indicating microbial populations' sensitivity to flow and temperature (Evans et al., 2021; Speir et al., 2023).
Across almost all treatments and field sites, PO4 rates of change during incubations covaried significantly with denitrification rates, which begs for additional research into how denitrification changes redox conditions, and thus abiotic complexation and release, particularly with iron depending on biological luxury uptake, redox state (i.e., oxygen limitation), and soil characteristics (Noe et al., 2013). During a recent investigation of the relationships between nitrogen and phosphorus (P) dynamics in remediated agricultural streams, Hallberg et al. (2024) showed that denitrification rates were positively correlated with P desorption. This suggests the release of P from reduced ferrous iron under anaerobic conditions in soils. They also showed that inundation frequency and coarse soil texture increased soluble reactive phosphorus. However, we generally observed PO4 uptake into the soil cores during incubations, possibly because water delivery was constant and our soil textures differed. For a more detailed examination of the importance of changes in these geochemical factors to denitrification, see Supplementary material 5.
4.4 N mitigation estimation and its value to floodplain management
Rivers worldwide have been disconnected from their floodplains by levees, altering their hydrologic, hydraulic, and ecological systems and the services they provide to society. The disconnection prevents the exchange of water, nutrients, and biota access during seasonal pulses of high flows (Junk et al., 1989; Poff et al., 1997; Knox et al., 2022). The 2016 Len Small Levee breach at Dogtooth Bend, the decision not to repair the levee, and the use of voluntary floodplain easements to convert agricultural lands into floodplain forest and wetlands to reduce agricultural flood losses while potentially enhancing other floodplain services are a novel approach to floodplain management in the United States. One of the primary reasons why this approach has not been widely used is, at least in part, due to the challenges with assessing trade-offs between market vs. non-market floodplain services (e.g., agricultural production vs. improved water quality; Opperman et al., 2009; Guida et al., 2016a). While market values are often readily available for agricultural land uses, the value of nutrient mitigation services for floodplain lands is more difficult to assess because it requires the quantification of both mitigation potential (e.g., nutrient processing rates) and monetary value for this non-market service (Jenkins et al., 2010).
We estimate that across the floodplain at Dogtooth Bend, net denitrification removes between 68 and 385 tons N for the growing season. Compared to the average annual TN load of the middle Mississippi River (648,000 tons N/yr), this equates to ≤ 0.06% (Table 6). From an economic standpoint, the estimated social value of N mitigation falls between US$156 and US$4,106 ha/yr, while revenue estimates are $390 ha/yr for corn and $265 ha/yr for soybeans. Net revenue estimates adjusted for non-land costs (direct costs of production of the crop, costs of power machinery operations, and overhead costs for general farm operation) yield estimated profits for these crops of US$88 and US$79 ha/yr, respectively (Tables 5, 6). While this analysis is not a full assessment of the floodplain N mitigation service, nor does it take into account other ecosystem services that river-connected floodplains can provide to society, our assessment suggests that conservation of frequently inundated floodplain lands (≥7% DEP) at Dogtooth Bend may be warranted given the potential social value of its N mitigation potential relative to profits generated by corn and soybean farming. This information could be useful in justifying payments for floodplain conservation easements, such as the ones paid to Dogtooth Bend landowners after the Len Small Levee breach, to decision-makers and, potentially, taxpayers.
However, we underscore the major limitations of our assessment here. First, the rates of denitrification presented in this article are based on a limited number of sampling sites, which may not fully characterize the range in floodplain denitrification rates but likely represent end members due to their distinctly different soil types. Denitrification rates vary by orders of magnitude worldwide, nonetheless, our rates are within the range of other riverine denitrification rates observed within the Mississippi River basin as discussed later. Second, our estimated denitrification rates do not necessarily quantify how much environmental denitrification occurs because we assume here that the soil denitrification rates measured in the lab, which are not limited by delivery of nutrient-rich waters, are representative of waters flowing across floodplain soils in the field. Finally, our denitrification rates were measured under warm (approximately 30°C) temperature conditions and consequently may be skewed to the upper end of the range of floodplain denitrification rates at Dogtooth Bend across the growing season because microbial metabolism slows at lower temperatures, resulting in lower denitrification rates (Smith et al., 2006; Li et al., 2022).
Keeping those considerations in mind, rates and findings herein are comparable to those observed in other studies within the Mississippi River basin. For example, in two streams within the Upper Mississippi watershed in Wisconsin, denitrification rates ranged from 0 to 4,400 μmol N m−2 h−1 (0–1,489 mg m−2 day−1) and, as alluded to earlier, covaried positively with warmer seasons and nitrate concentrations (Smith et al., 2006). For sediment cores collected within the Atchafalaya Basin in the Mississippi River Delta in coastal Louisiana, denitrification rates in incubations were 68–276 μmol N m−2 h−1 (23–93 mg N m−2 day−1), with high NO3 enrichment of 100 μmol N (1.4 mg L−1; approximately double the concentrations of inflow waters herein; Li and Twilley, 2021). From riparian cores collected in western Mississippi, Speir et al. (2023) reported denitrification rates ranging from 2 to 5 mg N m−2 h−1 (48–120 mg N m−2 day−1).
While we narrowed the bounds for denitrification rates and consequently the N mitigation service for the Dogtooth Bend floodplain in this study, more work is needed to refine the landscape modeling approach of N mitigation, the quantification of the social value of nutrient mitigation services, and soil denitrification rates. In the case of landscape modeling, the range in N mitigation estimates could be reduced by incorporating soil information, mode of soil inundation (i.e., infiltration vs. exfiltration), and soil oxygen levels (i.e., anoxic vs. oxic). This is an area of ongoing research in our group. Incorporating the foregone N losses associated with runoff from crop cultivation and updating the social value of N mitigation prices for the Mississippi River valley would also be useful for refining our N mitigation value bounds. Improvements to refine soil denitrification rates are discussed in the following section.
4.5 Additional research needs for floodplain soil denitrification estimation
Previous studies attempting to upscale site-specific floodplain soil denitrification rates to the landscape level employed land use and soil characteristics to inform their efforts (i.e., soil texture, soil pH, and soil organic carbon content; Tschikof et al., 2022; Kaden et al., 2023), particularly as they relate geomorphic changes to the transport of phosphorus, carbon, and nitrogen (Noe et al., 2022). Floodplain soil denitrification rates presented in this study could be further refined by using these landscape characteristics as well as a broader range of temperatures to account for seasonal fluctuations in denitrification rates. In addition, further investigation of the effects of drying and wetting on nutrient dynamics (Venterink et al., 2002) and the response of the microbial community to inundation frequency (Tomasek et al., 2019) is warranted. More scrutiny of alternate metabolic pathways (like DNRA, anammox, SBNR, and incomplete denitrification) would include measuring all nitrogenous intermediates and using isotopic tracers, gene abundances, and enhanced molecular markers and may yield greater insight into the magnitude each process plays in cycling N within the system. These insights paired with the novel incubation method used here could reveal the importance of each process across different soil types and hydrologic conditions. Future work will include a coupled hydraulic and groundwater model to better delineate areas substantially inundated by hyporheic waters. This model will refine spatial estimates for direct valuation of intermittent flooding vs. crop production areas across Dogtooth Bend, ultimately producing the most accurate measure and quantifying the social value of nitrogen cycling in floodplains at the scale appropriate for management and policy decisions.
5 Conclusion
We set out three research objectives to help us constrain the floodplain soil denitrification mitigation potential for the river-connected Dogtooth Bend floodplain. Our first objective was to assess how denitrification changes when soils are subject to overland flooding of oxic surface vs. sometimes anoxic hyporheic waters. When we averaged our results across all soil types, denitrification rates followed a linear anoxic-injection hierarchy of anoxic deep > anoxic surface > oxic deep > oxic surface treatments.
In this study, the minimal (oxic conditions) and maximal (anoxic conditions) gross denitrification rates ranged from 101 to 592 mg N/m2/day. These were sharply curtailed by concomitant nitrification that replaced approximately 62% of N such that minimal (oxic conditions) and maximal (anoxic conditions) net denitrification rates ranged from 31 to 175 mg N/m2/day. Denitrification was mostly affected by soil characteristics that altered the movement of water, oxygen, and NO3-N delivery through our soil cores, but more research is needed to separate the biotic and abiotic dynamics that govern PO4 and trace nutrient availability, as well as redox conditions.
We bound the floodplain soil denitrification potential, by using the minimum and maximum net denitrification rates in combination with daily inundation exceedance probabilities for the 140 km2 of river-connected floodplain at Dogtooth Bend to be between 70 and 395 tons/yr of N potentially removed from floodwaters. We estimate the social value of N mitigation to potentially be between US$156 and US$4,106 ha/yr. Net profit estimates for agricultural production of crops are US$88 ha/yr for corn and US$79 ha/yr for soybeans. These results suggest the social value of the floodplain soil N mitigation service is within the same range as gross revenues generated by growing commodity crops (corn and soybean) and exceeds agricultural profits for these crops. While more work should be undertaken to confirm and refine our estimates of both floodplain soil N mitigation and the associated valuations of this service, this information provides insights into making floodplain land-use decisions and justifying payments for floodplain conservation easements.
Statements
Data availability statement
The raw data supporting the conclusions of this article will be made available by the authors, without undue reservation.
Author contributions
SS: Conceptualization, Formal analysis, Investigation, Methodology, Visualization, Writing – original draft, Writing – review & editing. MB: Conceptualization, Data curation, Formal analysis, Funding acquisition, Investigation, Methodology, Resources, Software, Supervision, Visualization, Writing – original draft, Writing – review & editing. JR: Conceptualization, Data curation, Formal analysis, Funding acquisition, Investigation, Methodology, Project administration, Resources, Software, Validation, Visualization, Writing – original draft, Writing – review & editing. SH-B: Conceptualization, Funding acquisition, Methodology, Visualization, Writing – review & editing, Investigation, Resources.
Funding
The author(s) declare that financial support was received for the research and/or publication of this article. Funding to JR, MB, and SH-B was provided by a grant from American Rivers grant from American Rivers (#AR-CE21GOS373) as well as a grant and an amendment from The Nature Conservancy (#G21-034-CON-P; #G21-034-CON-P).
Acknowledgments
Our thanks to Elyse Dilks, Kathryn Hajny, and Madison Johnson for their dedicated work as laboratory and field assistants. This manuscript benefitted from thoughtful conversations with Jim Lovvorn and Joseph Krienert.
Conflict of interest
The authors declare that the research was conducted in the absence of any commercial or financial relationships that could be construed as a potential conflict of interest.
Generative AI statement
The author(s) declare that no Gen AI was used in the creation of this manuscript.
Publisher’s note
All claims expressed in this article are solely those of the authors and do not necessarily represent those of their affiliated organizations, or those of the publisher, the editors and the reviewers. Any product that may be evaluated in this article, or claim that may be made by its manufacturer, is not guaranteed or endorsed by the publisher.
Supplementary material
The Supplementary Material for this article can be found online at: https://www.frontiersin.org/articles/10.3389/ffwsc.2025.1577009/full#supplementary-material
References
1
Almaraz M. Wong M. Y. Yang W. H. (2020). Looking back to look ahead: a vision for soil denitrification research. Ecology101:e02917. 10.1002/ecy.2917
2
Anderson M. Gorley R. N. Clarke R. K. (2008). PERMANOVA+ for PRIMER: Guide to Software and Statistical Methods. Plymouth, UK: Primer-E Limited.
3
Anderson M. J. Ford R. B. Feary D. A. Honeywill C. (2004). Quantitative measures of sedimentation in an estuarine system and its relationship with intertidal soft-sediment infauna. Mar. Ecol. Prog. Ser.272, 33–48. 10.3354/meps272033
4
Anderson M. J. Robinson J. (2003). Generalized discriminant analysis based on distances. Austr. New Zeal. J. Stat.45, 301–318. 10.1111/1467-842X.00285
5
Anderson M. J. Ter Braak C. J. F. (2003). Permutation tests for multi-factorial analysis of variance. J. Stat. Comput. Simul.73, 85–113. 10.1080/00949650215733
6
Anderson M. J. Walsh D. C. I. (2013). PERMANOVA, ANOSIM, and the Mantel test in the face of heterogeneous dispersions: what null hypothesis are you testing?Ecol. Monogr.83, 557–574. 10.1890/12-2010.1
7
APHA (2017). Standard Methods for the Examination of Water and Wastewater.New York: American Public Health Association, 23rd Edition.
8
Bernot M. J. Dodds W. K. Gardner W. S. McCarthy M. J. Sobolev D. Tank J. L. (2003). Comparing denitrification estimates for a texas estuary by using acetylene inhibition and membrane inlet mass spectrometry. Appl. Environ. Microbiol.69, 5950–5956. 10.1128/AEM.69.10.5950-5956.2003
9
Breitburg D. Levin L. A. Oschlies A. Grégoire M. Chavez F. P. Conley D. J. et al . (2018). Declining oxygen in the global ocean and coastal waters. Science359:eaam7240. 10.1126/science.aam7240
10
Casey T. Wentzel M. Ekama G. (1995). “Filamentous organism bulking in nutrient removal activated sludge systems: Paper 1: A historical overview of causes and control,” in Water South Afrrica (Water Research Commission).
11
Cheng Y. Elrys A. S. Merwad A.-R. M. Zhang H. Chen Z. Zhang J. et al . (2022). Global patterns and drivers of soil dissimilatory nitrate reduction to ammonium. Environ. Sci. Technol.56, 3791–3800. 10.1021/acs.est.1c07997
12
Cleveland C. C. Liptzin D. (2007). C: N: P stoichiometry in soil: is there a “Redfield ratio” for the microbial biomass?Biogeochemistry85, 235–252. 10.1007/s10533-007-9132-0
13
DeFlaun M. F. Mayer L. M. (1983). Relationships between bacteria and grain surfaces in intertidal sediments 1. Limnol. Oceanogr.28, 873–881. 10.4319/lo.1983.28.5.0873
14
Degenhardt O. S. Waters B. Rebelo-Cameirao A. Meyer A. Brunner H. Toltl N. P. (2004). Comparison of the effectiveness of various deaeration techniques. Dissolut. Technol.11, 6–12. 10.14227/DT110104P6
15
Dewitz J. U. S. Geological Survey (2021). “National land cover database (NLCD) 2019 products,” in US Geological Survey data release.
16
Diaz R. J. Rosenberg R. (2008). Spreading dead zones and consequences for marine ecosystems. Science321, 926–929. 10.1126/science.1156401
17
Eros T. Bányai Z. (2020). Sparing and sharing land for maintaining the multifunctionality of large floodplain rivers. Sci. Total Environ.728:138441. 10.1016/j.scitotenv.2020.138441
18
Evans J. L. Murdock J. N. Taylor J. M. Lizotte R. E. (2021). Sediment nutrient flux rates in a shallow, Turbid lake are more dependent on water quality than lake depth. Water13:18. 10.3390/w13101344
19
Gachter R. Meyer J. S. (1993). The role of microorganisms in mobilization and fixation of phosphorus in sediments. Hydrobiologia253, 103–121. 10.1007/BF00050731
20
Gaines R. A. Sanborn S. C. McAnally Jr W. H. Wallen C. M. (2021). Mississippi River Adaptive Hydraulics model development and evaluation, commerce to New Madrid, Missouri, reach. Mississippi River Geomorphology and Potamology Program Report No. 35. U.S. Army Engineer Mississippi Valley Division, Vicksburg, MS. 10.21079/11681/39519
21
Goh K. Spurlock F. Ganapathy C. Dietrich H. (2009). “Procedure for determining soil particle size using the hydrometer method,” in Standard Operating Procedure, METH004. 00 (California Department of Pesticide Regulation, Environmental Monitoring Branch).
22
Gordon B. A. Dorothy O. Lenhart C. F. (2020). Nutrient retention in ecologically functional floodplains: a review. Water12:2762. 10.3390/w12102762
23
Groffman P. M. Altabet M. A. Bohlke J. K. Butterbach-Bahl K. David M. B. Firestone M. K. et al . (2006). Methods for measuring denitrification: diverse approaches to a difficult problem. Ecol. Appl.16, 2091–2122. 10.1890/1051-0761(2006)016[2091:MFMDDA]2.0.CO;2
24
Groffman P. M. Tiedje J. M. (1988). Denitrification hysteresis during wetting and drying cycles in soil. Soil Sci. Soc. Am. J.52, 1626–1629. 10.2136/sssaj1988.03615995005200060022x
25
Grossman R. Reinsch T. (2002). 2.1 Bulk density and linear extensibility. Methods Soil Anal.5, 201–228. 10.2136/sssabookser5.4.c9
26
Guida R. J. Remo J. W. Secchi S. (2016a). Applying geospatial tools to assess the agricultural value of Lower Illinois River floodplain levee districts. Appl. Geograp.74, 123–135. 10.1016/j.apgeog.2016.07.002
27
Guida R. J. Remo J. W. Secchi S. (2016b). Tradeoffs of strategically reconnecting rivers to their floodplains: the case of the Lower Illinois River (USA). Sci. Total Environ.572, 43–55. 10.1016/j.scitotenv.2016.07.190
28
Hallberg L. Hallin S. Djodjic F. Bieroza M. (2024). Trade-offs between nitrogen and phosphorus removal with floodplain remediation in agricultural streams. Water Res.258:121770. 10.1016/j.watres.2024.121770
29
Hamme R. C. Emerson S. R. (2004). The solubility of neon, nitrogen and argon in distilled water and seawater. Deep-Sea Res. Part I-Oceanogr. Res. Papers51, 1517–1528. 10.1016/j.dsr.2004.06.009
30
Harvey J. Gomez-Velez J. Schmadel N. Scott D. Boyer E. Alexander R. et al . (2019). How hydrologic connectivity regulates water quality in river corridors. JAWRA55, 369–381. 10.1111/1752-1688.12691
31
Haynes W. M. (2016). CRC Handbook of Chemistry and Physics.London: CRC press. 10.1201/9781315380476
32
Hinshaw S. E. Zhang T. P. Harrison J. A. Dahlgren R. A. (2020). Excess N2 and denitrification in hyporheic porewaters and groundwaters of the San Joaquin River, California. Water Res.168:12. 10.1016/j.watres.2019.115161
33
Hoagland B. Schmidt C. Russo T. A. Adams R. Kaye J. (2019). Controls on nitrogen transformation rates on restored floodplains along the Cosumnes River, California. Sci. Total Environ.649, 979–994. 10.1016/j.scitotenv.2018.08.379
34
Hope A. C. (1968). A simplified Monte Carlo significance test procedure. J. R. Stat. Soc.30, 582–598. 10.1111/j.2517-6161.1968.tb00759.x
35
Houser J. N. e Bouska K. L. De Jager N. R. Ickes B. S. Jankowski K. J. et al . (2022). Ecological status and trends of the upper Mississippi and Illinois Rivers (ver. 1.1, July 2022): U.S. Geological Survey Open-File Report 2022–1039. US Department of the Interior, US Geological Survey. 10.3133/ofr20221039
36
Hurst N. White J. R. Baustian J. (2016). Nitrate reduction in a hydrologically restored bottomland hardwood forest in the Mississippi River Watershed, Northern Louisiana. Soil Sci. Soc. Am. J.80, 1698–1705. 10.2136/sssaj2016.08.0250
37
Jackson R. Thompson J. Kolka R. (2014). ”Wetland soils, hydrology, and geomorphology, Chapter 2,“ in Ecology of Freshwater and Estuarine Wetlands, eds. BatzerD.SharitzR. (Berkeley: University of California Press), 23–60. 10.1525/9780520959118-004
38
Jenkins W. A. Murray B. C. Kramer R. A. Faulkner S. P. (2010). Valuing ecosystem services from wetlands restoration in the Mississippi Alluvial Valley. Ecol. Econ.69, 1051–1061. 10.1016/j.ecolecon.2009.11.022
39
Jianlong W. Ning Y. (2004). Partial nitrification under limited dissolved oxygen conditions. Process Biochem.39, 1223–1229. 10.1016/S0032-9592(03)00249-8
40
Junk W. J. Bayley P. B. Sparks R. E. (1989). ”The flood pulse concept in river-floodplain systems,“ in Canadian Special Publication of Fish and Aquatic Science.
41
Kaden U. S. Fuchs E. Geyer S. Hein T. Horchler P. Rupp H. et al . (2021). Soil characteristics and hydromorphological patterns control denitrification at the floodplain scale. Front. Earth Sci.9:708707. 10.3389/feart.2021.708707
42
Kaden U. S. Schulz-Zunkel C. Fuchs E. Horchler P. Kasperidus H. D. Bonilha O. et al . (2023). Improving an existing proxy-based approach for floodplain denitrification assessment to facilitate decision making on restoration. Sci. Total Environ.892:164727. 10.1016/j.scitotenv.2023.164727
43
Kana T. M. Darkangelo C. Hunt M. D. Oldham J. B. Bennett G. E. Cornwell J. C. (1994). Membrane inlet mass-spectormeter for rapid high-precision determination of N-2, O-2, and Ar in environmental water samples. Anal. Chem.66, 4166–4170. 10.1021/ac00095a009
44
Kana T. M. Sullivan M. B. Cornwell J. C. Groszkowski K. M. (1998). Denitrification in estuarine sediments determined by membrane inlet mass spectrometry. Limnol. Oceanogr.43, 334–339. 10.4319/lo.1998.43.2.0334
45
Kelly M. C. (2020). Package ‘mimsy'. Calculate MIMS Dissolved Gas Concentrations Without Getting a Headache. R package version 0.6.2. Available online at: https://CRAN.R-project.org/package=mimsy (Accessed October 8, 2022). 10.32614/CRAN.package.mimsy
46
Kholdebarin B. Oertli J. (1977). Effect of pH and ammonia on the rate of nitrification of surface water. Journal57, 1688–1692.
47
Knox R. L. Wohl E. E. Morrison R. R. (2022). Levees don't protect, they disconnect: a critical review of how artificial levees impact floodplain functions. Sci. Total Environ.837:155773. 10.1016/j.scitotenv.2022.155773
48
Kok S. Le Clec'h S. Penning W. E. Buijse A. D. Hein L. (2025). Trade-offs in ecosystem services under various river management strategies of the Rhine Branches. Ecosyst. Serv.72:101692. 10.1016/j.ecoser.2024.101692
49
Kraft N. J. B. Comita L. S. Chase J. M. Sanders N. J. Swenson N. G. Crist T. O. et al . (2011). Disentangling the drivers of beta diversity along latitudinal and elevational gradients. Science333, 1755–1758. 10.1126/science.1208584
50
Kreiling R. M. Richardson W. B. Cavanaugh J. C. Bartsch L. A. (2011). Summer nitrate uptake and denitrification in an upper Mississippi River backwater lake: the role of rooted aquatic vegetation. Biogeochemistry104, 309–324. 10.1007/s10533-010-9503-9
51
Lazar J. G. Addy K. Gold A. J. Groffman P. M. McKinney R. A. Kellogg D. Q. (2015). Beaver ponds: resurgent nitrogen sinks for rural watersheds in the Northeastern United States. J. Environ. Qual.44, 1684–1693. 10.2134/jeq2014.12.0540
52
Li S. Twilley R. R. (2021). Nitrogen dynamics of inundated sediments in an emerging coastal deltaic floodplain in mississippi river delta using isotope pairing technique to test response to nitrate enrichment and sediment organic matter. Estuar. Coasts44, 1899–1915. 10.1007/s12237-021-00913-6
53
Li S. Twilley R. R. Hou A. X. (2021). Heterotrophic nitrogen fixation in response to nitrate loading and sediment organic matter in an emerging coastal deltaic floodplain within the Mississippi River Delta plain. Limnol. Oceanogr.66, 1961–1978. 10.1002/lno.11737
54
Li Z. Tang Z. Song Z. Chen W. Tian D. Tang S. et al . (2022). Variations and controlling factors of soil denitrification rate. Global Change Biol.28, 2133–2145. 10.1111/gcb.16066
55
Liu Y. Evans M. A. Scavia D. (2010). Gulf of Mexico hypoxia: exploring increasing sensitivity to nitrogen loads. Environ. Sci. Technol.44, 5836–5841. 10.1021/es903521n
56
Mantel N. (1967). The detection of disease clustering and a generalized regression approach. Cancer Res.27, 209–220.
57
Marshack J. (2016). A compilation of water quality goals 17th edition. State Water Resources Control Board, California Environmental Protection Agency, www.waterboards.ca.gov › programs › docs › wq_goals_text.
58
Murray B. Jenkins A. Kramer R. Faulkner S. P. (2009). Valuing Ecosystem Services from Wetlands: Restoration in the Mississippi Alluvial Valley Report No. 09-02. Duke University Nicholas Institute for Environmental Policy Solutions. Available online at: https://nicholasinstitute.duke.edu/sites/default/files/publications/valuing-ecosystem-services-from-wetlands-restoration-in-the-mississippi-alluvial-valley-paper.pdf (Accessed 30 May 2024).
59
NOAA (2022). What is a dead zone? National Ocean Service website. Available online at: https://oceanservice.noaa.gov/facts/eutrophication.html (Accessed April 2, 2023).
60
Noe G. B. Hopkins K. G. Claggett P. R. Schenk E. R. Metes M. J. Ahmed L. et al . (2022). Streambank and floodplain geomorphic change and contribution to watershed material budgets. Environ. Res. Lett.17:064015. 10.1088/1748-9326/ac6e47
61
Noe G. B. Hupp C. R. Rybicki N. B. (2013). Hydrogeomorphology influences soil nitrogen and phosphorus mineralization in floodplain wetlands. Ecosystems16, 75–94. 10.1007/s10021-012-9597-0
62
Olson K. R. Speidel D. R. (2020). Why does the repaired len small levee, Alexander county, Illinois, US continue to breach during major flooding events?Open J. Soil Sci.10, 16–43. 10.4236/ojss.2020.101002
63
Opperman J. J. Galloway G. E. Fargione J. Mount J. F. Richter B. D. Secchi S. (2009). Sustainable floodplains through large-scale reconnection to rivers. Science326, 1487–1488. 10.1126/science.1178256
64
Philips S. Laanbroek H. J. Verstraete W. (2002). Origin, causes and effects of increased nitrite concentrations in aquatic environments. Rev. Environ. Sci. Biotechnol.1, 115–141. 10.1023/A:1020892826575
65
Pinay G. Gumiero B. Tabacchi E. Gimenez O. Tabacchi-Planty A. M. Hefting M. M. et al . (2007). Patterns of denitrification rates in European alluvial soils under various hydrological regimes. Freshwat. Biol.52, 252–266. 10.1111/j.1365-2427.2006.01680.x
66
Poff N. L. Allan J. D. Bain M. B. Karr J. R. Prestegaard K. L. Richter B. D. et al . (1997). The natural flow regime. Bioscience47, 769–784. 10.2307/1313099
67
R Core Team (2021). R: A Language and Environment for Statistical Computing, Ver. 4.1.1 ”Kick Things“. R Foundation for Statistical Computing, Vienna, Austria.
68
Rabalais N. N. Turner R. E. Scavia D. (2002). Beyond science into policy: Gulf of Mexico hypoxia and the Mississippi River. Bioscience52, 129–142. 10.1641/0006-3568(2002)052[0129:BSIPGO]2.0.CO;2
69
Reisinger A. J. Tank J. L. Hoellein T. J. Hall R. O. (2016). Sediment, water column, and open-channel denitrification in rivers measured using membrane-inlet mass spectrometry. J. Geophys. Res. Biogeosci.121, 1258–1274. 10.1002/2015JG003261
70
Remo J. Guida R. Secchi S. (2016). Screening the suitability of levee protected areas for strategic floodplain reconnection along the LaGrange segment of the Illinois River, USA. River Res. Appl.33, 863–878. 10.1002/rra.3055
71
Remo J. W. Giri T. L. (2024). Assessing geomorphic and hydraulic changes related to an unplanned reconnection of the middle Mississippi River and its floodplain near Miller City, Illinois, USA. Geomorphology449:109062. 10.1016/j.geomorph.2024.109062
72
Ribaudo M. O. Heimlich R. Peters M. (2005). Nitrogen sources and Gulf hypoxia: potential for environmental credit trading. Ecol. Econ.52, 159–168. 10.1016/j.ecolecon.2004.07.021
73
Richardson W. B. Bartsch L. A. Bartsch M. R. Kiesling R. Lafrancois B. M. (2019). Nitrogen cycling in large temperate floodplain rivers of contrasting nutrient regimes and management. River Res. Appl.35, 529–539. 10.1002/rra.3267
74
Richardson W. B. Strauss E. A. Bartsch L. A. Monroe E. M. Cavanaugh J. C. Vingum L. et al . (2004). Denitrification in the Upper Mississippi River: rates, controls, and contribution to nitrate flux. Can. J. Fish. Aquat. Sci.61, 1102–1112. 10.1139/f04-062
75
RStudio Team (2020). RStudio: Integrated Development for R. Boston, MA: RStudio, PBC. Available online at: http://www.rstudio.com/ (Accessed August 22, 2023).
76
Schnitkey G. Paulson N. (2024). Illinois Farm Management Handbook: Revenue and Costs for Illinois Grain Crops. Available online at: https://farmdoc.illinois.edu/handbook/historic-corn-soybeans-wheat-and-double-crop-soybeans (Accessed April 1, 2024).
77
Serra-Llobet A. Jähnig S. C. Geist J. Kondolf G. M. Damm C. Scholz M. et al . (2022). Restoring rivers and floodplains for habitat and flood risk reduction: experiences in multi-benefit floodplain management from California and Germany. Front. Environ. Sci.9:778568. 10.3389/fenvs.2021.778568
78
Shadie C. E. Lopez-Llompart P. Samet M. Strole T. Kondolf G. M. Mathias Kondolf G. (2018). ”Managing floods in large river basins in the USA: The Mississippi River,“ in Managing Flood Risk: Innovative Approaches from Big Floodplain Rivers and Urban Streams, eds. Serra-LlobetA.KondolfG.M.SchaeferK.NicholsonS. (Cham: Springer), 11–41. 10.1007/978-3-319-71673-2_2
79
Smith L. K. Voytek M. A. Bohlke J. K. Harvey J. W. (2006). Denitrification in nitrate-rich streams: application of N-2 : Ar and N-15-tracer methods in intact cores. Ecol. Appl.16, 2191–2207. 10.1890/1051-0761(2006)016[2191:DINSAO]2.0.CO;2
80
Sobota D. J. Compton J. E. McCrackin M. L. Singh S. (2015). Cost of reactive nitrogen release from human activities to the environment in the United States. Environ. Res. Lett.10:025006. 10.1088/1748-9326/10/2/025006
81
Sparks R. Ahn C. Demissie M. Isserman A. Johnston D. Lian Y. et al . (2005). Linking hydrodynamics, conservation biology, and economics in choosing naturalization alternatives for the Illinois River, USA. Arch. Hydrobiol. Suppl.155, 521–538. 10.1127/lr/15/2003/521
82
Speir S. L. Tank J. L. Taylor J. M. Grose A. L. (2023). Temperature and carbon availability interact to enhance nitrous oxide production via denitrification in alluvial plain river sediments. Biogeochemistry165, 191–203. 10.1007/s10533-023-01074-3
83
Stackpoole S. Sabo R. Falcone J. Sprague L. (2021). Long-term Mississippi River trends expose shifts in the river load response to watershed nutrient balances between 1975 and 2017. Water Resour. Res.57:e2021WR030318. 10.1029/2021WR030318
84
Stenstrom M. K. Poduska R. A. (1980). The effect of dissolved oxygen concentration on nitrification. Water Res.14, 643–649. 10.1016/0043-1354(80)90122-0
85
Strauss E. A. Richardson W. B. Bartsch L. A. Cavanaugh J. C. Bruesewitz D. A. Imker H. et al . (2004). Nitrification in the Upper Mississippi River: patterns, controls, and contribution to the NO3– budget. J. N. Am. Benthol. Soc.23, 1–14. 10.1899/0887-3593(2004)023<0001:NITUMR>2.0.CO;2
86
Strobel H. (2009). ”Chapter 16. Basic laboratory culture methods for anaerobic bacteria,“ in Methods in Molecular Biology (Clifton, NJ), 247–261. 10.1007/978-1-60761-214-8_16
87
Theriot J. M. Conkle J. L. Pezeshki S. R. DeLaune R. D. White J. R. (2013). Will hydrologic restoration of Mississippi River riparian wetlands improve their critical biogeochemical functions?Ecol. Eng.60, 192–198. 10.1016/j.ecoleng.2013.07.021
88
Tomasek A. A. Hondzo M. Kozarek J. L. Staley C. Wang P. Lurndahl N. et al . (2019). Intermittent flooding of organic-rich soil promotes the formation of denitrification hot moments and hot spots. Ecosphere10:e02549. 10.1002/ecs2.2549
89
Tschikof M. Gericke A. Venohr M. Weigelhofer G. Bondar-Kunze E. Kaden U. S. et al . (2022). The potential of large floodplains to remove nitrate in river basins - The Danube case. Sci. Total Environ.843:156879. 10.1016/j.scitotenv.2022.156879
90
Tullos D. (2018). How to achieve better flood-risk governance in the United States. Proc. Nat. Acad. Sci.115, 3731–3734. 10.1073/pnas.1722412115
91
Upreti K. Rivera-Monroy V. H. Maiti K. Giblin A. Geaghan J. P. (2021). Emerging wetlands from river diversions can sustain high denitrification rates in a coastal delta. J. Geophys. Res.126:e2020JG006217. 10.1029/2020JG006217
92
USACE (2022). U.S. Army Corps of Engineers. Information paper: Mississippi River between Ohio and Missouri Rivers (Regulated Works) Dogtooth Bend (Len Small). Available online at: https://www.mvs.usace.army.mil/Portals/54/docs/pm/2021infopapers/Information%20Paper-Len%20Small.pdf?ver=oHq5xdepnnv0XsAk32Zj0Q%3D%3D (Accessed 24 November 2023).
93
U. S. Bureau of Labor Statistics (2024). U.S. Department of Labor–Bureau of Labor Statistics (BLS), CPI Inflation Calculator. Available at: Available online at: http://data.bls.gov/cgi-bin/cpicalc.pl (Accessed May 15, 2024).
94
USDA (2006). U.S. Department of Agriculture (USDA). Natural Resources Conservation Service (NRCS), Soil Survey Geographic (SSURGO) Database for Illinois. Available online at: https://ncsslabdatamart.sc.egov.usda.gov/database_download.aspx (Accessed May 3, 2025).
95
USDA (2019). U.S. Department of Agriculture (USDA), Natural Resource Conservation Service, Emergency Watershed Protection Program - Floodplain Easement (EWPP-FPE) Option Factsheet. Available online at: https://www.nrcs.usda.gov/sites/default/files/2022-09/EWP-FPE%20Factsheet.pdf (Accessed September 22, 2024).
96
USDA (2024). U.S. Department of Agriculture. National Agricultural Statistics Service (NASS) Agricultural Chemical Use Database.Quickstats. Available online at: https://quickstats.nass.usda.gov (Accessed May 1, 2024).
97
USEPA (2009). National Recommended Water Quality Criteria - Aquatic Life Criteria Table. Available online at: https://www.epa.gov/wqc/national-recommended-water-quality-criteria-aquatic-life-criteria-table (Accessed 2023).
98
USEPA (2018). National Recommended Water Quality Criteria - Human Health Criteria Table, 1995-2018. Available online at: https://www.epa.gov/wqc/national-recommended-water-quality-criteria-human-health-criteria-table (Accessed 2023).
99
USGS (2024). United States Geological Survey. USGS surface-water data for the nation. Available online at: http://waterdata.usgs.gov/nwis/sw/ (Accessed May 15, 2024).
100
Van Cleemput O. Samater A. H. (1995). Nitrite in soils: accumulation and role in the formation of gaseous N compounds. Fertilizer Res.45, 81–89. 10.1007/BF00749884
101
Venterink H. O. Davidsson T. E. Kiehl K. Leonardson L. (2002). Impact of drying and re-wetting on N, P and K dynamics in a wetland soil. Plant Soil243, 119–130. 10.1023/A:1019993510737
102
Welti N. Bondar-Kunze E. Mair M. Bonin P. Wanek W. Pinay G. et al . (2012). Mimicking floodplain reconnection and disconnection using N-15 mesocosm incubations. Biogeosciences9, 4263–4278. 10.5194/bg-9-4263-2012
103
Wetzel R. G. (2001). Limnology: Lake and River Ecosystems.San Diego, CA: Academic Press.
104
Wild Jr H. E. Sawyer C. N. McMahon T. C. (1971). Factors affecting nitrification kinetics. Journal43, 1845–1854.
105
Wurtsbaugh W. A. Paerl H. W. Dodds W. K. (2019). Nutrients, eutrophication and harmful algal blooms along the freshwater to marine continuum. Water6:27. 10.1002/wat2.1373
Summary
Keywords
denitrification, floodplain wetlands, membrane inlet mass spectrometry (MIMS), novel soil incubation methods, nitrification
Citation
Samberg SS, Brooks ML, Remo JWF and Hamilton-Brehm SD (2025) Quantifying floodplain denitrification along the middle Mississippi River: novel incubation methods bound denitrification rates and landscape-scale nitrogen mitigation potential. Front. Freshw. Sci. 3:1577009. doi: 10.3389/ffwsc.2025.1577009
Received
14 February 2025
Accepted
12 June 2025
Published
14 July 2025
Volume
3 - 2025
Edited by
Leandro E. Miranda, US Geological Survey and Mississippi State University, United States
Reviewed by
Morten Lauge Fejerskov, Aalborg University, Denmark
Martin Tschikof, University of Natural Resources and Life Sciences Vienna, Austria
Updates
Copyright
© 2025 Samberg, Brooks, Remo and Hamilton-Brehm.
This is an open-access article distributed under the terms of the Creative Commons Attribution License (CC BY). The use, distribution or reproduction in other forums is permitted, provided the original author(s) and the copyright owner(s) are credited and that the original publication in this journal is cited, in accordance with accepted academic practice. No use, distribution or reproduction is permitted which does not comply with these terms.
*Correspondence: Marjorie L. Brooks mlbrooks@siu.edu
†Present address: Stony S. Samberg, Centre for Coastal Biogeochemistry, Southern Cross University, East Lismore, NSW, Australia
Disclaimer
All claims expressed in this article are solely those of the authors and do not necessarily represent those of their affiliated organizations, or those of the publisher, the editors and the reviewers. Any product that may be evaluated in this article or claim that may be made by its manufacturer is not guaranteed or endorsed by the publisher.