 Ashley Tuin
 Tabitha Diehl1†
 Taylor Billion
 Ali Bin Abdul Jabbar
- 1Creighton University School of Medicine, Omaha, NE, United States
- 2Department of Internal Medicine, Creighton University, Omaha, NE, United States
Background: Anemia carries the third highest years lived with disability, and yet the subset of hemolytic anemia is associated with higher rates of mortality and complication than other types of anemia. There is a lack of data studying the more encompassing subset of hemolytic anemia mortality at a population level.
Methods: In this study, we analyzed the temporal trends of demographic and geographical differences in hemolytic anemia-related mortality in the United States from 1999-2022. Data was extruded from the CDC Wide-Ranging Online Data for Epidemiologic Research (WONDER) database. Crude mortality rates, age-adjusted mortality rates (AAMR), annual percent change (APC), and average annual percent change (AAPC) were determined with 95% confidence intervals (CIs) using the Joinpoint Regression Program.
Results: From 1999-2022, there were 46,924 deaths due to hemolytic anemia. Mortality rates decreased significantly from 1999–2016 before increasing significantly from 2016-2022. Mortality rates were higher in males, Black or African American people, and urban areas. Interestingly, all groups showed a similar increase in mortality rates in recent years except for people aged 15–24 years who showed consistently decreasing mortality over the study period.
Conclusion: Hemolytic anemia-related mortality in the United States decreased overall between 1999 and 2022. While a decrease was seen between 1999 and 2016, an increase was seen starting from 2016, most prominently from 2019 to 2021 in most of the subgroups with males, African American and the south region having the worst AAMRs.
1 Introduction
Hemolytic anemia is defined as the destruction of red blood cells at a rate faster than what the body can produce (1). There are intrinsic and extrinsic causes of hemolytic anemia. Notable examples of hemolytic anemia include glucose-6-phosphate dehydrogenase deficiency, sickle cell disease, autoimmune hemolytic anemia, and hemolytic uremic syndrome, with the most prevalent hemolytic anemia being sickle cell disease (2). One large study showed that anemia carried the third highest years lived with disability (YLD), second only to low back pain and depressive disorders, demonstrating a significant burden (3). Further, patients with hemolytic anemia have an increased need for regular blood transfusions, which can lead to transfusion reactions, alloimmunization, and iron overload, in addition to the time commitment and financial resources required to maintain appropriate health (4).
There is a gap in the literature surrounding hemolytic anemia as a broader category of anemia, especially at a population level. When considering race, one study of sickle cell disease found no differences in mortality between Black people and White people (5). Studies have also shown that mortality rates are increasing in children and adults with sickle cell disease (5–7). Regional differences have shown sickle cell-related hospitalization and in-hospitalization deaths are highest in the South (7). When considering other hemolytic anemias, studies have shown an estimated mortality rate for autoimmune hemolytic anemia of 10% (8) and 12.5% for hemolytic uremic syndrome (9). Despite these findings, the lack of literature focused on all hemolytic anemias is apparent.
Our study utilizes the CDC WONDER database to describe trends in mortality related to hemolytic anemia based on gender, race, age, region, and urban versus rural populations in the United States from 1999 to 2022. Hemolytic anemia is associated with higher rates of complications and mortality than other types of anemia. Therefore, this study sheds light on relevant trends in hemolytic anemia that will support efforts in decreasing mortality in this patient population.
2 Methods
2.1 Dataset
The CDC Wide-ranging Online Data for Epidemiologic Research (WONDER) database was used to study mortality in the United States due to hemolytic anemia. The CDC WONDER database contains data collected from death certificates within ‘Multiple Cause of Death data set’. This data was used to examine hemolytic anemia-related mortality in the United States. Hemolytic anemia-related mortality was identified using ICD-10 codes D55-D59. This study was exempt from Institutional Review Board approval because CDC WONDER is a publicly available database with de-identified data.
Data was extracted regarding hemolytic anemia-related deaths from 1999 to 2020 by bridged race categories and from 2021–2022 by single race categories. Data was further classified based on the following groups: gender, race/ethnicity, age, urban-rural classification, and region. Notably, when classified by state, several states had limited data, therefore, this was excluded from analysis. We assessed mortality by gender (male or female) and race (including non-Hispanic (NH) White, NH Black, NH Asian/Pacific Islander, and Hispanic). American Indian or Alaska Native was excluded from analysis due to unreliable data. We assessed mortality by urban-rural classification and region, with urban defined as population ≥1 million and rural defined as population <50,000 based on the 2013 US census classification (10). Regions, defined by the US Census Bureau (11), included Northeast, Midwest, South, and West. Mortality was assessed by age (5-14, 15-24, 25-34, 35-44, 45-54, 55-64, 65-74, 75-84, and 85+). Ages < 1 and 1–4 were excluded due to unreliable data. Of note, the CDC WONDER database only includes data for urban-rural designation through the year 2020, as opposed to 2022 for all other data points.
2.2 Statistical analysis
Crude and age-adjusted mortality rates for hemolytic anemia were calculated. Age-adjusted mortality rates (AAMRs) were standardized to the 2000 United States population. The Joinpoint Regression Program was used to determine trends in mortality from 1999-2022 (12). Joinpoint regression uses the Monte Carlo permutation method to generate linear segments linking two data points, allowing for calculation of annual percent change (APC) and average annual percent change (AAPC) over the study period. APC and AAPCs that were considered statistically different from zero, as defined by a two-tailed t test, had either increasing or decreasing slopes describing the change in mortality over the time interval. Statistical significance was set at p ≤0.05. Asterisks were used to denote significance.
3 Results
3.1 Overall
From 1999 to 2022, there were 46,924 deaths due to hemolytic anemia in the United States.
During the study period, overall age-adjusted mortality rates (AAMR) decreased from 0.78 (95% CI 0.74-0.81) in 1999 to 0.59 (95% CI 0.58-0.62) in 2016 before increasing to 0.68 (95% CI 0.66-0.71) in 2022 with an overall average annual percent change (AAPC) of -0.56 (95% CI -0.92 to -0.17)* from 1999-2022 (Table 1, Figure 1). The annual percent change (APC) in AAMR was -3.32 (95% CI -8.52 to -1.70)* from 1999-2006, which then decelerated to -0.6 (95% CI -1.5 to 1)* from 2006–2016 before increasing to 2.78 (95% CI 1.48-6.13)* from 2016-2022 (Figure 2). The largest overall increase in mortality rates occurred between the years of 2019 and 2020 in which the AAMR increased from 0.63 (95% CI 0.61-0.66) to 0.69 (95% CI 0.66-0.71) respectively.
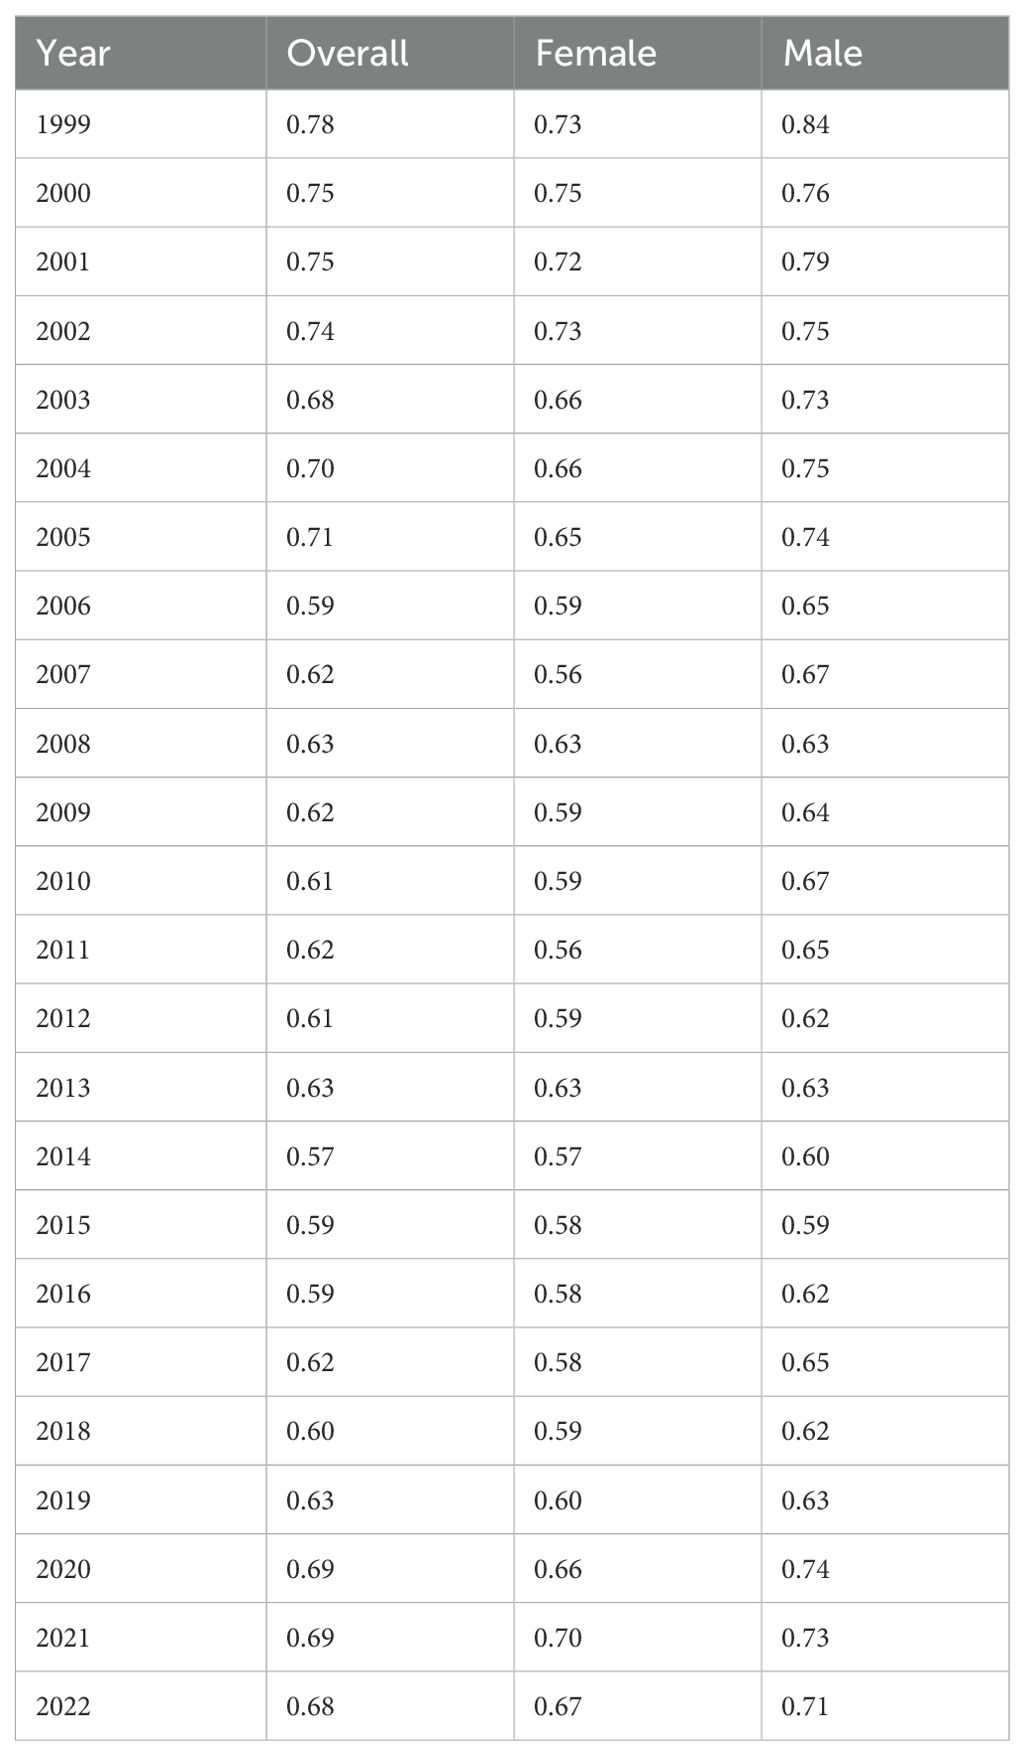
Table 1. Hemolytic anemia age-adjusted mortality rate per 100,000 people overall and stratified by gender, 1999-2022.
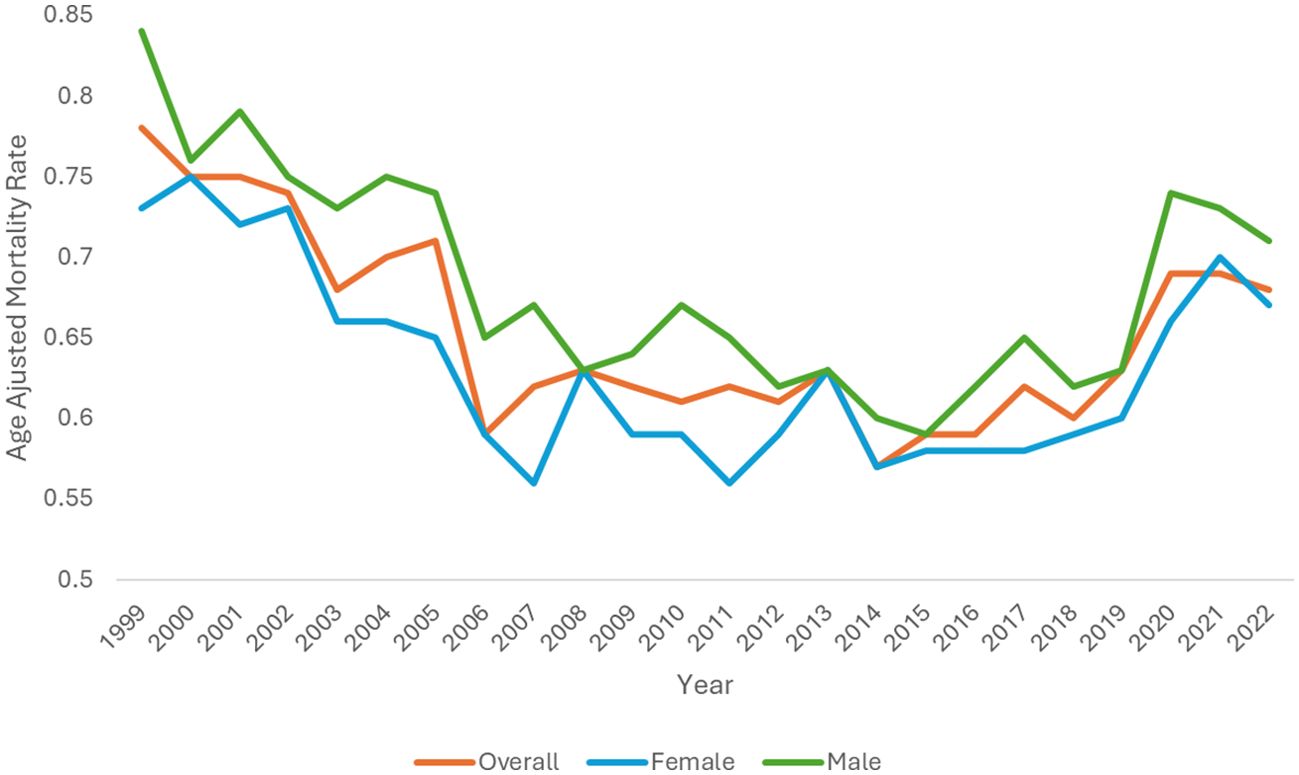
Figure 1. Hemolytic anemia age-adjusted mortality rate per 100,000 people overall and stratified by gender, 1999-2022.
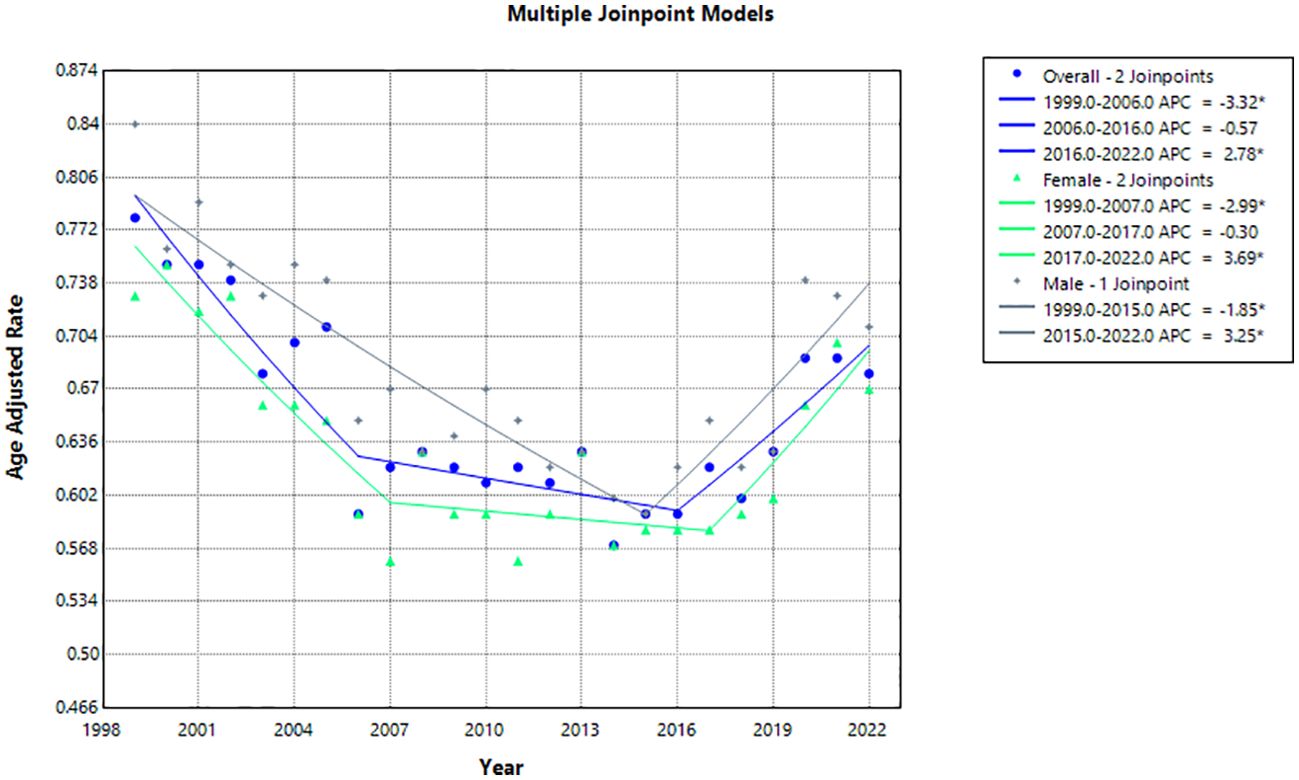
Figure 2. Joinpoint model of hemolytic anemia-related AAMR per 100,000 people overall and stratified by gender, 1999-2022 (*indicates the APC is statistically significant).
3.2 Demographic differences
3.2.1 Gender stratified
From 1999 to 2022, hemolytic anemia caused 22,107 (47%) deaths in males and 24,817 (53%) deaths in females in the United States.
The AAMR in males decreased from 0.84 (95% CI 0.79-0.90) in 1999 to 0.71 (95% CI 0.67-0.75) in 2022 with an AAPC of -0.32 (95% CI -0.71 to 0.08) (Table 1, Figure 1). The APC in AAMR was -1.85 (95% CI -2.64 to -1.22)* from 1999-2015, which then increased to 3.25 (95% CI 1.58-7.48)* from 2015-2022 (Figure 2).
The AAMR in females decreased from 0.73 (95% CI 0.68-0.77) in 1999 to 0.67 (95% CI 0.63-0.71) in 2022 with an AAPC of -0.40 (95% CI -0.78 to -0.05)* (Table 1, Figure 1). The APC in AAMR was -2.99 (95% CI -6.66 to -1.67)* from 1999 to 2007, which then decelerated to -0.30 (95% CI -2.26 to 1.49) from 2007 to 2017 before increasing to 3.70 (95% CI 1.21-9.31)* from 2017 to 2022 (Figure 2).
3.2.2 Race stratified
Black or African American people had the highest AAMR with 2.89 (95% CI 2.70-3.09) in 1999 and 2.85 (95% CI 2.69-3.02) in 2022 with an AAPC of 0.31 (95% CI -0.13 to 0.73) (Table 2, Figure 3). The APC was -0.90 (95% CI -1.99 to -0.32)* from 1999-2015, which increased to 3.14 (95% CI 1.41-7.99)* from 2015-2022 (Figure 4).
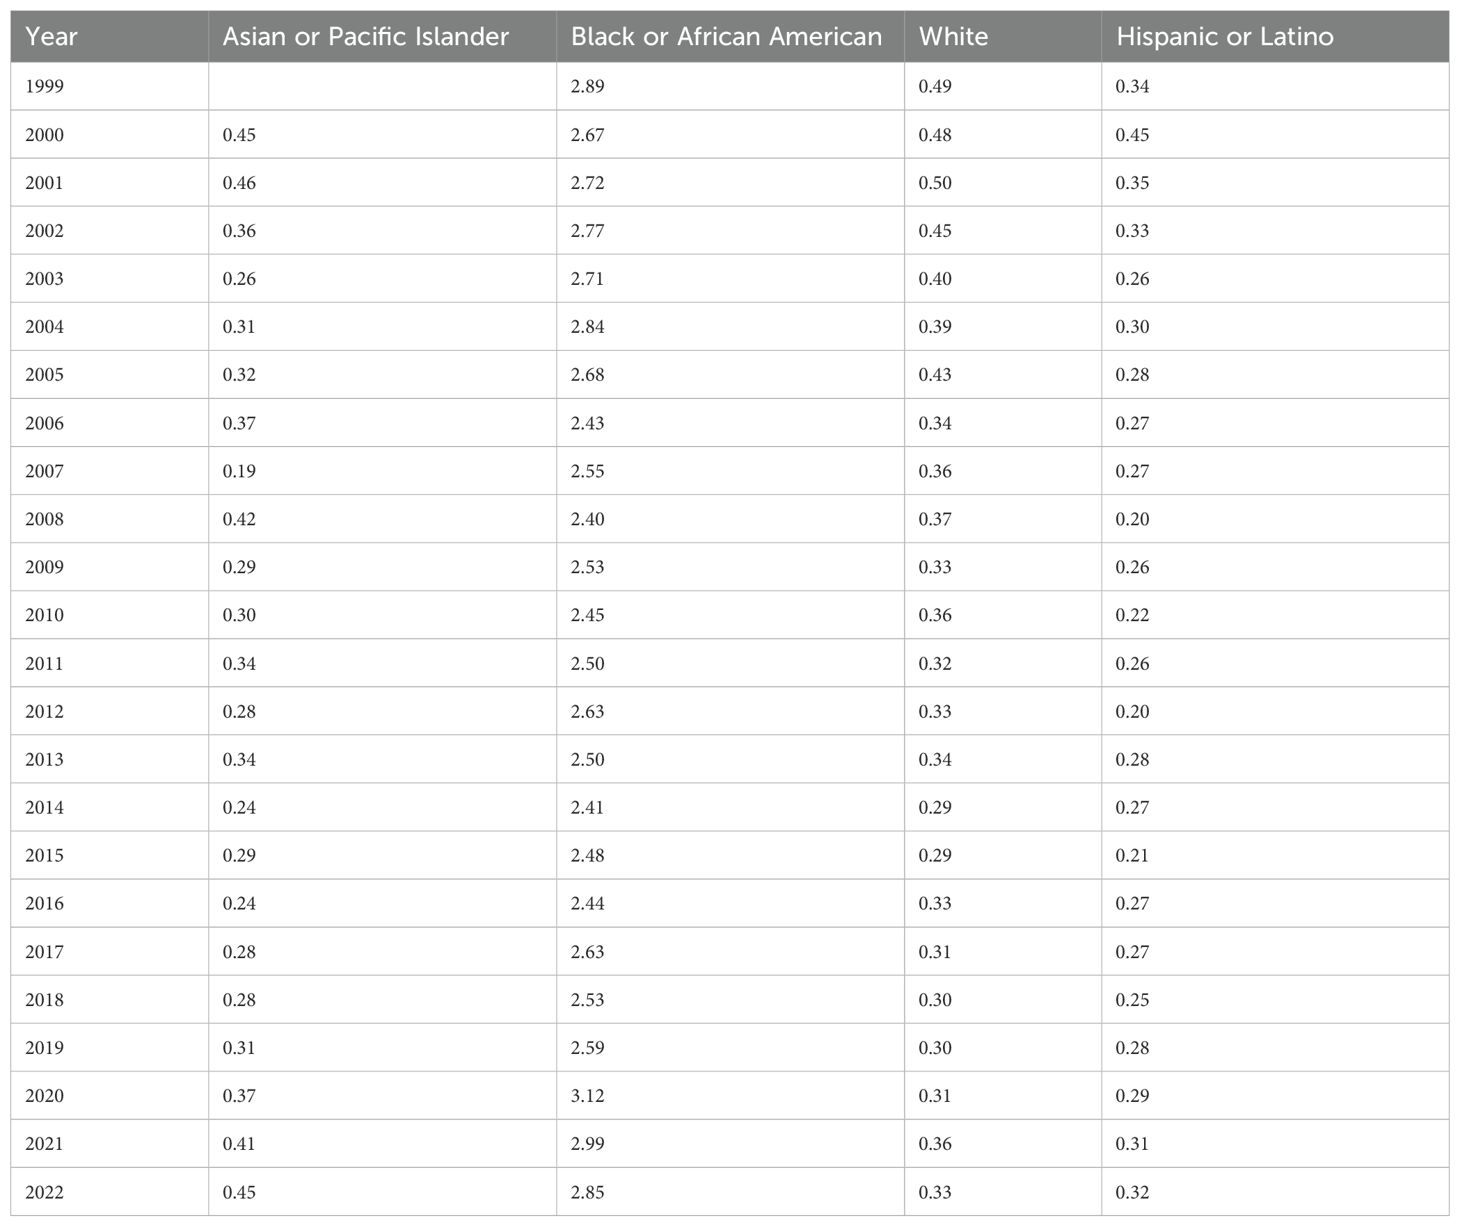
Table 2. Hemolytic anemia age-adjusted mortality rate per 100,000 people stratified by race, 1999-2022.
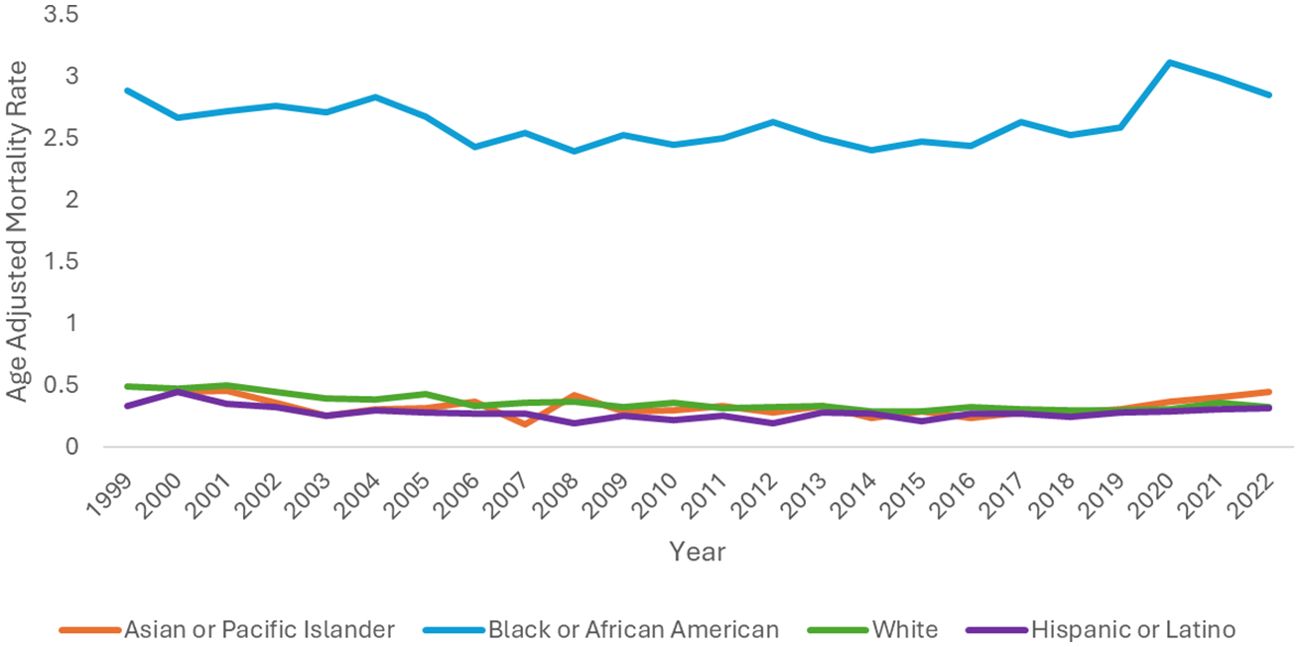
Figure 3. Hemolytic anemia age-adjusted mortality rate per 100,000 people stratified by race, 1999-2022.
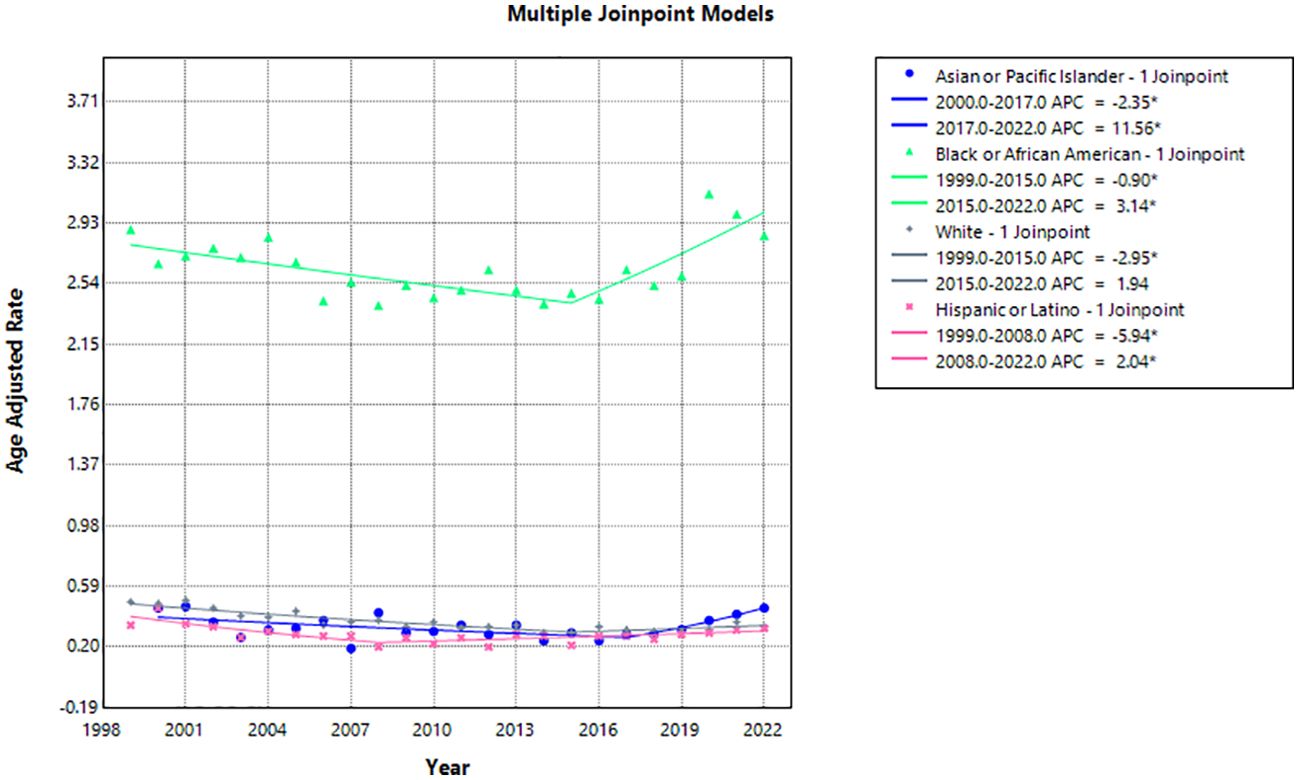
Figure 4. Joinpoint model of hemolytic anemia-related AAMR per 100,000 people stratified by race, 1999-2022 (*indicates the APC is statistically significant).
Hispanic or Latino people had the lowest AAMR with 0.34 (95% CI 0.25-0.46) in 1999 and 0.32 (95% CI 0.27-0.38) in 2022 with an AAPC of -1.16 (95% CI -2.08 to -0.06)* (Table 2, Figure 3). The APC was -5.94 (95% CI -14.29 to -2.56)* from 1999-2008, which increased to 2.04 (95% CI 0.65-5.21)* from 2008-2022 (Figure 4).
Asian or Pacific Islander had the largest change in APC, despite similar AAMR to White and Hispanic or Latino populations. The AAMR in Asian or Pacific Islander people remained the same at 0.45 in 2000 and 2022 (95% CI 0.29-0.66 in 2000, 95% CI 0.37-0.56 in 2022) with an AAPC of 0.65 (95% CI -0.68-1.98) (Table 2, Figure 3). The APC was -2.35 (95% CI -5.23 to -0.58)* from 2000-2017, which dramatically increased to 11.56 (95% CI 3.84-31.84)* from 2017-2022 (Figure 4).
White people had the most significant reduction in AAMR from 0.49 (95% CI 0.46-0.52) in 1999 to 0.33 (95% CI 0.31-0.35) in 2022 with an AAPC of -1.49 (95% CI -2.25 to -0.85)* (Table 2, Figure 3). The APC was -2.95 (95% CI -5.03 to -2.13)* from 1999-2015, which increased to 1.94 (95% CI -0.82 to 11.92) from 2015-2022 (Figure 4).
3.3 Age group stratified
Those 85 years and older had the highest overall crude mortality rate per 100,000 people, which decreased from 7.17 (95% CI 6.36 to 7.99) in 1999 to 4.76 (95% CI 4.23 to 5.3) in 2022, with a consistent AAPC of -1.17 (95% CI -2.0 to -0.55) over 24 years, and an APC of -2.4 (95% CI -4.61 to -1.68)* from 1999-2017, with an insignificant APC of 3.5 (95% CI -0.94 to 14.85) from 2017 to 2022 (Table 3, Figures 5, 6).
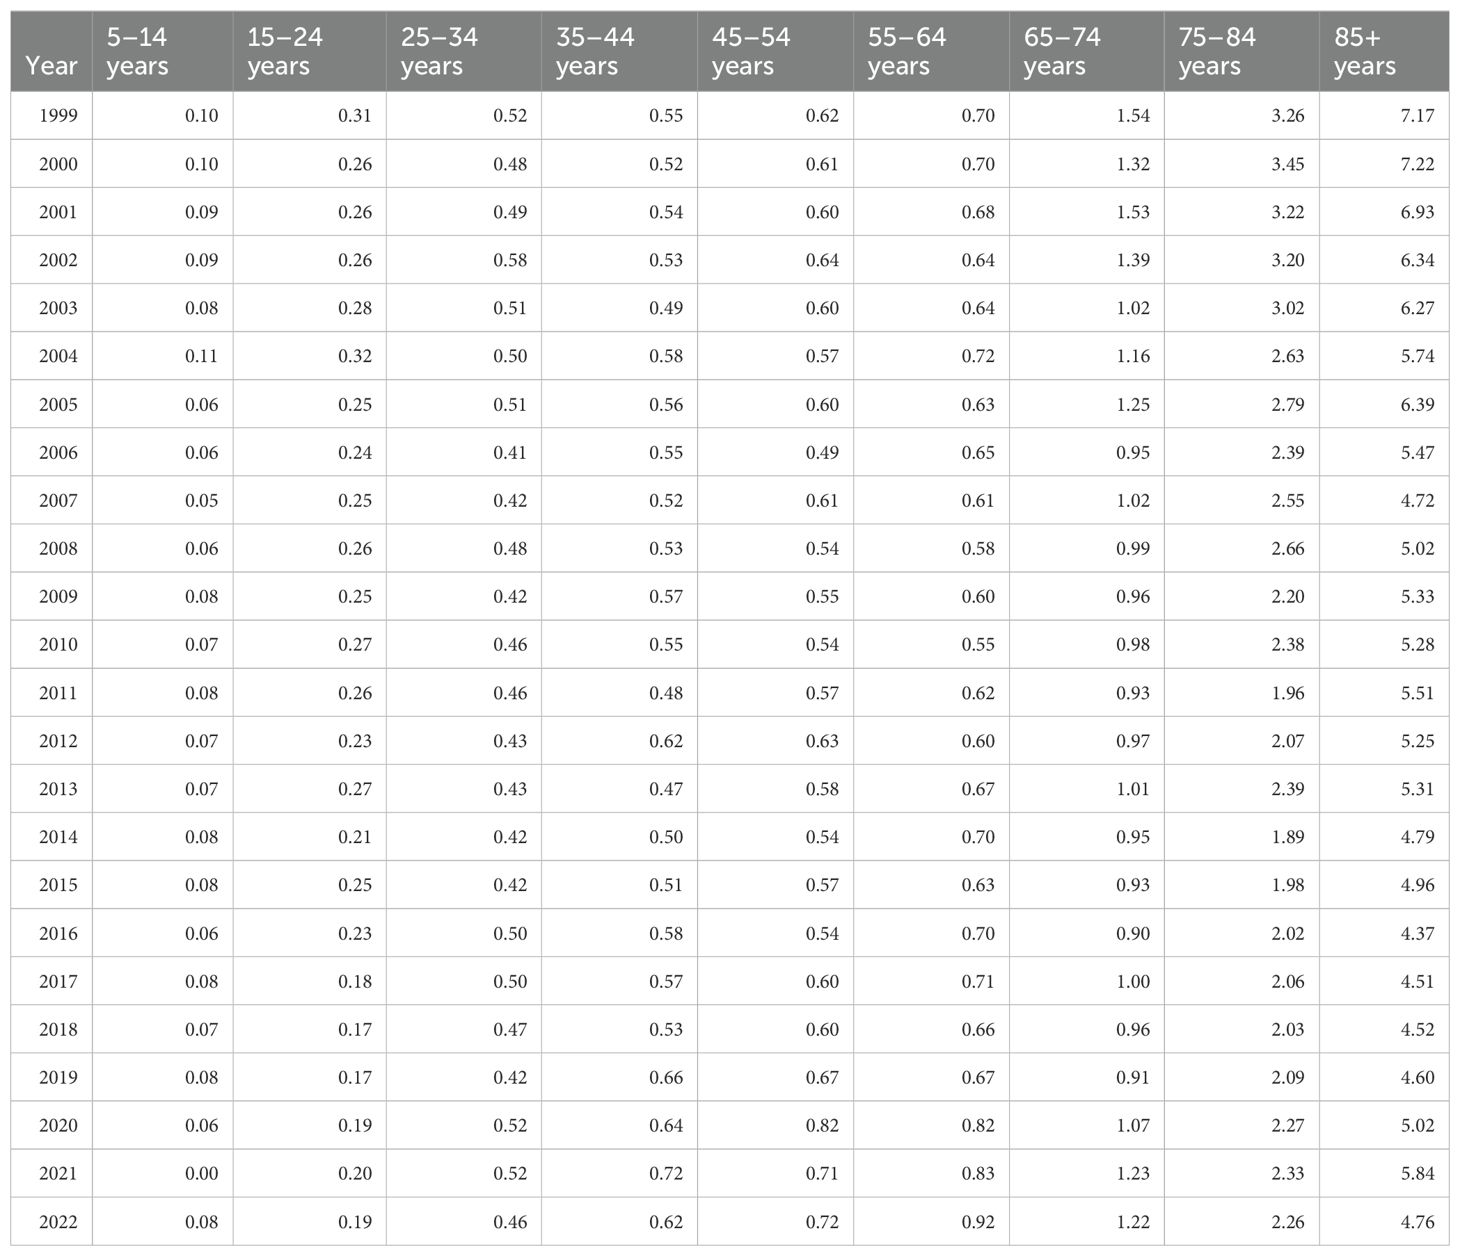
Table 3. Hemolytic anemia crude mortality rate per 100,000 people stratified by ten-year age group, 1999-2022.
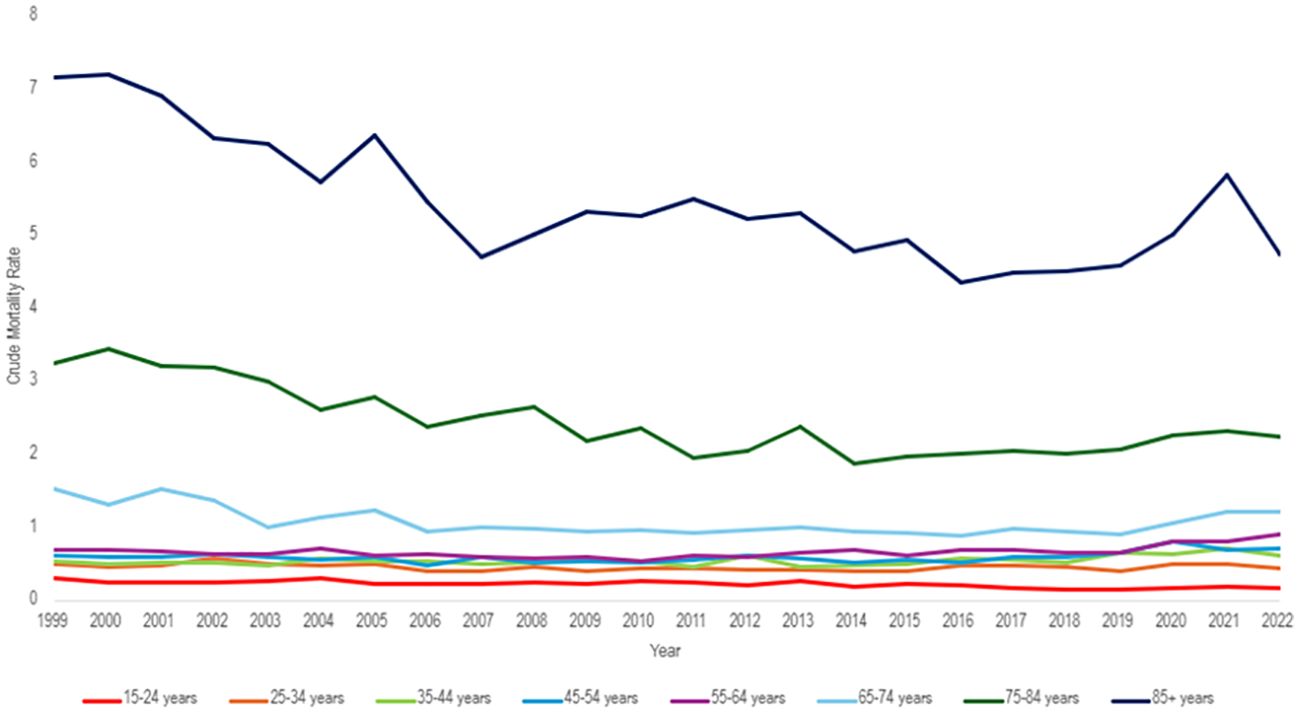
Figure 5. Hemolytic anemia age-adjusted mortality rate per 100,000 people; stratified by ten-year age group, 1999-2022.

Figure 6. Joinpoint model of hemolytic anemia-related crude mortality rate per 100,000 people stratified by ten-year age group, 1999-2022 (*indicates the APC is statistically significant).
The population of 65–74 years of age saw the greatest APC change of 10.59 (95% CI 2.72 to 21.07)* from 2019 to 2022, but a consistent AAPC of -0.77 (95% CI -1.52 to -0.17)* from 1999 to 2022 (Figure 6). Similarly, the population of 55–64 years of age had an APC of 9.01 (95% CI 2.96 to 16.14)* from 2019 to 2022 with an overall AAPC of 1.16 (95% CI 0.52 to 1.77)* from 1999 to 2022 (Figure 6).
The population of 5 to 14 years of age had the lowest crude mortality rate of 0.1 (95% CI 0.07 to 0.13) in 1999 and 0.08 (95% CI 0.06 to 0.12) in 2022. However, it had the greatest overall AAPC of -1.90 (95% CI -2.73 to -1.15)* (Figure 6). The age groups of 15-24, 65-74, 65-74, 75-84, and 85+ all have negative trending AAPCs that were statistically significant (Figure 6). The population of 25–34 years old had a negative trending AAPC that was statistically insignificant. The remaining age groups (35-44, 45-54, 55-64) all had positive AAPCs that were statistically significant (Figure 6).
3.4 Regional variation
3.4.1 Census region-based differences
All census regions saw a decrease in the AAMR over the study interval, however, the Southern region had the highest mortality of all regions throughout the study, with an AAMR in 2022 of 0.85 (95% CI 0.79 to 0.90) deaths per 100,000 people (Table 4, Figure 7). The South saw a great decrease in AAMR from 1999 to 2006, an APC of -2.86 (95% CI -7.23 to -1.48)*, but a significant increase from 2018 to 2022 with an APC of 6.88 (95% CI 3.65 to 13.82)* (Table 4, Figure 8). Overall, the Southern region had an AAPC of -0.02 (95% CI -0.46 to 0.38), which not statistically significant.
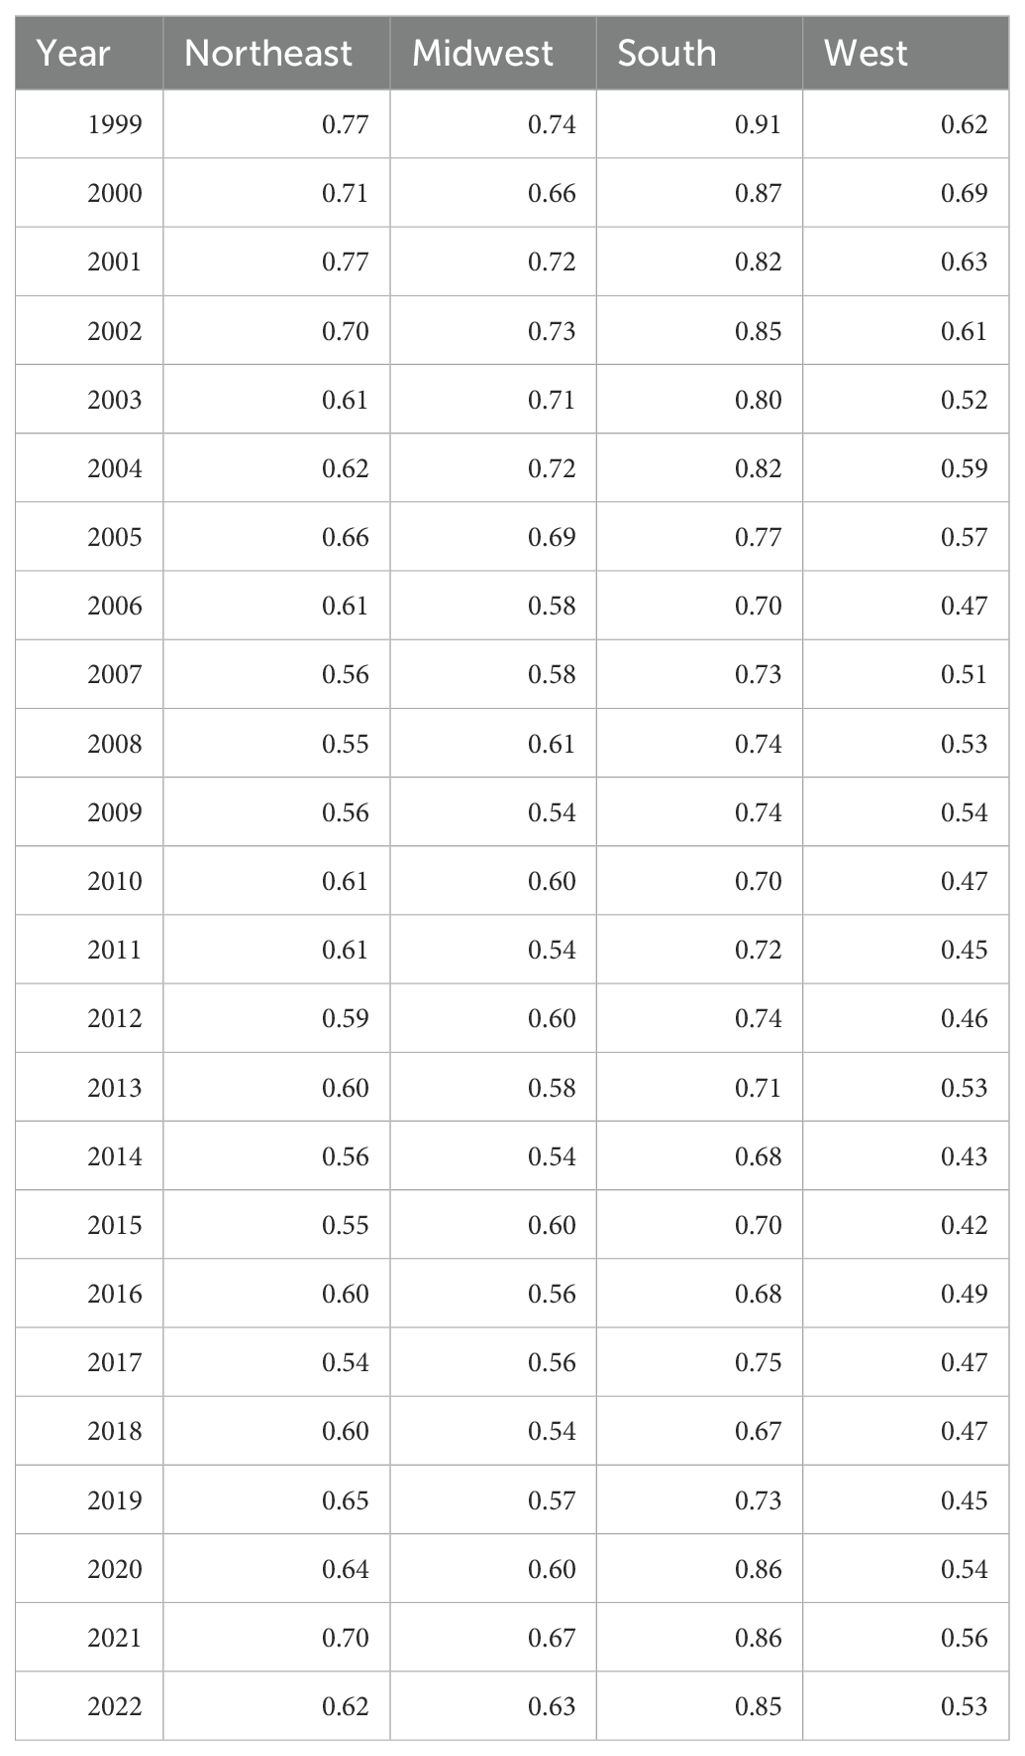
Table 4. Hemolytic anemia age-adjusted mortality rate per 100,000 people; stratified by region, 1999-2022.
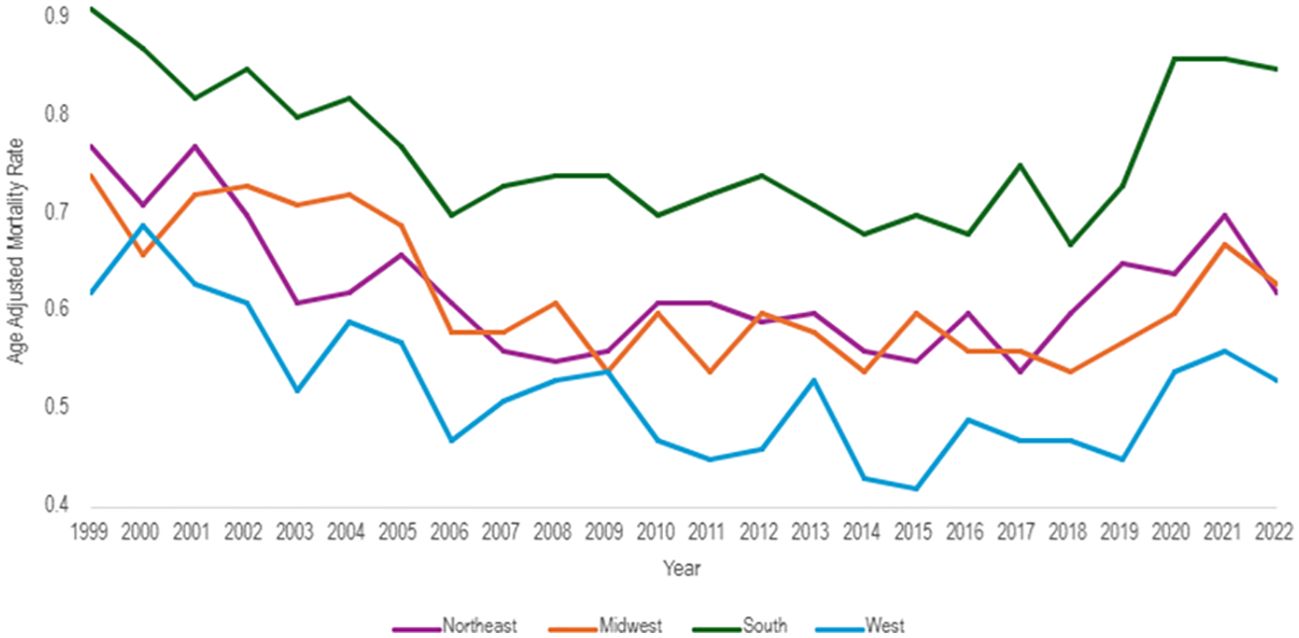
Figure 7. Hemolytic anemia age-adjusted mortality rate per 100,000 people; stratified by region, 1999-2022.
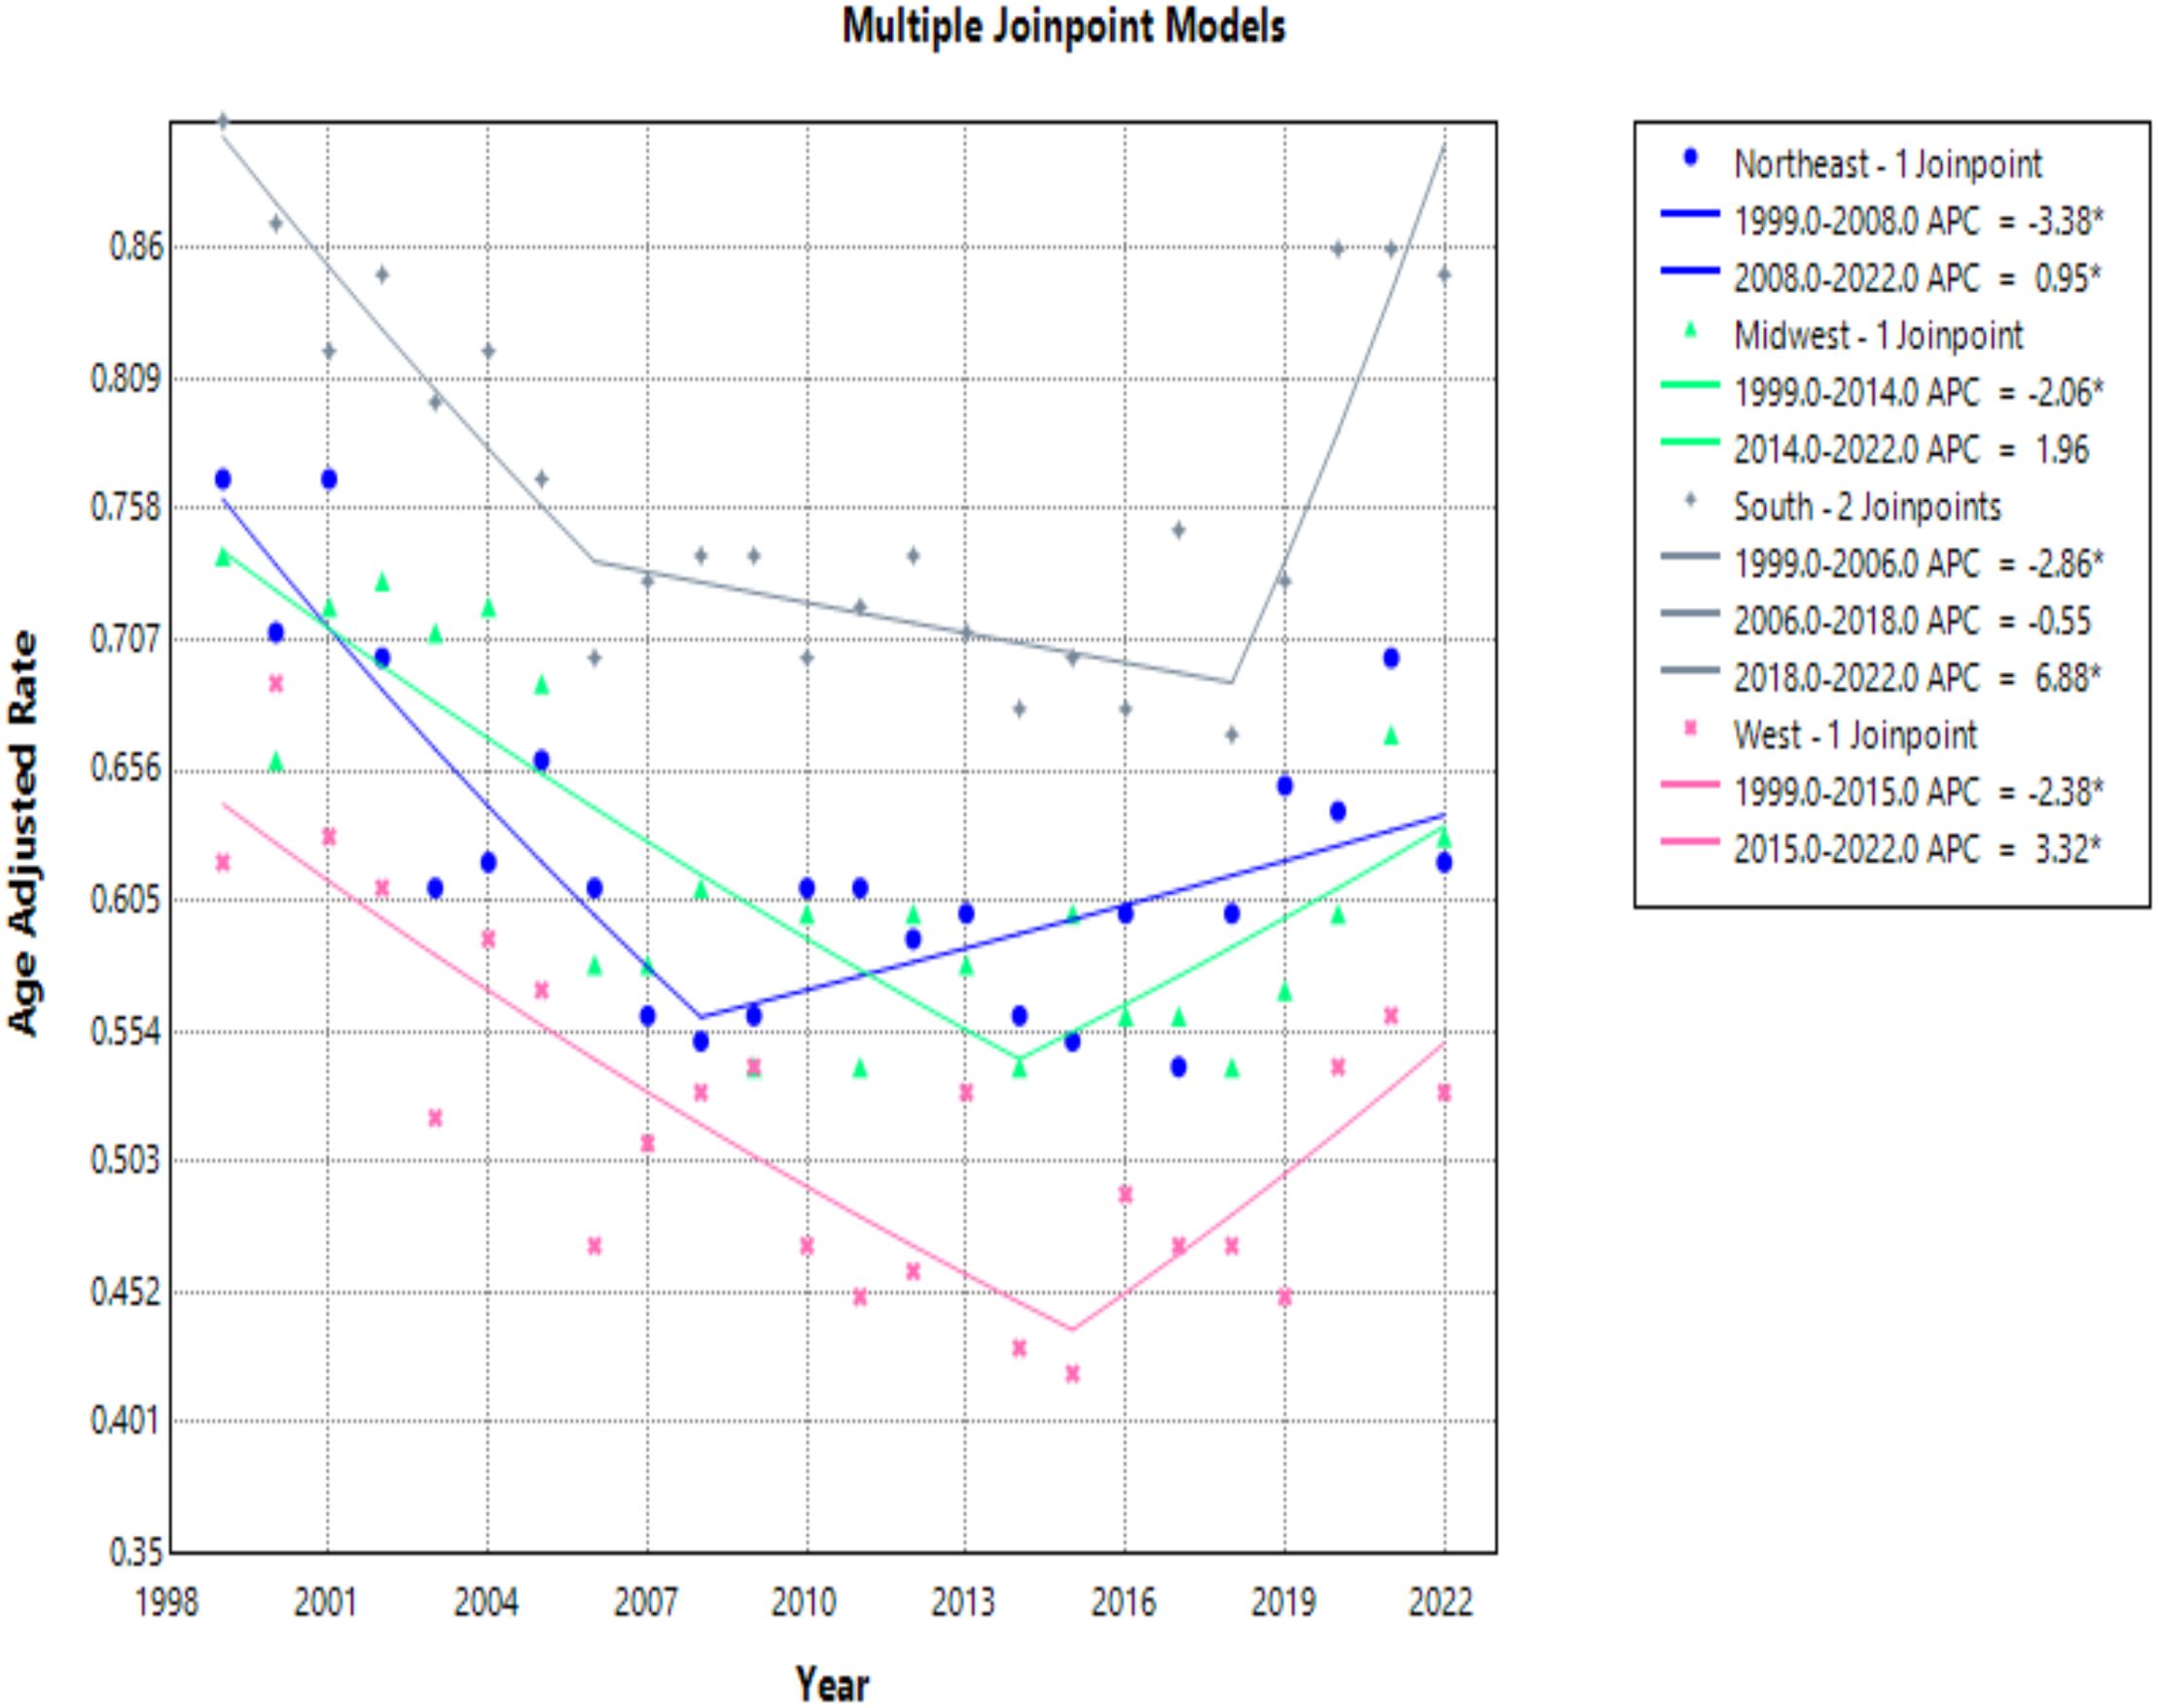
Figure 8. Joinpoint model of hemolytic anemia-related AAMR per 100,000 people stratified by region, 1999-2022 (*indicates the APC is statistically significant).
The Midwest and Northeast had similar mortality rates over the course of the study period, and both saw a statistically significant decrease in AAMR with AAPCs of -0.68 (95% CI -1.50 to -0.02)*, and -0.77 (95% CI -1.27 to -0.24)*, respectively (Table 4, Figure 7). The Midwest did see a significant decrease in AAMR from 1999 to 2014 with an APC of -2.06 (95% CI -6.07 to -1.08)*, but an up trending AAMR from 2014 to 2022 of 1.96 (95% CI -0.61 to 11.72), which was not statistically significant (Table 4, Figure 8). The Northeast had two statistically significant APC trends of -3.38 (95% CI -6.73 to -1.80)* from 1999–2008 and 0.95 (95% CI 0.14 to 2.52)* from 2008-2022 (Table 4, Figures 7, 8).
The West consistently had the lowest AAMR throughout the study, and overall had an AAPC of -0.68 (95% CI -1.30 to -0.12)* (Figure 8). From 1999 to 2015 the West had a decrease in AAMR as seen in the APC trend of -2.38 (95% CI -3.85 to -1.64)* (Table 4, Figure 8). However, the West also saw a dramatic increase in AAMR from 2015 to 2022 with an APC of 3.32 (95% CI 0.68 to 10.19)* (Table 4, Figure 8).
3.4.2 Rural vs. urban
When comparing populated regions, AAMRs were consistently higher in urban (small, medium, and large metropolitan) regions compared to rural areas (Table 5). Urban regions had an AAMR change of 0.79 (95% CI 0.75 to 0.83) in 1999 to 0.71 (95% CI 0.67 to 0.74) in 2020 (Table 5, Figures 9, 10). Three APC trends were found for the Urban areas, the two most notable are from 1999 to 2007 with an APC of -3.06 (95% CI -6.25 to -2.04)*, and the other from 2018 to 2020 with an APC of 8.08 (95% CI -1.67 to 11.42)* (Figure 10). Urban regions also had an AAPC of -0.66 (95% CI -1.12 to -0.34)* from 1999 to 2020.
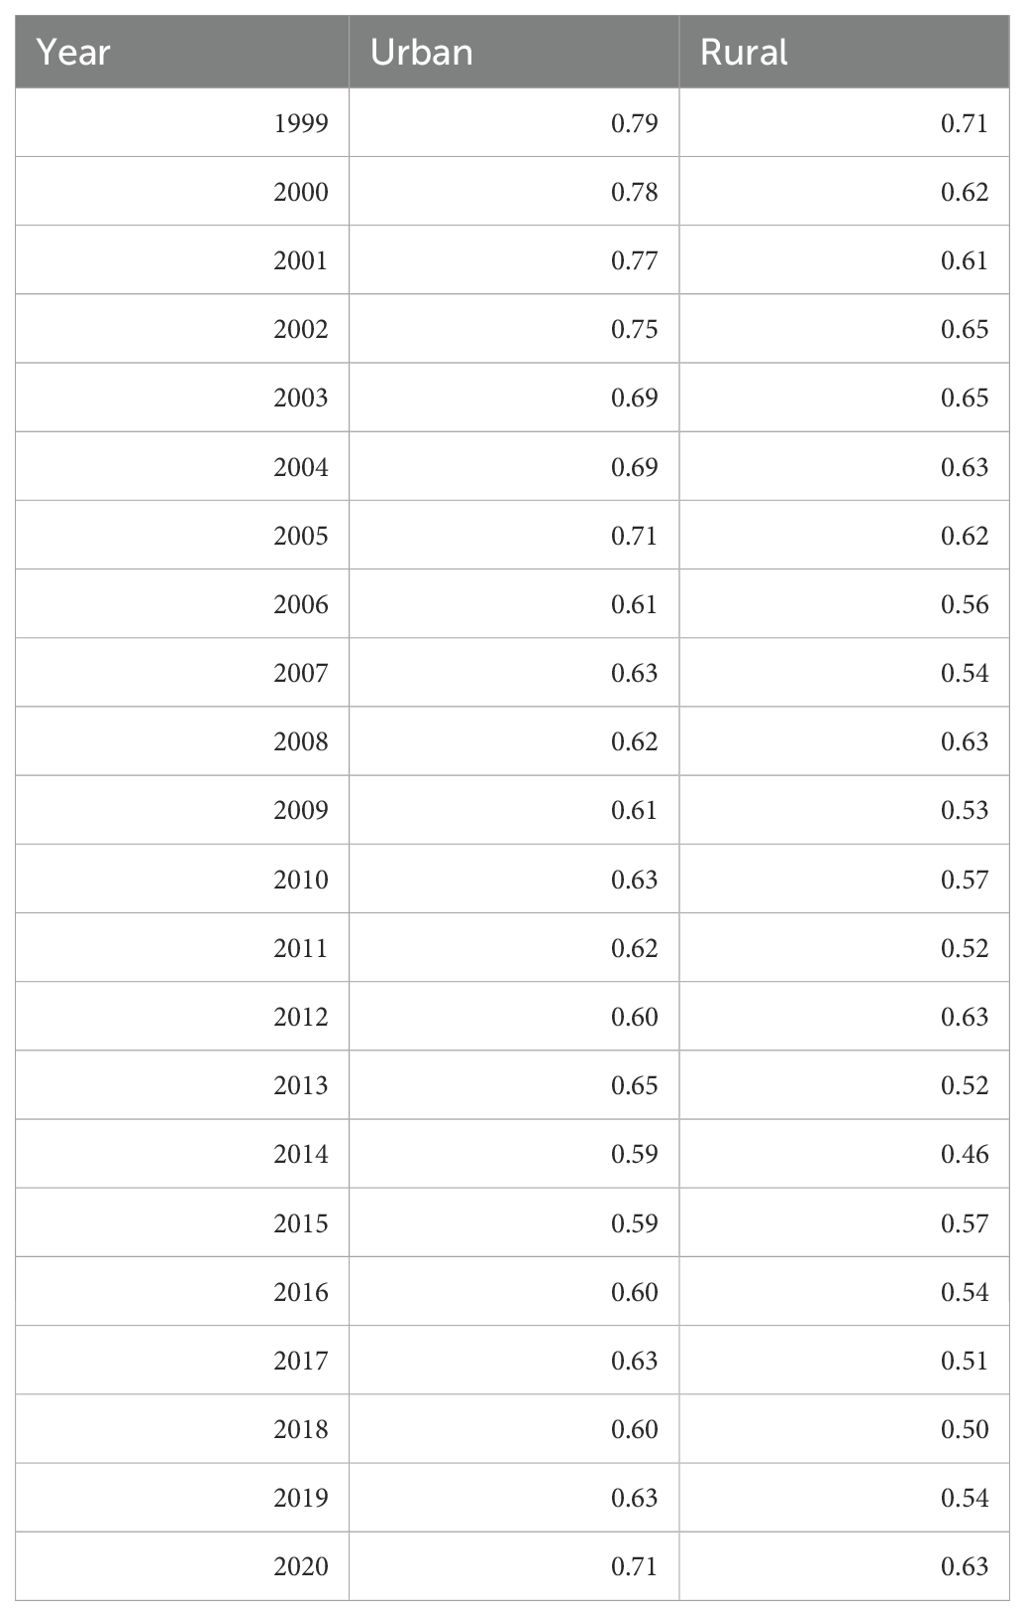
Table 5. Hemolytic anemia age-adjusted mortality rate per 100,000 people; stratified by urban vs. rural geography, 1999-2020.
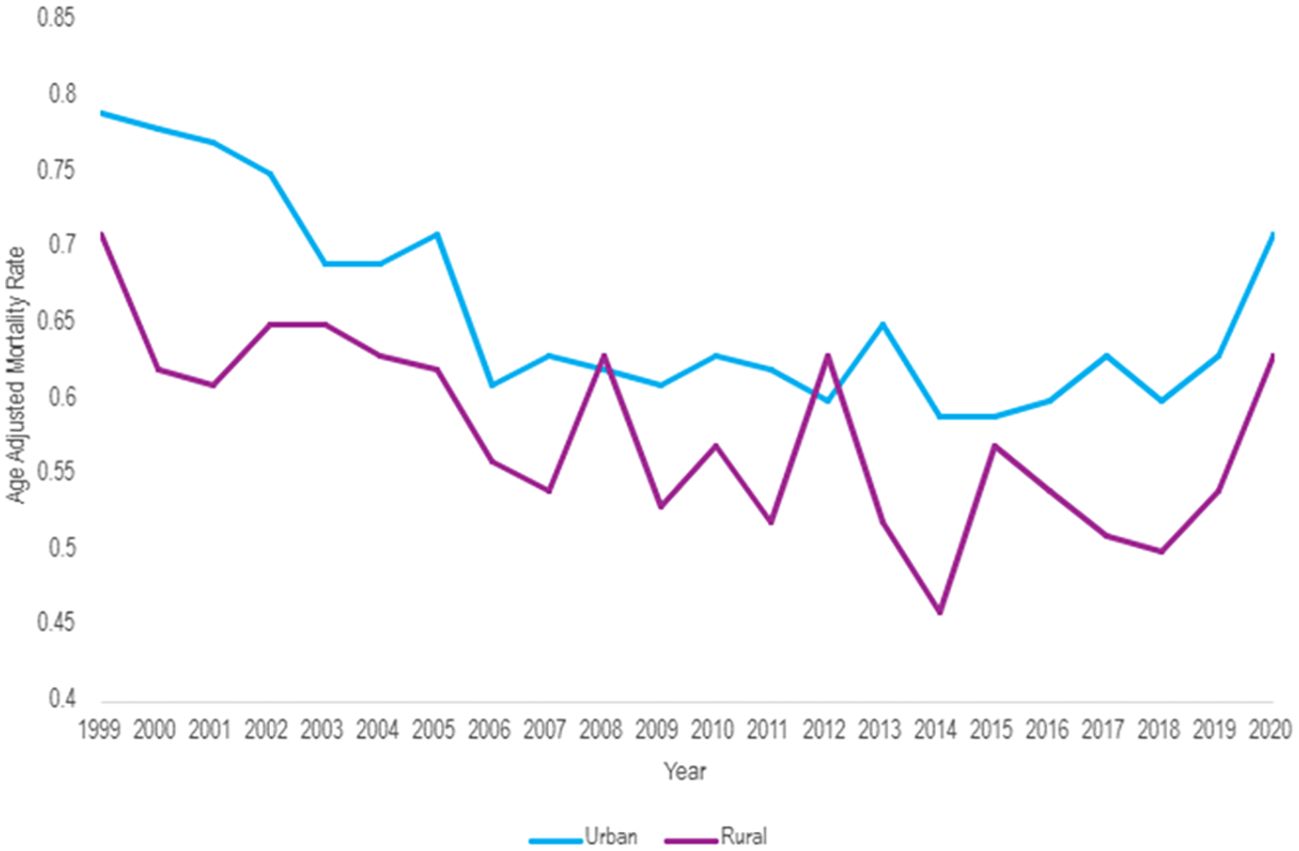
Figure 9. Hemolytic anemia age-adjusted mortality rate per 100,000 people; stratified by urban vs. rural geography, 1999-2020.
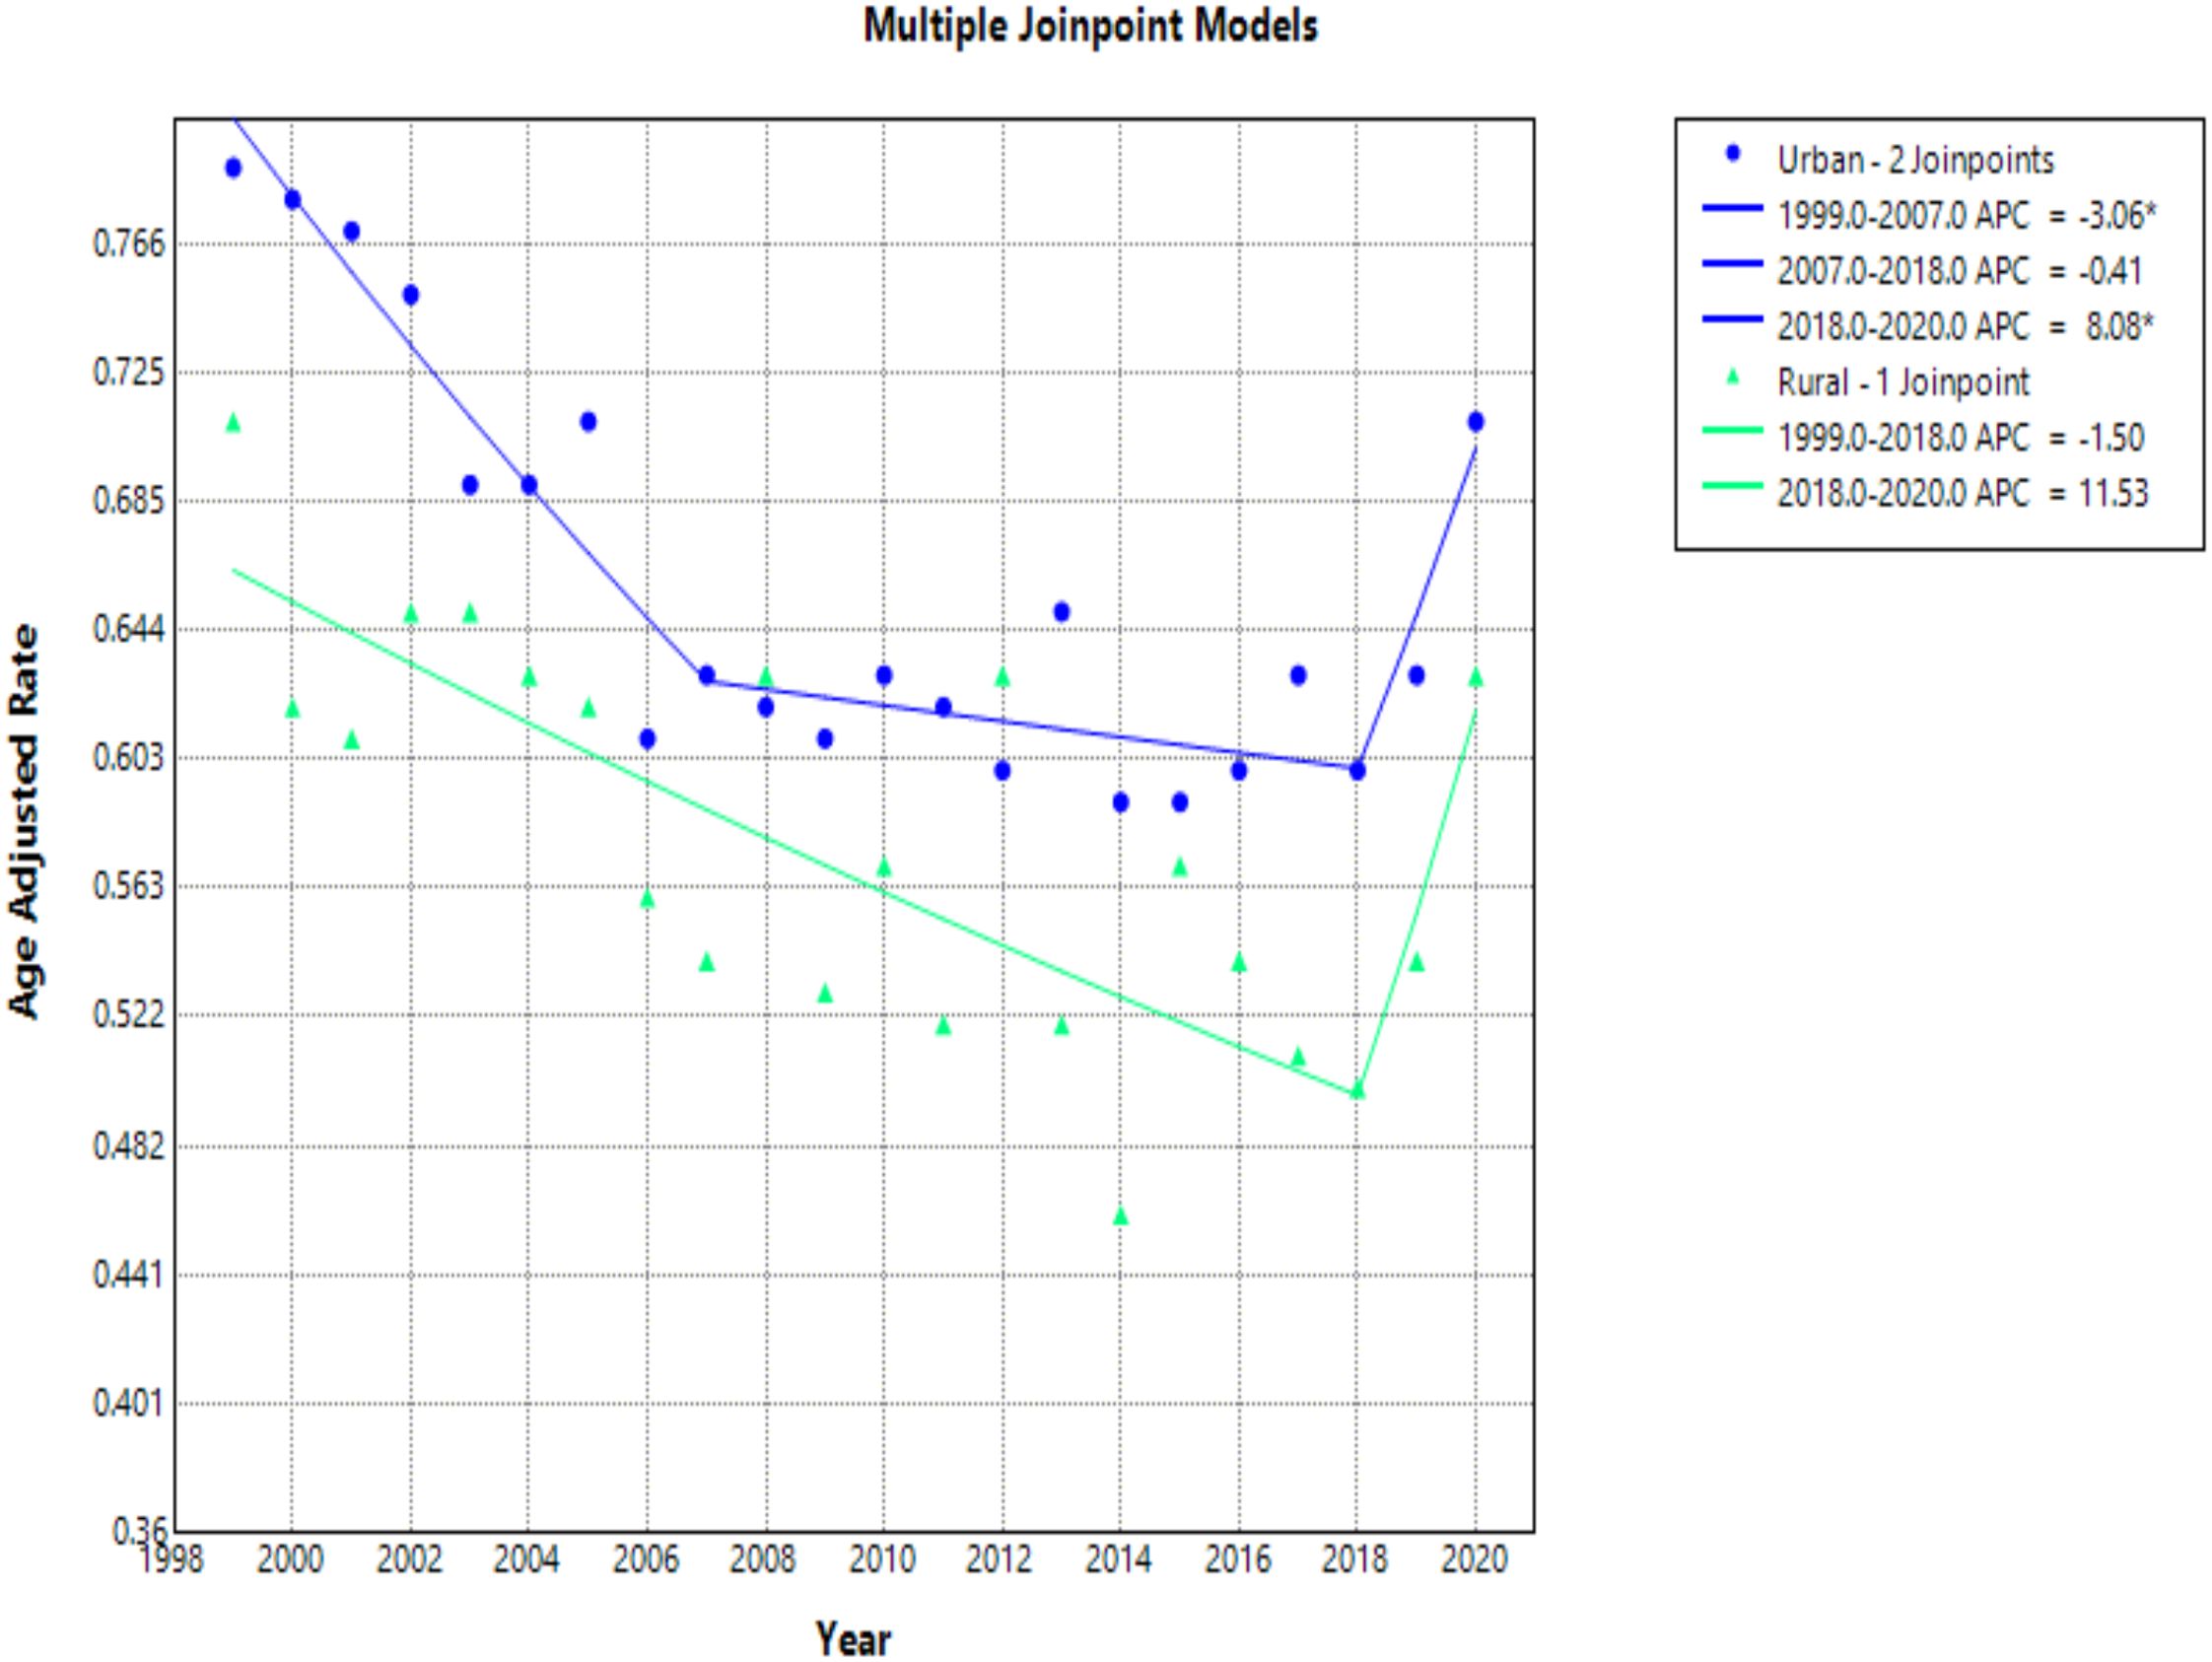
Figure 10. Joinpoint model of hemolytic anemia-related AAMR per 100,000 people overall and stratified by urban vs rural geography, 1999-2020 (*indicates the APC is statistically significant).
Rural areas had an AAMR change of 0.71 (95% CI 0.63 to 0.79) in 1999 to 0.63 (95% CI 0.56 to 0.71) in 2020 (Table 5, Figures 9, 10). Rural regions had two APC trends, from 1999 to 2018 the APC was -1.50 (95% CI -4.93 to 3.70), and from 2018 to 2020 an APC of 11.53 (95% CI -1.34 to 19.22), but neither of these trends were statically significant. Overall, the AAPC for rural zones was -0.33 (95% CI -1.52 to 0.29) (Table 5, Figure 10).
4 Discussion
In our CDC WONDER study looking at mortality rates of hemolytic anemia, we found numerous trends. Overall mortality rates decreased from 1999 to 2016 but then increased from 2016 to 2022. One possible theory for this increasing mortality trend is related to the propensity for older individuals to live longer than before. As the population ages, the risk of mortality associated with hemolytic anemia increases as well, so it’s possible that the older population could be influencing the overall trend. Further, the prevalence of chronic health conditions and multimorbidity in the United States population is increasing. Previous literature demonstrated that in patients with sickle cell disease (SCD) the average annual death rate was 1.86 per 100,000 population and deaths were likely to be related to chronic complications as opposed to acute complications (13). Complications due to hemolytic anemia include thromboembolic events, chronic kidney disease, liver injury, and cardiovascular disease (14, 15). A 2017–2018 study found that 58.4% of US adults had multimorbidity which is defined as two or more chronic conditions (16). The combination of chronic complications associated with hemolytic anemia and common chronic health conditions such as hypertension, hyperlipidemia, and diabetes may be contributing to the increasing mortality rates, especially in the aging population. Given the database analysis of hemolytic anemia, we are unable to specifically assess the pathophysiology of mortality associated with hemolytic anemia, particularly regarding the mortality associated with complications of the disease or mortality associated with acute exacerbation of the disease. Additionally, the more recent increase in mortality rates since 2019 may be associated with the COVID-19 pandemic. Studies have shown that the COVID-19 pandemic has impacted medical care considerably, in which, at one point, an estimated 41% of US adults had delayed or avoided medical care (17, 18). Further, those with poor health or underlying conditions were more likely to delay medical care during the pandemic, which may have contributed to increased mortality rates seen after 2019 (18). When considering overall mortality rates of hemolytic anemia, we questioned the prevalence of hemolytic anemia, particularly of SCD as this makes up the majority of hemolytic anemias. The prevalence of SCD in the United States in 2020 was 120,156, which is similar to the estimated prevalence in 2008 of 104,000-138,900 based on U.S. Census data (19, 20). This suggests the prevalence of SCD to be relatively stable, indicating that the increase in overall mortality rates of hemolytic anemia may not be attributed to increasing prevalence.
Analyzing trends of hemolytic anemia by age revealed that mortality rates increased with age. A study specific for SCD also found that mortality rates among older adults had increased over time (6). Along with this trend, 5–14-year-olds had the lowest mortality rate. The age group of 15–24 years olds was the only group that had a consistently decreasing mortality rate from 1999-2022. Previous studies have shown a transition period between the ages of 15–19 and 20–24 with increased mortality in which patients with SCD undergo a shift from pediatric to adult care (21). This has historically been a concern for pediatric-onset chronic diseases which often leads to inadequate adult follow up, patient unpreparedness and a lack of care coordination (22, 23). Our study demonstrated consistently decreasing mortality rates for this age group with hemolytic anemia suggesting that our healthcare system may be more successfully facilitating this transfer of care in the more recent years. The highest mortality rates were seen with increased age, particularly in people over 75. Data has shown that older individuals have a decreased tolerance to anemia which may contribute to higher mortality rates (24). Further, the process of eryptosis, suicidal erythrocyte death, has been shown to be more prevalent in the elderly which can lead to increased red blood cell death resulting in worsening anemia and ultimately increased mortality with age (25).
This study found that males had higher mortality rates than females, which could be due to the greater tolerance of anemia in females and decreased mortality in females with the same level of hemoglobin compared to males (26). Previous literature suggests that testosterone increases the susceptibility of red blood cells to hemolysis, which could exacerbate underlying hemolytic anemia (27). These factors could both be contributing to the overall higher morality in males.
Trends found during race analysis showed that Black/African Americans had the highest mortality rates. Presumably, the higher rate of mortality in Black/African Americans with hemolytic anemia is due to the contribution of SCD in the analysis of hemolytic anemias, and the higher rate of Black/African Americans with SCD (28). Hispanics/Latinos had the lowest mortality rate of any race. This could be attributable to Hispanics with SCD being more likely to have higher socioeconomic status (SES) and live in the Northeast, which may contribute to lower mortality rates (5).
Regionally the South had the highest mortality and the most drastic increase in mortality from 2018 to 2022. We propose this is due to Black people with SCD being more likely to live in the South than White people, which may contribute to the increased mortality in the South compared to other regions (5). The West had the lowest mortality rate. Both of these results have been seen in other studies looking at SCD which also show the highest mortality in the South and lowest in the West (7). This suggests that SCD may be playing a substantial role in our study looking at hemolytic anemia which demonstrated higher mortality in Black/African Americans and in the South region.
Our results showed higher mortality rates in urban areas versus rural areas. The annual percent change over the study period was statistically significant in urban areas, but not in rural areas. One possible explanation for higher rates of mortality in hemolytic anemia in urban areas includes the availability of healthcare resources. It is possible that sicker patients who require more frequent or more intensive healthcare live in urban areas compared to patients with less severe disease who may be comfortable living further away from healthcare facilities. Another possible explanation for higher rates of mortality in hemolytic anemia in urban areas includes the presence of pollution and urban particulate matter (29). A study in China demonstrated that urban particulate matter had weak hemolytic properties on erythrocytes. Similarly in the United States, air pollution was shown to be associated with decreased hemoglobin levels, particularly in older adults (30). Another study found an association between air pollution and increased emergency department visits for acute SCD exacerbations (31). All the above support the idea of pollution and particulate matter could be contributing to the higher mortality trend in urban areas for hemolytic anemia. However, given the nature of our study, we cannot assess the specific cause of death when assessing mortality rates of hemolytic anemia stratified by urban areas versus rural areas.
Given that this is a large population-based study, several limitations should be acknowledged. Though we were able to study trends based on gender, age, race and region, we were not able to further evaluate those categories with regard to socioeconomic status, access to healthcare and/or insurance status. The CDC Wonder database, a crucial tool in public health research, provides extensive information and allows for long study periods. However, the database’s limitations include its dependence on precise coding of death certificates and ICD codes thus leading to misclassification bias. CDC Wonder also suppresses data with annual death counts under ten, thus state level data had a lot of suppressed data for states with smaller populations; therefore, we could not analyze that. Data collection for rural and urban data was only populated through 2020 in the CDC Wonder database, thus our results for this variable are based on data from 1999-2020, as opposed to all other variables based on data from 1999-2022. Moreover, the CDC Wonder database has standardized all data to the United States population in 2000. Therefore, we are unable to assess if recent population size, growth rate or the COVID19 pandemic influence our results.
While hemolytic anemia is a broad category, we were unable to analyze sub-categories due to insufficient data within the database for subgroups of hemolytic anemia, aside from SCD which made up approximately 50% of the total data. In addition, we acknowledge that our results may be skewed due to the higher prevalence of SCD in the United States compared to other types of hemolytic anemia.
5 Conclusion
Hemolytic anemia-related mortality in the United States decreased overall between 1999 and 2022. While a decrease was seen between 1999 and 2016, an increase was seen starting from 2016 with a significant increase between 2019 and 2021. This trend was replicated in many of our subgroup analyses. Notable findings include Black/African Americans race and the Southern census region having the highest mortality rates within their subgroups. Urban populations had a higher mortality rate compared to rural areas.
Data availability statement
Publicly available datasets were analyzed in this study. This data can be found here: https://wonder.cdc.gov/.
Ethics statement
Ethical review and approval was not required for the study of human participants in accordance with the local legislation and institutional requirements. Written informed consent from the patients/participants OR patients/participants legal guardian/next of kin was not required to participate in this study in accordance with the national legislation and the institutional requirements.
Author contributions
AsT: Writing – original draft, Writing – review & editing. TD: Writing – original draft, Writing – review & editing. TB: Writing – review & editing. MM: Writing – review & editing. AbT: Writing – review & editing. AA: Writing – review & editing.
Funding
The author(s) declare that no financial support was received for the research and/or publication of this article.
Conflict of interest
The authors declare that the research was conducted in the absence of any commercial or financial relationships that could be construed as a potential conflict of interest.
Generative AI statement
The author(s) declare that no Generative AI was used in the creation of this manuscript.
Publisher’s note
All claims expressed in this article are solely those of the authors and do not necessarily represent those of their affiliated organizations, or those of the publisher, the editors and the reviewers. Any product that may be evaluated in this article, or claim that may be made by its manufacturer, is not guaranteed or endorsed by the publisher.
References
1. Hemolytic anemi. Bethesda, Maryland: U.S. Department of Health and Human Services (2022). Available at: https://www.nhlbi.nih.gov/health/anemia/hemolytic-anemia (Accessed November 1, 2024).
2. Tefferi A. Anemia in adults: a contemporary approach to diagnosis. Mayo Clinic Pro. (2003) 78:1274–80. doi: 10.4065/78.10.1274
3. Gardner WM, Razo C, McHugh TA, Hagins H, Vilchis-Tella VM, Hennessy C, et al. Prevalence, years lived with disability, and trends in anaemia burden by severity and cause 1990–2021: findings from the Global Burden of Disease Study 2021. Lancet Haematolog. (2023) 10[9]:e713–e734. doi: 10.1016/S2352-3026(23)00160-6
4. DeBaun MR, Jordan LC, King AA, Schatz J, Vichinsky E, Fox CK, et al. American Society of Hematology 2020 Guidelines for Sickle Cell Disease: Prevention, diagnosis, and treatment of cerebrovascular disease in children and adults. Blood Advance. (2020) 4:1554–88. doi: 10.1182/bloodadvances.2019001142
5. Pokhrel A, Olayemi A, Ogbonda S, Nair K, and Wang JC. Racial and ethnic differences in sickle cell disease within the United States: From demographics to outcomes. Eur J Haemat. (2023) 110:554–63. doi: 10.1111/ejh.13936
6. Payne AB, Mehal JM, Chapman C, Haberling DL, Richardson LC, Bean CJ, et al. Mortality trends and causes of death in persons with sickle cell disease in the United States, 1979-2014. Blo. (2017) 130:865–5. doi: 10.1182/blood.v130.suppl_1.865.865
7. Cintron-Garcia J, Ajebo G, Kota V, and Guddati AK. Mortality trends in sickle cell patients. Am J Blood R. (2020) 10:190–7.
8. Michalak SS, Olewicz-Gawlik A, Rupa-Matysek J, Wolny-Rokicka E, Nowakowska E, Gil L, et al. Autoimmune hemolytic anemia: current knowledge and perspectives. Immun Agei. (2020) 17:38. doi: 10.1016/S2352-3026(23)00160-6
9. Cody EM and Dixon BP. Hemolytic uremic syndrome. Pediatr Clinics North Americ. (2019) 66:235–46. doi: 10.1016/j.pcl.2018.09.011
10. 2013 NCHS urban–rural classification scheme for counties. Available online at: https://www.cdc.gov/nchs/data/series/sr_02/sr02_166.pdf (Accessed November 1, 2024).
11. Multiple cause of death, 1999–2020 reque. Centers for Disease Control and Prevention. Available at: https://wonder.cdc.gov/mcd-icd10.html (Accessed October 1, 2024).
12. Joinpoint trend analysis software. Available online at: https://surveillance.cancer.gov/joinpoint/ (Accessed November 1, 2024).
13. Payne AB, Mehal J, Chapman C, Richardson LC, Bean CJ, Hooper WC, et al. Trends in sickle cell disease–related mortality in the United States, 1979 to 2017. Ann Emergency Me. (2020) 76:S28–S36. doi: 10.1016/j.annemergmed.2020.08.009
14. Kato GJ, Steinberg MH, and Gladwin MT. Intravascular hemolysis and the pathophysiology of sickle cell disease. J Clin Invest. (2017) 127:750–60. doi: 10.1172/JCI89741
15. Shah S and Padrnos L. Complications of autoimmune hemolytic anemia. Hematol Oncol Clin North A. (2022) 36:353–63. doi: 10.1016/j.hoc.2021.12.003
16. Mossadeghi B, Caixeta R, Ondarsuhu D, Luciani S, Hambleton IR, and Hennis AJM. Multimorbidity and social determinants of health in the US prior to the COVID-19 pandemic and implications for health outcomes: a cross-sectional analysis based on NHANES 2017-2018. BMC Public Healt. (2023) 23:887. doi: 10.1186/s12889-023-15768-8
17. Czeisler ME, Marynak K, Clarke K, Salah Z, Shakya I, Thierry JM, et al. Delay or avoidance of medical care because of COVID-19–related concerns - United States, June 202. Centers for Disease Control and Prevention (2020). Available at: https://www.cdc.gov/mmwr/volumes/69/wr/mm6936a4.htm.
18. Gertz AH, Pollack CC, Schultheiss MD, and Brownstein JS. Delayed medical care and underlying health in the United States during the COVID-19 pandemic: A cross-sectional study. Preventive Med Reports. (2022) 28:101882. doi: 10.1016/j.pmedr.2022.101882
19. Hassell K. Population estimates of sickle cell disease in the U.S. Am J Preventative Medicine. (2010) 38:S512–21. doi: 10.1016/j.amepre.2009.12.022
20. Yao F, Andermariam B, and Herman C. Estimating sickle cell disease prevalence by state: A model using US-born and foreign born state-specific population data. Bloo. (2023) 142. doi: 10.1182/blood-2023-189287
21. Hamideh D and Alvarez O. Sickle cell disease related mortality in the United States (1999-2009). Pediatr Blood Cancer. (2013) 60:1482–6. doi: 10.1002/pbc.24557
22. Kanter J and Kruse-Jarres R. Management of sickle cell disease from childhood through adulthood. Blood Re. (2013) 27:279–87. doi: 10.1016/j.blre.2013.09.001
23. Karkoska KA and McGann PT. Trends in sickle cell disease mortality: 1979-2020. Pediatrics. (2024) 154:e2024067341. doi: 10.1542/peds.2024-067341
24. Simon GI, Craswell A, Thom O, Chew MS, Anstey CM, and Fung YL. Impacts of aging on anemia tolerance, transfusion thresholds, and patient blood management. Transfus Med Re. (2019) 33:154–61. doi: 10.1016/j.tmrv.2019.03.001
25. Lupescu A, Bissinger R, Goebel T, Salker MS, Alzoubi K, Liu G, et al. Enhanced suicidal erythrocyte death contributing to anemia in the elderly. Cell Physiol Bioche. (2015) 36:773–83. doi: 10.1159/000430137
26. Visagie M, Pearson KR, Purvis TE, Gehrie EA, Resar LMS, and Frank SM. Greater anemia tolerance among hospitalized females compared to males. Transfusion. (2019) 59:2551–8. doi: 10.1111/trf.15338
27. Kanias T, Sinchar D, Osei-Hwedieh D, Baust JJ, Jordan A, Zimring JC, et al. Testosterone-dependent sex differences in red blood cell hemolysis in storage, stress, and disease. Transfusion. (2016) 56:2571–83. doi: 10.1111/trf.13745
28. Data and statistics on Sickle Cell Diseas. Centers for Disease Control and Prevention. (2024). Available at: https://www.cdc.gov/sickle-cell/data/index.html:~:text=Sickle%20cell%20disease%20(SCD)%20affects,shorter%20than%20the%20average%20expected (Accessed November 1, 2024).
29. Tian Y, Li Y, Sun S, Dong Y, Tian Z, Zhan L, et al. Effects of urban particulate matter on the quality of erythrocytes. Chemosphere. (2023) 313:137560. doi: 10.1016/j.chemosphere.2022.137560
30. Honda T, Pun VC, Manjourides J, and Suh H. Anemia prevalence and hemoglobin levels are associated with long-term exposure to air pollution in an older population. Environ In. (2017) 101:125–32. doi: 10.1016/j.envint.2017.01.017
Keywords: hemolytic anemia, CDC WONDER, mortality, sickle cell disease, anemia
Citation: Tuin A, Diehl T, Billion T, Mirza M, Tauseef A and Abdul Jabbar AB (2025) Trends in hemolytic anemia-related mortality in the United States from 1999-2022. Front. Hematol. 4:1560766. doi: 10.3389/frhem.2025.1560766
Received: 14 January 2025; Accepted: 24 April 2025;
Published: 15 May 2025.
Edited by:
Samit Ghosh, University of Pittsburgh, United StatesReviewed by:
Zahra Pakbaz, University of California, Irvine, United StatesMarkus M. Mueller, GRC BTS, Germany
Copyright © 2025 Tuin, Diehl, Billion, Mirza, Tauseef and Abdul Jabbar. This is an open-access article distributed under the terms of the Creative Commons Attribution License (CC BY). The use, distribution or reproduction in other forums is permitted, provided the original author(s) and the copyright owner(s) are credited and that the original publication in this journal is cited, in accordance with accepted academic practice. No use, distribution or reproduction is permitted which does not comply with these terms.
*Correspondence: Ashley Tuin, QXNobGV5VHVpbkBjcmVpZ2h0b24uZWR1
†These authors have contributed equally to this work and share first authorship