 Eider F. Moreno-Cortes1,2
 Mariano Arribas1
 David A. Martinez-Gamboa1,2
 Juana Figueroa-Aguirre1,2
 Rohan Patel1
 Daniel Bihnam1Udit Yadav1J. Erin Wiedmeier-Nutor1Leif Bergsagel1
 Saurabh Chhabra1Rafael Fonseca1
 Januario E. Castro1,2*
- 1Division of Hematology and Medical Oncology, Mayo Clinic, Phoenix, AZ, United States
- 2Cancer Research and Cellular Therapy Laboratory, Mayo Clinic, Arizona, Phoenix, AZ, United States
Introduction: Evaluating predictive biomarkers early in treatment, clinicians can anticipate Q7 77 78 survival outcomes. Ferritin has emerged as a promising predictor of clinical 79 outcomes in multiple myeloma (MM) patients undergoing chimeric antigen patient responses and tailor therapeutic strategies to enhance efficacy and 80 receptor (CAR) T-cell therapy.
Methods: In this study, we investigated the prognostic 81 value of ferritin and C-reactive protein (CRP) as biomarkers in CAR T-cell 82 83 ferritin and CRP levels at two time points pre-infusion (Day-0) and pre- 84 lymphodepleting chemotherapy (LDC) and their association with clinical therapy for MM. This study’s objective was to evaluate the correlation between 85 response outcomes. We retrospectively analyzed outcomes from 52 relapsed/ 86 refractory MM (RRMM) patients who received either idecabtagene vicleucel or 87 ciltacabtagene autoleucel CAR T-cell therapies.
Results: Low ferritin levels at Day-0 and 88 pre-LDC were able to predict better responses regardless of the CAR T cell 89 product (hazard ratio [HR] 0.01 (95% CI 0.05–0.5); p=0.001, (HR 0.05 95% CI 90 0.01-0.2, p=<0.0069), respectively. Low ferritin + low CRP were able to predict responses at Day-0 and pre-LDC HR 0.3 (95% CI 0.07-1.3); p=0.04, HR 0.26 (95% CI 0.03-2.1), p=0.04, respectively.
Discussion: Our results indicate that ferritin and CRP 93 levels represent promising predictive biomarkers that may refine CAR T-cell 94 therapy response by enabling better patient stratification and personalized 95 treatment approaches. Our study underscores the need for their integration 96 into routine clinical practice for MM management.
Conclusions: Future prospective studies are 97 warranted to validate these findings and explore the mechanistic link between 98 99 100 101 102 elevated ferritin levels, immune activation states, and CAR T-cell efficacy.
Highlights
● Low pre-infusion ferritin and CRP levels may be associated with better CAR T-cell responses in RRMM patients, regardless of the product used.
Introduction
Relapsed/refractory multiple myeloma (RRMM) remains a major clinical challenge due to its complex pathophysiology and limited efficacy of standard therapies in heavily pretreated patients (1). Despite significant advancements in myeloma therapy, most patients eventually relapse, necessitating the development of novel therapeutic approaches (2–4). Chimeric antigen receptor (CAR) T-cell therapy has emerged as a transformative treatment strategy by leveraging the patient’s immune system to selectively target and eliminate malignant plasma cells. To date, two CAR T-cell products idecabtagene vicleucel (ide-cel) and ciltacabtagene autoleucel (cilta-cel) have been approved in the United States, with additional constructs under clinical investigation (5–7). Although CAR T-cell therapy has demonstrated remarkable efficacy in MM, clinical responses vary, and its use is associated with substantial costs and potential toxicities, including cytokine release syndrome (CRS) and neurotoxicity (8). Therefore, identifying predictive biomarkers to optimize patient selection and improve therapeutic outcomes is a critical area of research (9–12). Additionally, these biomarkers may provide insights into pre-infusion patient optimization, which could further enhance treatment success rates.
Ferritin and C-reactive protein (CRP) have been increasingly recognized as potential prognostic biomarkers in CAR T-cell therapy (13). Ferritin, an intracellular iron storage protein, is also an acute-phase reactant that rises in response to inflammation (14). Mechanistically, elevated ferritin may contribute to inferior CAR T-cell efficacy by promoting systemic inflammation and immunosuppression. High ferritin levels, indicative of oxidative stress and iron overload, have been linked to lipid peroxidation and ferroptosis, impairing CAR T-cell function and expansion (8, 15). Also, Inflammatory cytokines such as IL-6 and IL-10, associated with high ferritin, may recruit immunosuppressive cell types, like regulatory T-cells and myeloid-derived suppressor cells, thereby fostering resistance and relapse (8). These biological processes are consistent with prior studies linking elevated ferritin to worse outcomes and increased toxicity, including CRS and ICANS (12, 13, 16). Similarly, CRP, a widely used marker of systemic inflammation, has been implicated in predicting toxicity and survival outcomes in CAR T-cell therapy. Higher CRP levels have been associated with increased risk of treatment-related toxicities and poorer survival outcomes, though its precise prognostic utility remains under investigation (17).
In the context of CAR T-cell therapy for MM, pre-treatment biomarker assessment may provide valuable insights into patient prognosis and enable a more personalized approach to treatment planning. While the clinical efficacy of ide-cel and cilta-cel is well-documented (5, 6), integrating prognostic biomarkers into clinical decision-making may further refine patient selection and risk stratification. This study aims to evaluate whether pre-treatment levels of ferritin and CRP (measured pre-lymphodepleting chemotherapy or pre-CAR T-cell infusion) are predictive of key clinical endpoints, including response rates, progression-free survival (PFS), and overall survival (OS) in RRMM patients undergoing CAR T-cell therapy. Additionally, we explore the impact of tumor burden, assessed by bone marrow plasma cell percentage pre-leukapheresis, on treatment outcomes.
Methods
Study design and participants
This retrospective, single-center observational study was conducted on RRMM patients who underwent CAR T-cell therapy at Mayo Clinic Arizona. The study was approved by the Mayo Clinic Institutional Review Board and conducted in accordance with the Declaration of Helsinki. Our cohort included all patients who received B-cell maturation antigen (BCMA)-targeted CAR T-cell therapy, specifically ide-cel or cilta-cel, between September 2019 and November 2024. To be eligible, patients had to have undergone standard lymphodepleting chemotherapy consisting of cyclophosphamide and fludarabine administered on days −5, −4, and −3 prior to CAR T-cell infusion. Patients who received more than one CAR T-cell infusion were excluded from the analysis, whereas those treated with out-of-specification (OOS) CAR T-cell products were included to better reflect real-world clinical scenarios.
Data on patient demographics, prior treatment regimens, and clinical outcomes were extracted from electronic medical records and analyzed using descriptive statistics. Information on bridging therapy, if administered, was also collected. Laboratory parameters, including absolute lymphocyte count (ALC), CRP, and ferritin, were assessed at two key timepoints: pre-lymphodepletion (pre-LDC), defined as within seven days prior to leukapheresis; and baseline (Day 0), on the day of CAR T-cell infusion. The laboratory cut-offs used were based on the standardized ranges from Mayo Clinic Laboratories. Cytogenetic risk stratification was performed using fluorescence in situ hybridization (FISH) at diagnosis. High-risk cytogenetic abnormalities were defined based on the classification guidelines and included deletion 17p (del(17p)), TP53 mutations, and translocations t(4;14), t(14;16), and t(14;20), as well as gain of 1q (+1q) (18).
Treatment-related toxicities were evaluated with a focus on CRS and immune effector cell-associated neurotoxicity syndrome (ICANS), graded according to the American Society for Transplantation and Cellular Therapy (ASTCT) criteria. The management of adverse events, including the administration of tocilizumab and/or corticosteroids, was determined at the discretion of the treating physician. Clinical responses were evaluated by investigators at predefined intervals of 30 days, 3 months, 6 months, 1 year, and 2 years post-infusion, following the International Myeloma Working Group (IMWG) criteria. Response assessments incorporated bone marrow aspirates for minimal residual disease (MRD) evaluation, serum M-protein (M-spike) quantification, free light chain (FLC) measurements, and positron emission tomography (PET) scans when available. MRD detection was performed using flow cytometry, with a threshold of 10-5 nucleated cells.
The study follow-up cut-off date or last date for follow up was November 2024. OS was defined as the time from CAR T-cell infusion to death from any cause, while PFS was defined as the time from CAR T-cell infusion to disease progression by IMWG uniform response criteria or death. Statistical analyses included Fisher’s exact test for categorical variable comparisons, Spearman’s rank-order correlation for continuous variables, and the log-rank test to compare survival outcomes between groups. A multivariate Cox proportional hazards model was developed, incorporating factors with a P-value < 0.2 or those deemed clinically significant. A two-sided P-value < 0.05 was considered statistically significant. All analyses were conducted using GraphPad Prism (version 9.0.0; GraphPad Software Inc., San Diego, CA, USA).
Results
Patient characteristics
Baseline characteristics of 52 patients with R/R MM treated with CAR T-cells are summarized in Table 1. The median age at CAR T-cell infusion was 56 years (range, 33 to 76 years). 34 of the patients (65%) were male, most of the patients had Eastern Cooperative Oncology Group (ECOG) performance status ≤ 2 (98%), and no significant comorbidities, seven (13.4%) patients were R-ISS Stage III, and based on the genetic risk classification, 33 patients (61%) had high-risk cytogenetics. All patients included in the analysis received inpatient CAR T-cell infusion; the median vein-to-vein time was 54 days (range: 39-239), with a median length of hospital stay post infusion of 11 days (Range: 7-25). All patients received cyclophosphamide 300 mg/m2 and fludarabine 30 mg/m2 for 3 days as LDC conditioning regimen, with 54% of those patients received bridging therapy. The median follow up in patients receiving ide-cel 11.94 months and Cilta-cel 14.72 months.
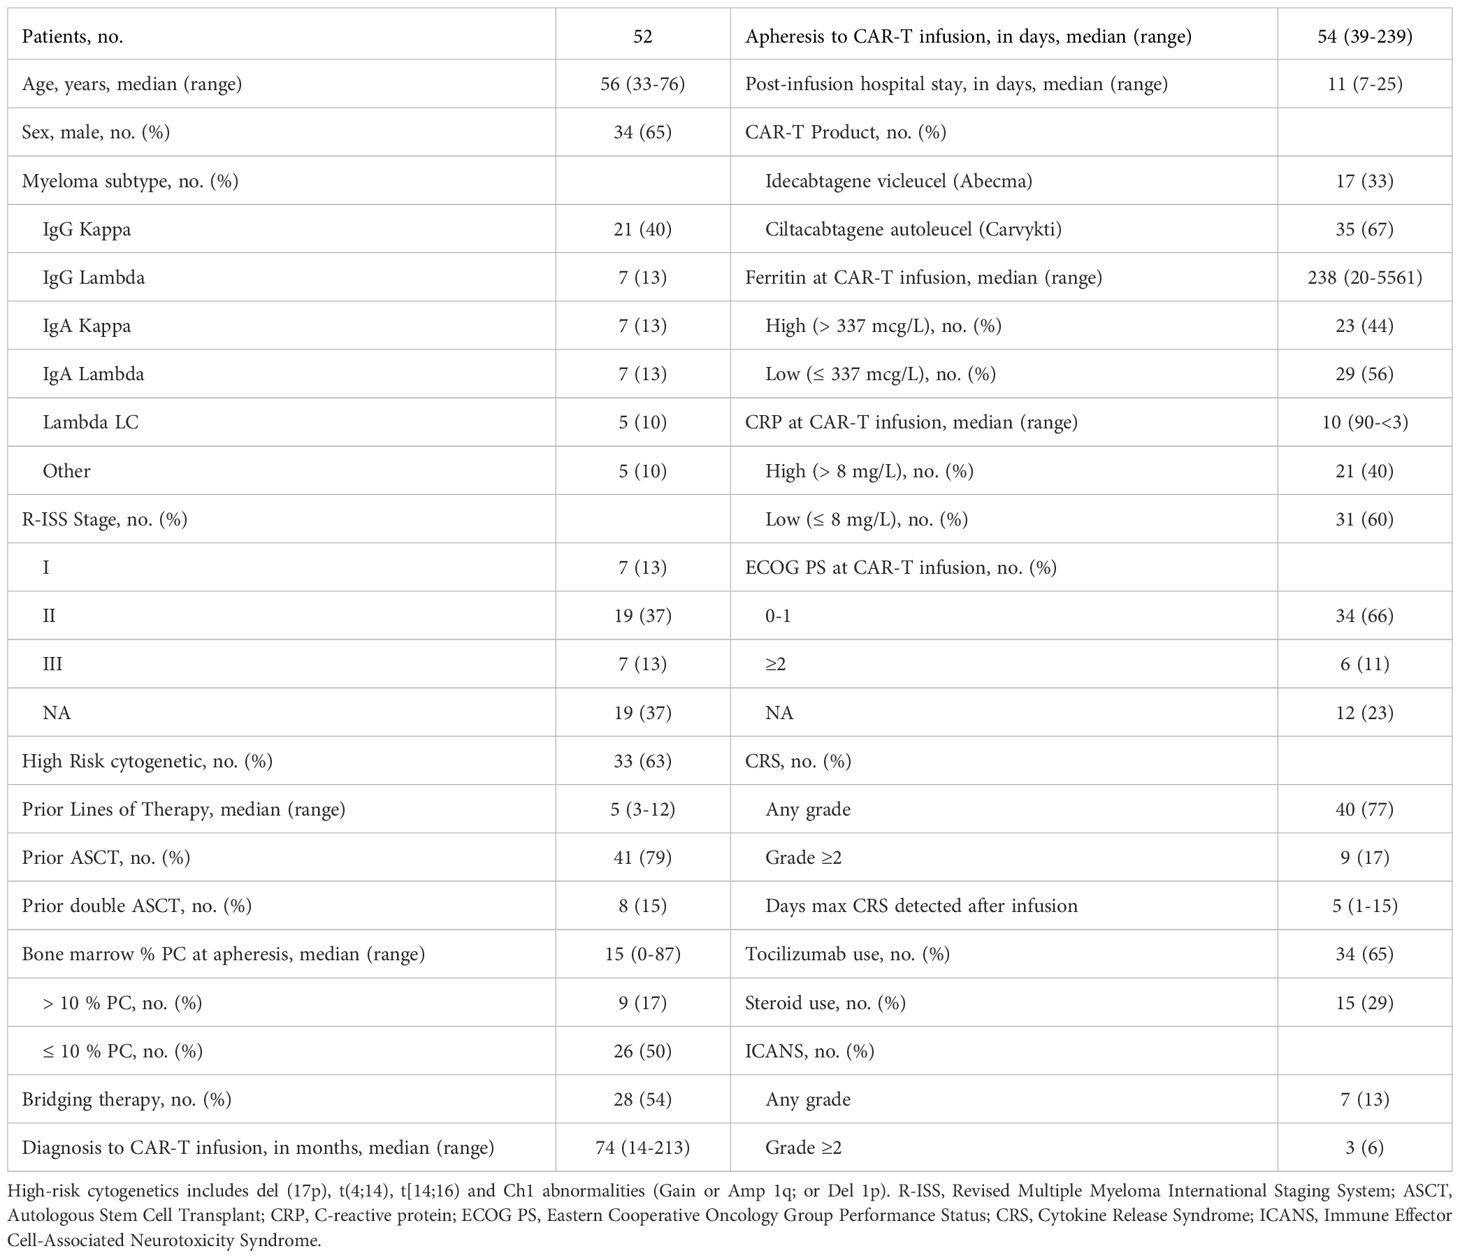
Table 1. Characteristic of patients receiving CAR-T infusion.
Safety, tolerability and efficacy of MM CAR T-cells
During the first 30 days, CRS of any grade was diagnosed in 40 of patients (77%) (2% grade ≥3) with a median time to onset of 6 days (range, 1 to 10 days). During the same time frame, ICANS was observed in 7 of patients (13%) with a median time to onset of 7 days (range, 1 to 25 days), we did not have a case of CAR T-related macrophage-activating syndrome in our cohort, or delayed movement and neurocognitive treatment-emergent adverse events (MNT). At 6 months, the overall response rate was 46% and 97% in patients that received ide-cel and cilta-cel, respectively (Figures 1A, B). Among those responses 41%, (n=7/17) and 80%, (n=28/35) achieved a complete response (CR) or better on ide-cel and cilta-cel, respectively. Thirty-five patients were evaluated for MRD using flow cytometry cut-off 10-5. Of the total population eligible [partial response (PR), very good partial response (VGPR), and CR, n=42/43] for MRD evaluation, 97% (n= 10/11) were MRD negative on the Ide-cel group and 100% (n= 32/32) were MRD negative on cilta-cel group.
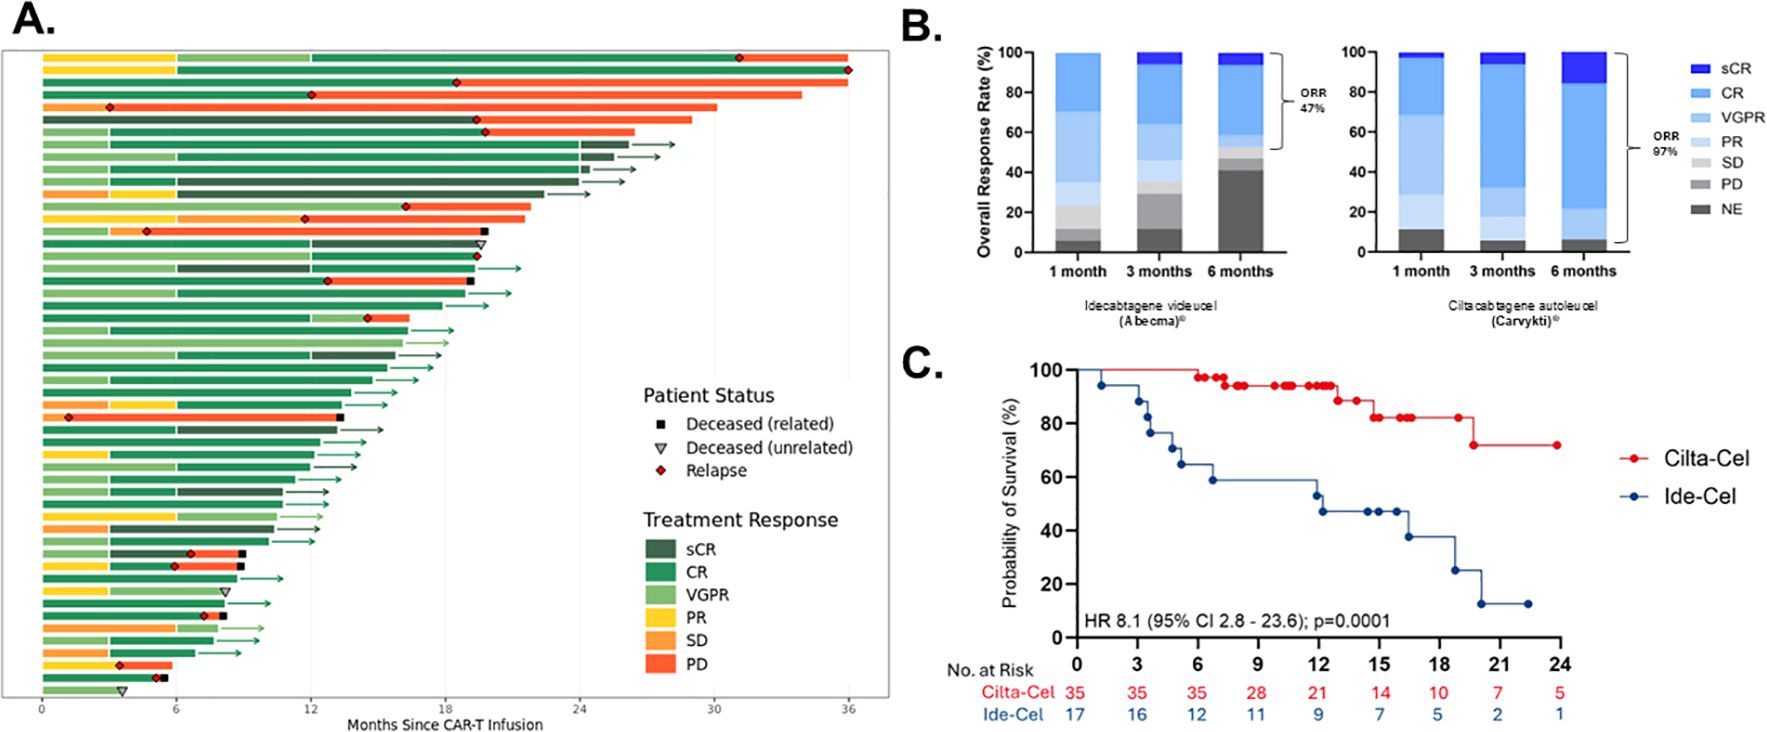
Figure 1. Response and duration of multiple myeloma (MM) CAR T-cells. (A) Swimmers-plot displaying treatment responses over months since CAR-T infusion with patient status indicators. (B) Overall response rates at one, three, and six months for two treatments, Ide-cel and Cilta-cel. (C) A survival probability curve comparing Ciltacel and Ide-cel, with respective hazard ratios and confidence intervals. Abbreviations such as CR, PR, and PD denote different response levels. IIT, indented to treat; sCR, stringent complete response; CR, complete response; VGPR, very good partial response; PR, partial response; NE, non-evaluable; MRD, minimal residual disease.
Pre-infusion/pre-LDC biomarkers association with PFS
The median PFS in patients treated with ide-cel was 13.5 months, whereas the median PFS for the cilta-cel group has not yet been reached (Figure 1C). No significant association was observed between PFS and patient age, cytogenetic risk status, number of prior lines of therapy, time from last treatment to CAR T-cell infusion, ALC at leukapheresis, percentage of bone marrow plasma cells pre-infusion, vein-to-vein time, or the use of tocilizumab or corticosteroids for CRS/ICANS management. However, univariate analysis demonstrated a strong independent correlation between ferritin levels and PFS. Patients with baseline (Day 0) ferritin levels <337 mcg/L prior to CAR T-cell infusion exhibited a significantly prolonged PFS (median not reached) compared to those with ferritin levels >337 mcg/L regardless of the CAR T-cell product, who had a median PFS of 13.5 months HR 0.01 (95% CI 0.05 – 0.5); p=0.001. Similarly, ferritin levels <337 mcg/L pre-LDC correlated with improved PFS (median not reached) compared to patients with higher ferritin levels, whose median PFS was 12.2 months HR 0.05 (95% CI 0.01 - 0.2), p=<0.0069 (Figure 2).
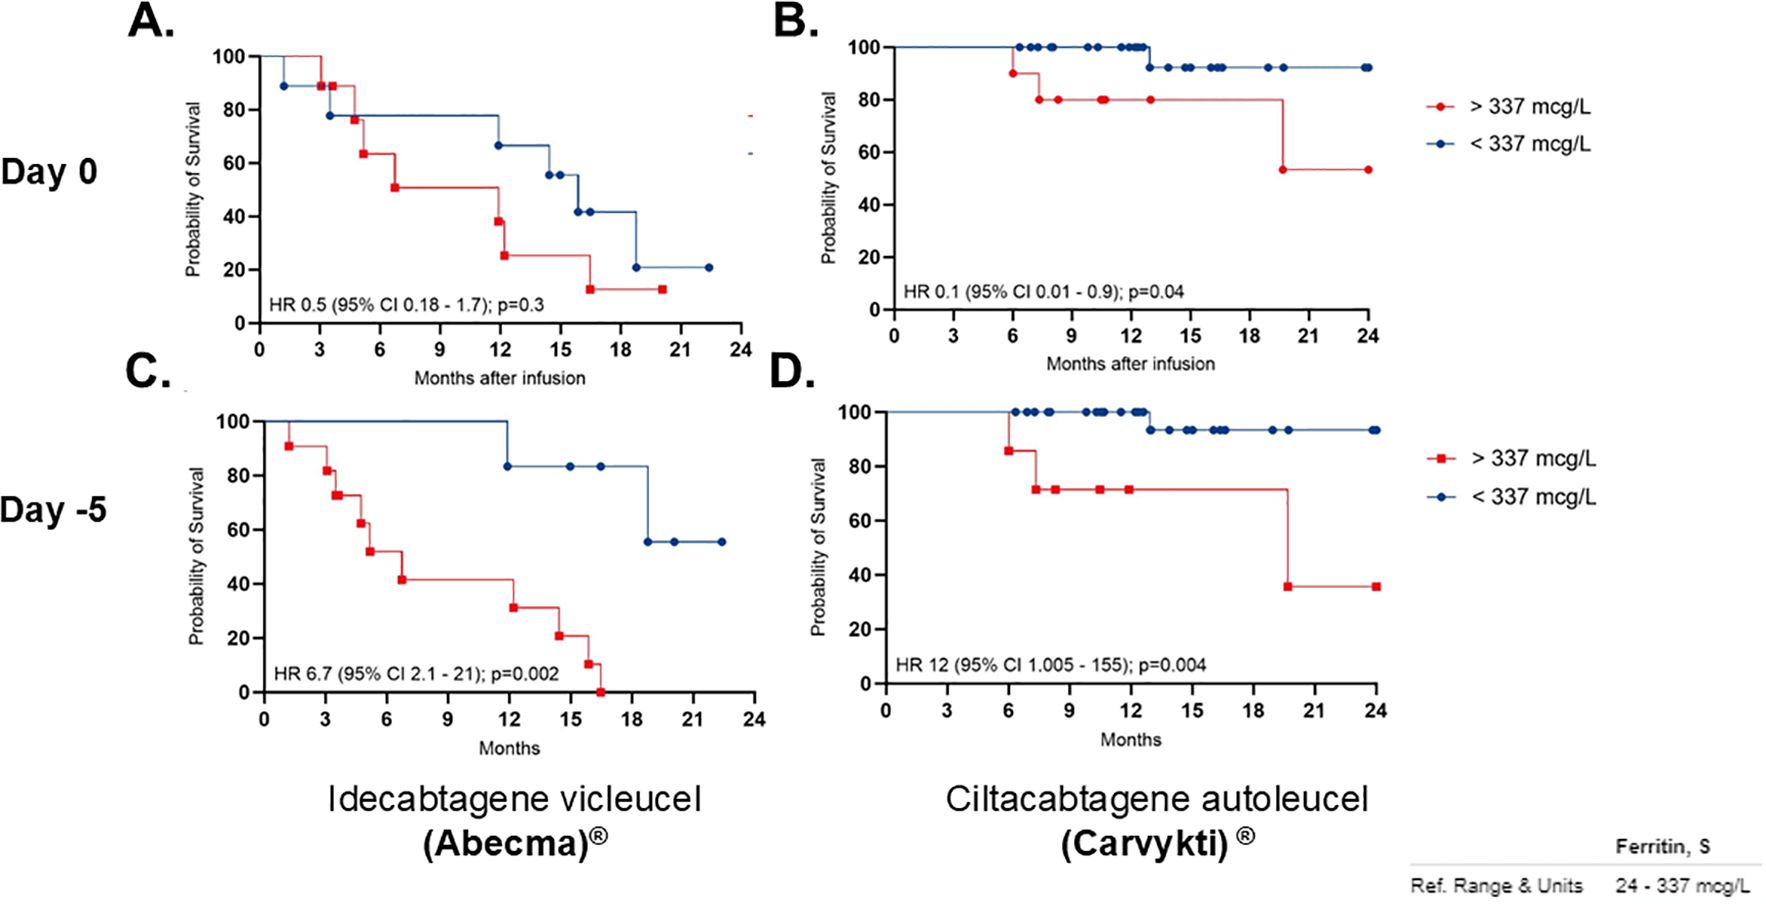
Figure 2. Progression-free survival (PFS) correlation with low ferritin. Panels (A, C) shows Idecabtagene vicleucel (Abecma) at Day 0 and Day -5, respectively. Panels (B, D) shows Ciltacabtagene autoleucel (Carvykti) at Day 0 and Day-5. Each graph compares patients with ferritin levels above and below 337 micrograms per liter. Key statistical values are shown, indicating varying survival probabilities over 24 months after infusion.
CRP alone did not demonstrate a significant correlation with PFS. Univariate analysis showed that baseline CRP levels <8 mg/L prior to CAR T-cell infusion were not independently associated with PFS, as the median PFS was not reached in either group (HR 0.4; 95% CI, 0.1–1.9; p=0.16). Additionally, in contrast to ferritin’s predictive value, CRP levels <8 mg/L prior to LDC also showed no significant correlation with PFS, as the median PFS remained unreached in both groups (HR 0.9; 95% CI, 0.2–3.5; p=0.9) (Supplementary Figure S1).
However, when evaluating ferritin and CRP in combination, patients with both baseline ferritin <337 mcg/L and CRP <8 mg/L demonstrated a significant association with prolonged PFS (median not reached) compared to those with ferritin >337 mcg/L and CRP >8 mg/L, who had a median PFS of 19.76 months HR 0.3 (95% CI 0.07 – 1.3); p=0.04. The predictive value of these biomarkers was even stronger when assessed pre-LDC, where patients with ferritin <337 mcg/L and CRP <8 mg/L pre-LDC had a PFS that remained unreached, in contrast to those with elevated biomarkers, who had a median PFS of 12.2 months HR 0.26 (95% CI 0.03 – 2.1), p=0.04 (Figure 3).
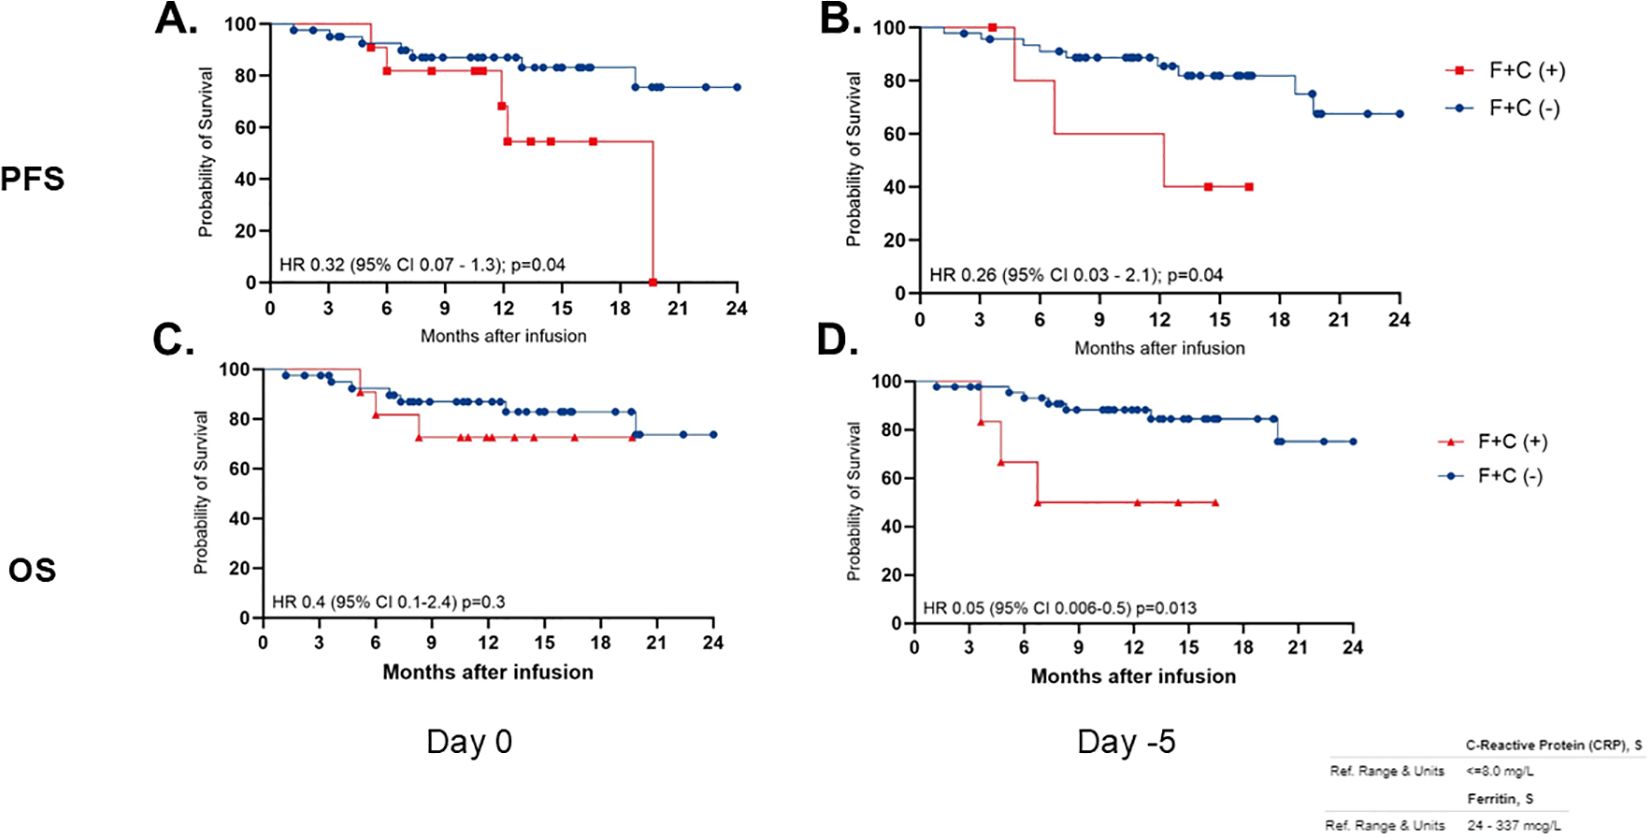
Figure 3. Progression-free survival (PFS) and overall survival (OS) correlation with low ferritin and low CRP (F+C) over 24 months post-infusion. Graphs (A, B) show PFS, while (C, D) show OS. Red line indicates F+C positive, and blue line indicates F+C negative. Hazard ratios, confidence intervals, and p-values are provided for each graph, indicating statistical significance. Graphs are divided by measurement days, Day 0 and Day -5.
The tumor burden at the time of CAR T-cell referral, measured by the percentage of plasma cells in the bone marrow from aspirate prior to leukapheresis, exhibited no correlation with PFS in the overall study population. Using a cutoff of 10% bone marrow plasma cells (BMPCs) from aspirate, patients with BMPC <10% had a PFS that remained unreached, whereas those with BMPC >10% had a median PFS of 19.67 months (HR 0.3; 95% CI, 0.1–1.3; p=0.11). However, subgroup analysis based on CAR T-cell product revealed a statistically significant correlation in patients treated with cilta-cel, where those with BMPC <10% had a significantly prolonged PFS (HR 0.11; 95% CI, 0.01–0.9; p=0.04). In contrast, no significant association was observed in the ide-cel group, where patients with BMPC <10% had a median PFS similar to those with BMPC >10% (HR 1.1; 95% CI, 0.3–3.9; p=0.86) Supplementary Figure S2.
Pre-infusion/pre-LDC biomarkers associated with reduced overall survival
The median OS has not yet been reached in either treatment group. At 24 months, the estimated OS rate was 67% for patients treated with ide-cel and 74% for those receiving cilta-cel (Supplementary Figure S3).
Univariate analyses revealed no significant association between OS and variables such as age, cytogenetic risk, number of prior therapy lines, time from last treatment to CAR T-cell infusion, ALC at leukapheresis, percentage of plasma cells in the bone marrow pre-infusion, vein-to-vein time, or the use of tocilizumab or corticosteroids for CRS/ICANS management. However, there is an association between baseline ferritin levels and OS. Patients with ferritin levels < 337 mcg/L prior to CAR T-cell infusion had a prolonged OS (median not reached) compared to those with ferritin levels > 337 mcg/L, who had a hazard ratio (HR) of 0.12 (95% CI, 0.03–0.4; p=0.0061) (Figure 4). Similarly, patients with ferritin levels < 337 mcg/L pre-LDC exhibited a significantly longer OS (median not reached) compared to those with higher ferritin levels, who had a median OS of 8.3 months (HR 0.04; 95% CI, 0.009–0.18; p<0.0001) (Figure 4).
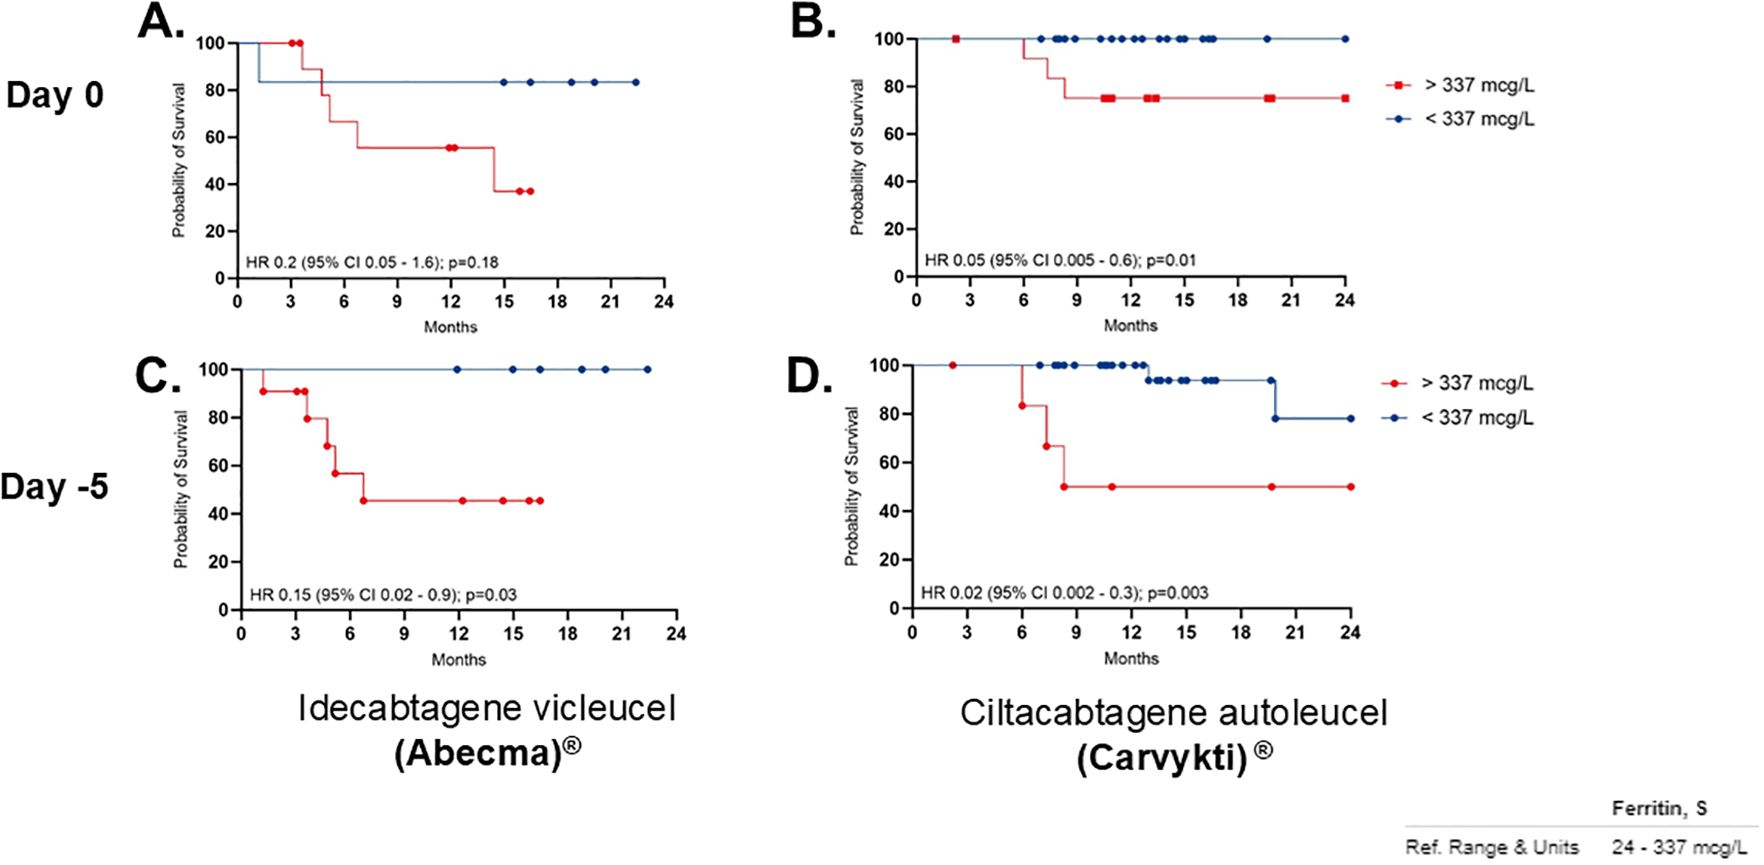
Figure 4. OS correlation per product with Low ferritin. Panel (A, C) show Idecabtagene vicleucel (Abecma), while (B, D) show Ciltacabtagene autoleucel (Carvykti). Red lines indicate ferritin levels above 337 micrograms per liter, and blue lines below. Significant differences in survival in patients with low ferritin levels specially with Carvykti. Ferritin reference range is 24 to 337 micrograms per liter.
CRP as an independent marker did not show a significant correlation with OS. Univariate analysis indicated that baseline CRP levels < 8 mg/L prior to CAR T-cell infusion did not correlate with improved OS, as the median OS remained unreached in both groups (HR 0.6; 95% CI, 0.18–2.2; p=0.26). Similarly, CRP levels < 8 mg/L pre-LDC did not demonstrate a significant association with OS, as the median OS was not reached across both groups (HR 0.4; 95% CI, 0.09–1.7; p=0.18) (Supplementary Figure S4).
Multivariate analysis found no significant association in patients that have both baseline ferritin < 337 mcg/L and CRP < 8 mg/L and OS when compared to patients with elevated ferritin (>337 mcg/L) and CRP (>8 mg/L) at baseline (median OS not reached in both groups, HR 0.4; 95% CI, 0.1–2.4; p=0.68). However, at the pre-LDC evaluation, patients with both ferritin and CRP levels below the established thresholds demonstrated a significantly longer OS (median not reached) compared to those with both biomarkers elevated, who had a median OS of 11.6 months (HR 0.05; 95% CI, 0.06–0.5; p=0.01) (Table 2, Supplementary Figure S5). Tumor burden, measured by percentage of bone marrow plasma cells (BMPCs) from aspirate at the time of CAR T-cell referral before leukapheresis, did not correlate with OS across the overall population. Using a 10% BMPC cutoff, the median OS was not reached in either subgroup (HR 0.4; 95% CI, 0.08–2.5; p=0.28) (Table 2).
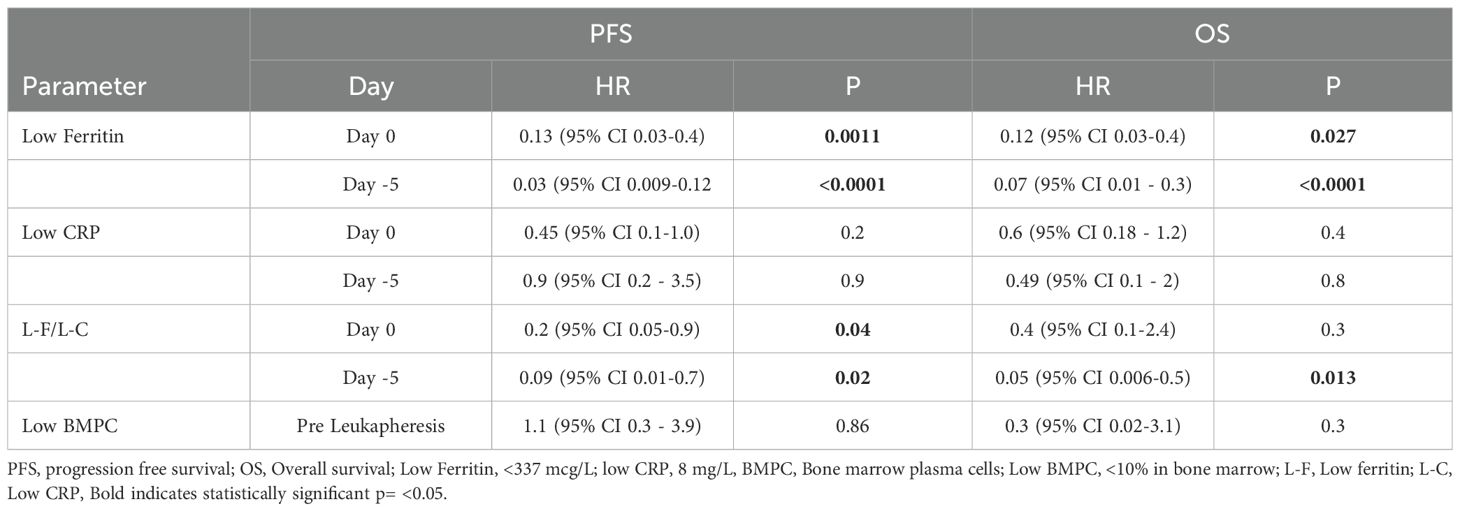
Table 2. Correlation of predictor biomarkers with response and survival.
Discussion
Predicting safety and efficacy outcomes with CAR T cell-therapy is critical given the high cost and resource-intensive nature of these treatments (19). Identifying reliable prognostic biomarkers is essential to enhance patient stratification, maximize therapeutic efficacy, and optimize outcomes. This study aims to evaluate the predictive potential of pre-infusion biomarkers, specifically ferritin and CRP, in improving patient selection and refining treatment strategies for individuals with RRMM.
The importance of assessing ferritin and CRP levels prior to CAR T-cell infusion is supported by existing literature, which highlights their potential role in predicting treatment outcomes (13, 20–23). High ferritin levels have been associated with greater disease burden and impaired CAR T-cell persistence, potentially due to antigen escape or checkpoint upregulation (8). Predictive models incorporating ferritin have shown utility in identifying patients at risk of early relapse, reinforcing its role as both a marker of inflammation and disease activity (12). Similarly, CRP is a well-established inflammatory biomarker, with prior studies demonstrating its association with increased toxicity and reduced survival in CAR T-cell-treated patients (17, 24). In our single-center study, we found that low ferritin level (<337 mcg/L) is correlated with improved PFS and OS, highlighting its potential as a predictive biomarker. In univariate analyses, this correlation remained significant both at baseline and pre-LDC, indicating that ferritin may serve as a predictive biomarker. In contrast, CRP alone did not show a significant correlation with either PFS or OS. However, when combined with low ferritin levels, CRP exhibited an enhanced predictive value for PFS, though this was not observed in OS outcomes during multivariate analysis at baseline. Notably, when low ferritin and CRP levels were measured at Day -5 (pre-LDC), their correlation with OS became statistically significant (HR 0.05; 95% CI, 0.006–0.5; p=0.01. This suggests that pre-LDC assessment of these biomarkers may provide a more accurate prognostic indicator of treatment efficacy and survival in RRMM patients undergoing CAR T-cell therapy. The nuanced relationship between ferritin and CRP further highlights the complex interplay of inflammatory biomarkers, indicating that while CRP alone may not be a strong predictor, it could be part of a broader panel of markers for risk assessment and treatment optimization. The efficacy of CAR T-cell therapy in our cohort was consistent with the outcomes reported in pivotal clinical trials for ide-cel and cilta-cel (5, 6). Notably, we observed significant differences in response rates between these two products, with cilta-cel demonstrating a superior overall response rate.
Our results align with previous work. A recent meta-analysis by Cheng and Song, which pooled data from eight retrospective studies involving 1077 R/R MM patients and demonstrated that high pre-infusion ferritin levels were significantly associated with poorer PFS (HR 2.15; 95% CI, 1.74–2.66; P<0.001) and OS (HR 2.86; 95% CI, 2.20–3.72; P<0.001) (16). Similarly, the Myeloma CAR-T Relapse (MyCARe) model developed by Gagelmann et al. incorporates ferritin alongside other disease and treatment-related variables to predict early relapse and survival after BCMA-directed CAR T-cell therapy, demonstrating applicability across different regions and products (12). Furthermore, Greenbaum et al. found that elevated pre-infusion ferritin and CRP levels, in combination with the EASIX score, were predictive of severe CAR T-cell-related toxicities, such as CRS and ICANS, in patients with hematologic malignancies, including multiple myeloma (13). These studies collectively underscore ferritin’s dual role as a prognostic marker for both survival outcomes and treatment-related toxicities, supporting its integration into comprehensive risk stratification models. However, the variability in ferritin cutoffs across studies, as noted by Cheng and Song, highlights the need for standardized thresholds to facilitate clinical implementation. Incorporating ferritin and CRP into multifactorial predictive tools, such as the MyCARe model or toxicity risk scores, could enhance patient selection and guide pre-treatment strategies to mitigate both relapse and toxicity risks in RRMM patients undergoing CAR T-cell therapy (12, 13, 16).
The safety profile of CAR T-cell therapy in this study was consistent with previous reports, with cytokine release syndrome (CRS) and immune effector cell-associated neurotoxicity syndrome (ICANS) occurring at expected rates (25–27). Importantly, no cases of macrophage activation syndrome (MAS) or delayed neurotoxicity were observed, supporting the feasibility of administering these therapies in well-selected patient populations. However, we acknowledge the need for longer follow-up to assess potential late-onset toxicities, which have been reported in prior studies on cellular therapies (28).
Additionally, our study explored the role of tumor burden as a potential prognostic factor, particularly in patients treated with cilta-cel. While tumor burden did not predict treatment outcomes in the entire cohort, subgroup analysis revealed a significant correlation in cilta-cel-treated patients, suggesting that this product may be more effective in overcoming a higher tumor burden than ide-cel in a comparable myeloma population. These findings emphasize the importance of comprehensive pre-treatment assessments, integrating biomarker data with clinical indicators to refine patient selection for cilta-cel therapy. Bridging therapy was not associated with a statistically significant difference in outcomes for either CAR T-cell construct.
We acknowledge the limitations of the retrospective study design and the unequal distribution of patients receiving cilta-cel (n=35) versus ide-cel (n=17), primarily driven by physician preference based on the perceived superior efficacy of cilta-cel. Although our sample size is limited, the question remains whether baseline ferritin and CRP levels could serve as surrogates for tumor burden. If so, strategies to reduce tumor burden prior to CAR T-cell administration may warrant further investigation. By inference, it appears that administering CAR T-cell therapy in patients with a lower tumor burden may yield superior outcomes, an assumption that requires further validation.
Collectively, our findings advocate for integrating ferritin into predictive models and leveraging multifactorial approaches with additional markers, such as CRP, to enhance patient stratification and improve clinical outcomes in RRMM CAR T-cell therapy. By expanding our understanding of prognostic biomarkers, we can optimize patient selection for this expensive and complex treatment, ensuring that only the most suitable candidates receive CAR T-cell therapy, including those with lower tumor burden before leukapheresis. Further research is necessary to validate these findings and elucidate the underlying biological mechanisms that may guide future therapeutic strategies in multiple myeloma.
Data availability statement
The raw data supporting the conclusions of this article will be made available by the authors, without undue reservation.
Ethics statement
The studies involving humans were approved by Mayo Clinic Institutional Review Board – Arizona. The studies were conducted in accordance with the local legislation and institutional requirements. Written informed consent for participation was not required from the participants or the participants’ legal guardians/next of kin in accordance with the national legislation and institutional requirements.
Author contributions
EM-C: Conceptualization, Data curation, Formal Analysis, Investigation, Methodology, Visualization, Writing – original draft, Writing – review & editing. MA: Conceptualization, Data curation, Methodology, Writing – original draft, Writing – review & editing. DM-G: Writing – review & editing. JF-A: Writing – review & editing. RP: Data curation, Writing – review & editing. DB: Visualization, Writing – review & editing. UY: Writing – review & editing. JW-N: Writing – review & editing. LB: Writing – review & editing. SC: Writing – review & editing. RF: Funding acquisition, Resources, Writing – review & editing. JC: Supervision, Writing – review & editing.
Funding
The author(s) declare financial support was received for the research and/or publication of this article. This research was supported in part by the Mayo Clinic Hematological Malignancies Program, as well as by generous funding from Paula and Rodger Riney Foundation and other philanthropic contributions to Mayo Clinic. Additional support was provided by the NCI U01CA271410 grant.
Conflict of interest
The authors declare that the research was conducted in the absence of any commercial or financial relationships that could be construed as a potential conflict of interest.
The author(s) declared that they were an editorial board member of Frontiers, at the time of submission. This had no impact on the peer review process and the final decision.
Generative AI statement
The author(s) declare that no Generative AI was used in the creation of this manuscript.
Publisher’s note
All claims expressed in this article are solely those of the authors and do not necessarily represent those of their affiliated organizations, or those of the publisher, the editors and the reviewers. Any product that may be evaluated in this article, or claim that may be made by its manufacturer, is not guaranteed or endorsed by the publisher.
Author disclaimer
The content is solely the responsibility of the authors and does not necessarily represent the official views of the National Institutes of Health.
Supplementary material
The Supplementary Material for this article can be found online at: https://www.frontiersin.org/articles/10.3389/frhem.2025.1618331/full#supplementary-material
References
1. Kazmi SM, Nusrat M, Gunaydin H, Cornelison AM, Shah N, Kebriaei P, et al. Outcomes among high-risk and standard-risk multiple myeloma patients treated with high-dose chemotherapy and autologous hematopoietic stem-cell transplantation. Clin Lymphoma Myeloma Leuk. (2015) 15:687–93. doi: 10.1016/j.clml.2015.07.641
2. Lin Y, Qiu L, Usmani S, Joo CW, Costa L, Derman B, et al. Consensus guidelines and recommendations for the management and response assessment of chimeric antigen receptor T-cell therapy in clinical practice for relapsed and refractory multiple myeloma: a report from the International Myeloma Working Group Immunotherapy Committee. Lancet Oncol. (2024) 25(8):e374–87. doi: 10.1016/S1470-2045(24)00094-9
3. Bhatt P, Kloock C, and Comenzo R. Relapsed/refractory multiple myeloma: A review of available therapies and clinical scenarios encountered in myeloma relapse. Curr Oncol. (2023) 30:2322–47. doi: 10.3390/curroncol30020179
4. Kegyes D, Constantinescu C, Vrancken L, Rasche L, Gregoire C, Tigu B, et al. Patient selection for CAR T or BiTE therapy in multiple myeloma: Which treatment for each patient? J Hematol Oncol. (2022) 15:78. doi: 10.1186/s13045-022-01296-2
5. Berdeja JG, Madduri D, Usmani SZ, Jakubowiak A, Agha M, Cohen AD, et al. Ciltacabtagene autoleucel, a B-cell maturation antigen-directed chimeric antigen receptor T-cell therapy in patients with relapsed or refractory multiple myeloma (CARTITUDE-1): a phase 1b/2 open-label study. Lancet. (2021) 398:314–24. doi: 10.1016/S0140-6736(21)00933-8
6. Munshi NC, Anderson LD, Shah N, Madduri D, Berdeja J, Lonial S, et al. Idecabtagene vicleucel in relapsed and refractory multiple myeloma. N Engl J Med. (2021) 384:705–16. doi: 10.1056/NEJMoa2024850
7. Sheykhhasan M, Ahmadieh-Yazdi A, Vicidomini R, Poondla N, Tanzadehpanah H, Dirbaziyan A, et al. CAR T therapies in multiple myeloma: unleashing the future. Cancer Gene Ther. (2024) 31:667–86. doi: 10.1038/s41417-024-00750-2
8. Zhang X, Zhang H, Lan H, Wu J, and Xiao Y. CAR-T cell therapy in multiple myeloma: Current limitations and potential strategies. Front Immunol. (2023) 14:1101495. doi: 10.3389/fimmu.2023.1101495
9. Xu H, Li N, Wang G, and Cao Y. Predictive short/long-term efficacy biomarkers and resistance mechanisms of CD19-directed CAR-T immunotherapy in relapsed/refractory B-cell lymphomas. Front Immunol. (2023) 14:1110028. doi: 10.3389/fimmu.2023.1110028
10. Tedesco VE and Mohan C. Biomarkers for predicting cytokine release syndrome following CD19-targeted CAR T cell therapy. J Immunol. (2021) 206:1561–8. doi: 10.4049/jimmunol.2001249
11. Levstek L, Janžič L, Ihan A, and Kopitar AN. Biomarkers for prediction of CAR T therapy outcomes: current and future perspectives. Front Immunol. (2024) 15:1378944. doi: 10.3389/fimmu.2024.1378944
12. Gagelmann N, Dima D, Merz M, Hashmi H, Ahmed N, Tovar N, et al. Development and validation of a prediction model of outcome after B-cell maturation antigen-directed chimeric antigen receptor T-cell therapy in relapsed/refractory multiple myeloma. J Clin Oncol. (2024) 42:1665–75. doi: 10.1200/JCO.23.02232
13. Greenbaum U, Strati P, Saliba RM, Torres J, Rondon G, Nieto Y, et al. CRP and ferritin in addition to the EASIX score predict CAR-T-related toxicity. Blood Adv. (2021) 5:2799–806. doi: 10.1182/bloodadvances.2021004575
14. Sandnes M, Ulvik RJ, Vorland M, and Reikvam H. Hyperferritinemia-A clinical overview. J Clin Med. (2021) 10(9):2008. doi: 10.3390/jcm10092008
15. Chen Y, Guo X, Zeng Y, Mo X, Hong S, He H, et al. Oxidative stress induces mitochondrial iron overload and ferroptotic cell death. Sci Rep. (2023) 13:15515. doi: 10.1038/s41598-023-42760-4
16. Cheng J and Song Y. Serum ferritin as a prognostic biomarker in CAR-T therapy for multiple myeloma: A meta-analysis. Biomol Biomed. (2025). doi: 10.17305/bb.2025.12129
17. Akhtar OS, Modi K, Kim J, Skelson L, Smith E, Al-Jumayli MA, et al. Simple score of albumin and CRP predicts high-grade toxicity in patients with multiple myeloma receiving CAR-T therapy. Transplant Cell Ther. (2024) 30:283.e1–.e10. doi: 10.1016/j.jtct.2023.12.010
18. Kumar SK and Rajkumar SV. The multiple myelomas - current concepts in cytogenetic classification and therapy. Nat Rev Clin Oncol. (2018) 15:409–21. doi: 10.1038/s41571-018-0018-y
19. Chacim S, Monjardino T, Cunha JL, Medeiros P, Redondo P, Bento MJ, et al. Costs, effectiveness, and safety associated with Chimeric Antigen Receptor (CAR) T-cell therapy: Results from a comprehensive cancer center. PloS One. (2022) 17:e0278950. doi: 10.1371/journal.pone.0278950
20. Harb R, Coverdell TC, Shalabi H, and Shah NN. Diagnostic pitfalls in assessment of ferritin following CAR-T-cell therapy: Understanding the hook effect. Pediatr Blood Cancer. (2024) 71:e31171. doi: 10.1002/pbc.31171
21. Melody M, Rahman ZA, Saunders H, Diaz PL, Gannon N, Rosenthal A, et al. C-reactive protein and ferritin levels and length of intensive care unit stay in patients with B-cell lymphomas treated with axicabtagene ciloleucel. Hematol/Oncol Stem Cell Ther. (2020) 14(2):141–6. doi: 10.1016/j.hemonc.2020.09.004
22. Karschnia P, Jordan JT, Forst DA, Arrillaga-Romany IC, Batchelor TT, Baehring JM, et al. Clinical presentation, management, and biomarkers of neurotoxicity after adoptive immunotherapy with CAR T-cells. Blood. (2019) 133(20):2212–21. doi: 10.1182/blood-2018-12-893396
23. Teachey DT, Lacey SF, Shaw PA, Melenhorst JJ, Maude SL, Frey N, et al. Identification of predictive biomarkers for cytokine release syndrome after chimeric antigen receptor T-cell therapy for acute lymphoblastic leukemia. Cancer Discov. (2016) 6:664–79. doi: 10.1158/2159-8290.CD-16-0040
24. Melody M, Abdel-Rahman Z, Saunders H, Diaz PL, Gannon N, Rosenthal A, et al. Relationship of CRP and ferritin levels and length of ICU stay in patients with B-cell lymphomas treated with axicabtagene ciloleucel (axi-cel). Biol Blood Marrow Transplantation. (2020) 26:S270–S1. doi: 10.1016/j.bbmt.2019.12.439
25. Elmarasi M, Elkonaissi I, Elsabagh AA, Elsayed E, Elsayed A, Elsayed B, et al. CAR-T cell therapy: Efficacy in management of cancers, adverse effects, dose-limiting toxicities and long-term follow up. Int Immunopharmacol. (2024) 135:112312. doi: 10.1016/j.intimp.2024.112312
26. Rejeski K, Subklewe M, and Locke FL. Recognizing, defining, and managing CAR-T hematologic toxicities. Hematol Am Soc Hematol Educ Program. (2023) 2023:198–208. doi: 10.1182/hematology.2023000472
27. McNerney KO, DiNofia AM, Teachey DT, Grupp SA, and Maude SL. Potential role of IFNγ Inhibition in refractory cytokine release syndrome associated with CAR T-cell therapy. Blood Cancer Discov. (2022) 3:90–4. doi: 10.1158/2643-3230.BCD-21-0203
28. Martin T, Usmani SZ, Berdeja JG, Agha M, Cohen AD, Hari P, et al. Ciltacabtagene autoleucel, an anti-B-cell maturation antigen chimeric antigen receptor T-cell therapy, for relapsed/refractory multiple myeloma: CARTITUDE-1 2-year follow-up. J Clin Oncol. (2023) 41:1265–74. doi: 10.1200/JCO.22.00842
Keywords: CAR T cell, multiple myeloma, ferritin, C reactive protein (CRP), ciltacabtagene autoleucel, idecabtagene vicleucel
Citation: Moreno-Cortes EF, Arribas M, Martinez-Gamboa DA, Figueroa-Aguirre J, Patel R, Bihnam D, Yadav U, Wiedmeier-Nutor JE, Bergsagel L, Chhabra S, Fonseca R and Castro JE (2025) Pre-infusion ferritin a predictive biomarker for CAR T-cell therapy in R/R multiple myeloma. Front. Hematol. 4:1618331. doi: 10.3389/frhem.2025.1618331
Received: 25 April 2025; Accepted: 10 July 2025;
Published: 14 August 2025.
Edited by:
John Strouboulis, King’s College London, United KingdomReviewed by:
Li Xiaoyang, Shanghai Jiao Tong University, ChinaReuben Benjamin, King’s College London, United Kingdom
Copyright © 2025 Moreno-Cortes, Arribas, Martinez-Gamboa, Figueroa-Aguirre, Patel, Bihnam, Yadav, Wiedmeier-Nutor, Bergsagel, Chhabra, Fonseca and Castro. This is an open-access article distributed under the terms of the Creative Commons Attribution License (CC BY). The use, distribution or reproduction in other forums is permitted, provided the original author(s) and the copyright owner(s) are credited and that the original publication in this journal is cited, in accordance with accepted academic practice. No use, distribution or reproduction is permitted which does not comply with these terms.
*Correspondence: Januario E. Castro, Y2FzdHJvLmphbnVhcmlvQG1heW8uZWR1