 Andrew R. Dykstra1,2*
 Eric Halgren3,4 Thomas Thesen5 Chad E. Carlson5 Werner Doyle5 Joseph R. Madsen6 Emad N. Eskandar7
 Sydney S. Cash2
- 1 Program in Speech and Hearing Bioscience and Technology, Harvard-MIT Division of Health Sciences and Technology, Cambridge, MA, USA
- 2 Cortical Physiology Laboratory, Department of Neurology, Massachusetts General Hospital and Harvard Medical School, Boston, MA, USA
- 3 Department of Radiology, University of California San Diego, San Diego, CA, USA
- 4 Department of Neurosciences, University of California San Diego, San Diego, CA, USA
- 5 Comprehensive Epilepsy Center, New York University School of Medicine, New York, NY, USA
- 6 Department of Neurosurgery, Brigham and Women’s Hospital and Harvard Medical School, Boston, MA, USA
- 7 Department of Neurosurgery, Massachusetts General Hospital and Harvard Medical School, Boston, MA, USA
The auditory system must constantly decompose the complex mixture of sound arriving at the ear into perceptually independent streams constituting accurate representations of individual sources in the acoustic environment. How the brain accomplishes this task is not well understood. The present study combined a classic behavioral paradigm with direct cortical recordings from neurosurgical patients with epilepsy in order to further describe the neural correlates of auditory streaming. Participants listened to sequences of pure tones alternating in frequency and indicated whether they heard one or two “streams.” The intracranial EEG was simultaneously recorded from sub-dural electrodes placed over temporal, frontal, and parietal cortex. Like healthy subjects, patients heard one stream when the frequency separation between tones was small and two when it was large. Robust evoked-potential correlates of frequency separation were observed over widespread brain areas. Waveform morphology was highly variable across individual electrode sites both within and across gross brain regions. Surprisingly, few evoked-potential correlates of perceptual organization were observed after controlling for physical stimulus differences. The results indicate that the cortical areas engaged during the streaming task are more complex and widespread than has been demonstrated by previous work, and that, by-and-large, correlates of bistability during streaming are probably located on a spatial scale not assessed – or in a brain area not examined – by the present study.
Introduction
The auditory system is constantly faced with the challenge of decomposing the complex mixture of sound arriving at the eardrums into an accurate representation of the acoustic environment. This decomposition, termed auditory scene analysis (ASA, Bregman, 1994), is critical for survival and communication and its failure is a common symptom reported by elderly individuals and those with sensorineural hearing loss. Despite its importance in daily life, the neural mechanisms of auditory scene analysis remain unclear (Carlyon, 2004; Micheyl et al., 2007; Snyder and Alain, 2007b; Elhilali and Shamma, 2008; Nelken and Bar-Yosef, 2008; Bidet-Caulet and Bertrand, 2009; Winkler et al., 2009; Shamma and Micheyl, 2010; Shamma et al., 2010). One aspect of ASA – auditory streaming (the segregation of time-varying acoustic energy into distinct perceptual objects) – can be studied in a controlled setting using sequences of pure-tone triplets of the form ABA-ABA- (Miller and Heise, 1950; van Noorden, 1975; Bregman, 1994), where A and B denote tones of different frequencies separated by a silent gap (Figure 1A). Many psychophysical studies dating back to the 1950s have shown that when the frequency separation (ΔF) between the A and B tones is small, listeners hear the sequence as a single stream comprised of both A and B tones and that when ΔF is large, they hear the sequence as two isochronous streams, one of A tones and one of B tones (Miller and Heise, 1950; van Noorden, 1975; see http://web.mit.edu/∼adykstra/Public/streaming_demo.wav for a demo). Interestingly, percepts evoked by sequences with intermediate ΔF are bistable (i.e., can be heard as either one stream or two) and can switch between two stable states, either spontaneously or with effort (van Noorden, 1975; Anstis and Saida, 1985; Carlyon et al., 2001).
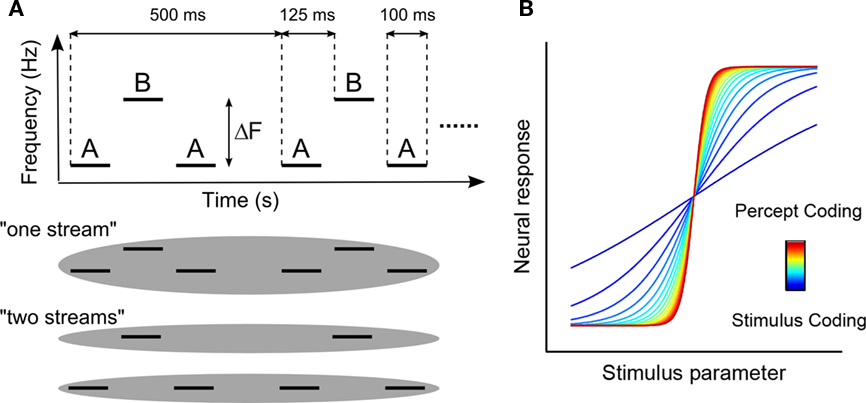
Figure 1. Behavioral paradigm and conceptual model. (A) Schematic illustration of the alternating-tone stimuli used in the experiment and how those stimuli are perceptually organized by the listener. The frequency of the B-tone was held constant at 1000 Hz and the frequency separation between the A- and B- tone varied between 0 and 12 semitones, resulting in A-tone frequencies between 500 and 1000 Hz. (B) Conceptual model of varying neural responses to parametric manipulation of the acoustic parameter (frequency separation). A linear variation of the neural response is to be expected if that response is coding the stimulus parameter, whereas a sigmoidal (i.e., categorical) response is to be expected if the response is coding the percept directly.
Recent interest in the neural underpinnings of auditory streaming has produced several studies using ABA tone sequences while recording from the auditory cortex in a variety of species including insects (Schul and Sheridan, 2006), fish (Fay, 1998, 2000), bats (Kanwal et al., 2003), songbirds (Bee and Klump, 2004, 2005; Itatani and Klump, 2009, 2010; Bee et al., 2010), ferrets (Elhilali et al., 2009), non-human primates (Fishman et al., 2001, 2004; Micheyl et al., 2005), and humans (Sussman et al., 1999; Deike et al., 2004, 2010; Cusack, 2005; Gutschalk et al., 2005, 2007; Snyder et al., 2006; Snyder and Alain, 2007a; Wilson et al., 2007; Kondo and Kashino, 2009; Schadwinkel and Gutschalk, 2010a,b). A prevailing model from these studies posits that a two-stream percept will be evoked whenever the A and B tones excite non-overlapping populations of neurons (but see Elhilali et al., 2009). However, inherent limitations in previous work related to spatiotemporal resolution, sparsity of coverage, and lack of direct behavioral measures in experimental animals preclude straight-forward interpretation. A general extension of this model is schematized in Figure 1B. Specifically, a parametric variation of a given stimulus or stimulus feature could produce neural activity patterns which vary linearly or categorically as shown by the blue and red curves, respectively. Noise in the response of a population showing a linear relationship with the stimulus, when fed to a population showing a more categorical relationship, could engender sufficient trial-to-trial variability for bistable perception. While such activity patterns have been widely reported in vision (for reviews see Logothetis, 1998; Leopold and Logothetis, 1999; Sterzer et al., 2009), only limited evidence for such a mechanism exists in the auditory system (Cusack, 2005; Gutschalk et al., 2005, 2008; Kondo and Kashino, 2009).
Here, we report the results from experiments in which direct cortical recordings were made from widespread brain areas of neurosurgical patients with epilepsy (Engel et al., 2005) while they participated in a classical auditory streaming paradigm. Our aims were to better characterize the neurophysiological correlates of auditory streaming, extend them into brain areas outside the auditory cortex and frequency regions less observable with non-invasive measure (Crone et al., 2001), and test the idea of neuronal variability as a mechanism for perceptual bistability in the auditory modality (Almonte et al., 2005; Moreno-Bote et al., 2007; Deco and Romo, 2008; Deco et al., 2008; Gigante et al., 2009; Shpiro et al., 2009) by comparing evoked responses to physically identical stimuli when they were perceived as one vs. two streams. Our participants listened to ABA tone sequences and indicated at the end of each sequence whether they were hearing one or two streams at the end of the sequence. For each electrode sampled in a given patient, we compared responses across ΔF conditions as well as perceptual report in an attempt to identify correlates of both during a classical auditory streaming task. We hypothesized that when a participant perceived one (two) stream(s), the evoked response would be similar to those conditions which consistently engender a one-stream (two-stream) percept. Responses from widespread brain areas showed robust correlates with ΔF but, surprisingly, rarely differed based on percept per se.
Materials and Methods
Ethics Statement
All procedures were approved by the Institutional Review Boards at Partners Healthcare (MGH and BWH), the New York University (NYU) Langone Medical Center, and the Massachusetts Institute of Technology (MIT) in accordance with NIH guidelines. Written informed consent was obtained from all patients prior to their participation.
Listeners
Twelve patients with intractable epilepsy underwent invasive monitoring in order to localize the epileptogenic zone prior to its surgical removal. Each patient was implanted with an array of sub-dural platinum–iridium electrodes embedded in silastic sheets (2.3 mm exposed diameter, 10 mm center-to-center spacing; Ad-tech Medical, Racine, WI, USA) placed directly on the cortical surface. Prior to implantation, each patient underwent high-resolution T1-weighted MRI. Subsequent to implantation, patients implanted at Massachusetts General Hospital (MGH) and Brigham and Women’s Hospital (BWH) underwent post-operative computerized tomography (CT); patients implanted at NYU underwent post-operative MRI. Electrode coordinates obtained from post-operative scans were co-registered with preoperative MRI and overlaid onto the patient’s reconstructed cortical surface using FreeSurfer (Dale et al., 1999; Fischl et al., 1999a) and custom MATLAB (The MathWorks, Framingham, MA, USA) scripts (Dykstra et al., under review; Wang et al., personal communication, Comprehensive Epilepsy Center, NYU School of Medicine). Electrode coordinates were then projected onto the FreeSurfer average brain using a spherical registration between the individual’s cortical surface and that of the FreeSurfer average (Fischl et al., 1999b). The data from three patients were excluded from analysis due to excessive noise caused by technical malfunction; the data reported here were from the remaining nine patients (Table 1).
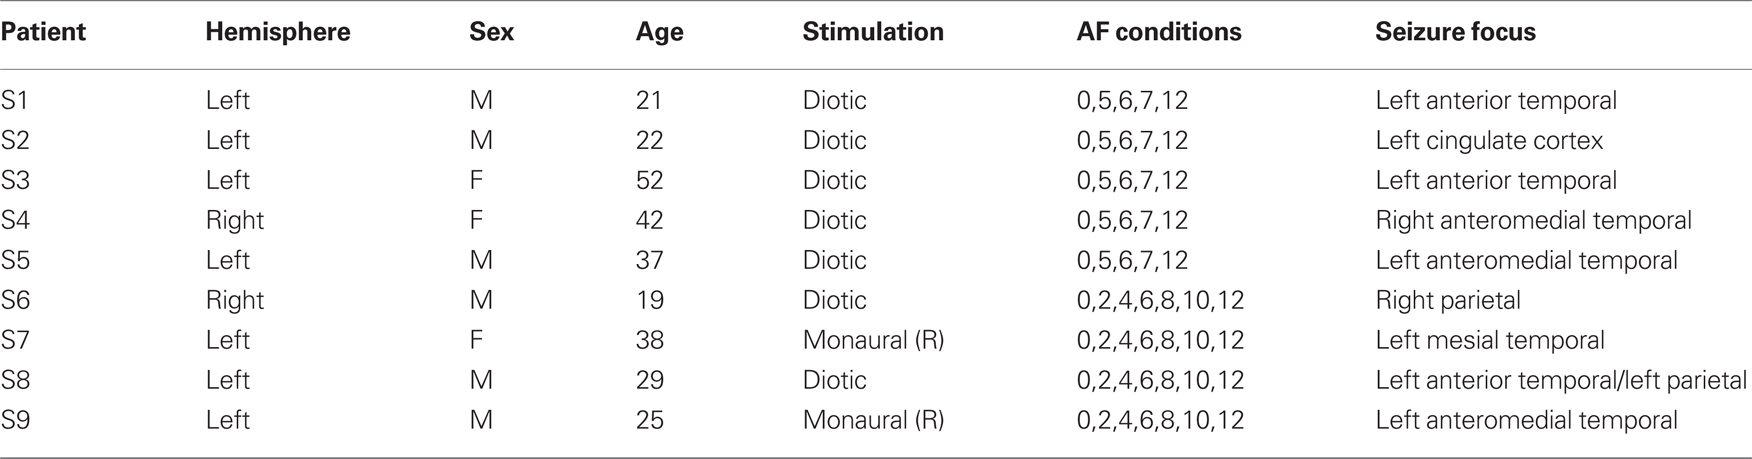
Table 1. Patient information.
Stimuli and Procedure
Stimuli were long sequences of pure-tone triplets of the form ABA-ABA-..., where A and B represent individual tones and the dash represents a silent gap (Figure 3A). Each tone was 100 ms in duration with 10 ms raised-cosine on- and off-ramps. The inter-stimulus interval (ISI) between the first A-tone and B-tone, as well as between the B-tone and second A-tone, was 25 ms; the ISI between the second A-tone and subsequent triplet was 150 ms. Stimulus onset asynchrony (SOA) between successive A tones was 250 ms; SOA between successive B tones was 500 ms; triplet onset asynchrony was also 500 ms. Total duration of each sequence varied between 6.5 and 10 s (13 and 20 triplets, respectively) depending on the listener (for P1–P5, duration varied between 6.5 and 7.5 s; for P6–P9, duration was 10 s). The B-tone frequency was fixed at 1 kHz. The A-tone frequency varied between 0 and 12 semitones below the B-tone. Listeners P1, P2, P3, P4, and P5 participated in conditions in which the frequency separation was 0, 5, 6, 7, or 12 semitones, where 1 semitone is an approximately 6% frequency difference. Listeners P6, P7, P8, and P9 participated in conditions in which the frequency separation was 0, 2, 4, 6, 8, 10, or 12 semitones. Each patient listened to between 200 and 378 triplets for a given frequency separation. All sounds were generated digitally in MATLAB, stored as .wav files, and converted to analog waveforms by the on-board soundcard of a laptop equipped with Presentation software (Neurobehavioral Systems, Albany, CA, USA). Stimuli were presented at a comfortable listening level via Etymotic ER-2 insert earphones (Etymotic Research, Inc., Elk Grove Village, IL, USA), diotically (when possible) or monaurally contralateral to the hemisphere of implantation. Patients were instructed to listen to the sounds and to indicate at the end of each sequence whether, at the end of the sequence, they were hearing a single “stream” comprised of all tones or two “streams,” one comprised of A tones and the other of B tones. Responses were made by button press with a response box (Cedrus Corporation, San Pedro, CA, USA) interfaced with Presentation via USB. Response windows were unconstrained, and the subsequent stimulus began 1 s after a response to the previous stimulus was entered.
Data Acquisition
Intracranial EEG (iEEG) data at MGH and BWH were acquired with standard clinical EEG monitoring equipment (XLTEK, Natus Medical Inc., San Carlos, CA, USA) at a sampling rate of 250 Hz (P1) or 500 Hz (P2,P3,P6,P8). At NYU, iEEG data were acquired with a customized system at a sampling rate of 30 kHz (P4,P5,P7,P9). All data were subsequently re-sampled to 500 Hz for analysis. All data were referenced to either an inverted intracranial electrode (i.e., facing the inner skull table) remote from the electrodes of interest (P1,P2,P3,P6,P8) or a screw bolted to the skull (P4,P5,P7,P9). For each patient, clinically indicated, high-resolution T1-weighted structural MRI scans were acquired prior to surgery. High-resolution CT (P1,P2,P3,P6,P8) or structural MRI (P4,P5,P7,P9) scans were acquired subsequent to surgery for the purpose of electrode localization.
Data Pre-Processing
Intracranial EEG data were bandpass filtered offline between 1 and 190 Hz and notch filtered at 60 Hz and its harmonics using zero-phase shift FIR filters. Independent component analysis using the runica algorithm (Bell and Sejnowski, 1995) in EEGLAB (Delorme and Makeig, 2004) was performed on the “raw” data. Components dominated by large artifacts were identified and removed by inspection. The component data were then back-projected in order to remove the artifacts from the original data.
The iEEG was epoched relative to the onset of sound sequences (yielding long epochs encompassing the entire sequence) as well as to the onset of individual ABA triplets (yielding short epochs of 0.5 s) and binned with respect to either ΔF or perceptual report within a given ΔF. For triplet-locked epochs, the first triplet in each sequence was discarded. Epochs were baseline corrected with respect to either the 500-ms preceding sequence onset (for sequence-locked epochs) or the 50-ms preceding triplet onset (for triplet-locked epochs). Epochs containing large artifacts were rejected automatically using joint probability and kurtosis algorithms in EEGLAB (Delorme et al., 2007). Specifically, trials with joint probabilities or kurtosis values more than four and five SDs from the normalized mean of these measures, respectively, were rejected as artifact. Additional epochs found to contain large epileptiform activity were rejected by visual inspection.
Statistical Analysis
A modified version of the cluster-based, non-parametric statistical procedure outlined by Maris and Oostenveld (2007) was used to test for effects of ΔF and bistability on triplet-locked EP amplitude. Spearman (non-parametric) rank correlation (in the case of a multiple-level factor, e.g., ΔF) and unpaired t-test (in the case of two-level factors, e.g., percept) were used as the sample-level (i.e., individual time point within a single channel) statistics in order to evaluate possible effects of ΔF (five levels for P1–P5 and seven levels for P6–P9) and bistability (always two levels), respectively. Contiguous, statistically significant samples (defined as p < 0.05) within a single electrode were used to define the cluster-level statistic, which was computed by summing the sample-level statistics within a cluster. Statistical significance at the cluster-level was determined by computing a Monte Carlo estimate of the permutation distribution of cluster statistics using 1000 re-samples of the original data (Ernst, 2004). For multiple-level factors (ΔF), the estimate of the permutation distribution was performed by 1000 re-samples of the condition labels associated with each level in the factor. Within a single electrode, a cluster was taken to be significant if it fell outside the 95% confidence interval of the permutation distribution for that electrode. The determination of significant clusters was performed independently for each electrode. This method controls the overall false alarm rate within an electrode across time points; no correction for multiple comparisons was performed across electrodes.
Due to the known buildup effects of auditory streaming (i.e., 2-stream percepts become more likely as time since sequence onset increases and the fact that listeners only reported what they heard at the end of each stimulus sequence, two independent analyses were carried out. The first used only the data from the second half of each sequence while the second used all data after removing the onset response (0–0.5 s after stimulus onset). The method of analysis did not effect the results, and only the results from the second analysis are shown.
Dissimilarity Index
In order to further evaluate possible effects of perceptual bistability on the evoked waveforms, we computed a dissimilarity index between waveforms from individual trials and a template waveform within individual channels in which significant EP–ΔF correlations were found. Qualitatively, this index is defined as the difference between the sum-squared error (SSE) computed for the condition of interest (i.e., a specific ΔF or percept) and the minimum SSE computed across all conditions, normalized by the difference between the maximum SSE and minimum SSE computed across all conditions. The index was computed by normalizing the average SSE between the trial and the template, as follows:
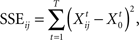
where X0 is the template waveform and Xij is the individual-trial waveform for trial i in condition j, t is the individual time point, and T is the overall number of significant time points in condition j. The average SSE for condition j was computed as:
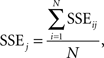
where N is the number of trials.
The index was then defined as:
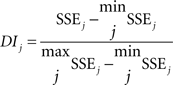
Except for trials from the 0-semitone condition, the template was defined as the average EP for the 0-semitone condition. The template to which individual trials from the 0-semitone condition were compared was the average EP from the 0-semitone condition including all waveforms but the one from the trial i (“leave one out”). This index provides a measure of how dissimilar two waveforms are from each other. Although this index is biased to show a significant correlation with ΔF, it provides a means to (i) collapse waveforms across individual electrode sites and patients into a single quantitative metric and (ii) quantitatively compare responses to one- vs. two-stream percepts in a way that circumvents variable latencies and durations of percept- or ΔF-based effects across sites.
High-Gamma–Power
Waveforms of high-gamma-power were constructed using the wavelet transforms built into EEGLAB (specifically, the newtimef function). Sequence-length (between 6.5 and 10 s) epochs were used to compute the event-related spectral perturbation (ERSP) which was baseline corrected to the 500-ms preceding stimulus onset. The number of wavelet cycles used varied logarithmically with respect to frequency from three cycles at the lowest frequency tested (5 Hz) to 10 at the highest (190 Hz), yielding approximate temporal resolution of <500 ms at 8 Hz and <125 ms in the gamma-band. High-gamma-power waveforms were constructed by summing the power in frequencies from 80–190 Hz for each time point in the full time–frequency representation. These waveforms were then baseline corrected by subtracting the mean power in each trial computed across the 500-ms preceding stimulus onset. Triplet-locked gamma-power epochs were constructed by time-locking with respect to each triplet onset and subsequently binned across the various ΔF and percept conditions in the same way as the evoked potentials. The same statistical procedures described above were applied to the high-gamma waveforms.
Results
Twelve patients with intractable epilepsy listened to sequences of alternating pure tones (Figure 1A) and indicated at the end of each sequence whether, at the end of the sequence, they were hearing the tones as grouped (“1 stream”) or segregated (“2 streams”) while we simultaneously recorded the intracranial EEG (Figure 2). Three patients were excluded from analysis for technical reasons (see Materials and Methods). Summed across the remaining nine patients (Table 1), we recorded from nearly 700 electrodes in the left hemisphere and 250 electrodes in the right hemisphere, mostly on lateral cortex of the temporal, frontal, and parietal lobes (Figure 2E).
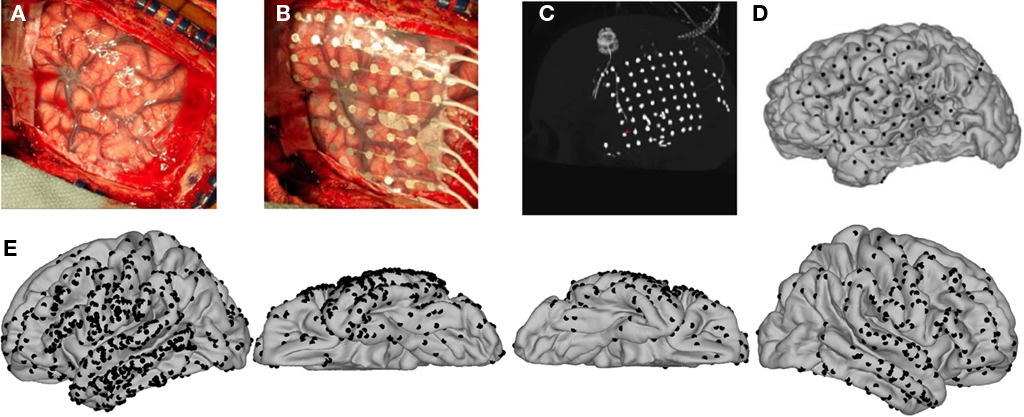
Figure 2. Intraoperative photographs, post-operative CT, and 3D registration of electrode coordinates on the cortical surface. (A,B) Intraoperative photographs showing the reflected dura, exposed pial surface, and overlaid electrode array (B) of an example subject who participated in the study. (C) Maximal-intensity projection of sagittally oriented CT scan showing all of the intracranial electrodes collapsed onto a single plane. (D) Electrodes overlaid onto a 3D rendering of the patient’s cortical surface. (E) Summary of all individual electrode sites. Electrode coordinates from all nine participants in the study were co-registered and overlaid onto the FreeSurfer average surface. In total, we sampled from nearly 1000 sites, mostly over lateral cortex.
Behavior
Figure 3 shows the probability of hearing two streams as a function of ΔF averaged across all nine patients included in the analysis. Patients reported hearing a single stream when the ΔF was small and two streams when ΔF was large. At intermediate ΔF, the percept was bistable, i.e., patients sometimes reported hearing one stream and sometimes reported hearing two streams. A Kruskal–Wallis test confirmed a main effect of ΔF (χ2(1,8) = 34.1; p < 0.0001).
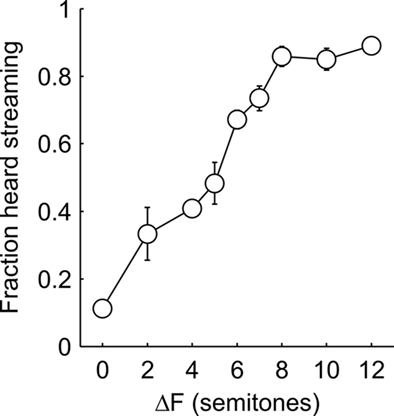
Figure 3. Behavioral results. Subjects heard one stream when the frequency separation was small and two when the frequency separation was large. Intermediate frequency separations perceptually bistable, i.e., perceived either as one or two streams. Error bars represent the SE of the mean across participants. 1 semitone = 8% frequency separation.
Evoked Potentials: ΔF
In order to assess putative correlates of streaming, we tested for correlations between triplet-locked evoked-potential (EP) amplitude and ΔF which, when parametrically varied, produced changes in how the sequences were perceptually organized. In light of the known effects of perceptual buildup in streaming tasks, two analyses were carried out: one using only the triplet-locked responses from the second half of each sequence and another using all the responses to all triplets save for the first (see Materials and Methods). The results did not differ based on which analysis was used, thus only the second analysis is reported here. Significant correlations were determined by cluster-based non-parametric permutation statistics (Materials and Methods). Figure 4 shows the average triplet-locked evoked responses across an 8 × 8 grid of electrodes for the different ΔF conditions from a single patient (P4). The positions of each electrode are overlaid onto the patient’s cortical surface rendering. Examples from other patients can be found in Appendix (Figures A3 and A4). As can be seen, waveform morphology was complex and highly variable between different electrode sites, yet evoked responses in varying time windows and spatial positions robustly correlated with ΔF. The majority of sites which showed strong correlations with ΔF were over or adjacent to the posterior superior temporal gyrus (pSTG). However, several other sites also showed responses which correlated with ΔF. The sites which showed significant ΔF correlations across all nine patients included in the analysis are summarized in Figure 5, where electrode sites from each individual have been overlaid onto a template brain by spherical surface registration of each patient’s pial surface with that of the FreeSurfer average (see Materials and Methods). Across patients, a widespread set of brain areas showing significant correlations with ΔF included pSTG (as was expected), middle temporal gyrus, pre- and post-central gyri (mainly ventrally), inferior and middle frontal gyri, and the supra-marginal gyrus.
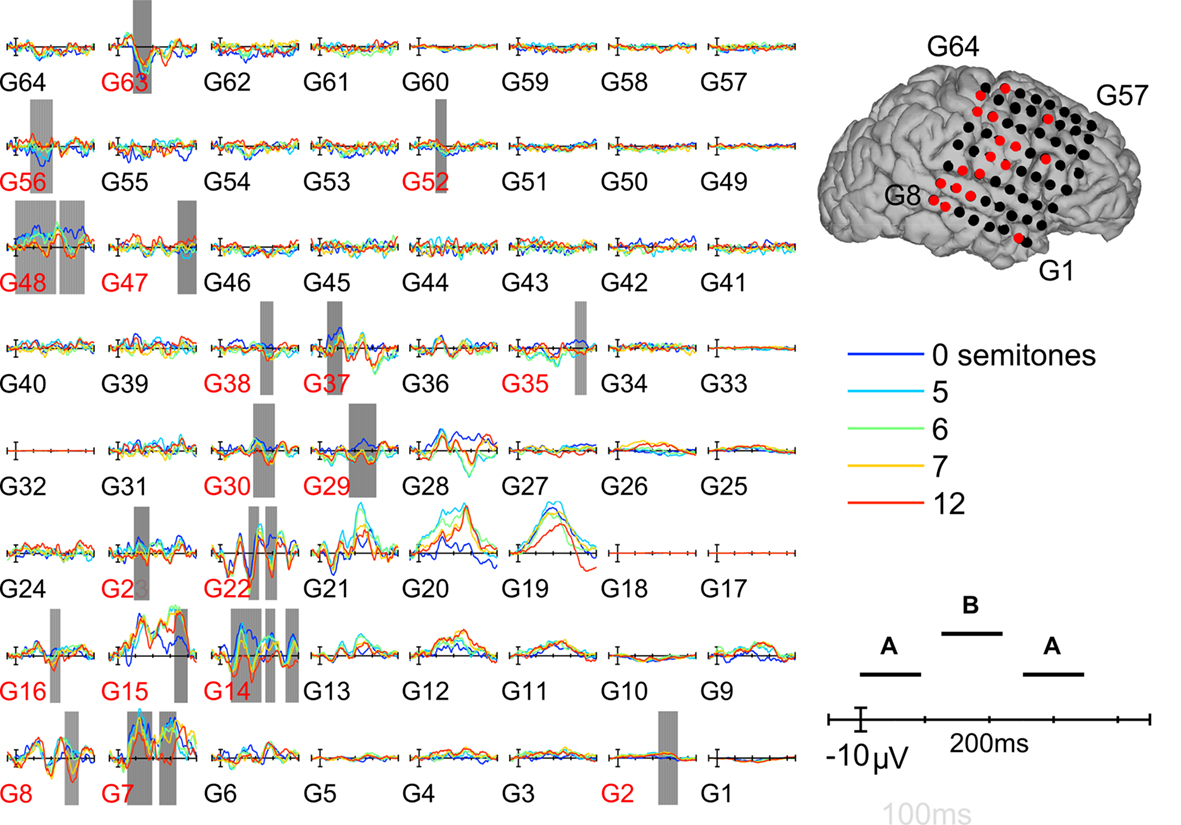
Figure 4. Example responses from an individual subject. Triplet-locked evoked potentials from an 8 x 8 electrode array over the right hemisphere whose configuration on the individual’s cortical surface is shown at right. Different frequency-separation conditions are represented by different color waveforms as shown in the lower right panel. Significant correlations between the acoustic parameter (frequency separation) and EP-amplitude are indicated by gray shading behind the waveforms. The responses showing significant correlations with frequency separation are also indicated by red text or dots underneath the waveforms or over the cortical surface, respectively.
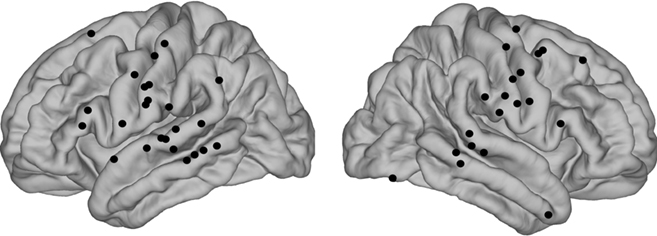
Figure 5. Summary of electrode sites that showed significant EP amplitude correlations with frequency separation.
Evoked Potentials: Bistable Perception
After having established significant correlations with a physical stimulus parameter (ΔF) known to produce changes in perceptual organization, we explicitly tested whether the same electrode sites showed significant triplet-locked EP differences based solely on how the sequences were perceptually organized (i.e., we compared EPs between sequences perceived as one stream vs. two streams within a given ΔF condition). For a given ΔF, responses were binned and averaged according to whether the listener reported hearing one or two streams. As for the analysis testing for effects of ΔF, two analyses were carried out; one using only the responses from the second half of each sequence and the other using responses from the entire sequence, expect for the first. Only the results from the second analysis are presented here. The results of this analysis for individual peri-STG sites across all nine patients are shown in Figure 6. The sites, overlaid onto each individual’s pial surface as shown in the top row, were chosen based on the fact that each showed a significant correlation with ΔF and was the site with largest triplet-locked RMS power in the vicinity of the pSTG. Responses to sequences that were perceptually bistable [defined as: 0.3 ≤ P(2-stream percept) ≤ 0.7] are shown by the blue (1-stream percepts) and red (2-stream percepts) traces; otherwise, traces are black. As can be seen, EP morphology was highly variable across individual subjects. Waveforms changed significantly as a function of ΔF as determined by Monte Carlo permutations using Spearman rank correlation as the sample-level statistic (see Materials and Methods), but, surprisingly, did not show significant differences based on percept per se. Across all the channels in the study, there were individual channels which showed significant differences based on percept, but this effect was inconsistent across the multiple ΔF conditions for which a bistable percept was evoked. In summary, several brain areas both within and outside of the auditory cortex showed evoked responses that significantly correlated with ΔF but not conscious perceptual organization.
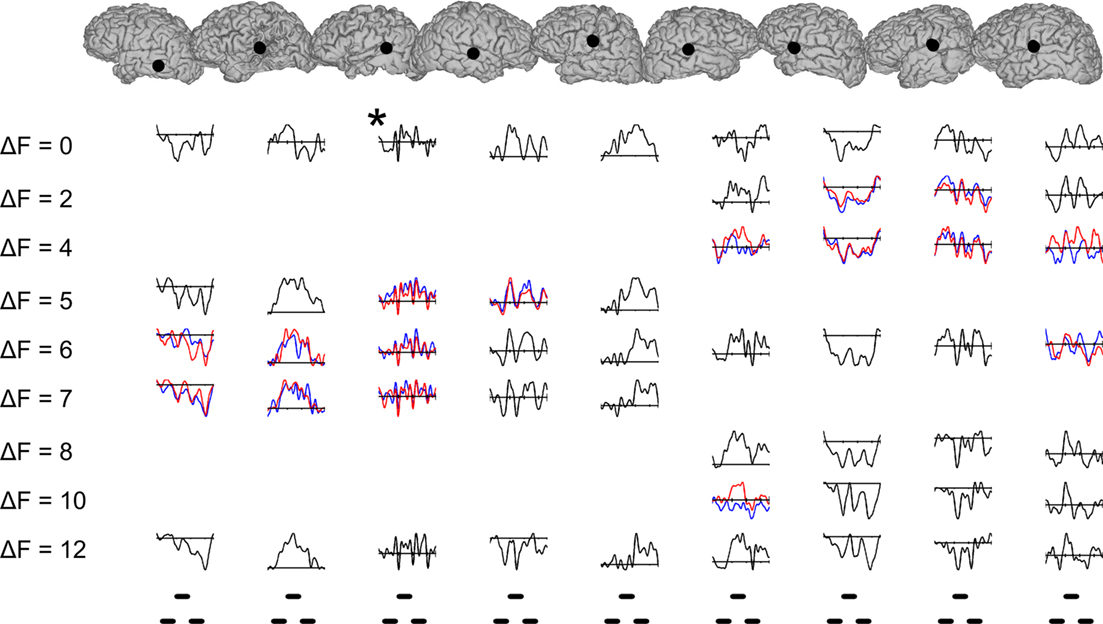
Figure 6. Evoked potentials from individual peri-Sylvian electrode sites in each of the nine subjects. Blue and red traces for a given frequency separation and subject indicate that the percept for that condition was bistable (*, this patient did not understand the task). Waveforms traced in black indicate that the percept for that condition was unstable. Electrode sites, shown in the top row over each subject’s cortical reconstruction, were chosen based on their having the largest RMS power grand-average triplet-locked evoked response in the vicinity of the superior temporal gyrus. The frequency separation (ΔF, semitones) for each set of waveforms is indicated in the left-most column. The timing of individual tones in the triplet is shown in the bottom row.
Dissimilarity Analysis
In order to further evaluate whether sites showing significant EP-ΔF correlations also showed correlates of perceptual bistability, we carried out a dissimilarity analysis using the grand-average triplet-locked response to the 0-semitone condition as the template. Responses from each ΔF condition were binned according to percept as well as collapsed across them and compared to the template by SSE (see Materials and Methods). Our hypothesis was that responses from conditions with greater ΔF – as well as responses from trials in which the subject reported hearing two streams – would show a larger “dissimilarity index” computed from the SSE between the response of interest and the template. Figure 7 shows the results of this analysis. The value of the dissimilarity index increased as ΔF increased (Spearman’s rho = 0.46, p < 0.0001) and, across all channels from all patients, showed a marginally significant difference based on percept alone (W+ = 3427, p = 0.097) in the expected direction (i.e., greater dissimilarity indices for 2- vs. 1-stream percepts), suggesting a propensity for activity during 2-stream percepts to be more similar to activity evoked by large ΔF conditions. However, a sufficient number of channels (23%) showed the opposite pattern so as to limit the statistical significance of the effect. Individually, across all sites which showed a significant correlation with ΔF (N = 44), four channels showed significant effects of percept on the dissimilarity index in the expected direction, while none showed a significant effect in the opposite direction. Three of those channels were from S4 [G30, G37, and a site over the left posterior STG (not shown)] whose data are shown in Figure 4, and the fourth was from a site over the inferior post-central gyrus in S1 (not shown). None of the four channels which showed significant percept-based differences in the dissimilarity index showed significant differences in the waveforms when evaluated directly.
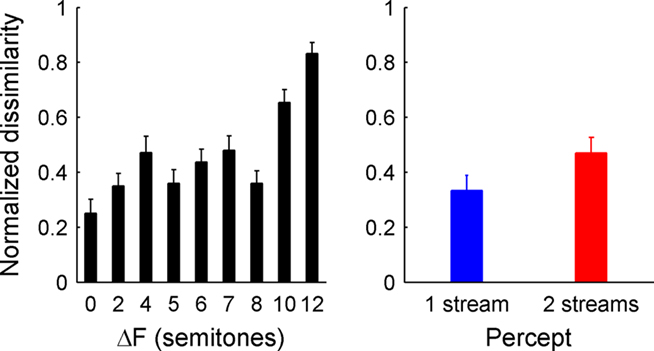
Figure 7. Dissimilarity index. The left panel shows the dissimilarity index as a function of frequency separation collapsed across percept. The right panel shows the dissimilarity index as a function of percept collapsed across ΔF conditions in which the percept was bistable. Error bars represent the SE of the mean across electrodes.
A complementary analysis was carried out using the grand-average triplet-locked response collapsed across all conditions as the template (Figure A1 in Appendix). Averaged evoked responses from each ΔF condition were binned according to percept as well as collapsed across them and compared to the template by SSE. Using this analysis, the dissimilarity index increased as ΔF increased [χ2(8,46) = 200.47, p < 0.0001] but, across all channels from all patients, did not differ based on percept alone (W+ = 1076, p = 0.33), confirming a significant main effect of ΔF and lack of a significant main effect of percept.
Gamma-Power Analysis
Two sets of triplet-locked high-gamma (80–190 Hz) power waveforms were constructed using either (i) wavelet transforms or (ii) analytic signal methods (see Materials and Methods). These waveforms were subjected to the same Monte Carlo permutation statistics as the triplet-locked evoked potentials to test for effects of either ΔF or percept. No significant effects were found (Figure A2 in Appendix).
Discussion
Combining a classical behavioral paradigm using long sequences of tones alternating in frequency and direct cortical recordings in humans, the present results demonstrate a widespread set of brain areas – mainly in posterosuperior temporal and peri-rolandic cortex, but also extending to the middle temporal gyrus as well as inferior and middle frontal gyri – putatively involved in auditory streaming. EP amplitude tightly correlated with ΔF, but did not consistently differ based on perceptual organization alone. Waveform morphology was highly variable within and across brain areas, suggestive of their having different roles in auditory stream formation.
Complex Meso-Scale Activity in the Auditory Cortex during Streaming
Results from previous M/EEG (Gutschalk et al., 2005, 2007; Snyder et al., 2006) and fMRI (Gutschalk et al., 2007; Wilson et al., 2007) studies of streaming have suggested either a uniform role for the whole of the auditory cortex in stream formation or that the majority of activity in response to stimuli similar to those used in the present study is localized on the superior temporal plane (either on Heschl’s gyrus or just posterior to it). The results from the present study demonstrate that, in addition to there being responses in higher auditory areas (i.e., lateral STG), the activity within a given macroscopic brain area is not uniform, a result that has also been noted by other investigators using evoked responses from iEEG with other classic auditory paradigms (Howard et al., 2000; Crone et al., 2001; Brugge et al., 2003, 2008; Edwards et al., 2005, 2009). This can be seen in the single-subject data shown in Figure 4, where the responses in adjacent electrode sites (e.g., G14 and G15 on the pSTG) indicate intra-areal variability in the response to the ABA-triplets.
This discrepancy may be due to several factors. First, the lead fields of the electrodes used to measure brain activity in the present study are more likely to measure responses from gyral crowns than from sulcal sources such as those located on the superior temporal plane (the area to where non-invasive studies have localized dipoles during streaming), although others have reported iEEG potentials interpreted to arise from sulci (Edwards et al., 2005; Acar et al., 2009; Whitmer et al., 2010). We observed little evidence for sources on the STP in that (i) there were very rarely clear polarity reversals across the lateral fissure and (ii) the earliest peak in the average response to sequence onset was >50 ms, later than the earliest response in the medial portion of the transverse gyrus of Heschl, which occurs at <25 ms (Liegeois-Chauvel et al., 1991). This last point does not preclude the possibility that some of the responses we measured arose from lateral portions of the STP, particularly in the N1-latency range (Gutschalk et al., 2005; Snyder et al., 2006). However, to us, this seems unlikely given point (i). Second, the responses we observed from the lateral STG could have radial source orientations, which would not be identified with MEG but could be with EEG. Indeed, Snyder et al. (2006) reported radially oriented sources which could have been localized to the STG. Third, although both aforementioned fMRI studies of streaming – as well as others (Deike et al., 2010) – reported activation maps with multiple foci of activation, the complex relationship between auditory-evoked responses and the fMRI BOLD signal (Mukamel et al., 2005; Gutschalk et al., 2010; Mayhew et al., 2010; Mulert et al., 2010, 2005; Steinmann and Gutschalk, 2011) as well as BOLD-fMRI’s low temporal resolution precludes a detailed characterization of areal sub-specialization. Fourth, and perhaps most likely, the activity recorded by EEG and, to a lesser extent, MEG, represents a spatially smoothed version of the true cortical source configuration (Halgren, 2004; Ahlfors et al., 2010), and does not tend to see brain activity having response variability with high spatial frequency, contrary to the locally generated signals measured by intracranial EEG.
The Role of Extra-Auditory Areas in Streaming
The present study is the first to report brain activity from extra-auditory cortical areas with high temporal resolution during the streaming paradigm. As shown in Figures 5 and 6, evoked potentials from several widespread brain areas correlated with ΔF. Waveform morphology was spatially variable both across and within macroscopic brain areas (though consistent across trials), even within individual participants, suggesting that (1) areas outside the auditory cortex may play an as-yet undetermined role in streaming and (2) the role of a given macroscopic brain area may not be uniform, known issues of ERP variability notwithstanding (e.g., Edwards et al., 2009).
While several authors have posited a role for areas outside the classically defined auditory pathway in streaming (Micheyl et al., 2005; Snyder and Alain, 2007b; Bidet-Caulet and Bertrand, 2009; Elhilali et al., 2009), nearly all neurophysiological studies of streaming have focused exclusively on the auditory cortex (but see, Cusack, 2005; Pressnitzer et al., 2008; Kondo and Kashino, 2009). Only two previous studies examined whole-brain activity during the streaming paradigm (Cusack, 2005; Kondo and Kashino, 2009).
Cusack (2005), using a perceptually bistable sequence of tones similar to those used in the present study, reported increased BOLD activity in the intraparietal sulcus during 2-stream vs. 1-stream percepts, but did not report percept or ΔF-based differences in the auditory cortex. The present study could not assess the intraparietal sulcus given that (i) the sub-dural electrodes used were confined to superficial gyri and (ii) the lead field of sub-dural electrodes is unlikely to measure activity from as deep in the sulcus as the foci reported by Cusack. Studies utilizing methods with high temporal resolution (e.g., MEG, iEEG, or microelectrodes in experimental animals) focusing on this region could elucidate it is precise role in streaming and auditory perceptual organization more generally (e.g., Rauschecker and Scott, 2009; Teki et al., 2011). Given the results of the present study as well as previous work (Fishman et al., 2004, 2001; Bee and Klump, 2004, 2005; Gutschalk et al., 2005; Micheyl et al., 2005; Snyder et al., 2006; Wilson et al., 2007; Bee et al., 2010), it is unclear why Cusack did not observe a neurophysiological correlate of ΔF in the auditory cortex, though an account based on subtle paradigmatic differences cannot be ruled out.
Kondo and Kashino (2009) used an event-related fMRI paradigm in order to measure brain activity during perceptual switching. Their subjects listened to tone sequences nearly identical to those used in the present study and indicated when the percept switched from one to two streams and vice versa. In addition to the auditory cortex, significant switch-related activations were found in the posterior insula, medial geniculate body, and supra-marginal gyrus. No explicit contrasts were carried out to test for effects of perceptual organization or ΔF, but the results do highlight the need for further examination of the involvement of areas outside the auditory cortex in streaming.
Our results demonstrate that the cortical areas engaged during the streaming paradigm and much more complex and widespread than has been shown by previous work, and highlights the need for detailed neurophysiological examinations of the streaming paradigm in behavioral animal models.
Failure to Observe Correlates of Bistability
Contrary to the study of the visual system in which there are many reports of brain activity covarying directly with perception (Logothetis, 1998; Leopold and Logothetis, 1999; Sterzer et al., 2009), such observations are scarce in the auditory system (Hillyard et al., 1971; Cusack, 2005; Gutschalk et al., 2005, 2008). By recording brain activity with high spatiotemporal precision from widespread areas of the human cortex, the present study attempted to identify neural correlates of streaming, per se, in the absence of physical stimulus differences. As mentioned above, Cusack (2005) reported increased BOLD activity in the anterior intraparietal sulcus during 2- vs. 1-stream percepts but did not find percept- or ΔF-based differences in the auditory cortex. The latter finding is contrary to what Gutschalk et al. (2005) reported using magnetoencephalography, namely amplitudes of the P1m and N1m components evoked by the B-tone in a sequence of ABA- triplets which co-varied with both ΔF and perceptual organization, per se. No evidence for activity in the intraparietal sulcus was found in that study, though this could be due to activity in the Cusack study not being precisely time-locked to the stimuli, a condition necessary for the measurement of evoked responses with EEG or MEG. Neither finding – increased activity in the intraparietal sulcus or planum temporale during 2- vs. 1-stream percepts – was replicated by the present study, possibly due to lack of coverage in the areas of activity reported by both Cusack and Gutschalk et al. (intraparietal sulcus, transverse gyrus on the superior temporal plane) or, again, that the electrical activity responsible for the generation of the BOLD effects reported by Cusack was not time-locked to the stimuli.
Possible explanations for why we did not observe robust correlates of perceptual bistability despite widespread cortical sampling (see Figure 3) are many. First, although it seems unlikely to us given the large amount of data suggesting a role for frontal areas in conscious visual perception (Libedinsky and Livingstone, 2011), it could be that the areas reported by Cusack (2005) and Gutschalk et al. (2005) are unique in maintaining representations of auditory perceptual organization and that we simply were unable to examine activity from these areas. Second, although the possibility that the known issue of trial-to-trial variability in the evoked potentials caused the lack of a significant percept-based finding cannot be ruled out, we find this explanation unlikely given the robust effects of ΔF as well as the relatively flat waveforms in the pre-sequence baseline period we observed. Finally, the neural correlates of auditory streaming could be found (i) in another cortical area not sampled, (ii) in a distributed network of brain areas which could not be determined based on the uni-variate analyses used, (iii) on a finer spatial scale than was assessed by the present study, or (iv) in an aspect of neural activity not examined such as sustained potentials or sustained gamma-band activity, though our analysis of evoked gamma-band power showed neither ΔF- or percept-based effects. This is perhaps due to the relatively constant acoustic stimulation used in our paradigm vs. the less frequent stimuli used in previous reports demonstrating large gamma-band effects (Crone et al., 2001, 2006; Edwards et al., 2005).
Author Contributions
Andrew R. Dykstra, Sydney S. Cash, Eric Halgren, and Thomas Thesen conceived and designed the experiments. Emad N. Eskandar, Werner Doyle, and Joseph R. Madsen performed the surgeries. Sydney S. Cash and Chad E. Carlson afforded access to the patients. Andrew R. Dykstra performed the experiments and analyzed the data. Andrew R. Dykstra, Sydney S. Cash, and Eric Halgren wrote the paper.
Conflict of Interest Statement
The authors declare that the research was conducted in the absence of any commercial or financial relationships that could be construed as a potential conflict of interest.
Acknowledgments
The authors wish to thank the patients and their families for their participation. The authors also wish to thank hospital staff, particularly Kristy Trip, Kara Houghton, Amy Trongnetrpunya, Olga Felsovalyi, and members of the Cortical Neurophysiology Laboratory at MGH including Alex Chan, Justine Cormier, Corey Keller, and Rodrigo Zepeda. Finally, the authors would like to thank Jennifer Melcher, Peter Cariani, and Barbara Shinn-Cunningham for helpful comments. Work supported by NIDCD grant T32 DC00038 to Andrew R. Dykstra, NIBIB grant T32 EB001680 to Andrew R. Dykstra, an Amelia Peabody Charitable Trust grant to Andrew R. Dykstra, NIH grant NS18741 to Eric Halgren, NINDS grant NS062092 to Sydney S. Cash.
References
Acar, Z. A., Worrell, G., and Makeig, S. (2009). Patch-basis electrocortical source imaging in epilepsy. Conf. Proc. IEEE Eng. Med. Biol. Soc. 2009, 2930–2933.
Ahlfors, S. P., Han, J., Lin, F.-H., Witzel, T., Belliveau, J. W., Hämäläinen, M. S., and Halgren, E. (2010). Cancellation of EEG and MEG signals generated by extended and distributed sources. Hum. Brain Mapp. 31, 140–149.
Almonte, F., Jirsa, V. K., Large, E. W., and Tuller, B. (2005). Integration and segregation in auditory streaming. Physica D 212, 137–159.
Anstis, S., and Saida, S. (1985). Adaptation to auditory streaming of frequencymodulatedtones. J. Exp. Psychol. Hum. Percept. Perform. 11, 257–271.
Bee, M. A., and Klump, G. M. (2004). Primitive auditory stream segregation: a neurophysiological study in the songbird forebrain. J. Neurophysiol. 92, 1088–1104.
Bee, M. A., and Klump, G. M. (2005). Auditory stream segregation in the songbird forebrain: effects of time intervals on responses to interleaved tone sequences. Brain Behav. Evol. 66, 197–214.
Bee, M. A., Micheyl, C., Oxenham, A. J., and Klump, G. M. (2010). Neural adaptation to tone sequences in the songbird forebrain: patterns, determinants, and relation to the build-up of auditory streaming. J. Comp. Physiol. A Neuroethol. Sens. Neural Behav. Physiol. 196, 543–557.
Bell, A. J., and Sejnowski, T. J. (1995). An information-maximization approach to blind separation and blind deconvolution. Neural Comput. 7, 1129–1159.
Bidet-Caulet, A., and Bertrand, O. (2009). Neurophysiological mechanisms involved in auditory perceptual organization. Front. Neurosci. 3:2. doi: 10.3389/neuro.01.025.2009
Bregman, A. S. (1994). Auditory Scene Analysis: The Perceptual Organization of Sound. Cambridge, MA: MIT Press.
Brugge, J. F., Volkov, I. O., Garell, P. C., Reale, R. A., and Howard, M. A. (2003). Functional connections between auditory cortex on Heschl’s gyrus and on the lateral superior temporal gyrus in humans. J. Neurophysiol. 90, 3750–3763.
Brugge, J. F., Volkov, I. O., Oya, H., Kawasaki, H., Reale, R. A., Fenoy, A., Steinschneider, M., and Howard, M. A. (2008). Functional localization of auditory cortical fields of human: click-train stimulation. Hear. Res. 238, 12–24.
Carlyon, R. P., Cusack, R., Foxton, J. M., and Robertson, I. H. (2001). Effects of attention and unilateral neglect on auditory stream segregation. J. Exp. Psychol. Hum. Percept. Perform. 27, 115–127.
Crone, N. E., Boatman, D., Gordon, B., and Hao, L. (2001). Induced electrocorticographic gamma activity during auditory perception. Brazier award-winning article, 2001. Clin. Neurophysiol. 112, 565–582.
Crone, N. E., Sinai, A., and Korzeniewska, A. (2006). High-frequency gamma oscillations and human brain mapping with electrocorticography. Prog. Brain Res. 159, 275–295.
Cusack, R. (2005). The intraparietal sulcus and perceptual organization. J. Cogn. Neurosci. 17, 641–651.
Dale, A. M., Fischl, B., and Sereno, M. I. (1999). Cortical surface-based analysis. I. Segmentation and surface reconstruction. Neuroimage 9, 179–194.
Deco, G., Jirsa, V. K., Robinson, P. A., Breakspear, M., and Friston, K. (2008). The dynamic brain: from spiking neurons to neural masses and cortical fields. PLoS Comput. Biol. 4, e1000092. doi: 10.1371/journal.pcbi.1000092
Deco, G., and Romo, R. (2008). The role of fluctuations in perception. Trends Neurosci. 31, 591–598.
Deike, S., Gaschler-Markefski, B., Brechmann, A., and Scheich, H. (2004). Auditory stream segregation relying on timbre involves left auditory cortex. Neuroreport 15, 1511–1514.
Deike, S., Scheich, H., and Brechmann, A. (2010). Active stream segregation specifically involves the left human auditory cortex. Hear. Res. 265, 30–37.
Delorme, A., and Makeig, S. (2004). EEGLAB: an open source toolbox for analysis of single-trial EEG dynamics including independent component analysis. J. Neurosci. Methods 134, 9–21.
Delorme, A., Sejnowski, T., and Makeig, S. (2007). Enhanced detection of artifacts in EEG data using higher-order statistics and independent component analysis. Neuroimage 34, 1443–1449.
Edwards, E., Soltani, M., Deouell, L. Y., Berger, M. S., and Knight, R. T. (2005). High gamma activity in response to deviant auditory stimuli recorded directly from human cortex. J. Neurophysiol. 94, 4269–4280.
Edwards, E., Soltani, M., Kim, W., Dalal, S. S., Nagarajan, S. S., Berger, M. S., and Knight, R. T. (2009). Comparison of time-frequency responses and the event-related potential to auditory speech stimuli in human cortex. J. Neurophysiol. 102, 377–386.
Elhilali, M., Ma, L., Micheyl, C., Oxenham, A. J., and Shamma, S. A. (2009). Temporal coherence in the perceptual organization and cortical representation of auditory scenes. Neuron 61, 317–329.
Elhilali, M., and Shamma, S. A. (2008). A cocktail party with a cortical twist: how cortical mechanisms contribute to sound segregation. J. Acoust. Soc. Am. 124, 3751–3771.
Engel, A. K., Moll, C. K. E., Fried, I., and Ojemann, G. A. (2005). Invasive recordings from the human brain: clinical insights and beyond. Nat. Rev. Neurosci. 6, 35–47.
Fay, R. R. (1998). Auditory stream segregation in goldfish (Carassius auratus). Hear. Res. 120, 69–76.
Fay, R. R. (2000). Spectral contrasts underlying auditory stream segregation in goldfish (Carassius auratus). J. Assoc. Res. Otolaryngol. 1, 120–128.
Fischl, B., Sereno, M. I., and Dale, A. M. (1999a). Cortical surface-based analysis. II: inflation, flattening, and a surface-based coordinate system. Neuroimage 9, 195–207.
Fischl, B., Sereno, M. I., Tootell, R. B., and Dale, A. M. (1999b). High-resolution intersubject averaging and a coordinate system for the cortical surface. Hum. Brain Mapp. 8, 272–284.
Fishman, Y. I., Arezzo, J. C., and Steinschneider, M. (2004). Auditory stream segregation in monkey auditory cortex: effects of frequency separation, presentation rate, and tone duration. J. Acoust. Soc. Am. 116, 1656–1670.
Fishman, Y. I., Reser, D. H., Arezzo, J. C., and Steinschneider, M. (2001). Neural correlates of auditory stream segregation in primary auditory cortex of the awake monkey. Hear. Res. 151, 167–187.
Gigante, G., Mattia, M., Braun, J., and Del Giudice, P. (2009). Bistable perception modeled as competing stochastic integrations at two levels. PLoS Comput. Biol. 5, e1000430. doi: 10.1371/journal.pcbi.1000430
Gutschalk, A., Hämäläinen, M. S., and Melcher, J. R. (2010). BOLD responses in human auditory cortex are more closely related to transient MEG responses than to sustained ones. J. Neurophysiol. 103, 2015–2026.
Gutschalk, A., Micheyl, C., Melcher, J. R., Rupp, A., Scherg, M., and Oxenham, A. J. (2005). Neuromagnetic correlates of streaming in human auditory cortex. J. Neurosci. 25, 5382–5388.
Gutschalk, A., Micheyl, C., and Oxenham, A. J. (2008). Neural correlates of auditory perceptual awareness under informational masking. PLoS Biol. 6, e138. doi: 10.1371/journal.pbio.0060138
Gutschalk, A., Oxenham, A. J., Micheyl, C., Wilson, E. C., and Melcher, J. R. (2007). Human cortical activity during streaming without spectral cues suggests a general neural substrate for auditory stream segregation. J. Neurosci. 27, 13074–13081.
Halgren, E. (2004). How can intracranial recordings assist MEG source localization? Neurol. Clin. Neurophysiol. 2004, 86.
Hillyard, S. A., Squires, K. C., Bauer, J. W., and Lindsay, P. H. (1971). Evoked potential correlates of auditory signal detection. Science 172, 1357–1360.
Howard, M. A., Volkov, I. O., Mirsky, R., Garell, P. C., Noh, M. D., Granner, M., Damasio, H., Steinschneider, M., Reale, R. A., Hind, J. E., and Brugge, J. F. (2000). Auditory cortex on the human posterior superior temporal gyrus. J. Comp. Neurol. 416, 79–92.
Itatani, N., and Klump, G. M. (2009). Auditory streaming of amplitude-modulated sounds in the songbird forebrain. J. Neurophysiol. 101, 3212–3225.
Itatani, N., and Klump, G. M. (2010). Neural correlates of auditory streaming of harmonic complex sounds with different phase relations in the songbird forebrain. J. Neurophysiol. Available at: http://www.ncbi.nlm.nih.gov/pubmed/21068270 [accessed December 23, 2010].
Kanwal, J. S., Medvedev, A. V., and Micheyl, C. (2003). Neurodynamics for auditory stream segregation: tracking sounds in the mustached bat’s natural environment. Network 14, 413–435.
Kondo, H. M., and Kashino, M. (2009). Involvement of the thalamocortical loop in the spontaneous switching of percepts in auditory streaming. J. Neurosci. 29, 12695–12701.
Leopold, D. A., and Logothetis, N. K. (1999). Multistable phenomena: changing views in perception. Trends Cogn. Sci. (Regul. Ed.) 3, 254–264.
Libedinsky, C., and Livingstone, M. (2011). Role of prefrontal cortex in conscious visual perception. J. Neurosci. 31, 64–69.
Liegeois-Chauvel, C., Musolino, A., and Chauvel, P. (1991). Localization of the primary auditory area in man. Brain 114, 139–151.
Logothetis, N. K. (1998). Single units and conscious vision. Philos. Trans. R. Soc. Lond. B Biol. Sci. 353, 1801–1818.
Maris, E., and Oostenveld, R. (2007). Nonparametric statistical testing of EEG- and MEG-data. J. Neurosci. Methods 164, 177–190.
Mayhew, S. D., Dirckx, S. G., Niazy, R. K., Iannetti, G. D., and Wise, R. G. (2010). EEG signatures of auditory activity correlate with simultaneously recorded fMRI responses in humans. Neuroimage 49, 849–864.
Micheyl, C., Carlyon, R. P., Gutschalk, A., Melcher, J. R., Oxenham, A. J., Rauschecker, J. P., Tian, B., and Courtenay Wilson, E. (2007). The role of auditory cortex in the formation of auditory streams. Hear. Res. 229, 116–131.
Micheyl, C., Tian, B., Carlyon, R. P., and Rauschecker, J. P. (2005). Perceptual organization of tone sequences in the auditory cortex of awake macaques. Neuron 48, 139–148.
Moreno-Bote, R., Rinzel, J., and Rubin, N. (2007). Noise-induced alternations in an attractor network model of perceptual bistability. J. Neurophysiol. 98, 1125–1139.
Mukamel, R., Gelbard, H., Arieli, A., Hasson, U., Fried, I., and Malach, R. (2005). Coupling between neuronal firing, field potentials, and FMRI in human auditory cortex. Science 309, 951–954.
Mulert, C., Jäger, L., Propp, S., Karch, S., Störmann, S., Pogarell, O., Möller, H.-J., Juckel, G., and Hegerl, U. (2005). Sound level dependence of the primary auditory cortex: simultaneous measurement with 61-channel EEG and fMRI. Neuroimage 28, 49–58.
Mulert, C., Leicht, G., Hepp, P., Kirsch, V., Karch, S., Pogarell, O., Reiser, M., Hegerl, U., Jäger, L., Moller, H. J., and McCarley, R. W. (2010). Single-trial coupling of the gamma-band response and the corresponding BOLD signal. Neuroimage 49, 2238–2247.
Nelken, I., and Bar-Yosef, O. (2008). Neurons and objects: the case of auditory cortex. Front. Neurosci. 2:1. doi: 10.3389/neuro.01.009.2008
Pressnitzer, D., Sayles, M., Micheyl, C., and Winter, I. M. (2008). Perceptual organization of sound begins in the auditory periphery. Curr. Biol. 18, 1124–1128.
Rauschecker, J. P., and Scott, S. K. (2009). Maps and streams in the auditory cortex: nonhuman primates illuminate human speech processing. Nat. Neurosci. 12, 718–724.
Schadwinkel, S., and Gutschalk, A. (2010a). Activity associated with stream segregation in human auditory cortex is similar for spatial and pitch cues. Cereb. Cortex. Available at: http://www.ncbi.nlm.nih.gov/pubmed/20237241 [accessed September 14, 2010].
Schadwinkel, S., and Gutschalk, A. (2010b). Functional dissociation of transient and sustained fMRI BOLD components in human auditory cortex revealed with a streaming paradigm based on interaural time differences. Eur. J. Neurosci. 32, 1970–1978.
Schul, J., and Sheridan, R. A. (2006). Auditory stream segregation in an insect. Neuroscience 138, 1–4.
Shamma, S. A., Elhilali, M., and Micheyl, C. (2010). Temporal coherence and attention in auditory scene analysis. Trends Neurosci. Available at: http://www.ncbi.nlm.nih.gov/pubmed/21196054 [accessed January 27, 2011].
Shamma, S. A., and Micheyl, C. (2010). Behind the scenes of auditory perception. Curr. Opin. Neurobiol. 20, 361–366.
Shpiro, A., Moreno-Bote, R., Rubin, N., and Rinzel, J. (2009). Balance between noise and adaptation in competition models of perceptual bistability. J. Comput. Neurosci. 27, 37–54.
Snyder, J. S., and Alain, C. (2007a). Sequential auditory scene analysis is preserved in normal aging adults. Cereb. Cortex 17, 501–512.
Snyder, J. S., and Alain, C. (2007b). Toward a neurophysiological theory of auditory stream segregation. Psychol. Bull. 133, 780–799.
Snyder, J. S., Alain, C., and Picton, T. W. (2006). Effects of attention on neuroelectric correlates of auditory stream segregation. J. Cogn. Neurosci. 18, 1–13.
Steinmann, I., and Gutschalk, A. (2011). Potential fMRI correlates of 40-Hz phase locking in primary auditory cortex, thalamus and midbrain. Neuroimage 54, 495–504.
Sterzer, P., Kleinschmidt, A., and Rees, G. (2009). The neural bases of multistable perception. Trends Cogn. Sci. (Regul. Ed.) 13, 310–318.
Sussman, E., Ritter, W., and Vaughan, H. G. (1999). An investigation of the auditory streaming effect using event-related brain potentials. Psychophysiology 36, 22–34.
Teki, S., Chait, M., Kumar, S., von Kriegstein, K., and Griffiths, T. D. (2011). Brain bases for auditory stimulus-driven figure-ground segregation. J. Neurosci. 31, 164–171.
van Noorden, L. (1975). Temporal Coherence in the Perception of Tone Sequences. Eindhoven: Eindhoven University of Technology.
Whitmer, D., Worrell, G., Stead, M., Lee, I. K., and Makeig, S. (2010). Utility of independent component analysis for interpretation of intracranial EEG. Front. Hum. Neurosci. 4:184. doi: 10.3389/fnhum.2010.00184
Wilson, E. C., Melcher, J. R., Micheyl, C., Gutschalk, A., and Oxenham, A. J. (2007). Cortical FMRI activation to sequences of tones alternating in frequency: relationship to perceived rate and streaming. J. Neurophysiol. 97, 2230–2238.
Keywords: auditory streaming, auditory scene analysis, auditory cortex, electrocorticography, bistable perception, evoked potentials
Citation: Dykstra AR, Halgren E, Thesen T, Carlson CE, Doyle W, Madsen JR, Eskandar EN and Cash SS (2011) Widespread brain areas engaged during a classical auditory streaming task revealed by intracranial EEG. Front. Hum. Neurosci. 5:74. doi: 10.3389/fnhum.2011.00074
Received: 24 May 2011;
Paper pending published: 22 June 2011;
Accepted: 19 July 2011;
Published online: 03 August 2011.
Edited by:
Srikantan S. Nagarajan, University of California San Francisco, USAReviewed by:
Lee M. Miller, University of California Davis, USAErik Edwards, University of California Berkeley and University of Washington, USA
Copyright: © 2011 Dykstra, Halgren, Thesen, Carlson, Doyle, Madsen, Eskandar and Cash. This is an open-access article subject to a non-exclusive license between the authors and Frontiers Media SA, which permits use, distribution and reproduction in other forums, provided the original authors and source are credited and other Frontiers conditions are complied with.
*Correspondence: Andrew R. Dykstra, Program in Speech and Hearing Bioscience and Technology, Harvard-MIT Division of Health Sciences and Technology, 55 Fruit St., Thier 423, Boston, MA 02114, USA. e-mail:YWR5a3N0cmFAbWl0LmVkdQ==