


- 1Department of Neurobiology, University of Alabama at Birmingham, Birmingham, AL, USA
- 2Department of Psychological and Brain Sciences, University of California, Santa Barbara, CA, USA
Alpha-frequency band oscillations have been shown to be one of the most prominent aspects of neuronal ongoing oscillatory activity, as reflected by electroencephalography (EEG) recordings. First thought to reflect an idling state, a recent framework indicates that alpha power reflects cortical inhibition. In the present study, the role of oscillations in the upper alpha-band (12 Hz) was investigated during a change-detection test of short-term visual memory. If alpha oscillations arise from a purely inhibitory process, higher alpha power before sample stimulus presentation would be expected to correlate with poorer performance. Instead, participants with faster reaction-times showed stronger alpha power before the sample stimulus in frontal and posterior regions. Additionally, faster participants showed stronger alpha desynchronization after the stimulus in a group of right frontal and left posterior electrodes. The same pattern of electrodes showed stronger alpha with higher working-memory load, so that when more items were processed, alpha power desynchronized faster after the stimulus. During memory maintenance, alpha power was greater when more items were held in memory, likely due to a faster resynchronization. These data are consistent with the hypothesis that the level of suppression of alpha power by stimulus presentation is an important factor for successfully encoding visual stimuli. The data are also consistent with a role for alpha as actively participating in attentional processes.
Introduction
Since its first observation in 1929 by Hans Berger (Berger, 1929), many interpretations have been proposed to explain the presence of alpha oscillations (8–14 Hz) in the cortex. Found to be attenuated by eye-opening, visual stimuli and strong attention, alpha oscillations were first thought to reflect an “idling” rhythm (Adrian and Matthews, 1934). Despite 80 years of observation, the precise function of alpha oscillations is still a matter of debate. We know that ongoing brain activity is dominated by alpha oscillations (Linkenkaer-Hansen et al., 2004) and that alpha is deeply involved in vision and attention processes (Klimesch et al., 2008). A current leading interpretation of alpha oscillations is a framework where the amplitude of alpha reflects a certain level of cortical inhibition (Ray and Cole, 1985; Pfurtscheller, 2003; Klimesch et al., 2007; Mathewson et al., 2009; Sauseng et al., 2009; Jensen and Mazaheri, 2010). This idea has emerged from experiments where participants were asked to focus their attention either on a part of visual space (Thut et al., 2006) or on a particular feature of visual stimuli (Snyder and Foxe, 2010) and studies comparing auditory and visual stimuli (Foxe et al., 1998). In both cases alpha oscillations were found to be significantly higher over brain areas associated with unattended features or stimuli. Therefore, alpha oscillations have been interpreted as reflecting an active inhibition of irrelevant stimuli, in order to facilitate the processing of relevant stimuli. Moreover, in working-memory tasks, alpha has been found to relate to the quantity of information to remember (Jensen et al., 2002).
However, the seductively simple idea of alpha power as cortical inhibition has been challenged by many studies. In sensori-motor areas, both strong alpha power and weak alpha power led to equal psychophysical performance (Linkenkaer-Hansen et al., 2004). A recent study in monkeys, using binocular rivalry, showed significantly higher power of alpha oscillations in primary visual areas for identical stimuli that were perceived than for un-perceived stimuli (Wilke et al., 2006). Adding to the evidence that alpha power reflects more than cortical inhibition, accumulating data on alpha phase dynamics tends to show an active role of alpha in processing information (Palva and Palva, 2007; Haegens et al., 2011; Mo et al., 2011). Also, an idea of inhibition pulses was recently suggested (Osipova et al., 2008).
One explanation for these variable results in the literature is that the majority of studies have taken into account the whole frequency window of alpha (generally from ∼8 Hz to ∼14 Hz) as previously suggested (Sadaghiani et al., 2010). However, functional differences have been shown between low (∼7–10 Hz) and high (∼11–14 Hz) alpha (Klimesch, 1999; Weiss and Rappelsberger, 2000). In young healthy adults, alpha power generally peaks at 11 Hz and a maximum of correlation with behavioral performance has been observed at 12 Hz (Klimesch, 1999).
The purpose of the current study is to examine the relationship between alpha power and behavioral performance during preparation to receive a visual stimulus and also during encoding and maintenance of short-term memory for the stimulus. EEG oscillations in the 12 Hz band measured with scalp electrodes were analyzed for participants doing a visual working-memory task. Inter-trial and inter-stimulus intervals were randomized so that participants did not know exactly when stimuli would appear and so that stimulus-locked oscillations would not impact our results.
We examined alpha power during anticipation of, presentation of, and maintenance of memory for a visual stimulus and examined how alpha power changed depending on a participant's reaction-time and on the complexity of the stimulus to be remembered. If alpha oscillations arose from a purely inhibitory process, higher alpha power before sample stimulus presentation would be expected to correlate with poorer performance. Instead, participants with faster reaction-times showed stronger alpha power before the sample stimulus in frontal and posterior regions.
Our data support the hypothesis that accurate encoding of a stimulus is associated with high levels of alpha power prior to a stimulus, followed by strong but transient desynchronization after stimulus presentation. This association seems to only occur for alpha upper-band oscillations, as no significant results were found for lower-band alpha (8 or 10 Hz).
Materials and Methods
Participants
Eighteen right-handed participants were recruited (four male, mean age = 23.94 years, SD = 4). They had no reported history of neurological disorders. UAB's human participants committee approved this research. All participants had normal or corrected-to-normal visual acuity as tested with a Snellen eye chart. Two participants were excluded because of artifact contamination (see Section “Data analysis”).
Task
The experiment consisted of a visual delayed-match-to-sample task in which the participants had to remember an image composed of oriented bars (see Figure 1). The sample stimulus (S) was presented for 0.2 s. After a randomized delay between 1 s and 3 s the probe stimulus (P) was presented for 0.2 s. Participants were instructed to press a button with the right or left index finger for matching (50%) or non-matching (50%) probes, respectively. Immediately after they pressed the button, participants heard a sound informing them whether they were correct (high frequency −1000 Hz for correct and low frequency −500 Hz for incorrect). Both sounds lasted 0.25 s and were delivered using Etymotics E.A.R Tone insert earpieces. Participants were instructed to direct their gaze to a black cross, located at the middle of the screen during all experiments.
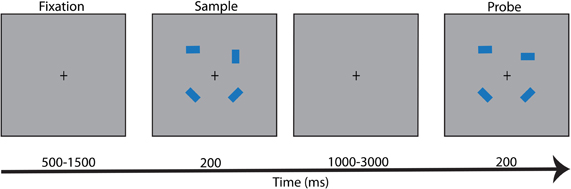
Figure 1. Behavioral task. On each trial, subjects fixated on a central cross (duration between 500 and 1500 ms). Then a stimulus appeared for 200 ms, followed by another fixation period (duration between 1000 and 3000 ms). Following this, a probe appeared for 200 ms. Subjects reported whether the stimulus and probe matched via button-press (left/right index) after probe onset. This figure depicts a situation where the probe does not match the stimulus. On trials (50%) where the probe did not match the stimulus, one blue bar (randomly chosen) was rotated 90°.
On each trial, 2, 4 or 6 rectangles were presented, equally distributed on the left and right sides of the screen (for example, if a stimulus is composed of six rectangles, three are shown on the left part of the screen and three on the right part of the screen). For each trial, S and P have the same number of rectangles. In order to create a non-matched P, one randomly chosen rectangle in S was rotated with an angle of 90°. Trials with different numbers of rectangles were presented in a randomized order. The inter-trial interval was randomized between 0.5 and 1.5 s.
Stimuli
All rectangles were blue and presented on a gray background. Each rectangle dimension was 0.85 by 0.34° visual angle. All rectangles were displayed in an area around the center of the screen of dimension 8 (vertical) by 14.6 (horizontal) degrees. Rectangles were presented at a random position within this area and were oriented at a random angle (0, 45, 90 or 135 degrees) from the vertical. Any two rectangles displayed on the same side of the screen were constrained so that they could not overlap, and it was never the case that all rectangles on the left or right side were oriented the same way. Stimuli were delivered using Matlab (MathWorks, Natick, MA) with Psychophysics toolbox (Brainard, 1997). The participants performed a total of 360 trials, resulting in 120 trials per condition (number of rectangles). This experiment describes a subset of tasks this group of participants performed. During other task blocks, participants performed a variant of the same task where two sample stimuli were presented successively before the probe. Participants either had to remember the first stimulus and ignore the second, or ignore the first stimulus and remember the second. Those data are not presented here.
Data Acquisition
Prior to data acquisition, the participants received training for approximately 8 min. If the participant did not completely understand the experiment, a second training session was performed, for about 4 min. After one or two training sessions, all participants reported that they fully understood the instructions. EEG data were recorded using a 64 channel Neuroscan system (Compumedics, Texas, USA) and Neuroscan 4.3 software. Participants were seated upright in a shielded and sound-attenuated EEG room. They were instructed to sit comfortably, to put their head on a chinrest and to look at the stimulus screen, located 95 cm from the chinrest (CRT monitor, 85 Hz refresh rate). Two pairs of electrodes were placed above and below the left eye, and on the participants' temples in order to record vertical and horizontal eye-movements, respectively. Impedances for all electrodes were kept under 10 kOhms. EEG data were digitized at 1000 Hz sampling rate, low-pass filtered at 200 Hz and the recording reference was located at the vertex.
Data Analysis
The Matlab toolbox EEGlab was used for data preprocessing (Delorme et al., 2011). Data were band pass filtered between 2 Hz and 20 Hz. Two-second stimulus epochs were created for each trial from −1 s before to 1 s after S. A set of probe epochs was created in order to examine neural activity during the period prior to probe presentation, time-locked to probe presentation. These probe epochs included data from −1 s before to 1 s after P. The data during the beginning of these probe epochs show neural activity during the delay period.
Epochs from incorrect trials and epochs contaminated by artifacts such as sensor jump or muscle activity, were rejected by visual inspection before further analysis (Luck, 2005). Two subjects were excluded because of severe contamination of their data with electrical artifact. All data were then re-referenced to the mean of all electrodes (omitting eye electrodes and frontal electrodes FP1 and FP2 commonly contaminated by muscle artifacts). The Matlab package Fieldtrip was used for data processing (Oostenveld et al., 2011). Oscillatory power between 2 and 20 Hz was estimated between −800 ms and 800 ms around stimulus onset by using a Hanning taper method with a 400 ms fixed sliding window length (1 Hz steps using the mtmconvol function), centered every 50 ms. The power spectra for each condition (number of rectangles to remember) were normalized by the power integrated from 5 to 20 Hz in a time-window of 500 ms before S, averaged over all three load conditions (Jensen et al., 2002). This normalization removed influences from changes in impedance, or overall power from participant to participant, allowing the analysis to be sensitive to variation in individual participants' alpha power relative to overall power. This allowed comparison and averaging over participants. All analyses were performed on normalized values.
Statistical Analysis
Changes in 12 Hz alpha-band power with condition were statistically assessed using a non-parametric randomization method identifying clusters of sensors showing significant differences. This effectively corrects for multiple comparisons over sensors in within-subject comparisons (Nichols and Holmes, 2002; Maris and Oostenveld, 2007; Medendorp et al., 2007). Clusters were defined as spatially contiguous sensors where the t-statistic with respect to power values in two conditions exceeded an a priori threshold (p < 0.05). Note that the comparison-based on t-statistics was used to identify sensors with an effect exceeding a threshold for the subsequent cluster analysis; thus, the power values to be tested were not required to be normally distributed. The cluster-level test statistic was defined as the sum of the t-statistics of the sensors in a cluster. In a non-parametric statistical test, the Type-I error rate for the complete set of 60 sensors was controlled by evaluating the cluster-level test statistic under the randomization null distribution of the maximum cluster-level statistic. This was obtained by randomly permuting the data between the two experimental conditions within every participant. By creating a reference distribution from 5000 random sets of permutations, the p value was estimated as the proportion of the elements in the randomization null distribution exceeding the observed maximum cluster-level test statistic (Medendorp et al., 2007). Cluster neighboring distance was chosen so that there was an average of eight neighbors per channel.
In order to study the impact of 12 Hz alpha oscillations on participants' performances, correlation coefficients were calculated between 12 Hz alpha power in electrodes of interest and behavioral scores obtained for each subject (accuracy and reaction-time). The same randomization and correction methods were used for this test.
Results
The role of 12 Hz activity in a visual attention task was investigated using a short-term visual memory task involving patterns of oriented rectangles (Figure 1). In each trial the subjects were instructed to remember the pattern and to match it to a probe presented after a randomized delay (between 1 and 3 s). The analysis focused on characterizing the difference in 12 Hz activity between conditions in which the subjects remembered different numbers of rectangles.
Behavioral Results
Subjects' behavioral performance was characterized in terms of error rates and reaction-times (Figure 2). A one-way ANOVA with repeated measures showed that accuracy significantly decreased as the number of rectangles increased [F(1, 15) = 179.2, p < 0.0001]. A similar ANOVA showed that reaction-time increased as the number of rectangles increased. [F(1, 15) = 47.7, p < 0.0001]. Thus, performance declines with working-memory load.
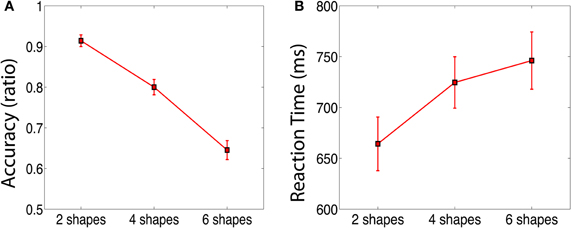
Figure 2. Plot of behavioral results. (A) Accuracy, representing the proportion of correct answers as a function of the number of shapes in the stimuli. (B) Reaction-time as a function of the number of shapes in the stimuli. Note that performance gets worse as the number of shapes increases. Bars show within-subject standard errors of the mean (Loftus and Masson, 1994).
Alpha while Preparing for the Stimulus
Between-subject correlation coefficients were calculated between behavioral scores (accuracy and reaction-time) and the average value of 12 Hz alpha power between 500 ms and 200 ms before stimulus onset in each electrode. No significant relationship was found with accuracy (all ps > 0.1). Reaction-time was found to negatively correlate with 12 Hz alpha power in 31 electrodes (See starred electrodes in Figure 3A, cluster correction used as described in Section “Materials and Methods”, p < 0.05). In each electrode showing a significant relationship with reaction-time, a higher 12 Hz alpha power value was linked to a faster reaction-time. In order to better illustrate this effect, we divided the original group into two subgroups of participants, based on a median split of reaction-times. Alpha power time-course in electrodes showing a significant correlation with reaction-time (electrodes highlighted in red in Figure 3A) was computed for each one of these two subgroups. This descriptive analysis is shown in Figure 3B. T-tests revealed that during time-window starting 750 ms and ending 250 ms before stimulus onset, participants with faster reaction-times showed stronger 12 Hz alpha power.
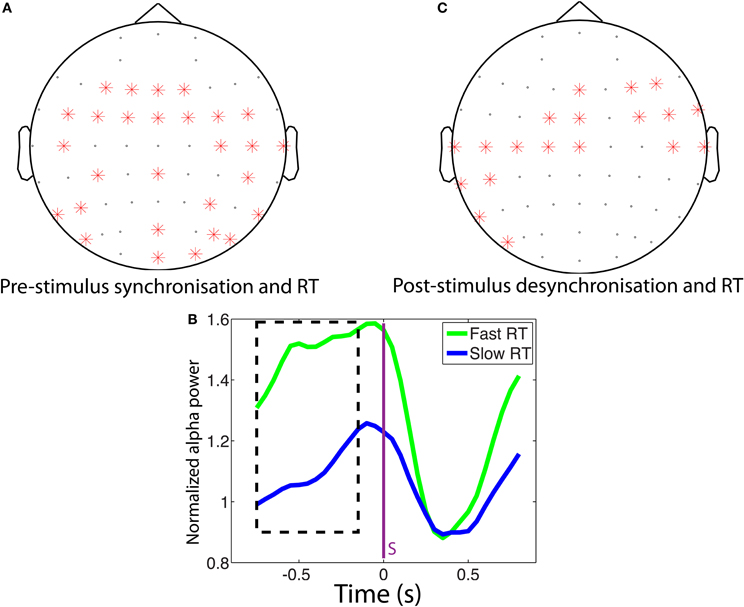
Figure 3. Pre and post-stimulus alpha power correlate with reaction-time. (A) Electrodes highlighted with red stars are electrodes where a subject's reaction-time was negatively correlated with normalized alpha power such that faster reaction-time is correlated with greater alpha (p < 0.05, cluster corrected). (B) Descriptive graph of the effect observed in (A) showing average normalized alpha power time-course in those electrodes that showed a significant correlation with reaction-times. Time-courses are shown for two subgroups of participants, based on the median split of the reaction-time. Green line depicts the subgroup with the fastest reaction-times. Blue line depicts the subgroup with the slowest reaction-times. The black rectangle depicts the time-window where there is a significant difference between the two groups (point-by-point t-tests, p < 0.05). (C) Electrodes highlighted with red stars are electrodes where reaction-time correlated with level of desynchronization, such that a greater decrease in normalized alpha power correlated with a faster reaction-time. (p < 0.05, cluster corrected). Desynchronization is defined as average from 200 ms to 500 ms after stimulus offset divided by average from 500 ms to 200 ms before stimulus onset. Purple vertical line at 0 marks stimulus appearance.
In order to identify whether these effects are specific to upper alpha-band, the same analysis was performed for lower alpha-band power. No significant correlation was found between reaction-times and lower alpha-band power (8 and 10 Hz) in the same time-window. Moreover, a significant difference was found between correlation values obtained using upper-band alpha-frequency (12 Hz) and correlation values obtained using lower-band alpha frequencies (8 and 10 Hz) in electrodes highlighted in Figure 3A (paired-sample t-tests, ps < 0.001). It should be noted that the number of cycles of 8 and 10 Hz signals within our 400 ms window was smaller than the number of cycles of 12 Hz signals. This could contribute somewhat to a lower signal power in lower frequencies, for this analysis and for the analyses on 8 and 10 Hz power later in the manuscript. However, this is unlikely to have a strong effect because there were more than three cycles for all frequencies examined.
Alpha Desynchronization Immediately Following Stimulus Presentation
Figure 3C depicts the desynchronization that occurs after the stimulus is presented. This relative decrease in 12 Hz alpha power was computed by dividing the average 12 Hz alpha power post-stimulus (200–500 ms after stimulus offset) by the average 12 Hz alpha power pre-stimulus (500–200 ms before stimulus onset). Correlation coefficients were calculated between the level of desynchronization of 12 Hz alpha power and participants' behavioral scores using methods described in the previous section. Reaction-time was significantly correlated with desynchronization of 12 Hz alpha power in several electrodes (Starred electrodes in Figure 3C. Cluster corrected).
In those electrodes, a stronger decrease in 12 Hz alpha power is linked to faster behavioral performance. Note that their locations are slightly different from those electrodes in which 12 Hz alpha power was correlated with reaction-time before stimulus presentation (starred electrodes in Figure 3A).
As a control, in order to confirm that this effect arose from the level of event-related desynchronization, and not because of post-stimulus 12 Hz alpha power, the reaction-time was correlated with the level of 12 Hz alpha power after the stimulus. No significant effects of reaction-time were observed (p > 0.05).
Figure 4 depicts the time-course of baselined 12 Hz alpha before and after stimulus appearance for each condition (2, 4, and 6 shapes) in the same electrodes that showed a correlation between 12 Hz alpha power desynchronization and reaction-time (see Figure 3C). After stimulus onset, 12 Hz alpha power desynchronizes (decreases in power) for each of the three conditions (this is a classic event-related desynchronization). T-tests revealed that the amplitude of the 12 Hz alpha power decrease (between 0.2 and 0.6 s after stimulus onset) does not significantly differ across conditions. However, the latency of the peak decrease was significantly different between 2 shapes and 4 shapes (p < 0.01). No other significant latency differences were found (all ps > 0.1).
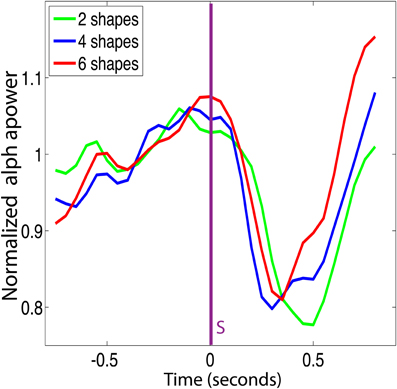
Figure 4. Time-course of alpha power around stimulus appearance depends on number of shapes seen. Average normalized alpha power (non-baselined) for the electrodes identified from Figure 3C as showing a significant correlation with reaction-time during the period after stimulus presentation. Purple vertical line at 0 marks stimulus appearance. Green, blue, and red curves represent, respectively, the time-course for 2, 4, and 6 shapes. Latency of the minimum value for 2 shapes is significantly slower than for 4 or 6 shapes.
To better illustrate what happens during this desynchronization and subsequent resynchronization of 12 Hz alpha oscillations following stimulus presentation, we calculated the average difference in 12 Hz alpha power between the three conditions for two different time-windows: 100–300 ms (desynchronization) and 400–700 ms (resynchronization). No significant cluster was found during the desynchronization time-window, confirming the result presented in the previous paragraph: 12 Hz alpha power did not differ across conditions during desynchronization. Figure 5A shows the difference in 12 Hz alpha power between the 4 shapes and 2 shapes conditions during resynchronization (400–700 ms). Starred electrodes show significant clusters. No significant difference in 12 Hz alpha power was found during resynchronization between 2 shapes and 6 shapes or between 4 shapes and 6 shapes (p > 0.1). The 6 shapes condition showed noisier data in general, reflecting the fact that there were fewer correct trials whose data could be included in these analyses.
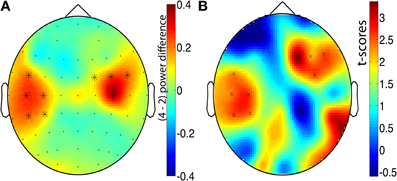
Figure 5. The effect of memory load after sample appearance. Normalized alpha-power (baselined to pre-stimulus) difference between the 4 shapes and 2 shapes condition (4 shapes minus 2 shapes). As the data are normalized, they are unitless. Average between 400 ms and 700 ms after stimulus onset. The black stars identify the electrodes belonging to clusters that showed significant differences between conditions (p < 0.05, cluster corrected). (A) 12 Hz frequency power is modulated by condition. As noted in the text, no memory load effect was found using lower alpha-band (8–10 Hz) (B) Electrodes highlighted with x are electrodes where the difference in power between 4 and 2 shapes is significantly higher for upper alpha-band (12 Hz) than for lower-alpha-band (8–10 Hz). Cluster corrected (p < 0.05).
In order to identify whether these effects are specific to upper-band 12 Hz alpha, the same analyses from Figures 3 and 5 (correlation between power and reaction-times; difference in power between 2 and 4 shapes) were made using lower-band alpha (8–10 Hz). No significant result was found. Moreover, correlation values obtained using upper-band alpha-frequency (12 Hz) were significantly stronger than correlation values obtained using lower-band alpha-frequency (8 and 10 Hz) in electrodes highlighted in Figure 3C (paired-sample t-tests, ps < 0.001). The difference in power between the 4 shapes and 2 shapes conditions was stronger for the upper- than lower- band alpha-frequency in the electrodes highlighted in Figure 5B (p < 0.05, cluster corrected). Note that the highlighted electrodes are very similar to those in Figure 5A, indicating that the effects of memory load during alpha resynchronization are specific to the upper alpha-band.
Alpha Power during Memory Maintenance
The memory maintenance period is defined as the time between the presentation of the stimulus and the probe. This varied between 1 and 3 s from trial-to-trial. In order to examine 12 Hz alpha power during memory maintenance, we examined a time period after stimulus presentation, time-locked to the stimulus, and time periods prior to probe presentation, time-locked to the probe. As shown in Figure 4, 12 Hz alpha power desynchronizes and then resynchronizes after stimulus presentation (between 400 ms and 700 ms). Two clusters of electrodes (p < 0.05, cluster corrected) were found to show significant differences depending on the number of shapes during the resynchronization period (400–700 ms post-stimulus), one located in the left central-parietal region and the other located in the right central-frontal region (see Figure 5).
The same analysis was performed using the lower alpha-band (8–10 Hz). No significant result was found, as shown in Figure 5B. Thus, this effect is specific for the higher alpha-band.
No significant correlation between 12 Hz alpha power (baselined or non-baselined) and behavioral scores nor significant differences in 12 Hz alpha power between conditions (number of shapes) were found in time-windows preceding a probe's appearance. For reference, Figure 6 shows the effect of memory load on 12 Hz alpha power during two time-windows prior to the probe (−800 ms to −500 ms and −500 ms to −200 ms). No significant effect of memory load was observed in these data. Note that, because the memory maintenance interval ranged between 1 and 3 s, the data in Figure 6A combines data from between 200 ms after the stimulus, to 2.5 s after the stimulus. Thus, the slight, but non-significant trend for Figure 6A to look like Figure 5A likely comes from the fact that some of the data overlap. The fact that the trend is non-significant and becomes weaker at times closer to the probe indicates that the difference in 12 Hz alpha power between memory load conditions decreases over the memory maintenance period. More evidence of this comes from the fact that no significant differences in 12 Hz alpha power were found between a time-window before the stimulus (−500 ms to −200 ms before onset, p > 0.05).
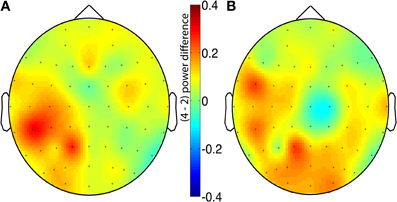
Figure 6. No significant effect of memory load on alpha power during the period before probe appearance. Alpha-power difference between the 4 shapes and 2 shapes condition (4 shapes minus 2 shapes). (A) Average between −800 ms and −500 ms before probe onset. (B) Average between −500 ms and −200 ms before probe onset. No electrode showed a significant difference in power between conditions.
The same set of analyses (alpha power difference between number of shapes during memory maintenance) was made using lower alpha-band (8–10 Hz). No significant differences were found (all ps > 0.05).
Discussion
The role of alpha power in the 12 Hz band is modulated by many conditions, and has been thought at different times in history to reflect several different processes. The goal of the present study was to better understand how 12 Hz alpha power is modulated with memory load. Alpha power was assessed during a change-detection test of short-term visual memory involving patterns of oriented rectangles. The analysis focused on characterizing the difference in 12 Hz activity between conditions in which the subjects remembered different numbers of rectangles. We found that the level of 12 Hz alpha power and the modulation of 12 Hz alpha power by a stimulus predicted which participants would have relatively faster reaction-times. Also, the level of 12 Hz alpha modulation by a stimulus depended on the amount of information in the stimulus (the number of shapes).
For the most part, results will be discussed only for the 2 and 4 shapes conditions. Results for the 6 shapes condition elicited no significant differences from the 4 shapes condition (see Section “Alpha desynchronization immediately following stimulus presentation”). This is consistent with growing evidence that the capacity of short-term memory is approximately four items (Luck et al., 1996; Luck and Vogel, 1997; Cowan, 2001; Marois et al., 2004; Vogel and Machizawa, 2004; Jonides et al., 2008), placing memory for 6 shapes beyond memory capacity limits. Memory load is thus similar for the 4 and 6 shapes conditions. Consistent with this hypothesis, performance was significantly worse for the 6 shapes condition than for the 2 or 4 shapes conditions (see Figure 2). For this reason, statistical analyses focus on the difference between the 2 and 4 shapes conditions.
Pre-Stimulus Alpha
Selective attention describes goal-directed behavior achieved by orienting the focus of conscious awareness toward relevant stimuli and away from irrelevant stimuli (Posner and Petersen, 1990). Top-down attention depends on expectations and/or goals and is not believed to be an intrinsic property of visual cortex, but rather, this goal-directed control is mediated by long-range communication between distal brain regions, or networks of regions (Posner and Petersen, 1990; Frith, 2001; Corbetta and Shulman, 2002). Such networks have been identified anatomically in monkeys, showing reciprocal links between areas in parietal and frontal cortices and visual association cortex (Cavada and Goldman-Rakic, 1989; Ungerleider et al., 1989; Webster et al., 1994). Moreover, neuroimaging studies in humans have indicated that top-down modulation during visual processing involves a similar fronto-parietal network (D'Esposito et al., 1998; Ungerleider et al., 1998; Corbetta and Shulman, 2002).
Oscillatory activity, especially alpha power, represents one mechanism that many authors have linked to selective attention. Alpha power in frontal and posterior electrodes have been shown to be modulated by changes in attention (Capotosto et al., 2009). Combined EEG-TMS studies have shown that attention can be disrupted by disrupting alpha oscillations in a frontal-posterior network (Capotosto et al., 2009; Zanto et al., 2011). Long-distance cortical communication is thought to occur at least in part via phase information (Sauseng and Klimesch, 2008) and alpha-band activity appears to be a prime candidate for transmitting phase information (Palva and Palva, 2011).
In the present study, we have shown a significant correlation between alpha power prior to stimulus presentation in mid-frontal and in posterior electrodes and reaction-time (see Figure 3): higher alpha power reflects a faster reaction-time. Similarly, increased alpha synchrony (Haig and Gordon, 1998) and power (Gath et al., 1983) have been associated with faster reaction-times in oddball tasks. Sustained increases in upper alpha-band power correlates with faster reaction-times, fewer lapses in stimulus detection, and is negatively correlated with subjective sleepiness ratings (Lockley et al., 2006). These data suggest that alpha power reflects the instantaneous strength of connection between the frontal and posterior parts of an attentional network.
Our results (Figures 3A,B) are consistent with the idea that a stronger frontal attention network would be reflected by higher alpha power and by better performance. Those results also corroborate findings that suggest top-down modulation biases activity in sensory cortical regions prior to stimulus onset (Bressler et al., 2008; Capotosto et al., 2009). Recently, it has been suggested that frontal alpha oscillations are an important component of a more general tonic alertness state (Sadaghiani et al., 2010), which is distinct from arousal on the one hand and selective attention on the other hand (Posner, 2008). Our results are not in contradiction with this view: it should be noted, however, that our paradigm does not permit us to tell if alpha fluctuations found before stimulus appearance participate in a selective attention process or in a more general alertness state.
Some authors have argued that local alpha oscillations could reflect inhibition, preventing stimulus processing in the ignored visual hemifield. These interpretations are based on a lateralized effect in alpha power over parieto-occipital regions during tasks that required subjects to shift their attention toward either the left or right visual hemifield (Rihs et al., 2007, 2009; Händel et al., 2010; Romei et al., 2010). An interpretation of alpha power as simply an inhibition process would suggest that high posterior alpha power before a 200 ms visual stimulus would always result in poorer performance. However, in the present study, an analysis across subjects showed that higher alpha power in posterior electrodes was correlated to a faster reaction-time. Moreover, the same relationship was found in mid-frontal electrodes. Therefore, it seems likely that alpha oscillations observed here do not reflect an inhibition process but rather the implementation of a fronto-posterior attention network (Min and Herrmann, 2007; Min et al., 2008; Min and Park, 2010) that could be linked to subjects' attentional effort (Linkenkaer-Hansen et al., 2004; Palva and Palva, 2007). It is also possible that alpha oscillations have multiple functions (Palva and Palva, 2011). As suggested previously, frontal regions exert top-down modulatory influences on visual cortex with visual attention (Desimone and Duncan, 1995; Kastner and Ungerleider, 2000; Corbetta and Shulman, 2002; Moore et al., 2003; Serences and Yantis, 2006; Bressler et al., 2008). This influence, thought to occur via phase-locking (Sauseng and Klimesch, 2008) could prevent posterior regions from processing irrelevant information.
Further work is needed to fully understand the relationship between studies that suggest that alpha power reflects inhibition of sensory information, and studies that suggest that alpha reflects the strength of an attentional network. Our data add to the growing body of literature suggesting that the inhibition hypothesis is not the whole story. With this in mind, a recent review suggests that alpha oscillations could serve different cognitive processes, those processes being modulated through alpha phase dynamics (Palva and Palva, 2011). Further, it is known that there is some variability across subjects in the frequency of the alpha power peak (the individual alpha frequency) and this variability correlates with individuals' reaction-times (Surwillo, 1971). Thus, it is possible that variations in individual alpha frequencies are involved in the reaction-time effects we note in Figure 3. Regardless of the origin of the effect (either from changes in individual alpha frequencies, or directly from 12 Hz oscillations), the correlations observed imply that upper-band alpha power is correlated to behavior.
Alpha Modulation Immediately Following Stimulus Presentation
Our results show that the level of 12 Hz alpha desynchronization that occurred just after stimulus presentation was correlated to an individual's behavioral results. This is consistent with previous findings showing the importance of alpha desynchronization in stimulus processing (Kirschfeld, 2005; Gould et al., 2011). Moreover, recently, Huang and Sekuler have shown that desynchronization of alpha contralateral to the stimulus (rather than increases ipsilateral to the stimulus) appear to be most important for stimulus processing (Huang and Sekuler, 2010). Further emphasizing the importance of alpha desynchronization, in the present study, statistical analysis showed that the relative decrease of alpha power post-stimulus was significantly different between participants with a slow reaction-time and participants with a fast reaction-time (Figure 3). This evidence suggests that greater stimulus-driven alpha desynchronization indicates more effective encoding of the stimulus.
The level of stimulus-driven desynchronization was similar regardless of the number of items to be remembered but there was a significant difference in latency of the effect. The peak desynchronization was earlier for 4 shapes than for 2 shapes (see alpha power time-course in Figure 4). This suggests that the quantity of new information modulates the speed of alpha desynchronization. This is consistent with the idea that a greater quantity of visual information will stimulate a greater number of neurons, leading to a faster desynchronization of alpha power, however, further work is needed to identify the precise mechanism.
Alpha during Memory Maintenance
Participants must maintain stimulus information in memory for between 1 and 3 s between the stimulus and probe onsets. It has been suggested (Jensen et al., 2002) that alpha power sustained during a memory maintenance period reflects a participant's working-memory load. The data presented here suggest, instead, that the changes in 12 Hz alpha power with working-memory load may reflect delayed resynchronization of 12 Hz alpha for the low working-memory condition. Figures 3B and 4 show that 12 Hz alpha power begins to resynchronize by about 500 ms after stimulus onset. Figure 4 shows that the desynchronization and subsequent resynchronization are slower for smaller memory load conditions. This is highlighted in the scalp map of Figure 5A, which shows that during the period 400–700 ms after stimulus onset, a set of electrodes show stronger 12 Hz alpha power in the 4 shape condition than the 2 shape condition. However, this difference becomes negligible by the time of the probe presentation: Figure 6 shows no significant difference between the 4 shapes and 2 shapes conditions during time periods prior to probe presentation. These data in Figure 6 represent an average across trials whose retention period ranged from 1 to 3 s. Therefore, Figure 6B (data from the time interval between −500 to −200 ms prior to the probe) includes data from 300 ms windows that start between 500–2500 ms after the stimulus presentation. By that time, on average, there is no difference in 12 Hz alpha power between the memory conditions, indicating that the differences observed early in the retention period may result simply from slower resynchronization of 12 Hz alpha for the low memory condition.
The time period immediately preceding the probe's appearance did not show differences in 12 Hz alpha power between the conditions, indicating that resynchronization of 12 Hz alpha rhythms returned to their initial state after a desynchronization due to the presentation of a visual stimulus. This resynchronization may be a general process of recovering after desynchronization, not affecting participants' performance. Consistent with this, no correlation of 12 Hz alpha power with reaction-time was found during 12 Hz alpha resynchronization (400–700 ms after the stimulus onset). These results imply that at steady state, after stimulus-driven desynchronization and resynchronization, 12 Hz alpha power is not modulated by memory load.
Scalp Distribution of Effects
Figure 3C (effect of reaction-time) and Figure 5 (effect of memory load) show strikingly similar scalp distributions: left centro-parietal and right centro-frontal. It is intriguing that such an asymmetrical distribution of 12 Hz alpha power was shown in a task that requires the participants to pay attention to the center of the visual field. It is very unlikely that participants adopted a strategy in which they paid more attention to one visual hemifield than the other because: (1) none of the participants reported the use of such a strategy and (2) an asymmetry in alpha power would have been observed before the stimulus was presented (Rihs et al., 2007, 2009; Trenner et al., 2008; Händel et al., 2010; Romei et al., 2010). As seen in Figure 3A, no such asymmetry was found during this period.
This asymmetry could reflect the cognitive processing being performed on the stimulus. There are several possible mechanisms that may explain the spatial pattern of alpha power we observed.
The role of the right inferior frontal cortex (rIFC) was shown to be crucial for behavioral updating, as in a go/no-go task (Chambers et al., 2009; Chikazoe et al., 2009) and clinical studies have put it forward as a strong candidate for cognitive control (Menzies et al., 2007; Barch et al., 2009). A potential explanation is that the rIFC has been implicated in attention (Li et al., 2006; Mostofsky and Simmonds, 2008; Hampshire et al., 2010; Sharp et al., 2010). Recently, some studies have underlined the possible crucial role of the Inferior Frontal Junction (IFJ) in a fronto-posterior attention network (Gazzaley et al., 2005; Zanto et al., 2011). Their results showed that detection of visual motion elicited bilateral IFJ connectivity (with posterior regions), whereas color detection preferentially engages right IFJ connectivity. Previous research identified hemispheric differences in IFJ activity using visual stimuli (Derrfuss et al., 2005): different fronto-parietal regions were found to be involved in attention to motion versus color features (Liu et al., 2003). The right IFJ has also been suggested to be involved into the selection of behaviorally relevant stimulus features (Verbruggen et al., 2010) The present study involves detecting features of blue-colored motionless stimuli, and, consistent with previous results, we found an asymmetry so that right frontal electrodes showed greater alpha power. Moreover, electrodes where post-stimulus alpha desynchronization was correlated with reaction-time were also located in right mid-frontal and left posterior electrodes (see Figure 3C). Therefore it is possible that the strength of encoding our visual stimuli (indirectly measured by correlation with participants' reaction-time) depends on the size of the neuronal population where a phase resetting will occur (Sauseng and Klimesch, 2008).
The human parietal cortex has been shown to be recruited by processing and perception of action-related information, including object shape and orientation (Culham and Valyear, 2006). Hemispheric differences have also been shown in this region. Motor attention is predominantly associated with activation in the left rather than the right parietal cortex (Rushworth et al., 2003). It is therefore, possible that our results in this particular brain region reflect the spatial encoding of the stimuli rather then a motor preparation, as participants used both of their hands to answer
Conclusion
Taken together, our results suggest that upper-band alpha (12 Hz), and not lower-band alpha (8–10 Hz), oscillations are important in attention for encoding processes. This effect may follow either selective attention or a more general tonic alertness state. In the absence of a new stimulus or any change in attentional state, alpha oscillations are likely involved in maintaining a fronto-posterior network. Alpha power in this network is correlated with the efficiency with which a potential stimulus will be processed. When a stimulus appears, a global desynchronization of alpha oscillations occurs. The speed of this desynchronization is directly linked to the amount of information to be processed; the level of desynchronization is correlated with stimulus processing efficiency. After this desynchronization, a resynchronization occurs, returning the level of alpha oscillation to its initial state.
This informs the field's larger current debates concerning the role of alpha oscillations. To our knowledge, it is the first time that EEG alpha power synchronization and desynchronization has been shown to correlate with subject-by-subject variations in reaction-time within the same experimental design. This supports the idea that desynchronization is important for stimulus processing and that the level of pre-stimulus synchronization could influence the amount of desynchronization. Also, we have shown that the memory load difference in alpha power in other papers (Jensen et al., 2002) may be due to a faster or slower rebound of alpha after desynchronization.
Conflict of Interest Statement
The authors declare that the research was conducted in the absence of any commercial or financial relationships that could be construed as a potential conflict of interest.
Acknowledgments
The authors would like to thank the UAB Center for Clinical and Translational Science (5UL1 RR025777), the Civitan International Research Center and the UAB Evelyn F. McKnight Brain Institute. We also would like to thank Ryan Vaden for help with data acquisition.
References
Adrian, E. D., and Matthews, B. H. C. (1934). The interpretation of potential waves in the cortex. J. Physiol. 81, 440.
Barch, D. M., Braver, T. S., Carter, C. S., Poldrack, R. A., and Robbins, T. W. (2009). CNTRICS final task selection: executive control. Schizophr. Bull. 35, 115–135.
Berger, H. (1929). Uber das Elektrenkephalogramm des Menschen. Arch. Psychiatr. Nervenkr. 87, 440–471.
Bressler, S. L., Tang, W., Sylvester, C. M., Shulman, G. L., and Corbetta, M. (2008). Top-down control of human visual cortex by frontal and parietal cortex in anticipatory visual spatial attention. J. Neurosci. 28, 10056–10061.
Capotosto, P., Babiloni, C., Romani, G. L., and Corbetta, M. (2009). Frontoparietal cortex controls spatial attention through modulation of anticipatory alpha rhythms. J. Neurosci. 29, 5863–5872.
Cavada, C., and Goldman-Rakic, P. S. (1989). Posterior parietal cortex in rhesus monkey: II. evidence for segregated corticocortical networks linking sensory and limbic areas with the frontal lobe. J. Comp. Neurol. 287, 422–445.
Chambers, C. D., Garavan, H., and Bellgrove, M. A. (2009). Insights into the neural basis of response inhibition from cognitive and clinical neuroscience. Neurosci. Biobehav. Rev. 33, 631–646.
Chikazoe, J., Jimura, K., Asari, T., Yamashita, K., Morimoto, H., Hirose, S., Miyashita, Y., and Konishi, S. (2009). Functional dissociation in right inferior frontal cortex during performance of go/no-go task. Cereb. Cortex 19, 146–152.
Corbetta, M., and Shulman, G. L. (2002). Control of goal-directed and stimulus-driven attention in the brain. Nat. Rev. Neurosci. 3, 201–215.
Cowan, N. (2001). The magical number 4 in short-term memory: a reconsideration of mental storage capacity. Behav. Brain Sci. 24, 87–114; discussion 114–185.
Culham, J. C., and Valyear, K. F. (2006). Human parietal cortex in action. Curr. Opin. Neurobiol. 16, 205–212.
Delorme, A., Mullen, T., Kothe, C., Akalin Acar, Z., Bigdely-Shamlo, N., Vankov, A., and Makeig, S. (2011). EEGLAB, SIFT, NFT, BCILAB, and ERICA: new tools for advanced EEG processing. Comput. Intell. Neurosci. 2011, 1–12.
Derrfuss, J., Brass, M., Neumann, J., and von Cramon, D. Y. (2005). Involvement of the inferior frontal junction in cognitive control: meta-analyses of switching and Stroop studies. Hum. Brain Mapp. 25, 22–34.
Desimone, R., and Duncan, J. (1995). Neural mechanisms of selective visual attention. Annu. Rev. Neurosci. 18, 193–222.
D'Esposito, M., Aguirre, G. K., Zarahn, E., and Ballard, D. (1998). Functional MRI studies of spatial and nonspatial working memory. Brain Res. Cogn. Brain Res. 7, 1–13.
Foxe, J. J., Simpson, G. V., and Ahlfors, S. P. (1998). Parieto-occipital approximately 10 Hz activity reflects anticipatory state of visual attention mechanisms. Neuroreport 9, 3929.
Frith, C. (2001). A framework for studying the neural basis of attention. Neuropsychologia 39, 1367–1371.
Gath, I., Lehmann, D., and Bar-On, E. (1983). Fuzzy clustering of EEG signal and vigilance performance. Int. J. Neurosci. 20, 303–312.
Gazzaley, A., Cooney, J. W., McEvoy, K., Knight, R. T., and D'Esposito, M. (2005). Top-down enhancement and suppression of the magnitude and speed of neural activity. J. Cogn. Neurosci. 17, 507–517.
Gould, I. C., Rushworth, M. F., and Nobre, A. C. (2011). Indexing the graded allocation of visuospatial attention using anticipatory alpha oscillations. J. Neurophysiol. 105, 1318–1326.
Haegens, S., Händel, B. F., and Jensen, O. (2011). Top-down controlled alpha band activity in somatosensory areas determines behavioral performance in a discrimination task. J. Neurosci. 31, 5197–5204.
Haig, A. R., and Gordon, E. (1998). Prestimulus EEG alpha phase synchronicity influences N100 amplitude and reaction time. Psychophysiology 35, 591–595.
Hampshire, A., Chamberlain, S. R., Monti, M. M., Duncan, J., and Owen, A. M. (2010). The role of the right inferior frontal gyrus: inhibition and attentional control. Neuroimage 50, 1313–1319.
Händel, B. F., Haarmeier, T., and Jensen, O. (2010). Alpha oscillations correlate with the successful inhibition of unattended stimuli. J. Cogn. Neurosci. 23, 2494–2502.
Huang, J., and Sekuler, R. (2010). Attention protects the fidelity of visual memory: behavioral and electrophysiological evidence. J. Neurosci. 30, 13461–13471.
Jensen, O., Gelfand, J., Kounios, J., and Lisman, J. E. (2002). Oscillations in the alpha band (9–12 Hz) increase with memory load during retention in a short-term memory task. Cereb. Cortex 12, 877–882.
Jensen, O., and Mazaheri, A. (2010). Shaping functional architecture by oscillatory alpha activity: gating by inhibition. Front. Hum. Neurosci. 4:186. doi: 10.3389/fnhum.2010.00186
Jonides, J., Lewis, R. L., Nee, D. E., Lustig, C. A., Berman, M. G., and Moore, K. S. (2008). The mind and brain of short-term memory. Annu. Rev. Psychol. 59, 193–224.
Kastner, S., and Ungerleider, L. G. (2000). Mechanisms of visual attention in the human cortex. Annu. Rev. Neurosci. 23, 315–341.
Kirschfeld, K. (2005). The physical basis of alpha waves in the electroencephalogram and the origin of the ‘Berger effect’. Biol. Cybern. 92, 177–185.
Klimesch, W. (1999). EEG alpha and theta oscillations reflect cognitive and memory performance: a review and analysis. Brain Res. Brain Res. Rev. 29, 169–195.
Klimesch, W., Freunberger, R., Sauseng, P., and Gruber, W. (2008). A short review of slow phase synchronization and memory: evidence for control processes in different memory systems? Brain Res. 1235, 31–44.
Klimesch, W., Sauseng, P., and Hanslmayr, S. (2007). EEG alpha oscillations: the inhibition-timing hypothesis. Brain Res. Rev. 53, 63–88.
Li, C. S., Huang, C., Constable, R. T., and Sinha, R. (2006). Imaging response inhibition in a stop-signal task: neural correlates independent of signal monitoring and post-response processing. J. Neurosci. 26, 186–192.
Linkenkaer-Hansen, K., Nikulin, V. V., Palva, S., Ilmoniemi, R. J., and Palva, J. M. (2004). Prestimulus oscillations enhance psychophysical performance in humans. J. Neurosci. 24, 10186–10190.
Liu, T., Slotnick, S. D., Serences, J. T., and Yantis, S. (2003). Cortical mechanisms of feature-based attentional control. Cereb. Cortex 13, 1334–1343.
Lockley, S. W., Evans, E. E., Scheer, F. A., Brainard, G. C., Czeisler, C. A., and Aeschbach, D. (2006). Short-wavelength sensitivity for the direct effects of light on alertness, vigilance, and the waking electroencephalogram in humans. Sleep 29, 161–168.
Loftus, G. R., and Masson, M. E. J. (1994). Using confidence intervals in within-subject designs. Psychon. Bull. Rev. 1, 476–490.
Luck, S. J. (2005). An Introduction to the Event-Related Potential Technique. Cambridge: The MIT Press.
Luck, S. J., Hillyard, S. A., Mouloua, M., and Hawkins, H. L. (1996). Mechanisms of visual-spatial attention: resource allocation or uncertainty reduction? J. Exp. Psychol. Hum. Percept. Perform. 22, 725–737.
Luck, S. J., and Vogel, E. K. (1997). The capacity of visual working memory for features and conjunctions. Nature 390, 279–281.
Maris, E., and Oostenveld, R. (2007). Nonparametric statistical testing of EEG- and MEG-data. J. Neurosci. Methods 164, 177–190.
Marois, R., Yi, D. J., and Chun, M. M. (2004). The neural fate of consciously perceived and missed events in the attentional blink. Neuron 41, 465–472.
Mathewson, K. E., Gratton, G., Fabiani, M., Beck, D. M., and Ro, T. (2009). To see or not to see: prestimulus alpha phase predicts visual awareness. J. Neurosci. 29, 2725–2732.
Medendorp, W. P., Kramer, G. F., Jensen, O., Oostenveld, R., Schoffelen, J. M., and Fries, P. (2007). Oscillatory activity in human parietal and occipital cortex shows hemispheric lateralization and memory effects in a delayed double-step saccade task. Cereb. Cortex 17, 2364–2374.
Menzies, L., Achard, S., Chamberlain, S. R., Fineberg, N., Chen, C-H., del Campo, N., Sahakian, B. J., Robbins, T. W., and Bullmore, E. (2007). Neurocognitive endophenotypes of obsessive-compulsive disorder. Brain 130(Pt 12), 3223–3236.
Min, B. K., and Herrmann, C. S. (2007). Prestimulus EEG alpha activity reflects prestimulus top-down processing. Neurosci. Lett. 422, 131–135.
Min, B. K., and Park, H. J. (2010). Task-related modulation of anterior theta and posterior alpha EEG reflects top-down preparation. BMC Neurosci. 11, 79.
Min, B. K., Park, J. Y., Kim, E. J., Kim, J. I., Kim, J. J., and Park, H. J. (2008). Prestimulus EEG alpha activity reflects temporal expectancy. Neurosci. Lett. 438, 270–274.
Mo, J., Schroeder, C. E., and Ding, M. (2011). Attentional modulation of alpha oscillations in macaque inferotemporal cortex. J. Neurosci. 31, 878–882.
Moore, T., Armstrong, K. M., and Fallah, M. (2003). Visuomotor origins of covert spatial attention. Neuron 40, 671–683.
Mostofsky, S. H., and Simmonds, D. J. (2008). Response inhibition and response selection: two sides of the same coin. J. Cogn. Neurosci. 20, 751–761.
Nichols, T. E., and Holmes, A. P. (2002). Nonparametric permutation tests for functional neuroimaging: a primer with examples. Hum. Brain Mapp. 15, 1–25.
Oostenveld, R., Fries, P., Maris, E., and Schoffelen, J. M. (2011). FieldTrip: open source software for advanced analysis of MEG, EEG, and invasive electrophysiological data. Comput. Intell. Neurosci. 2011, 156869.
Osipova, D., Hermes, D., and Jensen, O. (2008). Gamma power is phase-locked to posterior alpha activity. PloS One 3:e3990. doi: 10.1371/journal.pone.0003990
Palva, S., and Palva, J. M. (2007). New vistas for alpha-frequency band oscillations. Trends Neurosci. 30, 150–158.
Palva, S., and Palva, J. M. (2011). Functional roles of alpha-band phase synchronization in local and large-scale cortical networks. Front. Psychol. 2:204. doi: 10.3389/fpsyg.2011.00204
Pfurtscheller, G. (2003). Induced oscillations in the alpha band: functional meaning Rhythms in the Alpha Band. Epilepsia 44, 2–8.
Posner, M. I., and Petersen, S. E. (1990). The attention system of the human brain. Annu. Rev. Neurosci. 13, 25–42.
Ray, W. J., and Cole, H. W. (1985). EEG alpha activity reflects attentional demands, and beta activity reflects emotional and cognitive processes. Science 228, 750–752.
Rihs, T. A., Michel, C. M., and Thut, G. (2007). Mechanisms of selective inhibition in visual spatial attention are indexed by alpha-band EEG synchronization. Eur. J. Neurosci. 25, 603–610.
Rihs, T. A., Michel, C. M., and Thut, G. (2009). A bias for posterior alpha-band power suppression versus enhancement during shifting versus maintenance of spatial attention. Neuroimage 44, 190–199.
Romei, V., Gross, J., and Thut, G. (2010). On the role of prestimulus alpha rhythms over occipito-parietal areas in visual input regulation: correlation or causation? J. Neurosci. 30, 8692–8697.
Rushworth, M. F., Johansen-Berg, H., Göbel, S. M., and Devlin, J. T (2003). The left parietal and premotor cortices: motor attention and selection. Neuroimage 20, S89–S100.
Sadaghiani, S., Scheeringa, R., Lehongre, K., Morillon, B., Giraud, A. L., and Kleinschmidt, A. (2010). Intrinsic connectivity networks, alpha oscillations, and tonic alertness: a simultaneous electroencephalography/functional magnetic resonance imaging study. J. Neurosci. 30, 10243–10250.
Sauseng, P., and Klimesch, W. (2008). What does phase information of oscillatory brain activity tell us about cognitive processes? Neurosci. Biobehav. Rev. 32, 1001–1013.
Sauseng, P., Klimesch, W., Heise, K. F., Gruber, W. R., Holz, E., Karim, A. A., Glennon, M., Gerloff, C., Birbaumer, N., and Hummel, F. C. (2009). Brain oscillatory substrates of visual short-term memory capacity. Curr. Biol. 19, 1846–1852.
Serences, J. T., and Yantis, S. (2006). Selective visual attention and perceptual coherence. Trends Cogn. Sci. 10, 38–45.
Sharp, D. J., Bonnelle, V., de Boissezon, X., Beckmann, C. F., James, S. G., Patel, M. C., and Mehta, M. A. (2010). Distinct frontal systems for response inhibition, attentional capture, and error processing. Proc. Natl. Acad. Sci. U.S.A. 107, 6106–6111.
Snyder, A. C., and Foxe, J. J. (2010). Anticipatory attentional suppression of visual features indexed by oscillatory alpha-band power increases: a high-density electrical mapping study. J. Neurosci. 30, 4024–4032.
Surwillo, W. W. (1971). Human reaction time and period of the EEG in relation to development. Psychophysiology 8, 468–482.
Thut, G., Nietzel, A., Brandt, S. A., and Pascual-Leone, A. (2006). Alpha-band electroencephalographic activity over occipital cortex indexes visuospatial attention bias and predicts visual target detection. J. Neurosci. 26, 9494–9502.
Trenner, M. U., Heekeren, H. R., Bauer, M., Rössner, K., Wenzel, R., Villringer, A., and Fahle, M. (2008). What happens in between? Human oscillatory brain activity related to crossmodal spatial cueing. PloS One 3: e1467. doi: 10.1371/journal.pone.0001467
Ungerleider, L. G., Courtney, S. M., and Haxby, J. V. (1998). A neural system for human visual working memory. Proc. Natl. Acad. Sci. U.S.A. 95, 883–890.
Ungerleider, L. G., Gaffan, D., and Pelak, V. S. (1989). Projections from inferior temporal cortex to prefrontal cortex via the uncinate fascicle in rhesus monkeys. Exp. Brain Res. 76, 473–484.
Verbruggen, F., Aron, A. R., Stevens, M. A., and Chambers, C. D. (2010). Theta burst stimulation dissociates attention and action updating in human inferior frontal cortex. Proc. Natl. Acad. Sci. U.S.A. 107, 13966–13961.
Vogel, E. K., and Machizawa, M. G. (2004). Neural activity predicts individual differences in visual working memory capacity. Nature 428, 748–751.
Webster, M. J., Bachevalier, J., and Ungerleider, L. G. (1994). Connections of inferior temporal areas TEO and TE with parietal and frontal cortex in macaque monkeys. Cereb. Cortex 4, 470–483.
Weiss, S., and Rappelsberger, P. (2000). Long-range EEG synchronization during word encoding correlates with successful memory performance. Brain Res. Cogn. Brain Res. 9, 299–312.
Wilke, M., Logothetis, N. K., and Leopold, D. A. (2006). Local field potential reflects perceptual suppression in monkey visual cortex. Proc. Natl. Acad. Sci. U.S.A. 103,17507–17501.
Keywords: alpha, EEG, attention, working-memory, oscillations, desynchronization, reaction-time
Citation: Nenert R, Viswanathan S, Dubuc DM and Visscher KM (2012) Modulations of ongoing alpha oscillations predict successful short-term visual memory encoding. Front. Hum. Neurosci. 6:127. doi: 10.3389/fnhum.2012.00127
Received: 20 December 2011; Accepted: 19 April 2012;
Published online: 08 May 2012.
Edited by:
Srikantan S. Nagarajan, University of California, San Francisco, USAReviewed by:
Johanna Zumer, Radboud University Nijmegen, NetherlandsJonas Obleser, Max Planck Institute for Human Cognitive and Brain Sciences, Germany
Copyright: © 2012 Nenert, Viswanathan, Dubuc and Visscher. This is an open-access article distributed under the terms of the Creative Commons Attribution Non Commercial License, which permits non-commercial use, distribution, and reproduction in other forums, provided the original authors and source are credited.
*Correspondence: Rodolphe Nenert, 111 Civitan International Research Center, 1530 3rd Avenue South, Birmingham, AL 35294-0021, USA. e-mail:YmF0cm9kQGdtYWlsLmNvbQ==