Abstract
Introduction:
This study investigates four subdomains of executive functioning—initiation, cognitive inhibition, mental shifting, and working memory—using task-based functional magnetic resonance imaging (fMRI) data and graph analysis.
Methods:
We used healthy adults’ functional magnetic resonance imaging (fMRI) data to construct brain connectomes and network graphs for each task and analyzed global and node-level graph metrics.
Results:
The bilateral precuneus and right medial prefrontal cortex emerged as pivotal hubs and influencers, emphasizing their crucial regulatory role in all four subdomains of executive function. Furthermore, distinct hubs and influencers were identified in cognitive inhibition and mental shifting tasks, elucidating unique network dynamics. Our results suggest a decentralized brain organization with critical hub regions pertinent to conditions such as stroke and traumatic brain injury.
Discussion:
The precuneus and medial prefrontal cortex stand out as consistent, domain-general nodes in our findings, which show both unique and shared neural hubs across executive function subdomains. The presence of distinct hubs in cognitive inhibition and mental shifting tasks suggests flexible, task-specific network configurations. A decentralized yet structured brain network may also promote cognitive resilience.
Introduction
Executive functioning refers to several mental processes vital to effective cognitive control, encompassing tasks such as planning and organizing, initiation, time management, task shifting, and emotion regulation (Friedman and Robbins, 2022; Nemeth and Chustz, 2020). The current study utilizes archival fMRI data on initiation to investigate four subdomains: initiation, cognitive inhibition, mental shifting, and working memory.
Initiation, associated with the dorsolateral prefrontal cortex (DLPFC) and anterior cingulate cortex (ACC), involves starting and executing actions or cognitive processes (Jobson et al., 2021; Friedman and Robbins, 2022; Menon and D’Esposito, 2022). Cognitive inhibition, or inhibitory control, involves the inferior frontal gyrus, insula, superior parietal lobule (SPL), and middle cingulate (Long et al., 2022), while response inhibition involves the anterior cingulate cortex (ACC) and the pre-supplementary motor area (pre-SMA) (Morein-Zamir et al., 2013). Mental shifting, tied to the DLPFC and parietal cortex, facilitates flexible cognitive switching between or among tasks (Friedman and Robbins, 2022; Menon and D’Esposito, 2022). Working memory involves the temporary storage and manipulation of information, engaging a distributed network of brain regions, including the dorsolateral prefrontal cortex (DLPFC), the posterior parietal cortex (PPC), and the ventrolateral prefrontal cortex (VLPFC) (Chai et al., 2018; Engstrom et al., 2013).
Cognitive paradigms, such as the go/no-go, local task-switching, and n-back tasks, systematically investigate the four subdomains of executive function. The go/no-go paradigm assesses initiation and inhibition, elucidating the crucial connection between executive functioning and inhibitory control, which are indispensable for goal-directed behavior (Diamond, 2013; Verbruggen and Logan, 2008). Similarly, the local task-switching paradigm evaluates cognitive flexibility by observing how individuals manage attentional resources when transitioning between tasks with shared characteristics (Huff et al., 2015). Finally, the n-back paradigm, mainly the 2-back task, challenges participants with recalling and matching stimuli across a sequence (Jaeggi et al., 2010; Niendam et al., 2012). By employing cognitive paradigms, the present study delves into graph analysis metrics that assess a network graph’s structure, connectivity, and relationships, explicitly focusing on initiation, cognitive inhibition, shifting, and working memory.
Investigations into executive functioning often concentrate on specific brain regions (Friedman and Robbins, 2022; Menon and D’Esposito, 2022) or adopt a topographical network perspective that may use inconsistent labels for overall executive control abilities (Witt et al., 2021). In contrast, our study utilizes graph-based network analysis techniques to explore well-defined subdomains of executive function. This approach offers a robust framework for understanding the brain’s interconnected networks, effectively addressing the limitations of traditional region-based methods in studying executive functions.
While earlier research frequently focused on isolated regions, such as the prefrontal cortex, graph theory allows for examining brain-wide interactions, revealing emergent properties like global efficiency (communication efficiency across network nodes) and modularity (network structure strength) (Bullmore and Sporns, 2012; Rubinov and Sporns, 2010). The graph-based network perspective emphasizes the significance of relationships among brain regions. This approach provides insights into functional connectivity and dynamics by representing interactions as graphs. A significant advantage of this method is its capacity to identify critical nodes (hubs and influencers), similar to a social network. These regions are essential for network communication and integration. In the context of executive functions, this reveals vital components often overlooked in region-specific studies (Medaglia et al., 2015; Baum et al., 2017).
Moreover, graph theory facilitates task-specific comparisons, illustrating how different executive functions recruit distinct or overlapping network features, such as community structure or task flexibility. It quantifies the balance between functional integration (efficient global communication) and segregation (specialized local processing), which are crucial metrics for understanding brain organization during executive tasks (Baum et al., 2017; Ramos-Nuñez et al., 2017). Graph theory also sheds light on disruptions observed in clinical populations by linking network-level metrics to individual differences in cognitive performance.
This holistic approach captures both local and global properties of brain interactions, filling the gaps left by traditional region-specific analyses. It advances our understanding of the neural basis of executive functions by focusing on system-wide organization rather than isolated activity. Despite the growing interest in this area, few studies have systematically compared these subdomains using network-based graph theory approaches. Our research aims to bridge this gap by integrating traditional regional methods with graph analyses, providing a more comprehensive understanding of executive functions.
Graph-based network analysis serves as a valuable framework for unraveling the complexities inherent in systems represented as graphs. This methodology enhances our comprehension of intricate brain network connectivities and patterns (Bullmore and Sporns, 2009). Certain cortical areas emerge as highly connected or centralized regions, critical focal points (Farahani et al., 2019). The application of graph-based theory in cognitive neuroscience, particularly in human connectome studies, has evolved significantly, correlating brain network properties with human intelligence, memory, attention, and emotional processing (Farahani et al., 2019). For instance, research has demonstrated a correlation between working memory performance and local/global measures in brain networks (Stanley et al., 2015). Additionally, disruptions in functional network topology have been implicated in various cognitive and psychiatric disorders (Reijneveld et al., 2007).
This study aims to investigate core graph metrics to understand the network properties of cortical areas crucial for executive functions, specifically initiation, inhibition, shifting, and working memory in healthy adults. Utilizing graph-based network analysis, we seek to address several critical research questions:
-
Are there significant differences in brain network graphs between these executive functions?
-
What specific network features are associated with each task?
-
Which brain regions are essential for these functions?
Moreover, we propose the following hypotheses:
-
Brain network graphs will display significant differences in their topological properties—such as clustering coefficient, modularity, and global efficiency—across tasks related to different executive functions. This variation will reflect the distinct neural processing demands of each task.
-
Each executive function task will yield unique network features. For instance, tasks emphasizing working memory are expected to exhibit higher modularity, while those involving cognitive inhibition will show increased connectivity in control-related regions. Additionally, we anticipate tasks focused on shifting demonstrate greater flexibility in inter-community connections.
-
Specific brain regions will serve as critical hubs or influencers across these tasks. We expect the dorsolateral prefrontal cortex to play a central role in working memory, the anterior cingulate cortex vital for cognitive inhibition, and the parietal regions to be key in task-shifting. These essential regions likely exhibit high centrality and betweenness values, underscoring their importance in network communication.
This study aims to enhance our understanding of the neural underpinnings of executive functioning and its relationship with brain network organization by addressing these questions.
Methods
Data acquisition
This study employed a publicly available dataset derived from functional magnetic resonance imaging (fMRI) scans of healthy adults (Rieck et al., 2021). One hundred forty-four participants (ages 20 to 86) underwent scanning using a Siemens 3 T MRI scanner while engaging in cognitive paradigms to assess functional activity. These paradigms included a go/no-go task for examining inhibition and initiation, a local task-switching paradigm for shifting, and an n-back task with three load levels (0-back, 1-back, and 2-back) for working memory (Rieck et al., 2021).
Functional connectivity estimates (quantified with time-series correlations) between various brain regions were computed using three distinct brain atlases (Rieck et al., 2021): the Schaefer 100 parcel 17 network atlas (Schaefer et al., 2018; Thomas Yeo et al., 2011), the Power 229 node 10 network atlas (Power et al., 2011), and the Schaefer 200 parcel 17 network atlas (Schaefer et al., 2018; Thomas Yeo et al., 2011; Rieck et al., 2021). The present study utilizes the correlation data obtained from the Schaefer 200 parcel 17 network atlas.
Processing
To identify relevant brain regions (ROIs) with robust functional connectivity, ROIs exhibiting a high correlation coefficient exceeding 0.75 in the adjacency matrices of individual participants were selected. ROIs associated with the motor and visual networks were excluded to maintain the study’s focus on executive functioning. Additionally, ROIs with limited occurrences—those with connections observed in less than 10 participants—were also excluded to ensure the inclusion of reliably connected brain regions. The resulting ROIs and the corresponding aggregated frequency of functional connectivity incidents constitute an adjacency matrix for each task (inhibition, initiation, shifting, and 2-back).
Brain network construction
The analysis pipeline is depicted in Figure 1. A brain graph network comprises nodes (brain regions) and edges (functional connectivities) (Fornito et al., 2016). Nodes can be assigned binary or weighted values representing activity intensity. Considering the interindividual variability in brain connectomes (Sun et al., 2022), we aggregate weighted values across participants to obtain collective brain activity. This connectivity was utilized to construct an adjacency matrix (Figure 2), which signifies connections between nodes in a graph (Alper et al., 2013). The functional network was mapped using an adjacency matrix for each task and visualized on a connectome utilizing the Schaefer200_n17 atlas (Figures 2, 3). Furthermore, network graphs were generated for each task (Figure 4).
Figure 1

Pipeline for data analysis. (A) Obtain raw archival data. (B) Functional connectivity matrices are constructed, and connections with less frequency were excluded. (C) Adjacency matrices were derived based on step (B). (D) Graphs were generated and plotted on connectome. (E) Graph theoretical analysis. Metrics such as degree centrality, clustering coefficient, and modularity are computed to characterize the network’s local and global properties. (F) Statistical analyses are applied to identify significant patterns or differences across tasks. (G) Results were plotted on Schaefer for visualizations of the findings.
Figure 2

Adjacency matrix for each task. (a) Initiation, (b) Inhibition, (c) Shifting, (d) 2-back.
Figure 3

Graphs plotted on connectome for each task. (a) Initiation, (b) Inhibition, (c) Shifting, (d) 2-back.
Figure 4

Graphs for each task. (a) Initiation, (b) Inhibition, (c) Shifting, (d) 2-back.
Graph measures
Due to a lack of directionality in fMRI data, the current study employs weighted undirected matrices and investigates the topological characteristics of functional brain networks for each task. To analyze topographical features, conventional graph measures such as node centrality measures (degree, strength, betweenness, and closeness), clustering coefficient, modularity, characteristic path length, and small-worldedness, among others, were employed (Tables 1–5) (Sporns and Betzel, 2016; van den Heuvel et al., 2008).
Table 1
| Initiation | Inhibition | Shifting | 2-back | ||||
|---|---|---|---|---|---|---|---|
| Node | Degree | Node | Degree | Node | Degree | Node | Degree |
| 189 | 7 | 72 | 8 | 134 | 6 | 134 | 7 |
| 72 | 6 | 189 | 8 | 136 | 6 | 73 | 6 |
| 182 | 6 | 134 | 8 | 189 | 5 | 189 | 5 |
| 186 | 6 | 182 | 8 | 73 | 4 | 136 | 5 |
| 73 | 5 | 139 | 7 | 33 | 4 | 33 | 4 |
| 33 | 5 | 33 | 6 | 34 | 4 | 72 | 4 |
| 136 | 5 | 186 | 6 | 72 | 4 | 38 | 4 |
| 139 | 4 | 159 | 6 | 58 | 4 | 58 | 4 |
| 134 | 4 | 136 | 6 | 32 | 4 | 139 | 4 |
| 159 | 4 | 77 | 5 | 139 | 4 | 182 | 4 |
| 77 | 3 | 88 | 5 | 135 | 4 | 165 | 4 |
| 195 | 3 | 90 | 5 | 38 | 3 | 88 | 3 |
| 82 | 3 | 73 | 5 | 81 | 3 | 34 | 3 |
| 81 | 3 | 32 | 5 | 186 | 3 | 81 | 3 |
| 140 | 3 | 58 | 5 | 150 | 3 | 32 | 3 |
| 38 | 3 | 96 | 5 | 182 | 3 | 186 | 3 |
| 150 | 3 | 181 | 5 | 159 | 3 | 179 | 3 |
| 90 | 3 | 194 | 5 | 192 | 3 | 159 | 3 |
| 32 | 3 | 79 | 4 | 133 | 3 | 192 | 3 |
| 181 | 3 | 38 | 4 | 88 | 2 | 90 | 2 |
| 78 | 2 | 34 | 4 | 90 | 2 | 79 | 2 |
| 79 | 2 | 75 | 4 | 79 | 2 | 50 | 2 |
| 179 | 2 | 150 | 4 | 82 | 2 | 89 | 2 |
| 97 | 2 | 195 | 4 | 89 | 2 | 52 | 2 |
| 133 | 2 | 133 | 4 | 52 | 2 | 82 | 2 |
| 74 | 2 | 82 | 3 | 91 | 2 | 91 | 2 |
| 192 | 2 | 78 | 3 | 179 | 2 | 78 | 2 |
| 34 | 2 | 81 | 3 | 181 | 2 | 71 | 2 |
| 52 | 2 | 89 | 3 | 195 | 2 | 150 | 2 |
| 89 | 2 | 179 | 3 | 140 | 2 | 181 | 2 |
| 91 | 2 | 140 | 3 | 77 | 1 | 195 | 2 |
| 58 | 2 | 192 | 3 | 46 | 1 | 140 | 2 |
| 48 | 2 | 165 | 3 | 45 | 1 | 187 | 2 |
| 147 | 1 | 135 | 3 | 80 | 1 | 183 | 2 |
| 44 | 1 | 97 | 2 | 97 | 1 | 135 | 2 |
| 61 | 1 | 45 | 2 | 50 | 1 | 77 | 1 |
| 183 | 1 | 52 | 2 | 66 | 1 | 46 | 1 |
| 170 | 1 | 50 | 2 | 74 | 1 | 80 | 1 |
| 40 | 1 | 74 | 2 | 96 | 1 | 45 | 1 |
| 160 | 1 | 91 | 2 | 78 | 1 | 97 | 1 |
| 50 | 1 | 40 | 2 | 60 | 1 | 66 | 1 |
| 66 | 1 | 37 | 2 | 37 | 1 | 74 | 1 |
| 156 | 1 | 48 | 2 | 40 | 1 | 44 | 1 |
| 187 | 1 | 59 | 2 | 48 | 1 | 68 | 1 |
| 142 | 1 | 99 | 2 | 59 | 1 | 37 | 1 |
| 80 | 1 | 187 | 2 | 61 | 1 | 75 | 1 |
| 45 | 1 | 156 | 2 | 71 | 1 | 147 | 1 |
| 46 | 1 | 160 | 2 | 147 | 1 | 156 | 1 |
| 88 | 1 | 183 | 2 | 187 | 1 | 157 | 1 |
| 37 | 1 | 173 | 2 | 156 | 1 | 170 | 1 |
| 71 | 1 | 132 | 2 | 160 | 1 | 160 | 1 |
| 157 | 1 | 46 | 1 | 157 | 1 | 149 | 1 |
| 149 | 1 | 80 | 1 | 170 | 1 | 133 | 1 |
| 165 | 1 | 66 | 1 | 183 | 1 | 178 | 1 |
| 153 | 1 | 44 | 1 | 165 | 1 | ||
| 71 | 1 | 142 | 1 | ||||
| 31 | 1 | 153 | 1 | ||||
| 47 | 1 | ||||||
| 61 | 1 | ||||||
| 36 | 1 | ||||||
| 57 | 1 | ||||||
| 60 | 1 | ||||||
| 68 | 1 | ||||||
| 95 | 1 | ||||||
| 147 | 1 | ||||||
| 170 | 1 | ||||||
| 157 | 1 | ||||||
| 142 | 1 | ||||||
| 149 | 1 | ||||||
| 153 | 1 | ||||||
| 166 | 1 | ||||||
| 199 | 1 | ||||||
| 151 | 1 | ||||||
| 138 | 1 | ||||||
| 137 | 1 | ||||||
| 176 | 1 | ||||||
| 193 | 1 | ||||||
| 198 | 1 | ||||||
Node degree.
Table 2
| Initiation | Inhibition | Shifting | 2-back | ||||
|---|---|---|---|---|---|---|---|
| Node | Strength | Node | Strength | Node | Strength | Node | Strength |
| 186 | 286 | 186 | 365 | 139 | 208 | 73 | 205 |
| 189 | 205 | 189 | 300 | 136 | 187 | 134 | 174 |
| 182 | 186 | 182 | 291 | 73 | 185 | 189 | 167 |
| 139 | 168 | 139 | 275 | 189 | 182 | 139 | 158 |
| 73 | 162 | 159 | 244 | 186 | 176 | 136 | 134 |
| 77 | 155 | 73 | 233 | 134 | 176 | 186 | 133 |
| 72 | 152 | 134 | 232 | 33 | 168 | 88 | 132 |
| 33 | 142 | 33 | 231 | 182 | 136 | 182 | 132 |
| 79 | 139 | 72 | 227 | 88 | 125 | 33 | 125 |
| 134 | 124 | 79 | 210 | 77 | 117 | 179 | 108 |
| 159 | 122 | 77 | 203 | 72 | 117 | 72 | 102 |
| 38 | 110 | 88 | 186 | 79 | 115 | 38 | 97 |
| 136 | 106 | 181 | 162 | 34 | 114 | 79 | 95 |
| 88 | 102 | 136 | 161 | 179 | 114 | 77 | 85 |
| 150 | 93 | 38 | 159 | 159 | 113 | 90 | 84 |
| 195 | 89 | 90 | 156 | 38 | 111 | 159 | 83 |
| 90 | 86 | 179 | 151 | 150 | 103 | 58 | 78 |
| 179 | 86 | 150 | 134 | 90 | 97 | 150 | 72 |
| 181 | 85 | 81 | 131 | 181 | 85 | 192 | 62 |
| 82 | 82 | 195 | 125 | 82 | 84 | 165 | 62 |
| 97 | 75 | 82 | 123 | 58 | 83 | 34 | 61 |
| 81 | 74 | 34 | 113 | 46 | 79 | 52 | 58 |
| 46 | 68 | 97 | 112 | 32 | 74 | 181 | 58 |
| 140 | 59 | 89 | 99 | 195 | 68 | 46 | 54 |
| 78 | 54 | 52 | 98 | 52 | 65 | 81 | 52 |
| 147 | 54 | 78 | 94 | 192 | 65 | 82 | 49 |
| 45 | 54 | 32 | 93 | 45 | 64 | 50 | 46 |
| 89 | 54 | 192 | 93 | 147 | 64 | 195 | 46 |
| 80 | 53 | 46 | 87 | 135 | 64 | 89 | 45 |
| 52 | 53 | 80 | 83 | 80 | 59 | 91 | 45 |
| 34 | 51 | 140 | 83 | 89 | 56 | 80 | 43 |
| 192 | 47 | 45 | 80 | 97 | 55 | 140 | 42 |
| 32 | 46 | 50 | 80 | 133 | 55 | 45 | 39 |
| 187 | 42 | 187 | 80 | 81 | 54 | 147 | 39 |
| 156 | 38 | 58 | 76 | 187 | 54 | 187 | 39 |
| 50 | 38 | 156 | 76 | 50 | 53 | 32 | 36 |
| 91 | 38 | 133 | 70 | 156 | 53 | 97 | 35 |
| 74 | 37 | 91 | 68 | 140 | 48 | 156 | 34 |
| 160 | 28 | 96 | 68 | 91 | 43 | 78 | 30 |
| 170 | 28 | 147 | 68 | 160 | 26 | 157 | 30 |
| 66 | 28 | 74 | 63 | 66 | 25 | 183 | 29 |
| 58 | 25 | 160 | 62 | 157 | 25 | 66 | 28 |
| 133 | 25 | 183 | 59 | 170 | 25 | 170 | 28 |
| 183 | 22 | 194 | 59 | 74 | 22 | 135 | 27 |
| 48 | 21 | 66 | 53 | 183 | 22 | 160 | 24 |
| 157 | 17 | 170 | 53 | 96 | 21 | 71 | 21 |
| 37 | 14 | 75 | 47 | 78 | 20 | 74 | 18 |
| 44 | 13 | 165 | 42 | 165 | 20 | 44 | 17 |
| 149 | 13 | 135 | 42 | 60 | 17 | 149 | 17 |
| 142 | 12 | 37 | 36 | 37 | 15 | 68 | 15 |
| 40 | 12 | 48 | 35 | 40 | 11 | 37 | 12 |
| 165 | 12 | 59 | 33 | 48 | 11 | 75 | 12 |
| 153 | 11 | 40 | 31 | 59 | 11 | 133 | 11 |
| 61 | 10 | 157 | 31 | 142 | 11 | 178 | 10 |
| 71 | 10 | 173 | 25 | 153 | 11 | ||
| 132 | 24 | 61 | 10 | ||||
| 99 | 22 | 71 | 10 | ||||
| 142 | 21 | ||||||
| 44 | 20 | ||||||
| 149 | 20 | ||||||
| 153 | 16 | ||||||
| 71 | 15 | ||||||
| 31 | 14 | ||||||
| 166 | 14 | ||||||
| 199 | 12 | ||||||
| 47 | 11 | ||||||
| 61 | 11 | ||||||
| 151 | 11 | ||||||
| 36 | 10 | ||||||
| 57 | 10 | ||||||
| 60 | 10 | ||||||
| 68 | 10 | ||||||
| 95 | 10 | ||||||
| 138 | 10 | ||||||
| 137 | 10 | ||||||
| 176 | 10 | ||||||
| 193 | 10 | ||||||
| 198 | 10 | ||||||
Node strength.
Table 3
| Initiation | Inhibition | Shifting | 2-back | ||||
|---|---|---|---|---|---|---|---|
| Node | Betweenness | Node | Betweenness | Node | Betweenness | Node | Betweenness |
| 189 | 138 | 159 | 895.3666667 | 189 | 101.5 | 189 | 132 |
| 182 | 84.151826 | 77 | 848.1891273 | 134 | 89.468074 | 182 | 132 |
| 90 | 81.5 | 189 | 572.5642857 | 182 | 88.648268 | 73 | 116.2 |
| 73 | 72.513161 | 182 | 550.4220114 | 136 | 75.97132 | 134 | 107.616667 |
| 72 | 68.605463 | 88 | 363.0404762 | 72 | 73.452381 | 79 | 105 |
| 179 | 64 | 179 | 312.9166667 | 192 | 72.5 | 88 | 96.5 |
| 186 | 61.710859 | 58 | 265.3270125 | 73 | 69.377489 | 186 | 91 |
| 136 | 59.64667 | 91 | 265 | 81 | 69 | 192 | 84.5 |
| 159 | 55 | 90 | 263.1595238 | 79 | 66 | 81 | 79 |
| 33 | 54.013823 | 72 | 227.7273555 | 90 | 65 | 72 | 70.9 |
| 91 | 51 | 150 | 221 | 179 | 56 | 159 | 53 |
| 81 | 45 | 82 | 189.8714286 | 58 | 50.816991 | 179 | 51.5 |
| 82 | 45 | 81 | 189.8714286 | 135 | 47.916667 | 38 | 50.733333 |
| 150 | 37 | 186 | 180.5773489 | 186 | 47 | 165 | 50.516667 |
| 134 | 33.551963 | 89 | 168.8166667 | 159 | 47 | 78 | 48 |
| 140 | 24.714596 | 135 | 167 | 38 | 46.708333 | 91 | 36 |
| 74 | 22 | 194 | 153.6120443 | 91 | 45 | 90 | 30 |
| 58 | 22 | 75 | 126.5622013 | 34 | 40.60303 | 89 | 30 |
| 48 | 19 | 134 | 125.977697 | 88 | 35 | 136 | 28.483333 |
| 52 | 19 | 139 | 114.5426742 | 89 | 35 | 33 | 27.733333 |
| 139 | 17.64667 | 192 | 111.102381 | 32 | 34.75184 | 195 | 25 |
| 77 | 14.227234 | 195 | 96.4863525 | 150 | 33 | 140 | 25 |
| 181 | 13.160497 | 33 | 76.6583392 | 139 | 30.957251 | 183 | 25 |
| 195 | 8.555808 | 73 | 63.8258992 | 33 | 28.289935 | 32 | 22.9 |
| 78 | 7.643687 | 45 | 57 | 133 | 24.791667 | 58 | 22.8 |
| 79 | 7.643687 | 52 | 57 | 195 | 24 | 50 | 19 |
| 38 | 6.861111 | 48 | 57 | 140 | 24 | 52 | 19 |
| 89 | 6.5 | 59 | 57 | 82 | 17 | 71 | 19 |
| 32 | 5.341834 | 173 | 57 | 52 | 17 | 150 | 19 |
| 192 | 3 | 96 | 54.0447632 | 181 | 7.246753 | 139 | 18.866667 |
| 133 | 2.861111 | 136 | 49.6574909 | 77 | 0 | 82 | 5.5 |
| 97 | 1.4 | 78 | 48.6184711 | 46 | 0 | 187 | 4 |
| 34 | 0.75 | 79 | 33.2078878 | 45 | 0 | 34 | 2.733333 |
| 80 | 0 | 38 | 27.9546775 | 80 | 0 | 135 | 1.516667 |
| 187 | 0 | 34 | 27.9546775 | 97 | 0 | 181 | 1 |
| 44 | 0 | 50 | 20.2404762 | 50 | 0 | 77 | 0 |
| 88 | 0 | 165 | 18.7331633 | 66 | 0 | 46 | 0 |
| 46 | 0 | 181 | 16.4903546 | 74 | 0 | 80 | 0 |
| 71 | 0 | 74 | 13.4422031 | 96 | 0 | 45 | 0 |
| 45 | 0 | 133 | 12.2607623 | 78 | 0 | 97 | 0 |
| 37 | 0 | 32 | 10.9993036 | 60 | 0 | 66 | 0 |
| 50 | 0 | 37 | 6.8630962 | 37 | 0 | 74 | 0 |
| 147 | 0 | 156 | 3.5833333 | 40 | 0 | 44 | 0 |
| 157 | 0 | 140 | 3.1626206 | 48 | 0 | 68 | 0 |
| 66 | 0 | 183 | 2.0774802 | 59 | 0 | 37 | 0 |
| 40 | 0 | 97 | 1.6249851 | 61 | 0 | 75 | 0 |
| 61 | 0 | 40 | 1 | 71 | 0 | 147 | 0 |
| 156 | 0 | 99 | 1 | 147 | 0 | 156 | 0 |
| 170 | 0 | 132 | 1 | 187 | 0 | 157 | 0 |
| 160 | 0 | 187 | 0.7333333 | 156 | 0 | 170 | 0 |
| 183 | 0 | 160 | 0.7333333 | 160 | 0 | 160 | 0 |
| 149 | 0 | 46 | 0 | 157 | 0 | 149 | 0 |
| 142 | 0 | 80 | 0 | 170 | 0 | 133 | 0 |
| 165 | 0 | 66 | 0 | 183 | 0 | 178 | 0 |
| 153 | 0 | 44 | 0 | 165 | 0 | ||
| 71 | 0 | 142 | 0 | ||||
| 31 | 0 | 153 | 0 | ||||
| 47 | 0 | ||||||
| 61 | 0 | ||||||
| 36 | 0 | ||||||
| 57 | 0 | ||||||
| 60 | 0 | ||||||
| 68 | 0 | ||||||
| 95 | 0 | ||||||
| 147 | 0 | ||||||
| 170 | 0 | ||||||
| 157 | 0 | ||||||
| 142 | 0 | ||||||
| 149 | 0 | ||||||
| 153 | 0 | ||||||
| 166 | 0 | ||||||
| 199 | 0 | ||||||
| 151 | 0 | ||||||
| 138 | 0 | ||||||
| 137 | 0 | ||||||
| 176 | 0 | ||||||
| 193 | 0 | ||||||
| 198 | 0 | ||||||
Node betweenness.
Table 4
| Initiation | Inhibition | Shifting | 2-back | ||||
|---|---|---|---|---|---|---|---|
| Node | Closeness | Node | Closeness | Node | Closeness | Node | Closeness |
| 156 | 1 | 66 | 1 | 45 | 1 | 45 | 1 |
| 147 | 1 | 44 | 1 | 50 | 1 | 66 | 1 |
| 40 | 1 | 47 | 1 | 66 | 1 | 44 | 1 |
| 45 | 1 | 36 | 1 | 74 | 1 | 147 | 1 |
| 66 | 1 | 95 | 1 | 40 | 1 | 170 | 1 |
| 170 | 1 | 170 | 1 | 48 | 1 | 149 | 1 |
| 149 | 1 | 149 | 1 | 147 | 1 | 189 | 0.0181818 |
| 50 | 1 | 151 | 1 | 156 | 1 | 88 | 0.0172414 |
| 44 | 1 | 138 | 1 | 170 | 1 | 81 | 0.015625 |
| 142 | 1 | 193 | 1 | 183 | 1 | 192 | 0.0153846 |
| 189 | 0.0217391 | 40 | 0.5 | 142 | 1 | 73 | 0.0151515 |
| 182 | 0.0196078 | 99 | 0.5 | 153 | 1 | 134 | 0.0149254 |
| 90 | 0.0188679 | 132 | 0.5 | 189 | 0.0181818 | 182 | 0.0144928 |
| 73 | 0.0188679 | 31 | 0.3333333 | 88 | 0.0172414 | 72 | 0.0138889 |
| 72 | 0.0181818 | 57 | 0.3333333 | 89 | 0.0172414 | 50 | 0.0138889 |
| 82 | 0.0181818 | 142 | 0.3333333 | 192 | 0.0163934 | 82 | 0.0138889 |
| 81 | 0.0181818 | 199 | 0.3333333 | 81 | 0.016129 | 71 | 0.0138889 |
| 33 | 0.0181818 | 137 | 0.3333333 | 134 | 0.015873 | 187 | 0.0133333 |
| 134 | 0.0181818 | 198 | 0.3333333 | 136 | 0.015873 | 90 | 0.0131579 |
| 181 | 0.0163934 | 77 | 0.0049751 | 73 | 0.0149254 | 89 | 0.0131579 |
| 77 | 0.015873 | 182 | 0.0048077 | 90 | 0.0147059 | 32 | 0.0131579 |
| 89 | 0.015873 | 159 | 0.0048077 | 82 | 0.0142857 | 159 | 0.012987 |
| 48 | 0.015873 | 186 | 0.0044248 | 34 | 0.0140845 | 136 | 0.012987 |
| 136 | 0.015873 | 194 | 0.0044248 | 72 | 0.0140845 | 139 | 0.0126582 |
| 159 | 0.015625 | 88 | 0.0044053 | 58 | 0.0140845 | 58 | 0.0121951 |
| 179 | 0.015625 | 82 | 0.004329 | 139 | 0.0140845 | 160 | 0.0120482 |
| 186 | 0.0153846 | 81 | 0.004329 | 71 | 0.0138889 | 79 | 0.0119048 |
| 79 | 0.0153846 | 195 | 0.0042735 | 33 | 0.0136986 | 38 | 0.0119048 |
| 88 | 0.0153846 | 72 | 0.0042553 | 32 | 0.0136986 | 165 | 0.0117647 |
| 78 | 0.0153846 | 58 | 0.0041494 | 159 | 0.0136986 | 33 | 0.0116279 |
| 71 | 0.0153846 | 33 | 0.0041152 | 182 | 0.0133333 | 179 | 0.0114943 |
| 139 | 0.0149254 | 73 | 0.0040816 | 179 | 0.012987 | 34 | 0.0113636 |
| 192 | 0.0142857 | 96 | 0.0040161 | 160 | 0.0126582 | 135 | 0.011236 |
| 140 | 0.0140845 | 189 | 0.004 | 38 | 0.0123457 | 156 | 0.010989 |
| 32 | 0.0136986 | 79 | 0.0039526 | 181 | 0.0123457 | 178 | 0.010989 |
| 195 | 0.0136986 | 75 | 0.0039216 | 187 | 0.0114943 | 52 | 0.0106383 |
| 187 | 0.0135135 | 78 | 0.0038911 | 135 | 0.0114943 | 181 | 0.0105263 |
| 160 | 0.0135135 | 192 | 0.0038168 | 52 | 0.0113636 | 195 | 0.0105263 |
| 133 | 0.0133333 | 52 | 0.0038023 | 91 | 0.0113636 | 80 | 0.0104167 |
| 91 | 0.012987 | 134 | 0.0037879 | 80 | 0.0111111 | 186 | 0.009901 |
| 38 | 0.0126582 | 80 | 0.0037736 | 133 | 0.010989 | 91 | 0.0098039 |
| 52 | 0.0123457 | 139 | 0.0036232 | 79 | 0.0107527 | 140 | 0.0093458 |
| 153 | 0.0121951 | 136 | 0.0035971 | 195 | 0.0107527 | 68 | 0.0090909 |
| 58 | 0.0120482 | 97 | 0.0035842 | 165 | 0.0105263 | 75 | 0.0090909 |
| 80 | 0.0120482 | 74 | 0.0035587 | 150 | 0.009901 | 133 | 0.009009 |
| 34 | 0.0120482 | 181 | 0.0035461 | 140 | 0.0097087 | 157 | 0.0088496 |
| 97 | 0.0117647 | 187 | 0.0035461 | 157 | 0.0095238 | 150 | 0.0084034 |
| 74 | 0.0117647 | 160 | 0.0035461 | 60 | 0.009009 | 97 | 0.0083333 |
| 150 | 0.0108696 | 165 | 0.0035461 | 59 | 0.009009 | 78 | 0.0081967 |
| 37 | 0.0107527 | 133 | 0.0035211 | 186 | 0.0088496 | 77 | 0.0079365 |
| 157 | 0.01 | 90 | 0.0034843 | 96 | 0.0086957 | 37 | 0.0075758 |
| 165 | 0.0095238 | 89 | 0.0034364 | 97 | 0.008547 | 46 | 0.0072464 |
| 183 | 0.0093458 | 135 | 0.0034247 | 46 | 0.0084746 | 183 | 0.0068966 |
| 46 | 0.009009 | 50 | 0.0032787 | 61 | 0.0084746 | 74 | 0.0058824 |
| 61 | 0.009009 | 48 | 0.0032787 | 37 | 0.007874 | ||
| 71 | 0.0032573 | 77 | 0.0072993 | ||||
| 173 | 0.0032258 | 78 | 0.0072993 | ||||
| 32 | 0.0032154 | ||||||
| 183 | 0.0032051 | ||||||
| 38 | 0.0031949 | ||||||
| 34 | 0.0031949 | ||||||
| 157 | 0.003125 | ||||||
| 179 | 0.0030303 | ||||||
| 37 | 0.0030211 | ||||||
| 156 | 0.002924 | ||||||
| 176 | 0.002907 | ||||||
| 59 | 0.0028818 | ||||||
| 60 | 0.0028653 | ||||||
| 153 | 0.0027624 | ||||||
| 140 | 0.0027322 | ||||||
| 68 | 0.0027248 | ||||||
| 91 | 0.0026525 | ||||||
| 166 | 0.0024752 | ||||||
| 150 | 0.0023474 | ||||||
| 45 | 0.002079 | ||||||
| 46 | 0.0020704 | ||||||
| 61 | 0.0020704 | ||||||
| 147 | 0.0018587 | ||||||
Node closeness.
Table 5
| Metrics | Initiation | Inhibition | Shifting | 2-back | ||||
|---|---|---|---|---|---|---|---|---|
| Value | Interpretation | Value | Interpretation | Value | Interpretation | Value | Interpretation | |
| Modularity | 0.66 | Network divided into distinct communities | 0.62 | Network divided into distinct communities | 0.68 | Network divided into distinct communities | 0.69 | Network divided into distinct communities |
| Global Efficiency | 0.13 | Low efficiency in information transfer | 0.16 | Moderate efficiency in information transfer | 0.12 | Low efficiency in information transfer | 0.14 | Moderate efficiency in information transfer |
| Path length ratio | 0.87 | Observed path length is slightly lower than random path length | 1.31 | Observed path length is about 1.31 times longer than random path length | 1.00 | Observed path length is very close to random path length | 0.96 | Observed path length is slightly lower than random path length |
| Characteristic Path Length | 3.35 | Nodes are relatively close to each other in terms of network connectivity | 5.17 | Nodes are relatively distant from each other in terms of network connectivity | 3.91 | Nodes are relatively close to each other in terms of network connectivity | 3.93 | Nodes are relatively close to each other in terms of network connectivity |
| Assortativity | 0.07 | Slight assortativity, indicating a tendency for nodes with similar degrees to be connected. | 0.34 | Moderate tendency for nodes to attach to similar nodes | 0.37 | Moderate tendency for nodes to attach to similar nodes | 0.35 | Moderate tendency for nodes to attach to similar nodes |
| Edge Density | 0.04 | Low, indicating a sparse network with few connections. | 0.04 | Low, indicating a sparse network with few connections. | 0.04 | Low, indicating a sparse network with few connections. | 0.04 | Low, indicating a sparse network with few connections. |
| Small-worldness (sigma) | 0.00 | Not exhibiting small-world properties | 0.00 | Not exhibiting small-world properties | 0.00 | Not exhibiting small-world properties | 0.00 | Not exhibiting small-world properties |
| Transitivity | 0.00 | Absence of clustering | 0.00 | Absence of clustering | 0.00 | Absence of clustering | 0.00 | Absence of clustering |
| Clustering Coefficient | 0.00 | Absence of clustering | 0.00 | Absence of clustering | 0.00 | Absence of clustering | 0.00 | Absence of clustering |
Graph metrics across four executive tasks and their interpretations.
While it is frequently challenging to ascertain the most appropriate metrics for investigating brain networks (Bullmore and Sporns, 2009), centrality measures and small-world characteristics (e.g., high clustering coefficient and short characteristic path length) are indispensable for this process (He and Evans, 2010). Although there are no established criteria for “hub status,” most studies consider nodes with high centrality measures as hubs (Farahani et al., 2022; Fornito et al., 2016). In this study, weights denote the aggregate frequency of connections among participants. Local network measures were computed for each node (Brian region), including nodal strength, betweenness centrality, and closeness centrality. Nodes exhibiting the top 20% values for strength and betweenness were designated as hubs.
Furthermore, this study employed a novel centrality measure known as “expected force,” which quantifies a node’s potential influence within a network by summing the weights of its connections. This measure identifies critical nodes facilitating information flow, such as key brain regions in executive functions (Bullmore and Bassett, 2011). Nodes exhibiting high expected force are likely to influence other network nodes significantly. Unlike other centrality measures, expected force maintains reliability in network alterations, ensuring accuracy for incomplete or noisy systems (Lawyer, 2015). Therefore, potentially identify brain regions or connections that could be of interest in reorganization post-TBI or seizure disorders. Consequently, the top 20% of nodes with high expected force were identified as influencers.
Global network measures were also computed, including community detection, density, clustering coefficient, modularity, assortativity, characteristic path length, and small-worldedness. Community detection algorithms, such as Louvain and Infomap, identify subnetworks or modules (Hric et al., 2014). Assortativity measures the tendency of nodes in a network to connect with other nodes that have similar or dissimilar properties. In a brain network, it can be used to understand connectivity patterns (Rubinov and Sporns, 2010) and indirectly reflect network resilience (Farahani et al., 2019). Density reflects network connectivity, and modularity assesses community strength. The clustering coefficient indicates node clustering, while characteristic path length gauges information transfer efficiency.
Statistical analysis
Nonparametric (Kolmogorov–Smirnov) tests were employed to analyze the degree distribution of the graphs. The Kruskal-Wallis test was utilized to compare node strength and hubs across the tasks. In contrast, a pairwise comparison (Wilcoxon rank sum test) was used to elucidate their differences further.
Results
Tables 1–4 present each task’s node degree, strength, betweenness, and closeness. Table 6 and Figure 5 identify hubs with high strength and betweenness; Table 7 and Figure 6 highlight influencer nodes with high expected force. Figure 7 depicts the dendrogram for each graph’s edge betweenness community, and Tables 8–11 present the Louvain community for each graph. Figures 7, 8 illustrate the Louvain communities in the Schaefer atlas. Both algorithms yield comparable results.
Table 6
| All 4 graphs | ROI | Schaefer node label | Cortical areas |
|---|---|---|---|
| 72 | LH_ContC_pCun_1 | LH Control Network Precuneus 1 | |
| 182 | RH_ContC_pCun_2 | RH Control Network Precuneus 2 | |
| 189 | RH_DefaultA_PFCm_3 | RH Default Network medial prefrontal 3 |
| Initiation | ROI | Schaefer node label | Cortical areas |
|---|---|---|---|
| 33 | LH_DorsAttnA_SPL_2 | LH Dorsal Attention Network Superior Parietal Lobule 2 | |
| 72 | LH_ContC_pCun_1 | LH Control Network Precuneus 1 | |
| 73 | LH_ContC_pCun_2 | LH Control Network Precuneus 1 | |
| 159 | RH_LimbicB_OFC_3 | RH Limbic Network orbital frontal cortex 3 | |
| 182 | RH_ContC_pCun_2 | RH Control Network Precuneus 1 | |
| 186 | RH_DefaultA_pCunPCC_1 | LH Default Mode Network posterior cingulate cortex/precuneus 3 | |
| 189 | RH_DefaultA_PFCm_3 | RH Default Mode Network medial prefrontal cortex 3 |
| Inhibition | ROI | Schaefer node label | Cortical areas |
|---|---|---|---|
| 72 | LH_ContC_pCun_1 | LH Control Network Precuneus 1 | |
| 77 | LH_DefaultA_pCunPCC_1 | LH Default Mode Network posterior cingulate cortex/precuneus 1 | |
| 88 | LH_DefaultB_PFCd_1 | LH Default Mode Network dorsal prefrontal cortex 1 | |
| 90 | LH_DefaultB_PFCd_3 | LH Default Mode Network dorsal prefrontal cortex 3 | |
| 159 | RH_LimbicB_OFC_3 | RH Limbic Network orbital frontal cortex 3 | |
| 182 | RH_ContC_pCun_2 | RH Control Network Precuneus 1 | |
| 186 | RH_DefaultA_pCunPCC_1 | LH Default Mode Network posterior cingulate cortex/precuneus 3 | |
| 189 | RH_DefaultA_PFCm_3 | Right Default Mode Network medial prefrontal cortex 3 |
| Shifting | ROI | Schaefer node label | Cortical areas |
|---|---|---|---|
| 72 | LH_ContC_pCun_1 | LH Control Network precuneus 1 | |
| 73 | LH_ContC_pCun_2 | LH Control Network precuneus 2 | |
| 79 | LH_DefaultA_pCunPCC_3 | LH Default Mode Network posterior cingulate cortex/precuneus 3 | |
| 134 | RH_DorsAttnA_SPL_2 | RH Dorsal Attention Network Superior Parietal Lobule 2 | |
| 136 | RH_DorsAttnA_SPL_4 | RH Dorsal Attention Network Superior Parietal Lobule 4 | |
| 182 | RH_ContC_pCun_2 | RH Control Network Precuneus 2 | |
| 189 | RH_DefaultA_PFCm_3 | RH Default Mode Network medial prefrontal cortex 3 |
| Working memory | ROI | Schaefer node label | Cortical areas |
|---|---|---|---|
| 33 | LH_DorsAttnA_SPL_2 | LH Dorsal Attention Network Superior Parietal Lobule 2 | |
| 72 | LH_ContC_pCun_1 | LH Control Network precuneus 1 | |
| 73 | LH_ContC_pCun_2 | LH Control Network precuneus 2 | |
| 159 | RH_LimbicB_OFC_3 | RH Limbic Network orbital frontal cortex 3 | |
| 182 | RH_ContC_pCun_2 | RH Control Network Precuneus 2 | |
| 186 | RH_DefaultA_pCunPCC_1 | LH Default Mode Network posterior cingulate cortex/precuneus 3 | |
| 189 | RH_DefaultA_PFCm_3 | RH Default Mode Network medial prefrontal cortex 3 |
Hubs.
Figure 5
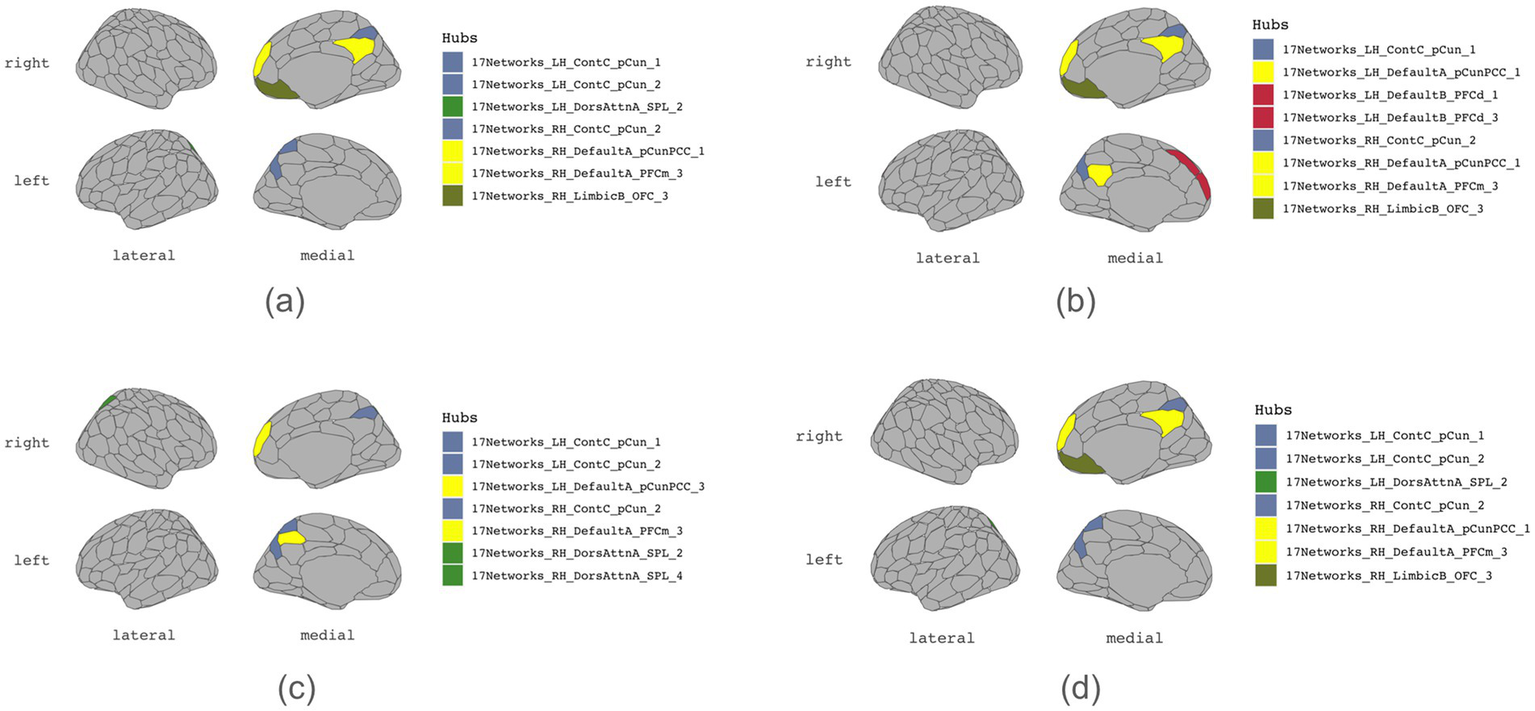
Hubs. (a) Initiation, (b) Inhibition, (c) Shifting, (d) 2-back.
Table 7
| Initiation | ROI | Schaefer node label | Cortical areas |
|---|---|---|---|
| 33 | LH_DorsAttnA_SPL_2 | LH Dorsal Attention Network Superior Parietal Lobule 2 | |
| 72 | LH_ContC_pCun_1 | LH Control Network precuneus 1 | |
| 73 | LH_ContC_pCun_2 | LH Control Network precuneus 2 | |
| 134 | RH_DorsAttnA_SPL_2 | RH Dorsal Attention Network Superior Parietal Lobule 2 | |
| 136 | RH_DorsAttnA_SPL_4 | RH Dorsal Attention Network Superior Parietal Lobule 4 | |
| 139 | RH_DorsAttnB_PostC_3 | RH Dorsal Attention Network Post Central gyrus (medial segment) | |
| 159 | RH_LimbicB_OFC_3 | RH Limbic Network orbital frontal cortex 3 | |
| 181 | RH_ContC_pCun_1 | RH Control Network precuneus 1 | |
| 182 | RH_ContC_pCun_2 | RH Control Network precuneus 2 | |
| 186 | RH_DefaultA_pCunPCC_1 | LH Default Mode Network posterior cingulate cortex/precuneus 3 | |
| 189 | RH_DefaultA_PFCm_3 | RH Default Mode Network medial prefrontal cortex 3 |
| Inhibition | ROI | Schaefer node label | Cortical areas |
|---|---|---|---|
| 32 | LH_DorsAttnA_SPL_1 | LH Dorsal Attention Network Superior Parietal Lobule 1 | |
| 33 | LH_DorsAttnA_SPL_2 | LH Dorsal Attention Network Superior Parietal Lobule 2 | |
| 58 | LH_ContA_IPS_1 | LH Control Network Inferial Parietal Sulcus 1 | |
| 72 | LH_ContC_pCun_1 | LH Control Network precuneus 1 | |
| 73 | LH_ContC_pCun_2 | LH Control Network precuneus 2 | |
| 96 | LH_DefaultC_IPL_1 | LH Default Network Inferior Parietal Lobule 1 | |
| 133 | RH_DorsAttnA_SPL_1 | RH Dorsal Attention Network Superior Parietal Lobule 1 | |
| 134 | RH_DorsAttnA_SPL_2 | RH Dorsal Attention Network Superior Parietal Lobule 2 | |
| 136 | RH_DorsAttnA_SPL_4 | RH Dorsal Attention Network Superior Parietal Lobule 4 | |
| 139 | RH_DorsAttnB_PostC_3 | RH Dorsal Attention Network Post Central gyrus (medial segment) | |
| 159 | RH_LimbicB_OFC_3 | RH Limbic Network orbital frontal cortex 3 | |
| 181 | RH_ContC_pCun_1 | RH Control Network precuneus 1 | |
| 182 | RH_ContC_pCun_2 | RH Control Network precuneus 2 | |
| 186 | RH_DefaultA_pCunPCC_1 | LH Default Mode Network posterior cingulate cortex/precuneus 3 | |
| 189 | RH_DefaultA_PFCm_3 | RH Default Mode Network medial prefrontal cortex 3 | |
| 194 | RH_DefaultC_IPL_1 | RH Default Network Inferior Parietal Lobule 1 |
| Shifting | ROI | Schaefer node label | Cortical areas |
|---|---|---|---|
| 32 | LH_DorsAttnA_SPL_1 | LH Dorsal Attention Network Superior Parietal Lobule 1 | |
| 33 | LH_DorsAttnA_SPL_2 | LH Dorsal Attention Network Superior Parietal Lobule 2 | |
| 34 | LH_DorsAttnA_SPL_3 | LH Dorsal Attention Network Superior Parietal Lobule 3 | |
| 58 | LH_ContA_IPS_1 | LH Control Network Inferial Parietal Sulcus 1 | |
| 72 | LH_ContC_pCun_1 | LH Control Network precuneus 1 | |
| 73 | LH_ContC_pCun_2 | LH Control Network precuneus 2 | |
| 133 | RH_DorsAttnA_SPL_1 | RH Dorsal Attention Network Superior Parietal Lobule 1 | |
| 134 | RH_DorsAttnA_SPL_2 | RH Dorsal Attention Network Superior Parietal Lobule 2 | |
| 135 | RH_DorsAttnA_SPL_3 | RH Dorsal Attention Network Superior Parietal Lobule 3 | |
| 136 | RH_DorsAttnA_SPL_4 | RH Dorsal Attention Network Superior Parietal Lobule 4 | |
| 139 | RH_DorsAttnB_PostC_3 | RH Dorsal Attention Network Post Central gyrus (medial segment) | |
| 189 | RH_DefaultA_PFCm_3 | RH Default Mode Network medial prefrontal cortex 3 |
| Working memory | ROI | Schaefer node label | Cortical areas |
|---|---|---|---|
| 33 | LH_DorsAttnA_SPL_2 | LH Dorsal Attention Network Superior Parietal Lobule 2 | |
| 38 | LH_DorsAttnB_PostC_4 | LH Dorsal Attention Network Post Central Gyrus 4 | |
| 58 | LH_ContA_IPS_1 | LH Control Network Inferial Parietal Sulcus 1 | |
| 72 | LH_ContC_pCun_1 | LH Control Network precuneus 1 | |
| 73 | LH_ContC_pCun_2 | LH Control Network precuneus 2 | |
| 134 | RH_DorsAttnA_SPL_2 | RH Dorsal Attention Network Superior Parietal Lobule 2 | |
| 136 | RH_DorsAttnA_SPL_4 | RH Dorsal Attention Network Superior Parietal Lobule 4 | |
| 139 | RH_DorsAttnB_PostC_3 | RH Dorsal Attention Network Post Central gyrus (medial segment) | |
| 165 | RH_ContA_IPS_1 | RH Control Network Inferial Parietal Sulcus 1 | |
| 182 | RH_ContC_pCun_2 | RH Control Network Precuneus 2 | |
| 189 | RH_DefaultA_PFCm_3 | RH Default Mode Network medial prefrontal cortex 3 |
| Common influencers | ROI | Schaefer node label | Cortical areas |
|---|---|---|---|
| 33 | LH_DorsAttnA_SPL_2 | LH Dorsal Attention Network Superior Parietal Lobule 2 | |
| 72 | LH_ContC_pCun_1 | LH Control Network precuneus 1 | |
| 73 | LH_ContC_pCun_2 | LH Control Network precuneus 2 | |
| 134 | RH_DorsAttnA_SPL_2 | RH Dorsal Attention Network Superior Parietal Lobule 2 | |
| 136 | RH_DorsAttnA_SPL_4 | RH Dorsal Attention Network Superior Parietal Lobule 4 | |
| 139 | RH_DorsAttnB_PostC_3 | RH Dorsal Attention Network Post Central gyrus (medial segment) | |
| 189 | RH_DefaultA_PFCm_3 | RH Default Mode Network medial prefrontal cortex 3 |
Influencers.
Figure 6

Influencers. (a) Initiation, (b) Inhibition, (c) Shifting, (d) 2-back.
Figure 7

Hierarchical edge betweenness community. (a) Initiation, (b) Inhibition, (c) Shifting, (d) 2-back.
Table 8
| Louvain community | Nodes | Edge betweenness community | Nodes |
|---|---|---|---|
| 1 | 77, 79, 97, 78, 74, 186, 182, 195, 183 | 1 | 77, 79, 97, 72, 78, 74, 186, 182, 195, 183, 133 |
| 2 | 88, 80, 82, 52, 81, 48, 71, 189, 159, 187, 160, 157, 153 | 2 | 88, 80, 82, 52, 81, 48, 71, 189, 159, 187, 160, 157, 153 |
| 3 | 46, 90, 89, 91, 61, 150, 179, 192 | 3 | 46, 90, 89, 91, 61, 150, 179, 192 |
| 4 | 33, 72, 32, 134, 181, 133 | 4 | 33, 73, 38, 34, 32, 37, 58, 134, 139, 181, 140, 136, 165 |
| 5 | 73, 38, 34, 37, 58, 139, 140, 136, 165 | 5 | 45, 147 |
| 6 | 45, 147 | 6 | 50, 156 |
| 7 | 50, 156 | 7 | 66, 170 |
| 8 | 66, 170 | 8 | 44, 149 |
| 9 | 44, 149 | 9 | 40, 142 |
| 10 | 40, 142 |
Louvain community and edge betweenness community for initiation graph.
Table 9
| Louvain community | Nodes | Edge betweenness community | Nodes |
|---|---|---|---|
| 1 | 77, 79, 97, 72, 78, 74, 96, 186, 182, 195, 183, 133, 194 | 1 | 77, 79, 72, 75, 182, 195, 165, 194 |
| 2 | 88, 90, 80, 52, 82, 50, 81, 89, 48, 71, 189, 159, 187, 156, 160, 192, 157, 153, 176 | 2 | 88, 80, 82, 81, 48, 71, 189, 159, 187, 160, 153 |
| 3 | 46, 45, 91, 61, 179, 150, 147 | 3 | 33, 73, 38, 34, 32, 58, 96, 37, 134, 139, 181, 136, 140, 133 |
| 4 | 33, 73, 38, 34, 32, 37, 134, 139, 181, 136, 140 | 4 | 90, 50, 89, 179, 156, 192, 176 |
| 5 | 58, 59, 75, 60, 68, 165, 135, 173, 166 | 5 | 46, 45, 91, 61, 150, 147 |
| 6 | 66, 170 | 6 | 97, 78, 74, 186, 183 |
| 7 | 40, 142, 137 | 7 | 52, 157 |
| 8 | 44, 149 | 8 | 66, 170 |
| 9 | 31, 57, 132 | 9 | 40, 142, 137 |
| 10 | 99, 199, 198 | 10 | 44, 149 |
| 11 | 47, 151 | 11 | 59, 60, 135, 166 |
| 12 | 36, 138 | 12 | 31, 57, 132 |
| 13 | 95, 193 | 13 | 99, 199, 198 |
| 14 | 47, 151 | ||
| 15 | 36, 138 | ||
| 16 | 68, 173 | ||
| 17 | 95, 193 |
Louvain community and edge betweenness community for inhibition graph.
Table 10
| Louvain community | Nodes | Edge betweenness community | Nodes |
|---|---|---|---|
| 1 | 77, 79, 78, 186 | 1 | 77, 79, 78, 186 |
| 2 | 88, 82, 89, 71, 189, 187, 192 | 2 | 88, 82, 89, 71, 189, 187, 192 |
| 3 | 90, 46, 91, 61, 179, 150 | 3 | 73, 33, 34, 38, 58, 32, 96, 139, 134, 136, 133, 165 |
| 4 | 73, 33, 34, 38, 32, 96, 37, 139, 134, 182, 136, 140, 133 | 4 | 90, 46, 91, 61, 179, 150 |
| 5 | 80, 52, 81, 159, 160, 157 | 5 | 45, 147 |
| 6 | 72, 97, 181, 195 | 6 | 72, 97, 182, 181, 195 |
| 7 | 58, 60, 59, 165, 135 | 7 | 80, 52, 81, 159, 160, 157 |
| 8 | 50, 156 | 8 | 50, 156 |
| 9 | 45, 147 | 9 | 66, 170 |
| 10 | 66, 170 | 10 | 74, 183 |
| 11 | 74, 183 | 11 | 60, 59, 135 |
| 12 | 40, 142 | 12 | 37, 140 |
| 13 | 48, 153 | 13 | 40, 142 |
| 14 | 48, 153 |
Louvain community and edge betweenness community for shifting graph.
Table 11
| Louvain community | Nodes | Edge betweenness community | Nodes |
|---|---|---|---|
| 1 | 77, 79, 78, 74, 186, 182, 183 | 1 | 88, 50, 82, 71, 189, 156, 187, 178 |
| 2 | 88, 50, 82, 71, 189, 156, 187, 178 | 2 | 77, 79, 78, 74, 186, 183 |
| 3 | 90, 46, 89, 91, 179, 150, 192 | 3 | 73, 33, 38, 34, 58, 68, 75, 139, 134, 136, 165, 135, 133 |
| 4 | 33, 38, 34, 37, 139, 136, 140, 133 | 4 | 90, 46, 89, 91, 179, 150, 192 |
| 5 | 80, 52, 81, 159, 157, 160 | 5 | 72, 97, 32, 182, 181, 195 |
| 6 | 72, 97, 32, 134, 181, 195 | 6 | 80, 52, 81, 159, 157, 160 |
| 7 | 73, 58, 68, 75, 165, 135 | 7 | 45, 147 |
| 8 | 45, 147 | 8 | 66, 170 |
| 9 | 66, 170 | 9 | 44, 149 |
| 10 | 44, 149 | 10 | 37, 140 |
Louvain community and edge betweenness community for 2-back graph.
Figure 8

Main Louvain communities plotted on brain atlas. (a) Initiation, (b) Inhibition, (c) Shifting, (d) 2-back.
A comparative analysis of graph network measures across subdomains of executive functioning, including initiation, cognitive inhibition, mental shifting, and working memory, unveiled nuanced variations and commonalities in the organization and functional connectivity patterns. Specific brain regions consistently emerged as prominent hubs (Table 6), facilitating information exchange within the graph of all four subdomains of executive function. These regions include the bilateral precuneus (LH_ContC_pCun_1, RH_ContC_pCun_2) and the right medial prefrontal cortex (DMN) (RH_DefaultA_PFCm_3). Notably, these regions exhibited high node strength and betweenness centrality and are connected to each other, indicating their pivotal role in facilitating executive functioning processes. Closeness centrality analysis revealed that several nodes in each graph exhibit a closeness of 1 (Table 4), yet they form isolated subnetworks. Nodes with the following highest closeness values are notably low, suggesting their relative distance from other nodes regarding functional connectivity. This implies reduced efficiency in transmitting information or influence across the broader brain network.
A Kolmogorov–Smirnov test compared the observed network properties with those of randomly generated networks, revealing significant differences in degree distributions (Table 12). Considerable variations were identified among the shared ROIs across the four subdomains. Utilizing a Kruskal-Wallis test, we observed a chi-squared value of 21.634 and a p-value of 7.772e-05, indicating statistically significant discrepancies in strength across the four tasks. As depicted using the Wilcoxon rank sum test (Table 13), notable disparities in the strength of common nodes (ROIs) were evident, particularly between inhibition and the other functions. Conversely, no statistically significant distinctions between initiation, shifting, and the 2-back tasks were observed (Table 14).
Table 12
| Initiation | Inhibition | Shifting | 2-back | ||||
|---|---|---|---|---|---|---|---|
| Degree | Distribution | Degree | Distribution | Degree | Distribution | Degree | Distribution |
| 1 | 0.4 | 1 | 0.3461538 | 1 | 0.4736842 | 1 | 0.3518519 |
| 2 | 0.2363636 | 2 | 0.2179487 | 2 | 0.1929825 | 2 | 0.2962963 |
| 3 | 0.1818182 | 3 | 0.1153846 | 3 | 0.1403509 | 3 | 0.1481481 |
| 6 | 0.0545455 | 4 | 0.0897436 | 4 | 0.1403509 | 4 | 0.1296296 |
| 5 | 0.0545455 | 5 | 0.1153846 | 5 | 0.0175439 | 5 | 0.037037 |
| 7 | 0.0181818 | 6 | 0.0512821 | 6 | 0.0350877 | 6 | 0.0185185 |
| 7 | 0.0128205 | 7 | 0.0185185 | ||||
| 8 | 0.0512821 | ||||||
Degree distribution.
Table 13
| Tasks | Initiation | Inhibition | Shifting |
|---|---|---|---|
| Inhibition | 0.0026 | – | – |
| Shifting | 1 | 0.0154 | – |
| 2back | 1 | 0.0001 | 0.9116 |
Pairwise comparisons using the Wilcoxon rank sum test.
Table 14
| Initiation | Inhibition | Shifting | 2-back | ||||
|---|---|---|---|---|---|---|---|
| D | p-value | D | p-value | D | p-value | D | p-value |
| 0.85455 | 2.01E-05 | 0.96154 | 3.11E-09 | 0.87719 | 2.65E-05 | 0.87037 | 8.14E-06 |
Kolmogorov–Smirnov test results.
Unique regions of interest (ROIs) specific to each task (Table 15) are also analyzed. ROIs 194, 135, 96, and 75 exhibit high degrees but low strength. The inhibition graph possesses the highest number of distinct ROIs compared to the other graphs and appears to be the most distinctive among the four. Kruskal-Wallis rank sum tests were performed for a list of hubs from each graph, resulting in a p-value of 0.7965. This indicates no significant difference in the hubs among the graphs.
Table 15
| Node | Initiation | Inhibition | Shifting | Two back |
|---|---|---|---|---|
| 31 | NA | 1 | NA | NA |
| 36 | NA | 1 | NA | NA |
| 40 | 1 | 2 | 1 | NA |
| 44 | 1 | 1 | NA | 1 |
| 47 | NA | 1 | NA | NA |
| 48 | 2 | 2 | 1 | NA |
| 57 | NA | 1 | NA | NA |
| 59 | NA | 2 | 1 | NA |
| 60 | NA | 1 | 1 | NA |
| 61 | 1 | 1 | 1 | NA |
| 68 | NA | 1 | NA | 1 |
| 75 | NA | 4 | NA | 1 |
| 95 | NA | 1 | NA | NA |
| 96 | NA | 5 | 1 | NA |
| 99 | NA | 2 | NA | NA |
| 132 | NA | 2 | NA | NA |
| 135 | NA | 3 | 4 | 2 |
| 137 | NA | 1 | NA | NA |
| 138 | NA | 1 | NA | NA |
| 142 | 1 | 1 | 1 | NA |
| 149 | 1 | 1 | NA | 1 |
| 151 | NA | 1 | NA | NA |
| 153 | 1 | 1 | 1 | NA |
| 166 | NA | 1 | NA | NA |
| 167 | NA | NA | 2 | NA |
| 169 | NA | NA | 1 | NA |
| 173 | NA | 2 | NA | NA |
| 175 | NA | NA | 1 | NA |
| 176 | NA | 1 | NA | NA |
| 178 | NA | NA | NA | 1 |
| 193 | NA | 1 | NA | NA |
| 194 | NA | 5 | NA | NA |
| 198 | NA | 1 | NA | NA |
| 199 | NA | 1 | NA | NA |
Distinct nodes across tasks.
Unique to the cognitive inhibition graph are regions LH_DefaultA_pCunPCC_1 (left posterior cingulate cortex/precuneus), LH_DefaultB_PFCd_1 (left dorsal prefrontal cortex 1), and LH_DefaultB_PFCd_3 (left dorsal prefrontal cortex 3) (ROIs 77, 88, and 90), which emerge as hubs. Conversely, in the mental shifting graph, regions LH_DefaultA_pCunPCC_3 (left posterior cingulate cortex/precuneus 3), RH_DorsAttnA_SPL_2 (right superior parietal lobule 2), and RH_DorsAttnA_SPL_4 (right superior parietal lobule 4)(ROIs 134, 136, and 79) assume hub roles. Regions unique to cognitive inhibition and mental shifting (Table 15) were detected. In the inhibition graph, ROIs 75, 96, and 194 (LH_DefaultA_IPL_1, LH_DefaultC_IPL_1, and RH_DefaultC_IPL_1), specifically, bilateral inferior parietal lobule, were identified as key regions of connectivity. In contrast, the shifting graph exhibited uniquely high connections involving ROI 135 (RH_DorsAttnA_SPL_3), the right superior parietal lobule.
Furthermore, each executive subdomain was associated with distinct influencers (Table 12). Notably, many of the identified influencers also function as hubs. Additionally, initiation function is influenced by ROIs 136, 134, and 139 (RH Dorsal Attention Network Superior Parietal Lobule 2, RH Dorsal Attention Network Superior Parietal Lobule 4, and RH Dorsal Attention Network Post Central gyrus (medial segment)) as influencers. Cognitive inhibition is influenced by several regions of interest (ROIs) in the human brain, including:
-
Left Hemisphere: Superior Parietal Lobule 1 (LH Dorsal Attention Network), Inferior Parietal Sulcus 1 (LH Control Network), and Inferior Parietal Lobule 1 (LH Default Network).
-
Right Hemisphere: Superior Parietal Lobule 1 (RH Dorsal Attention Network), Superior Parietal Lobule 4 (RH Dorsal Attention Network), Post Central Gyrus (medial segment) (RH Dorsal Attention Network), Precuneus 1 (RH Control Network), and Inferior Parietal Lobule 1 (RH Default Network).
-
Mental shifting requires influences from ROIs 32, 33, 34, 58, 133, and 135 (LH Dorsal Attention Network Superior Parietal Lobule 1, LH Dorsal Attention Network Superior Parietal Lobule 2, LH Dorsal Attention Network Superior Parietal Lobule 3, LH Control Network Inferior Parietal Sulcus 1, RH Dorsal Attention Network Superior Parietal Lobule 1, and RH Dorsal Attention Network Superior Parietal Lobule 3).
-
Working memory requires influences from ROIs 38, 58, and 165 (LH Dorsal Attention Network Post Central Gyrus 4, LH Control Network Inferior Parietal Sulcus 1, and RH Control Network Inferior Parietal Sulcus 1).
Brain graphs with a short characteristic path length are believed to integrate information more efficiently between nodes (Paldino et al., 2016). In contrast, inhibition graphs exhibit a relatively long characteristic path length of 5.1681 compared to the initiation, mental shifting, and working memory graphs (3.348269, 3.9143, and 3.9273, respectively). Initiation has a lower assertiveness value, indicating a more neutral or distributed balance, balancing local and global connectivity. However, it might rely more on specific hubs for overall functionality, making it vulnerable to hub damage, as seen in conditions like stroke or traumatic brain injury. Global efficiency is inversely proportional to the topological distance between nodes and is typically interpreted as a measure of the capacity for parallel information transfer and integrated processing (Bullmore and Sporns, 2009). The observation that all graphs exhibit low to moderate levels of global efficiency suggests that the brain regions are not highly interconnected, thereby limiting the efficiency of information transmission across the network. Furthermore, the degree distribution (Table 5) exhibited characteristics of an exponentially truncated power law distribution. In other words, most nodes have relatively low degrees, while some have extremely high degrees.
The clustering coefficient provides insight into the local connectivity of nodes within a network, reflecting the extent to which neighboring nodes are interconnected (Bullmore and Sporns, 2009). It assesses the prevalence of clustered connections among nearby nodes, indicating the likelihood of forming local clusters or communities. Path transitivity evaluates the number of local detours along a path, contributing to understanding how efficiently information flows within the network. Graphs with a high small-world value exhibit densely clustered local connections and optimal long-range connections, facilitating efficient information processing at minimal cost (Bassett and Bullmore, 2006; Bullmore and Sporns, 2009). The clustering coefficient, transitivity, and small-worldedness sigma of 0 indicate a decentralized structure. However, modularity values of all four graphs suggest the presence of distinct communities across all subdomains of executive function, highlighting the absence of local clustering. Indeed, the community detection analysis unveils a rich modular structure within each graph (Figures 3, 4; Tables 8–11).
Discussion and clinical implications
The evolution of graph theory in cognitive neuroscience has provided valuable insights into the intricate connections within the human brain, offering a robust framework for understanding cognitive processes and their neural underpinnings (Bullmore and Sporns, 2009; Farahani et al., 2019; Medaglia, 2017; Medaglia et al., 2015). Executive functioning, essential for daily activities (Zelazo et al., 2004), encompasses various cognitive processes. This study enhances our understanding of executive functioning in healthy adults by identifying key hub/influencer regions and analyzing local and global properties of subdomains of executive functioning, namely, initiation, cognitive inhibition, mental shifting, and working memory.
Hubs and influencers
Our hypothesis that specific brain regions will serve as critical hubs or “influencers” across these tasks was confirmed. The precuneus and right medial prefrontal cortex (mPFC) emerged as crucial hubs for all four subdomains of executive function. Our findings also support previous research highlighting the dorsolateral prefrontal cortex (DLPFC), anterior cingulate cortex (ACC), and parietal regions as key components of executive function.
Both the precuneus and mPFC have been identified as integral components of the default mode network (DMN), which is typically active during rest and internally directed thought (Cavanna and Trimble, 2006; Yeager et al., 2022; Friedman and Robbins, 2022; Jobson et al., 2021; Menon and D’Esposito, 2022). The DMN deactivates during cognitively demanding tasks, allowing for more focused information processing (Jin et al., 2012; Leech and Sharp, 2014; Salgado-Pineda et al., 2021; Billette et al., 2022; Xu et al., 2019).
In our study, the precuneus exhibited connectivity with the posterior cingulate cortex (PCC), which deactivates alongside the precuneus during executive function tasks (Raichle, 2015), as well as with the inferior and superior parietal cortices, which exhibit task-dependent activation levels (Yeo et al., 2015). Similarly, the right mPFC showed strong connectivity with other prefrontal regions, which are generally activated during executive functions.
Given their role as hubs and “influencers,” the mPFC and precuneus likely regulate network-wide activity, influencing when to engage or suppress cognitive processes depending on task demands. Dysfunction in these regions is associated with attention deficits, impaired self-referential thinking, and decision-making difficulties and has been linked to neurological disorders such as Alzheimer’s disease, schizophrenia, and depression (Buckner et al., 2009; Menon, 2011). These findings highlight the potential of these regions as targets for neuromodulation techniques, such as transcranial magnetic stimulation (TMS), to enhance executive function in individuals affected by stroke, neurodegeneration, or cognitive impairments (Guse et al., 2010).
While the literature on the right hemisphere is less extensive, surgical mapping studies have indicated the involvement of the right ventromedial prefrontal cortex (vmPFC) and orbital frontal areas in facial emotion recognition and theory of mind (Bernard et al., 2018). Our findings suggest a hub and influencer role for the right mPFC in executive functioning, contributing to our understanding of right hemisphere involvement in cognitive processes.
In addition to hub regions shared by all four subdomains of executive functions, our findings also identified unique hubs for cognitive inhibition as the left posterior cingulate cortex/precuneus and the left dorsal prefrontal cortex. Moreover, the mental shifting function relied on hub regions such as the left posterior cingulate cortex/precuneus and the right superior parietal lobule. The superior parietal lobule had previously been studied for the function of attentional shifting (Wang et al., 2014). Interestingly, bilateral inferior parietal lobules exhibited high connectivity in cognitive inhibition, aligning with the previous study on the parietal cortex’s contribution to inhibitory processes (Kolodny et al., 2017). Potential treatment strategies could be developed by targeting these regions for executive function disorders such as ADHD and inhibitory control disorders.
In addition to the “influencer” regions shared by all four subdomains, the bilateral superior parietal lobule and the right post-central gyrus (medial segment) are also identified as “influencers.” The superior parietal lobule is considered to play a pivotal role in numerous cognitive functions (Wang et al., 2014). The bilateral inferior parietal sulcus (IPS) plays an “influencer” role in cognitive inhibition, mental shifting, and working memory. This is similar to another study suggesting that IPS plays an essential role in executive functioning, particularly inhibition (Osada et al., 2019). Working memory appears to have a segment of the left post-central gyrus (DAN) as an “influencer,” similar to the findings on working memory among early Parkinson’s patients (Alsakaji et al., 2021). A segment of the right inferior parietal lobule (IPSL) appears to be an “influencer” of cognitive inhibition, which could be attributed to its involvement in visual attention (Corbetta and Shulman, 2002). As mentioned, “influencers” are more resilient to network reorganization. Therefore, these regions could be potential targets for the treatment of executive function deficits post-TBI, seizure disorders, or post-tumor resection.
Efficiency and communities
Unlike our hypothesis, each subdomain of the executive function showed similar network features except for inhibition. We also did not find increased connectivity in control-related regions or higher modularity for working memory. However, the cognitive inhibition graph exhibits slightly longer characteristic path lengths and greater overall region involvement than its counterparts, such as the parieto-occipital cortex (DAN) and temporal–parietal regions. These findings suggest cognitive inhibition involves a brain network organization that prioritizes specialized information transfer between regions, emphasizing the distinct nature of inhibitory control processes within the executive network. While this may result in less efficient overall network function, it may also reflect a more targeted and specialized approach to cognitive processing in inhibition.
Conversely, initiation, mental shifting, and working memory have shorter path lengths, which could minimize the metabolic cost associated with routing action potentials across axons and synaptic contacts and, hence, could provide faster, more direct, and less noisy information transfer (Bullmore and Sporns, 2009). Our analysis of graph metrics collectively implies a decentralized and modular functioning organization, wherein information processing occurs across distributed networks rather than being confined to specific localized regions.
Distinct subsystems of communities consistently emerge across four subdomains, prominently featuring medial parietal regions and the posterior medial frontal area across all four executive functioning subdomains. Echoing established findings, the medial prefrontal region exhibits a recurring presence during executive tasks yet notably delineates into two discernible subsystems: the dorsomedial prefrontal cortex (dmPFC) and ventromedial prefrontal cortex (vmPFC), particularly during mental shifting and working memory processes. This partition may stem from the dmPFC’s primary connections to the neocortex, while the vmPFC primarily interfaces with the limbic system (Jobson et al., 2021).
Vulnerability and resilience
Unlike our hypothesis, we did not find significant differences in their topological properties across tasks related to these four subdomains of executive functions. Our findings support a more distributed network topology for all four subdomains of executive functions. A distributed network, which does not rely heavily on single central components, offers resilience to random damage, as observed in the human brain’s robust response to lesions (Achard et al., 2006; Aerts et al., 2016), especially in a pediatric population (Guan et al., 2024). This resilience provides a framework for understanding the brain’s ability to maintain cognitive functions even after injury.
On the other hand, The vulnerability of hub regions to targeted damage highlights their critical role. Lesions in these hubs, such as those occurring in stroke or traumatic brain injury, can significantly impair executive functioning. Initiation stood out as it exhibits a low assortativity value, indicating a distributed network with balanced local and global connectivity but relying on hubs and communities (mPFC). Therefore, it could be more vulnerable than the other executive functions. Indeed, motivational and initiation deficits frequently occur in individuals with acquired brain injury, where prefrontal areas are more vulnerable (Palmisano et al., 2020). This understanding could guide clinical interventions, such as targeted behavioral therapy or deep brain stimulation, to restore function in affected regions (Aerts et al., 2016). Moreover, alterations in global network topology observed in conditions like Alzheimer’s disease, multiple sclerosis, and epilepsy suggest that these pathologies may function as “disconnection syndromes,” where disrupted connectivity underlies cognitive deficits (Guye et al., 2010). Understanding brain networks’ distributed and resilient nature can inform rehabilitation strategies to leverage intact pathways to compensate for lost functions. Further research is needed to explore how these network characteristics evolve across different conditions and stages of brain damage.
Recent studies have further highlighted the clinical implications of distributed network topology in executive functions. For instance, research shows that the topological properties of the frontoparietal network (FPN) and default mode network (DMN) are associated with executive function performance across the lifespan, with the DMN showing greater sensitivity to age-related changes (Menardi et al., 2024). Additionally, alterations in network topology have been observed in patients with mild cognitive impairment (MCI), suggesting that changes in network organization could serve as imaging markers for early diagnosis and intervention before Alzheimer’s disease onset (Xue et al., 2024).
Recent research has also emphasized the role of hub regions in neurological disorders. For example, in Parkinson’s disease, the spread of α-synuclein through connected brain regions leads to neuronal loss and network disruptions, with hub regions playing a significant role in this process (Frigerio et al., 2024). Understanding the involvement of hub regions is becoming increasingly important for clinical practice, as these hubs are critical for maintaining normal brain function and enabling complex behavior (Stam, 2024). These findings reinforce the importance of network topology in developing targeted interventions and rehabilitation strategies for various neurological conditions.
Limitations and future direction
Several limitations exist besides the small sample size and exclusive focus on the brain’s cortical areas. A key concern is that the cognitive paradigms used may not adequately capture the complex nuances of the four subdomains of executive functioning: initiation, inhibition, mental shifting, and working memory. While these paradigms provide valuable insights, they may not fully reflect the intricacies of these cognitive processes. This limitation underscores the need for future research to employ various cognitive tasks for a more thorough assessment of executive functioning.
Additionally, while graph analysis yields important insights into the dynamics of brain networks associated with cognitive tasks, several significant limitations exist. Reducing the brain into nodes and edges oversimplifies its inherent complexity, and the decisions made regarding the parcellation schemes and network construction parameters can significantly impact the results. Factors such as the spatial and temporal resolution of neuroimaging data, individual variability, and subjective thresholding methods introduce potential confounding variables. Furthermore, the cross-sectional nature of the analysis limits our understanding of how these dynamics change over time. Interpreting graph metrics concerning neural processes also requires caution due to their context-dependent nature. Addressing these limitations is critical for enhancing our understanding of brain network organization and functionality.
Despite these constraints, the study significantly contributes to our understanding of how brain networks support various cognitive processes. Future research should explore the subdomains of executive functioning with diverse cognitive paradigms, expand data collection to include subcortical activities and examine the complex interplay between brain networks and cognitive processes.
Conclusion
This study enhances our understanding of executive functioning by identifying key hubs, influencers, and communities while examining local and global network characteristics across four subdomains of executive function. Central areas such as the bilateral precuneus and the right medial prefrontal area are indispensable for integrating, transmitting information, and regulating activities within distributed networks, rendering them essential to executive functioning. Damage to these hubs can disrupt the executive function network.
Rehabilitation strategies can capitalize on neuroplasticity to preserve or enhance the functionality of these critical hubs. Techniques such as transcranial magnetic stimulation (TMS) or transcranial direct current stimulation (tDCS) may target these regions to facilitate the restoration of connectivity and enhance cognitive outcomes. Furthermore, task-specific cognitive training designed to activate these hubs can promote network reorganization, enabling compensatory pathways to develop and improve recovery.
The distributed nature of executive function networks also suggests resilience in cognitive recovery. Even when a hub is compromised, strengthening other regions or connections within the network may mitigate deficits. Incorporating insights into hub functionality facilitates more targeted and effective rehabilitation, improving outcomes for individuals with brain injuries.
Moreover, this study elucidates distinct hubs and influencers specific to each executive function subdomain, underscoring the unique characteristics of these cognitive processes. Consistent with prior research, the bilateral precuneus is reaffirmed as a pivotal hub and influencer in executive functioning. Our finding on the central role of the right mPFC in executive functioning could point to a new direction in research in the right hemisphere.
The resilience of distributed brain networks to damage holds significant implications for conditions such as stroke and traumatic brain injury, guiding interventions aimed at preserving executive function. Further research is necessary to elucidate how network organization adapts to various types of brain damage, including epilepsy and neurodegenerative diseases, and to develop targeted therapeutic strategies that enhance recovery.
Statements
Author’s note
R Studio was used as an integrated development environment for R programming. The data were processed and analyzed using various R packages, including the `sqldf` package for SQL-like data manipulation (Grothendieck, 2007), the `brainGraph` package for brain network analysis (Watson, 2015), the `igraph` package for graph theory analysis (Csárdi et al., 2006), the `ggraph` package for advanced graph visualization (Pedersen, 2021), the `ggplot2` package for creating plots (Pedersen and RStudio, 2024), and the `brainconn` package for connectivity analysis (Chopra, n.d.). The analysis reports were generated using the `knitr` package for dynamic report generation (Xie, 2025), and tables were formatted using the `kableExtra` package (Zhu, 2024).
Data availability statement
Publicly available datasets were analyzed in this study. This data can be found at: https://pubmed.ncbi.nlm.nih.gov/34877370/.
Ethics statement
The studies involving humans were approved by IRB at Rotman Research Institute at Baycrest. The studies were conducted in accordance with the local legislation and institutional requirements. Written informed consent for participation was not required from the participants or the participants’ legal guardians/next of kin in accordance with the national legislation and institutional requirements.
Author contributions
AD: Writing – original draft, Writing – review & editing.
Funding
The author(s) declare that no financial support was received for the research and/or publication of this article.
Conflict of interest
The author declares that the research was conducted in the absence of any commercial or financial relationships that could be construed as a potential conflict of interest.
Generative AI statement
The author(s) declare that no Gen AI was used in the creation of this manuscript.
Publisher’s note
All claims expressed in this article are solely those of the authors and do not necessarily represent those of their affiliated organizations, or those of the publisher, the editors and the reviewers. Any product that may be evaluated in this article, or claim that may be made by its manufacturer, is not guaranteed or endorsed by the publisher.
Supplementary material
The Supplementary material for this article can be found online at: https://www.frontiersin.org/articles/10.3389/fnhum.2025.1525497/full#supplementary-material
References
1
Achard S. Salvador R. Whitcher B. Suckling J. Bullmore E. (2006). A resilient, low-frequency, small-world human brain functional network with highly connected association cortical hubs. J. Neurosci.26, 63–72. doi: 10.1523/JNEUROSCI.3874-05.2006
2
Aerts H. Fias W. Caeyenberghs K. Marinazzo D. (2016). Brain networks under attack: Robustness properties and the impact of lesions. Brain139, 3063–3083. doi: 10.1093/brain/aww194
3
Alper B. Bach B. Henry Riche N. Isenberg T. Fekete J.-D. (2013). Weighted graph comparison techniques for brain connectivity analysis. Proceedings of the SIGCHI Conference on Human Factors in Computing Systems, 483–492. Available online at: https://doi.org/10.1145/2470654.2470724 (Accessed September, 2023).
4
Alsakaji R. Jones S. Ibik O. Colletta K. Livengood S. Pape T. B. et al . (2021). Working Memory Deficits Related to Brain Atrophy in Early Stage Parkinson’s Disease. Arch. Phys. Med. Rehabil.102:e38. doi: 10.1016/j.apmr.2021.07.572
5
Bassett D. S. Bullmore E. (2006). Small-world brain networks. Neuroscientist12, 512–523. doi: 10.1177/1073858406293182
6
Baum G. L. Ciric R. Roalf D. R. Betzel R. F. Moore T. M. Shinohara R. T. et al . (2017). Modular Segregation of Structural Brain Networks Supports the Development of Executive Function in Youth. Curr. Biol.27, 1561–1572.e8. doi: 10.1016/j.cub.2017.04.051
7
Bernard F. Lemée J.-M. Ter Minassian A. Menei P. (2018). Right Hemisphere Cognitive Functions: From Clinical and Anatomic Bases to Brain Mapping During Awake Craniotomy Part I: Clinical and Functional Anatomy. World Neurosurg.118, 348–359. doi: 10.1016/j.wneu.2018.05.024
8
Billette O. V. Ziegler G. Aruci M. Schütze H. Kizilirmak J. M. Richter A. et al . (2022). Novelty-Related fMRI Responses of Precuneus and Medial Temporal Regions in Individuals at Risk for Alzheimer Disease. Neurology99, e775–e788. doi: 10.1212/WNL.0000000000200667
9
Buckner R. L. Sepulcre J. Talukdar T. Krienen F. M. Liu H. Hedden T. et al . (2009). Cortical Hubs Revealed by Intrinsic Functional Connectivity: Mapping, Assessment of Stability, and Relation to Alzheimer’s Disease. J. Neurosci.29, 1860–1873. doi: 10.1523/JNEUROSCI.5062-08.2009
10
Bullmore E. T. Bassett D. S. (2011). Brain Graphs: Graphical Models of the Human Brain Connectome. Annu. Rev. Clin. Psychol.7, 113–140. doi: 10.1146/annurev-clinpsy-040510-143934
11
Bullmore E. Sporns O. (2009). Complex brain networks: Graph theoretical analysis of structural and functional systems. Nat. Rev. Neurosci.10, 186–198. doi: 10.1038/nrn2575
12
Bullmore E. Sporns O. (2012). The economy of brain network organization. Nat. Rev. Neurosci.13, 336–349. doi: 10.1038/nrn3214
13
Cavanna A. E. Trimble M. R. (2006). The precuneus: A review of its functional anatomy and behavioural correlates. Brain: A. J. Neurol.129, 564–583. doi: 10.1093/brain/awl004
14
Chai W. J. Abd Hamid A. I. Abdullah J. M. (2018). Working Memory From the Psychological and Neurosciences Perspectives: A Review. Front. Psychol.9:401. doi: 10.3389/fpsyg.2018.00401
15
Chopra S. (n.d.). brainconn: A R-package for plotting brain connectivity data • brainconn. Available online at: https://sidchop.github.io/brainconn/articles/brainconn.html (accessed May 20, 2025).
16
Corbetta M. Shulman G. L. (2002). Control of goal-directed and stimulus-driven attention in the brain. Nat. Rev. Neurosci.3, 201–215. doi: 10.1038/nrn755
17
Csárdi G. Nepusz T. Traag V. Horvát S. Zanini F. Noom D. et al . (2006). igraph: Network Analysis and Visualization (p. 2.1.4) [Dataset]. Available online at: https://doi.org/10.32614/CRAN.package.igraph (Accessed September, 2023).
18
Diamond A. (2013). Executive Functions. Annu. Rev. Psychol.64, 135–168. doi: 10.1146/annurev-psych-113011-143750
19
Engstrom M. Landtblom A.-M. Karlsson T. (2013). Brain and effort: Brain activation and effort-related working memory in healthy participants and patients with working memory deficits. Front. Hum. Neurosci.7:140. doi: 10.3389/fnhum.2013.00140
20
Farahani F. V. Karwowski W. D’Esposito M. Betzel R. F. Douglas P. K. Sobczak A. M. et al . (2022). Diurnal variations of resting-state fMRI data: A graph-based analysis. NeuroImage256:119246. doi: 10.1016/j.neuroimage.2022.119246
21
Farahani F. V. Karwowski W. Lighthall N. R. (2019). Application of Graph Theory for Identifying Connectivity Patterns in Human Brain Networks: A Systematic Review. Front. Neurosci.13:585. doi: 10.3389/fnins.2019.00585
22
Fornito A. Zalesky A. Bullmore E. T. (2016). Fundamentals of brain network analysis. Amsterdam: Elsevier/Academic Press.
23
Friedman N. P. Robbins T. W. (2022). The role of prefrontal cortex in cognitive control and executive function. Neuropsychopharmacology47, 72–89. doi: 10.1038/s41386-021-01132-0
24
Frigerio I. Broeders T. A. A. Lin C.-P. Bouwman M. M. A. Koubiyr I. Barkhof F. et al . (2024). Pathologic Substrates of Structural Brain Network Resilience and Topology in Parkinson Disease Decedents. Neurology103:e209678. doi: 10.1212/WNL.0000000000209678
25
Grothendieck G. (2007). sqldf: Manipulate R Data Frames Using SQL (p. 0.4-11) [Dataset]. Available online at: https://doi.org/10.32614/CRAN.package.sqldf (Accessed September, 2023).
26
Guan X. Hu B. Zheng W. Chen N. Li X. Hu C. et al . (2024). Changes on Cognition and Brain Network Temporal Variability After Pediatric Neurosurgery. Neurosurgery96, 555–567. doi: 10.1227/neu.0000000000003124
27
Guse B. Falkai P. Wobrock T. (2010). Cognitive effects of high-frequency repetitive transcranial magnetic stimulation: A systematic review. J. Neural Transm. (Vienna)117, 105–122. doi: 10.1007/s00702-009-0333-7
28
Guye M. Bettus G. Bartolomei F. Cozzone P. J. (2010). Graph theoretical analysis of structural and functional connectivity MRI in normal and pathological brain networks. MAGMA23, 409–421. doi: 10.1007/s10334-010-0205-z
29
He Y. Evans A. (2010). Graph theoretical modeling of brain connectivity. Curr. Opin. Neurol.23, 341–350. doi: 10.1097/WCO.0b013e32833aa567
30
Hric D. Darst R. K. Fortunato S. (2014). Community detection in networks: Structural communities versus ground truth. Phys. Rev. E90:062805. doi: 10.1103/PhysRevE.90.062805
31
Huff M. J. Balota D. A. Minear M. Aschenbrenner A. J. Duchek J. M. (2015). Dissociative Global and Local Task-Switching Costs Across Younger Adults, Middle-Aged Adults, Older Adults, and Very Mild Alzheimer Disease Individuals. Psychol. Aging30, 727–739. doi: 10.1037/pag0000057
32
Jaeggi S. M. Buschkuehl M. Perrig W. J. Meier B. (2010). The concurrent validity of the N-back task as a working memory measure. Memory18, 394–412. doi: 10.1080/09658211003702171
33
Jin G. Li K. Qin Y. Zhong N. Zhou H. Wang Z. et al . (2012). fMRI study in posterior cingulate and adjacent precuneus cortex in healthy elderly adults using problem solving task. J. Neurol. Sci.318, 135–139. doi: 10.1016/j.jns.2012.02.032
34
Jobson D. D. Hase Y. Clarkson A. N. Kalaria R. N. (2021). The role of the medial prefrontal cortex in cognition, ageing and dementia. Brain. Communications3:fcab125. doi: 10.1093/braincomms/fcab125
35
Kolodny T. Mevorach C. Shalev L. (2017). Isolating response inhibition in the brain: Parietal versus frontal contribution. Cortex88, 173–185. doi: 10.1016/j.cortex.2016.12.012
36
Lawyer G. (2015). Understanding the influence of all nodes in a network. Sci. Rep.5:8665. doi: 10.1038/srep08665
37
Leech R. Sharp D. J. (2014). The role of the posterior cingulate cortex in cognition and disease. Brain137, 12–32. doi: 10.1093/brain/awt162
38
Long J. Song X. Wang Y. Wang C. Huang R. Zhang R. (2022). Distinct neural activation patterns of age in subcomponents of inhibitory control: A fMRI meta-analysis. Front. Aging Neurosci.14:938789. doi: 10.3389/fnagi.2022.938789
39
Medaglia J. D. (2017). Graph Theoretic Analysis of Resting State fMRI. Neuroimaging Clin. N. Am.27, 593–607. doi: 10.1016/j.nic.2017.06.008
40
Medaglia J. D. Lynall M.-E. Bassett D. S. (2015). Cognitive Network Neuroscience. J. Cogn. Neurosci.27, 1471–1491. doi: 10.1162/jocn_a_00810
41
Menardi A. Spoa M. Vallesi A. (2024). Brain topology underlying executive functions across the lifespan: Focus on the default mode network. Front. Psychol.15:1441584. doi: 10.3389/fpsyg.2024.1441584
42
Menon V. (2011). Large-scale brain networks and psychopathology: A unifying triple network model. Trends Cogn. Sci.15, 483–506. doi: 10.1016/j.tics.2011.08.003
43
Menon V. D’Esposito M. (2022). The role of PFC networks in cognitive control and executive function. Neuropsychopharmacology47, 90–103. doi: 10.1038/s41386-021-01152-w
44
Morein-Zamir S. Simon Jones P. Bullmore E. T. Robbins T. W. Ersche K. D. (2013). Prefrontal Hypoactivity Associated with Impaired Inhibition in Stimulant-Dependent Individuals but Evidence for Hyperactivation in their Unaffected Siblings. Neuropsychopharmacology38, 1945–1953. doi: 10.1038/npp.2013.90
45
Nemeth D. G. Chustz K. M. (2020). Chapter 6—Executive functions defined. In NemethD. G.GlozmanJ. (Eds.), Evaluation and Treatment of Neuropsychologically Compromised Children (pp. 107–120). Academic Press. Available online at: https://doi.org/10.1016/B978-0-12-819545-1.00006-0 (Accessed September, 2023).
46
Niendam T. A. Laird A. R. Ray K. L. Dean Y. M. Glahn D. C. Carter C. S. (2012). Meta-analytic evidence for a superordinate cognitive control network subserving diverse executive functions. Cogn. Affect. Behav. Neurosci.12, 241–268. doi: 10.3758/s13415-011-0083-5
47
Osada T. Ohta S. Ogawa A. Tanaka M. Suda A. Kamagata K. et al . (2019). An Essential Role of the Intraparietal Sulcus in Response Inhibition Predicted by Parcellation-Based Network. J. Neurosci. Off. J. Soc. Neurosci.39, 2509–2521. doi: 10.1523/JNEUROSCI.2244-18.2019
48
Paldino M. J. Zhang W. Chu Z. D. Golriz F. (2016). Metrics of brain network architecture capture the impact of disease in children with epilepsy. Neuroimage Clin.13, 201–208. doi: 10.1016/j.nicl.2016.12.005
49
Palmisano S. Fasotti L. Bertens D. (2020). Neurobehavioral Initiation and Motivation Problems After Acquired Brain Injury. Front. Neurol.11:23. doi: 10.3389/fneur.2020.00023
50
Pedersen T. L. (2021). ggraph: An Implementation of Grammar of Graphics for Graphs and Networks (p. 2.2.1) [Dataset]. doi: 10.32614/CRAN.package.ggraph
51
Pedersen T. L. RStudio . (2024). ggraph: An Implementation of Grammar of Graphics for Graphs and Networks (Version 2.2.1) [Computer software]. Available online at: https://cran.r-project.org/web/packages/ggraph/index.html (Accessed September, 2023).
52
Power J. D. Cohen A. L. Nelson S. M. Wig G. S. Barnes K. A. Church J. A. et al . (2011). Functional network organization of the human brain. Neuron72, 665–678. doi: 10.1016/j.neuron.2011.09.006
53
Raichle M. E. (2015). The brain’s default mode network. Annu. Rev. Neurosci.38, 433–447. doi: 10.1146/annurev-neuro-071013-014030
54
Ramos-Nuñez A. I. Fischer-Baum S. Martin R. C. Yue Q. Ye F. Deem M. W. (2017). Static and Dynamic Measures of Human Brain Connectivity Predict Complementary Aspects of Human Cognitive Performance. Front. Hum. Neurosci.11:420. doi: 10.3389/fnhum.2017.00420
55
Reijneveld J. C. Ponten S. C. Berendse H. W. Stam C. J. (2007). The application of graph theoretical analysis to complex networks in the brain. Clin. Neurophysiol.118, 2317–2331. doi: 10.1016/j.clinph.2007.08.010
56
Rieck J. R. Baracchini G. Nichol D. Abdi H. Grady C. L. (2021). Dataset of functional connectivity during cognitive control for an adult lifespan sample. Data Brief39:107573. doi: 10.1016/j.dib.2021.107573
57
Rubinov M. Sporns O. (2010). Complex network measures of brain connectivity: Uses and interpretations. NeuroImage52, 1059–1069. doi: 10.1016/j.neuroimage.2009.10.003
58
Salgado-Pineda P. Rodriguez-Jimenez R. Moreno-Ortega M. Dompablo M. Martínez de Aragón A. Salvador R. et al . (2021). Activation and deactivation patterns in schizophrenia during performance of an fMRI adapted version of the stroop task. J. Psychiatr. Res.144, 1–7. doi: 10.1016/j.jpsychires.2021.09.039
59
Schaefer A. Kong R. Gordon E. M. Laumann T. O. Zuo X.-N. Holmes A. J. et al . (2018). Local-Global Parcellation of the Human Cerebral Cortex from Intrinsic Functional Connectivity MRI. Cereb. Cortex28, 3095–3114. doi: 10.1093/cercor/bhx179
60
Sporns O. Betzel R. F. (2016). Modular Brain Networks. Annu. Rev. Psychol.67, 613–640. doi: 10.1146/annurev-psych-122414-033634
61
Stam C. J. (2024). Hub overload and failure as a final common pathway in neurological brain network disorders. Netw. Neurosci.8, 1–23. doi: 10.1162/netn_a_00339
62
Stanley M. L. Simpson S. L. Dagenbach D. Lyday R. G. Burdette J. H. Laurienti P. J. (2015). Changes in Brain Network Efficiency and Working Memory Performance in Aging. PLoS One10:e0123950. doi: 10.1371/journal.pone.0123950
63
Sun L. Liang X. Duan D. Liu J. Chen Y. Wang X. et al . (2022). Structural insight into the individual variability architecture of the functional brain connectome. NeuroImage259:119387. doi: 10.1016/j.neuroimage.2022.119387
64
Thomas Yeo B. T. Krienen F. M. Sepulcre J. Sabuncu M. R. Lashkari D. Hollinshead M. et al . (2011). The organization of the human cerebral cortex estimated by intrinsic functional connectivity. J. Neurophysiol.106, 1125–1165. doi: 10.1152/jn.00338.2011
65
van den Heuvel M. P. Stam C. J. Boersma M. Hulshoff Pol H. E. (2008). Small-world and scale-free organization of voxel-based resting-state functional connectivity in the human brain. NeuroImage43, 528–539. doi: 10.1016/j.neuroimage.2008.08.010
66
Verbruggen F. Logan G. D. (2008). Automatic and Controlled Response Inhibition: Associative Learning in the Go/No-Go and Stop-Signal Paradigms. J. Exp. Psychol. Gen.137, 649–672. doi: 10.1037/a0013170
67
Wang J. Yang Y. Fan L. Xu J. Li C. Liu Y. et al . (2014). Convergent functional architecture of the superior parietal lobule unraveled with multimodal neuroimaging approaches. Hum. Brain Mapp.36, 238–257. doi: 10.1002/hbm.22626
68
Watson C. G. (2015). brainGraph: Graph Theory Analysis of Brain MRI Data (p. 3.1.0) [Dataset]. Available online at: https://doi.org/10.32614/CRAN.package.brainGraph (Accessed September, 2023).
69
Witt S. T. Van Ettinger-Veenstra H. Salo T. Riedel M. C. Laird A. R. (2021). What Executive Function Network is that? An Image-Based Meta-Analysis of Network Labels. Brain Topogr.34, 598–607. doi: 10.1007/s10548-021-00847-z
70
Xie Y. (2025). Knitr.pdf. Available online at: https://cran.r-project.org/web/packages/knitr/knitr.pdf (Accessed September, 2023).
71
Xu P. Chen A. Li Y. Xing X. Lu H. (2019). Medial prefrontal cortex in neurological diseases. Physiol. Genomics51, 432–442. doi: 10.1152/physiolgenomics.00006.2019
72
Xue C. Zheng D. Ruan Y. Cao X. Zhang X. Qi W. et al . (2024). Reorganized brain functional network topology in stable and progressive mild cognitive impairment. Front. Aging Neurosci.16:1467054. doi: 10.3389/fnagi.2024.1467054
73
Yeager B. E. Bruss J. Duffau H. Herbet G. Hwang K. Tranel D. et al . (2022). Central precuneus lesions are associated with impaired executive function. Brain Struct. Funct.227, 3099–3108. doi: 10.1007/s00429-022-02556-0
74
Yeo B. T. T. Krienen F. M. Eickhoff S. B. Yaakub S. N. Fox P. T. Buckner R. L. et al . (2015). Functional Specialization and Flexibility in Human Association Cortex. Cereb. Cortex25, 3654–3672. doi: 10.1093/cercor/bhu217
75
Zelazo P. D. Craik F. I. M. Booth L. (2004). Executive function across the life span. Acta Psychol.115, 167–183. doi: 10.1016/j.actpsy.2003.12.005
76
Zhu H. (2024). kableExtra.pdf. Available online at: https://cran.r-project.org/web/packages/kableExtra/kableExtra.pdf (Accessed September, 2023).
Summary
Keywords
graph theory, connectome, executive functioning, brain network, graph analysis
Citation
Davis AT (2025) Hubs, influencers, and communities of executive functions: a task-based fMRI graph analysis. Front. Hum. Neurosci. 19:1525497. doi: 10.3389/fnhum.2025.1525497
Received
09 November 2024
Accepted
18 March 2025
Published
25 August 2025
Volume
19 - 2025
Edited by
Daniele Corbo, University of Brescia, Italy
Reviewed by
Shihao He, Peking Union Medical College Hospital (CAMS), China
Alexander Grove Belden, Northeastern University, United States
Updates
Copyright
© 2025 Davis.
This is an open-access article distributed under the terms of the Creative Commons Attribution License (CC BY). The use, distribution or reproduction in other forums is permitted, provided the original author(s) and the copyright owner(s) are credited and that the original publication in this journal is cited, in accordance with accepted academic practice. No use, distribution or reproduction is permitted which does not comply with these terms.
*Correspondence: Alexandra T. Davis, alexandratongmg@gmail.com
†ORCID: Alexandra T. Davis, orcid.org/0000-0002-8451-0205
Disclaimer
All claims expressed in this article are solely those of the authors and do not necessarily represent those of their affiliated organizations, or those of the publisher, the editors and the reviewers. Any product that may be evaluated in this article or claim that may be made by its manufacturer is not guaranteed or endorsed by the publisher.