 Brittany Trotter1
 Melissa Hunfalvay2,3
 Nicholas P. Murray1*
 Greg C. Mathews4
 Frederick Robert Carrick5,6,7,8
- 1East Carolina University, Department of Kinesiology, Greenville, NC, United States
- 2RightEye LLC, Bethesda, MD, United States
- 3Biological Engineering, Massachusetts Institute of Technology, Cambridge, MA, United States
- 4The Brain Health Center of Maryland, Silver Spring, MD, United States
- 5College of Medicine, University of Central Florida, Orlando, FL, United States
- 6Department of Neurology, The Carrick Institute, Canaveral, United Kingdom
- 7Centre for Mental Health Research in Association with the University of Cambridge, Cambridge, United Kingdom
- 8Burnett School of Biomedical Science, University of Central Florida, Orlando, FL, United States
Objective: The purpose of this study was to assess the validity of six computerized eye-tracking tests against a clinician-administered oculomotor exam.
Methods: A total of 53 participants completed the horizontal random saccade (HRS), circular smooth pursuit (CSP), horizontal smooth pursuit (HSP), vertical smooth pursuit (VSP), horizontal saccade (HS), and vertical saccade (VS) oculomotor tests on the computerized system. A board-certified neurologist with 16 years of experience also conducted an oculomotor examination to mirror eye movement patterns.
Results: Data analysis included a series of single-block logistic regressions to examine the scoring of the six eye-tracking tests (RightEye, LLC) to predict clinician-rated eye movement classifications (i.e., normal or abnormal). The computerized battery demonstrated concurrent validity for each of the six oculomotor tests as they significantly predicted the neurologist’s classification. The sensitivity and specificity of the six eye-tracking tests ranged from 70.4 to 93.5% and from 84.6 to 90.5%, respectively. The diagnostic accuracy of the computerized tests ranged from good (78.8%) to excellent (92.3%). The area under the curve (AUC) analysis for the eye-tracking tests yielded values ranging from 0.734 (VSs) to 0.921 (HRSs).
Conclusion: The results suggest that each of the six computerized eye-tracking tests accurately distinguished between normal and abnormal oculomotor movements.
Introduction
The visual system is responsible for detecting colors, shapes, and motion and contributes to attention and spatial awareness through millions of tracts in the brain (Gilbert, 2013; Jones, 1975; Lynch et al., 1977). The oculomotor system controls eye positioning and fixation and coordinates eye movement toward a directed target through six functions: saccades, smooth pursuits, fixation, vergence, vestibular-ocular reflex (VOR), and optokinetic reflex (OKR) (Sharpe and Wong, 2005). With 20%–30% of the cerebral cortex involved in visual processing and relaying visual information, it is understandable that systemic stressors (e.g., diabetes), trauma (e.g., concussion), vitamin deficiency (e.g., retinoic acid), or neurodegeneration (e.g., Alzheimer’s disease) may present clinically during neurological, ophthalmologic, or optometric examination—even in the absence of other hallmark signs or symptoms of the disease (Bardsley et al., 1993; Berson et al., 1993; Boucart et al., 2014; Ciuffreda et al., 2014; Van Essen, 2004).
Meaningful testing of visual function requires exceptionally high granularity, as many oculomotor systems are closely interrelated. For example, in concussion patients with a receded near point of convergence distance, the receded distance was not entirely diagnostic of isolated convergence insufficiency (Raghuram et al., 2019). Instead, it reflected isolated accommodative disorders (39%), isolated convergence insufficiency (8%), a combination of convergence insufficiency and concurrent accommodative disorders (34%), normal binocular vision (6%), or other oculomotor disorders (13%). Furthermore, some abnormal eye movements may be brief or subtle and difficult for less-trained practitioners to identify and subsequently treat. Therefore, it is critical to have technologies that can reliably and accurately quantify eye movements, track performance over time, and compare patients to other normative data to provide optimal patient care.
Eye tracking is an emerging technique that is receiving considerable attention as it can generate many of the above-mentioned metrics in a relatively brief examination. RightEye, LLC (Bethesda, MD, United States) utilizes eye-tracking technology that has demonstrated good to excellent test–retest reliability [intraclass correlation coefficients (ICCs) = 0.70–0.95] and acceptable to excellent internal consistency (Cronbach’s α = 0.70–0.95) for dynamic visual acuity testing (Murray and Hunfalvay, 2017). A battery of its oculomotor tests was also examined and included horizontal random saccades (HRSs), circular smooth pursuits (CSPs), horizontal smooth pursuits (HSPs), vertical smooth pursuits (VSPs), horizontal saccades (HSs), and vertical saccades (VSs) (Murray et al., 2019). Test–retest reliability of individual metrics within the oculomotor tests ranged from 0.4 (i.e., unacceptable) to 0.9 (i.e., excellent), and a cluster analysis yielded distinct age groups that were used to develop norms. However, these metrics have not been validated against an oculomotor exam. Therefore, the purpose of this study was to assess the validity of six computerized eye-tracking tests (RightEye, LLC) against an oculomotor examination performed by a board-certified neurologist.
Materials and methods
Setting and study population
Participants were recruited for this study through advertisements placed on the Internet, social media, bulletin boards, and word of mouth. Participants were included if they responded to the recruitment materials, met the inclusion criteria, did not exhibit any exclusion criteria, and provided consent to participate in the study. Due to potential known confounds within the diagnosis and eye-tracking measures, participants were excluded from the study for participation if they met any of the following pre-screening conditions: known neurological disorders (e.g., Parkinson’s disease and cerebral palsy); concussion within the last 10 years; vision-related issues that prevented successful eye-tracking calibration of all 9-points, such as extreme tropias (Niehorster et al., 2018; Renard et al., 2015; Han et al., 2010), phorias (Han et al., 2010; Kooiker et al., 2016), static visual acuity of worse than 20/400 (Niehorster et al., 2018), nystagmus (Niehorster et al., 2018; Kooiker et al., 2016) cataracts, and eyelash impediments (Holmqvist and Nyström, 2011); or reported recreational drug use or alcohol consumption within 24 h of testing. All participants reported no prior experience with any eye-tracking technologies. This research was reviewed by the University Institutional Review Board (IRB) and conformed to the principles and applicable guidelines for the protection of human subjects in biomedical research.
Observation procedures
The nature of the study was explained to participants, and all participants provided written consent to participate. After completing informed consent, participants were asked to complete the pre-screening questionnaire. If any of the pre-screening questions were answered positively, the participant was excluded from the study. Participants who passed the pre-screening were then randomly assigned to the order of testing using a 1:1 ratio, either with the oculomotor examination first or the computerized eye-tracking tests first. Once the participants completed the first set of tests (oculomotor examination or computerized eye tracking), they moved to the next test area and completed the remaining tests. After the completion of the study, the participants were provided with a USD$ 25 gift card for their participation in the study and were debriefed before leaving. The researchers and clinicians were blinded to the participants’ computerized eye-tracking performance during testing, which was only revealed during data analysis.
Measures
The participants were seated in a height-adjustable, stationary chair placed next to a desk inside the laboratory (Figure 1). All tests were completed by a research staff member who had received and passed the RightEye training, education, and protocol procedures before data collection. The participants were asked to look at a Tobii Dynavox, i15 all-in-one system. The screen dimensions were 12″ wide × 9″ high and placed at a distance between 55 and 60 cm from the participant’s face. The system was fitted with a Tobii 90 Hz remote eye tracker connected to the computer with a wired keyboard and mouse.
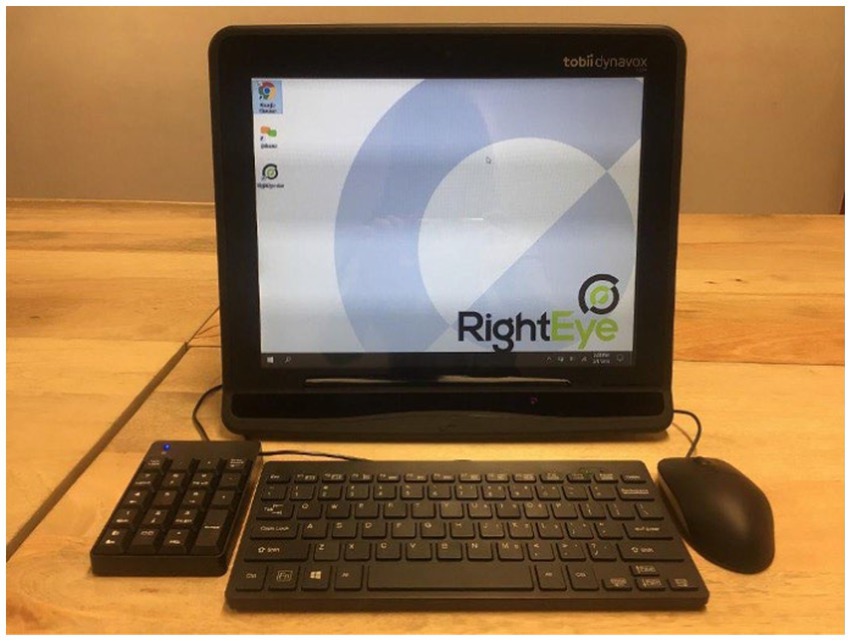
Figure 1. RightEye vision testing system: Tobii Dynovox i15 all-in-one device used for the computerized apparatus.
Qualified participants who successfully passed the 9-point calibration procedure completed the computerized eye-tracking test battery. Before each test, written instructions and computer animations were provided to demonstrate appropriate eye movement. Participants who needed vision correction at 55–60 cm from the screen were permitted to use correction. For each test, the participants were asked to follow the stimuli presented on the screen as “accurately as possible with your eyes.” Participants completed the horizontal random saccade (HRS), circular smooth pursuit (CSP), horizontal smooth pursuit (HSP), vertical smooth pursuit (VSP), horizontal saccade (HS), and vertical saccade (VS) tests for the computerized eye-tracking test battery (Murray et al., 2019). Additional information on sub-variables was previously described for each computerized test. Specific to the HS and VS tests, participants completed three guided practice repetitions to ensure comprehension before testing began.
Clinician-administered oculomotor examination
Under the supervision of a board-certified neurologist with 16 years of clinical experience, participants were instructed to follow the neurologist’s instructions. The instructions included the following steps: “follow the tip of my finger” in a slow, circular clockwise fashion (CSPs), then in a horizontal direction (i.e., left-and-right) (HSPs), and later in a vertical direction (i.e., up-and-down) (VSPs). The neurologist then conducted horizontal and vertical saccade tests, asking the participants to “move your eyes as quickly and accurately as possible between my index fingers when you hear me click.” The index fingers were approximately 20 cm apart, centered on the participant’s midline, eliciting a visual angle of 10 degrees in each direction, which mirrors the computerized eye-tracking saccade tests. The midpoint was approximately aligned with the participants’ tip of the nose for movements in the horizontal plane (HS) and then in the vertical plane (VS). The neurologist then asked participants to follow his finger as it “jumped” randomly across a horizontal plane (HRSs). The participants completed one set of five trials for each test. These eye movements were intended to reflect similar oculomotor patterns evaluated by the computerized eye-tracking system. Importantly, the neurologist did not produce a clinical diagnosis.
A trial “failure” was defined as a loss of fixation along the circular, horizontal, or vertical course of the smooth pursuit tests. For the horizontal and vertical saccade tests, “failure” was defined as either an overshoot or undershoot of the target. If a participant “failed” at least three trials (out of five) on any one pursuit or saccade test, the test was classified as “abnormal.” An overall classification of abnormal oculomotor function was defined as receiving an “abnormal” result for at least three of the five tests (i.e., circular smooth pursuit, horizontal smooth pursuit, vertical smooth pursuit, horizontal saccade, and vertical saccade). The overall oculomotor function classification was compared to the HRS computerized test performance.
Statistical analysis
A series of single-block logistic regression analyses examined the ability of the computer-generated scoring of the six eye-tracking tests (i.e., HRSs, CSPs, HSPs, VSPs, VSs, and HSs) to predict clinician-determined eye movement classifications (i.e., normal or abnormal) for each of the corresponding tests or overall oculomotor function. Participants were randomly assigned to each test to reduce order effects; however, to ensure there was no effect of the order, a series of ANOVAs were performed to examine computerized eye-tracking performance when tested first or second for all computer sub-variables. For each logistic regression, the analysis included χ2 statistics, Nagelkerke R2 values, Hosmer–Lemeshow tests, and Wald statistics. The χ2 tests compared the log-likelihoods of the baseline model (no eye-tracking variables included) and the new model (all eye-tracking variables included for each type, i.e., HRSs, VRSs, HSs, VSs, and CSPs). Nagelkerke R2 values quantified the variance in clinical diagnosis explained by the eye-tracking tests. Hosmer–Lemeshow tests examined the goodness-of-fit of the new models. Wald statistics evaluated the contribution of each of the eye-tracking test sub-variables to the new model. Furthermore, multicollinearity was evaluated through the variation inflation factor (VIF). Alpha levels were set at a p-value of <0.05 for all analyses. The underlying formulas for testing psychometrics were previously described (Baeyens et al., 2019). A sample size of 53 participants is considered statistically adequate, assuming a medium-size relationship between the independent and dependent variables, with alpha = 0.05; therefore, a study-specific power analysis was not performed (Tabachnick and Fidell, 2001; Green, 1991).
Results
Participant demographics
The 53 participants were between the ages of 20 and 43 years (20.1 ± 5.7), with 25 of them being male. Of the 53 participants, 73% were white, 10% were Black, 12% were Hispanic, and 5% opted not to report ethnicity. One individual who provided consent was excluded from the study during pre-screening due to recent alcohol consumption, and one participant experienced a problematic Internet connection during the eye-tracking tests, which led to their exclusion from some regression analyses. The prevalence of an abnormal oculomotor function, as classified by the neurologist, ranged from 50.0% (HS) to 59.6% (HRSs, CSPs, and HSPs).
Test order
All variables produced a non-significant result for order (p > 0.05). As such, there was no difference in whether a participant received computerized eye-tracking first or second. Figure 2 provides sample eye traces for five computerized eye-tracking tests (HRSs did not capture traces). In addition, multicollinearity was evaluated for each model, and it was determined for all models and variables to be well below 10 or a value that would indicate severe multicollinearity.
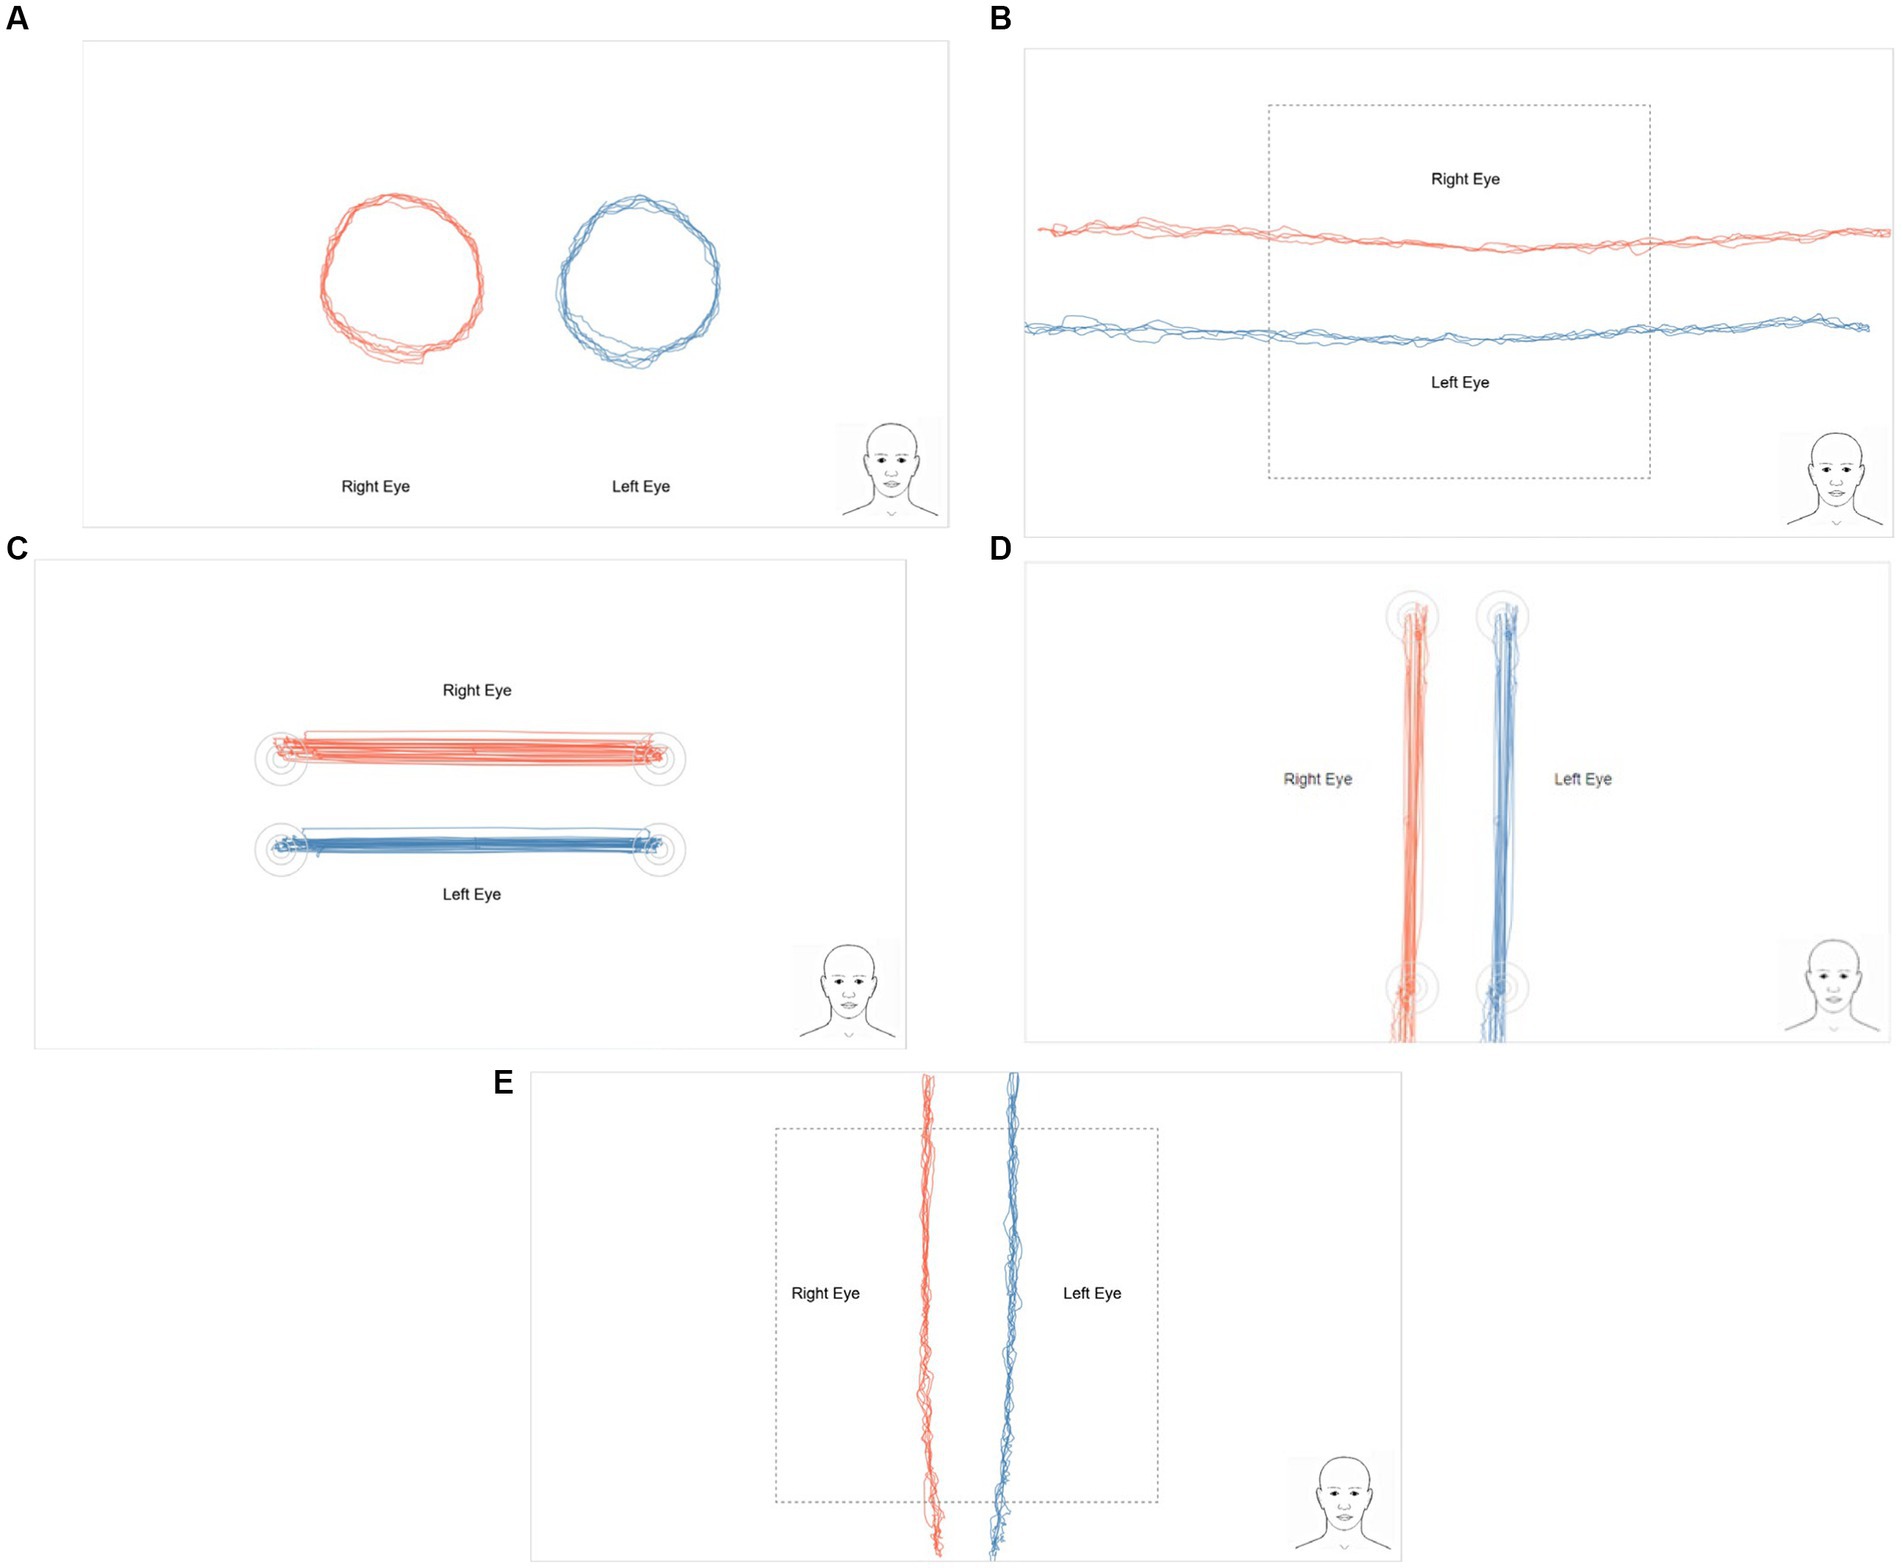
Figure 2. Sample eye traces for each of the RightEye tests performed by an uninjured participant: (A) circular smooth pursuits, (B) horizontal smooth pursuits, (C) vertical smooth pursuits, (D) horizontal saccades, and (E) vertical saccades. Horizontal random saccade traces are not recorded.
Horizontal random saccade test
The HRS logistic regression examined the concurrent validity of the 16 HRS test metrics against the clinician-rated classification of oculomotor function. The Hosmer–Lemeshow test results (p = 0.94) suggested that the model was well-fit. The full model of 16 predictor variables significantly predicted clinically evaluated HRS status (χ2 = 51.730, df = 16, n = 52, p < 0.001) (Table 1). There were no significant individual predictors (Wald statistic p > 0.05). The HRS variables explained 89% of the variance in the model, and 92.3% of individuals were correctly predicted (i.e., overall model accuracy). Sensitivity and specificity were 93.5% and 90.5%, respectively.
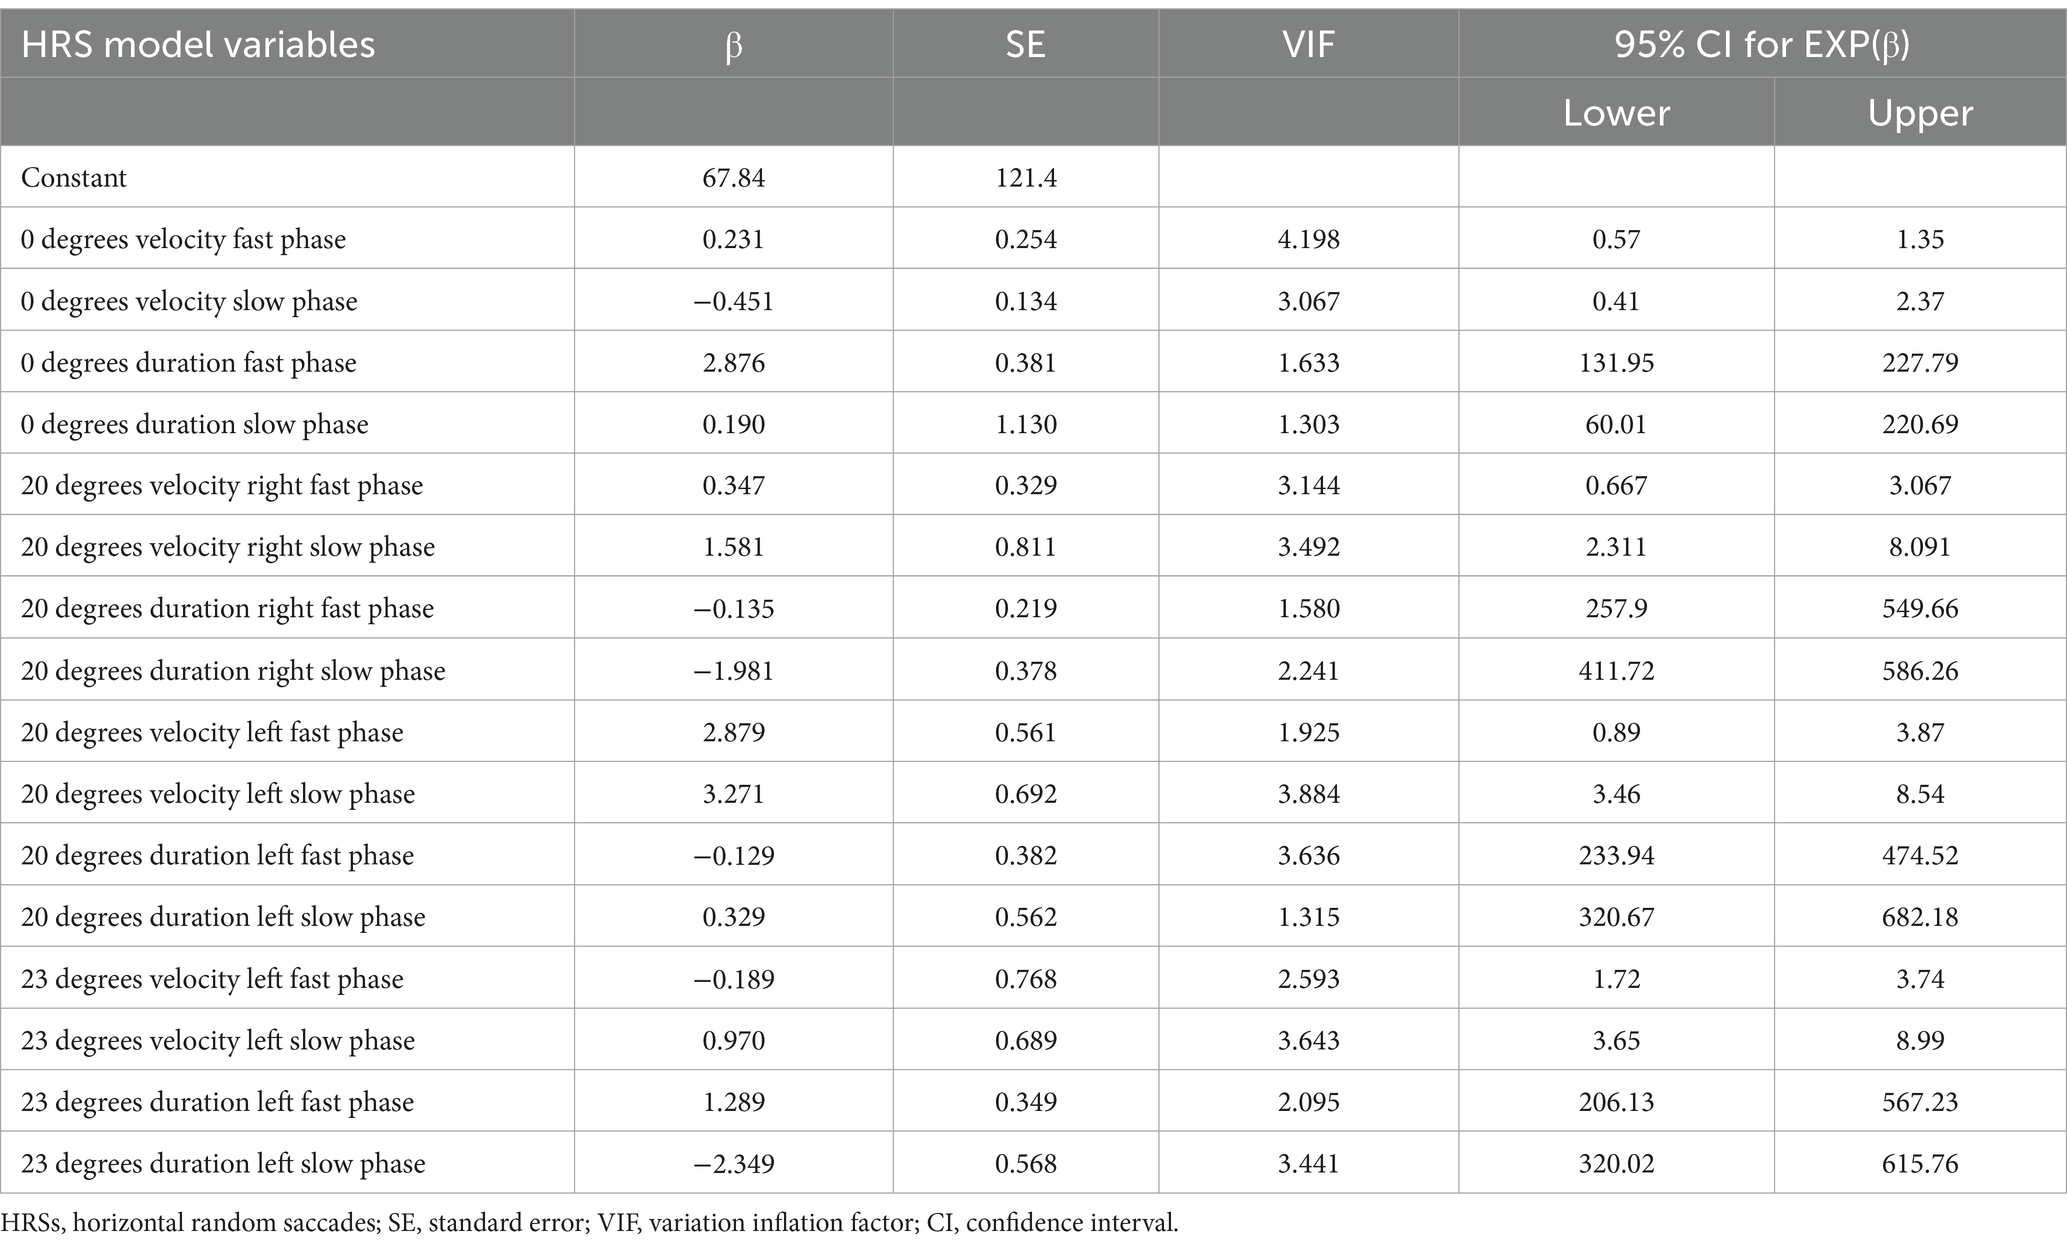
Table 1. Horizontal random saccade logistic regression model summary.
Circular smooth pursuit test
The CSP logistic regression examined the concurrent validity of the five CSP test metrics against the corresponding clinician-administered oculomotor test. The Hosmer–Lemeshow test results (p = 0.94) suggested that the model was well-fit. The full model of the five predictor variables significantly predicted clinically evaluated CSP status (χ2 = 52.640, df = 5, n = 52, p < 0.001) (Table 2). There were no significant individual predictors (Wald statistic p > 0.05). The CSP variables explained 86% of the variance in the model, and 92.3% of individuals were correctly predicted (i.e., overall model accuracy). Sensitivity and specificity were 93.5% and 90.5%, respectively.
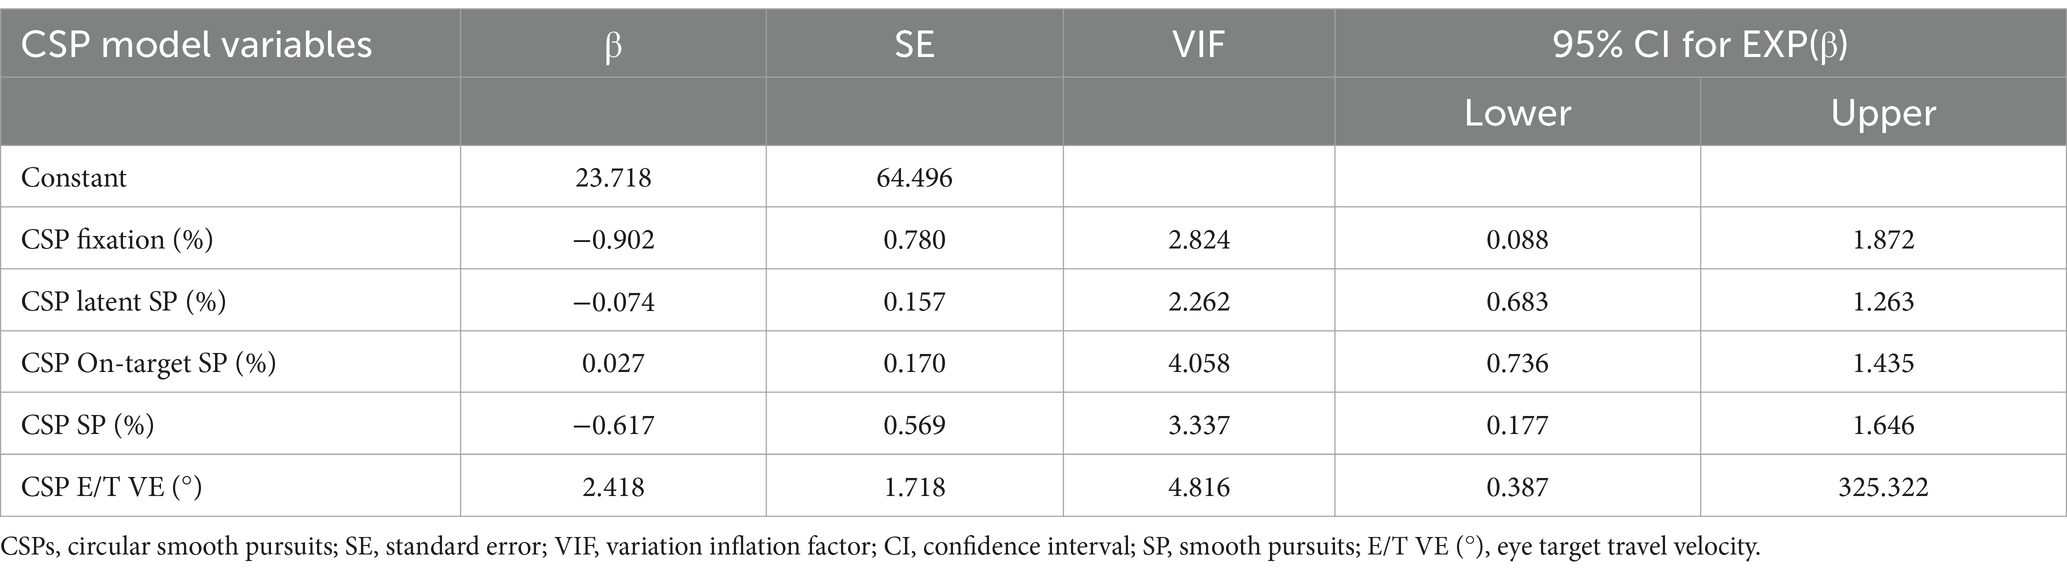
Table 2. Circular smooth pursuit logistic regression model summary.
Horizontal smooth pursuit test
The HSP logistic regression examined the concurrent validity of the four HSP test metrics against the corresponding clinician-administered oculomotor test. The Hosmer–Lemeshow test results (p = 0.78) suggested that the model was well-fit. The full model with four predictor variables significantly predicted and clinically evaluated the HSP status (χ2 = 25.402, df = 4, n = 52, p < 0.001) (Table 3). HSP SP (%) was the only significant individual predictor (Wald statistic p = 0.043). The HSP variables explained 52% of the variance in the model, and 92.3% of individuals were correctly predicted (i.e., overall model accuracy). Sensitivity and specificity were 93.5% and 90.5%, respectively.
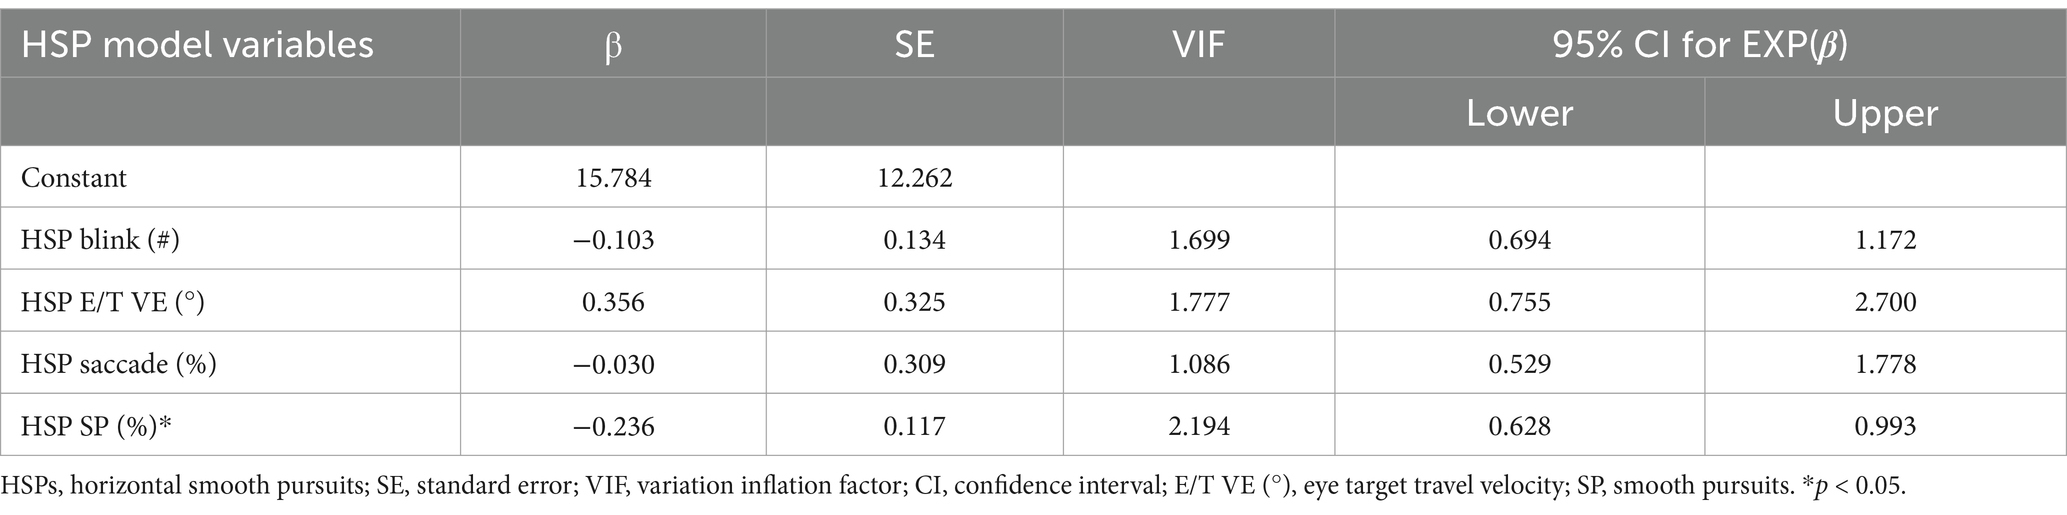
Table 3. Horizontal smooth pursuit logistic regression model summary.
Vertical smooth pursuit test
The VSP test regression analysis examined the concurrent validity of the five VSP test metrics against the corresponding clinician-administered oculomotor test. The Hosmer–Lemeshow test results (p = 0.33) suggested that the model was a good fit. The full model of the five predictor variables significantly predicted clinically evaluated VSP status (χ2 = 30.347, df = 5, n = 53, p < 0.001) (Table 4). VSP sync-y was the only significant individual predictor (Wald statistic p = 0.017). The VSP variables explained 58% of the variance in the model, and 86.8% of individuals were correctly predicted (i.e., overall model accuracy). Sensitivity and specificity were 88.9% and 84.6%, respectively.
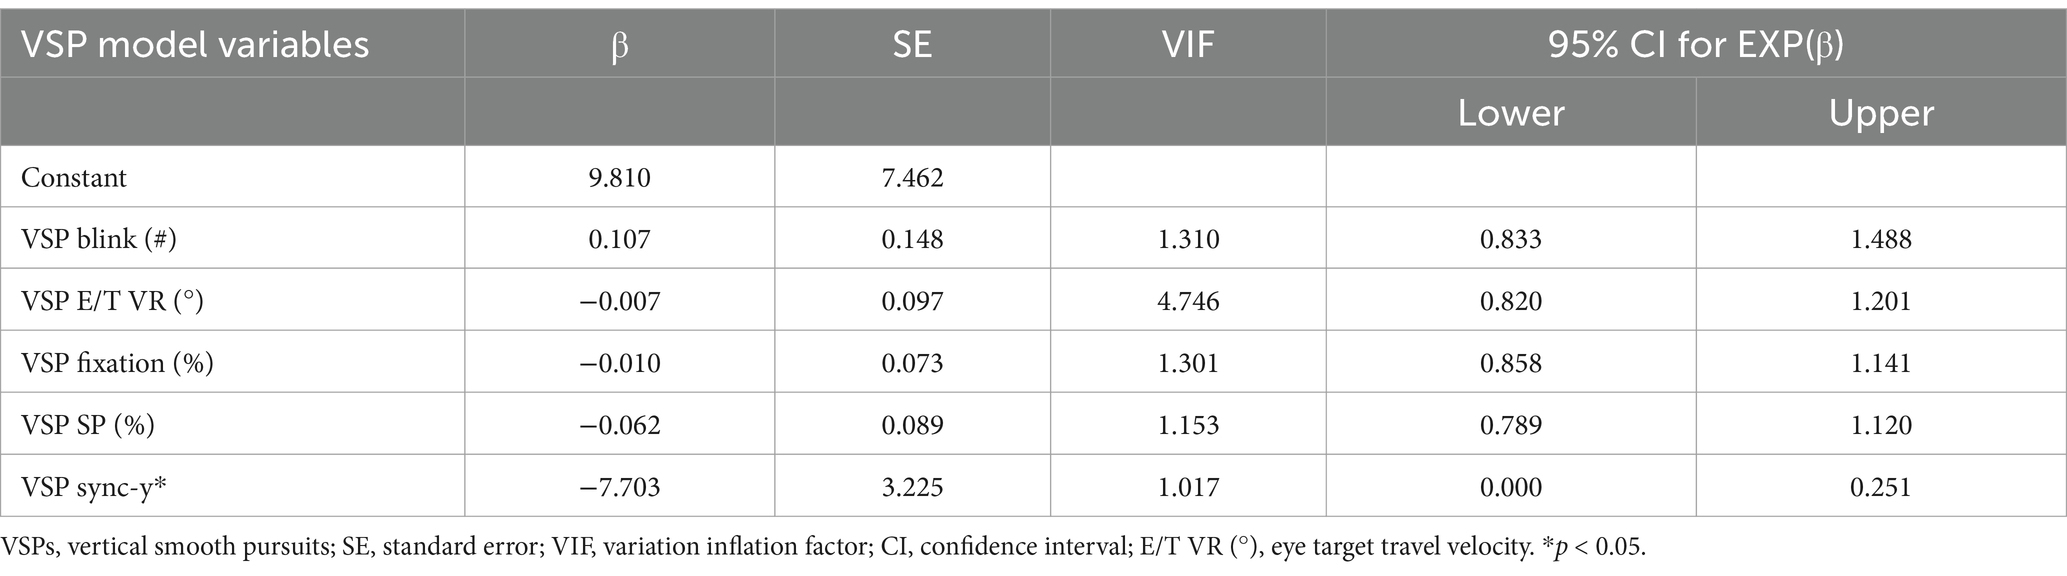
Table 4. Vertical smooth pursuit logistic regression model summary.
Horizontal saccade test
The HS test regression examined the concurrent validity of the four HS test metrics against the corresponding clinician-administered oculomotor test. The Hosmer–Lemeshow test results (p = 0.24) suggested that the model was a good fit. The full model of four predictor variables significantly predicted clinically evaluated HS status (χ2 = 25.523, df = 4, n = 52, p < 0.001) (Table 5). HS All (#) was the only significant individual predictor (Wald statistic p < 0.001). The HS variables explained 52% of the variance in the model, and 84.6% of individuals were correctly predicted (i.e., overall model accuracy). Sensitivity and specificity were 84.6% and 87.4%, respectively.
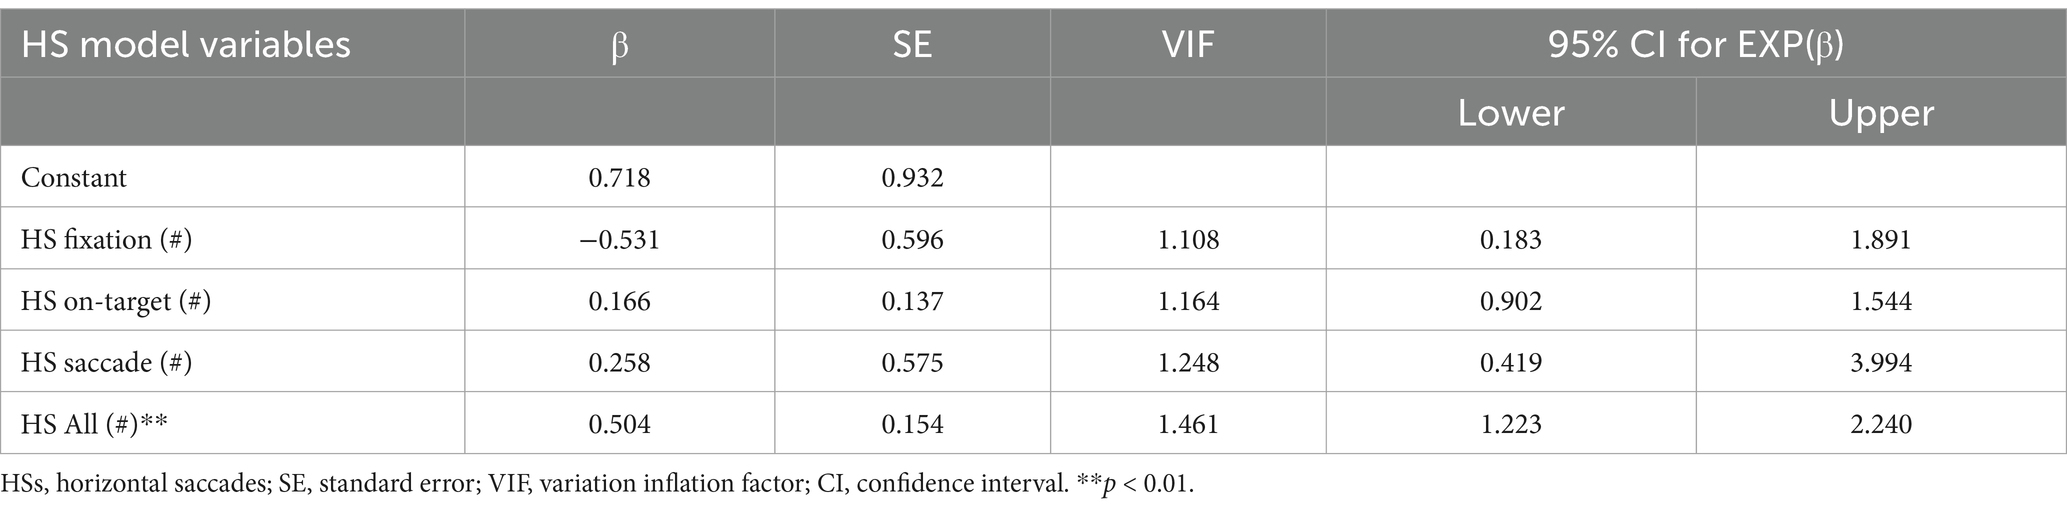
Table 5. Horizontal saccade logistic regression model summary.
Vertical saccade test
The VS test regression examined the concurrent validity of the five VS test metrics against the corresponding clinician-administered oculomotor test. The Hosmer–Lemeshow test results (p = 0.68) suggested that the model was well-fit (Table 6). The full model of the five predictor variables significantly predicted clinically evaluated VS status (χ2 = 19.351, df = 5, n = 52, p < 0.01). VS All (#) was the only significant individual predictor (Wald statistic p = 0.007). The VS variables explained 42% of the variance in the model, and 78.8% of individuals were correctly predicted (i.e., overall model accuracy). Sensitivity and specificity were 70.4% and 88.0%, respectively.
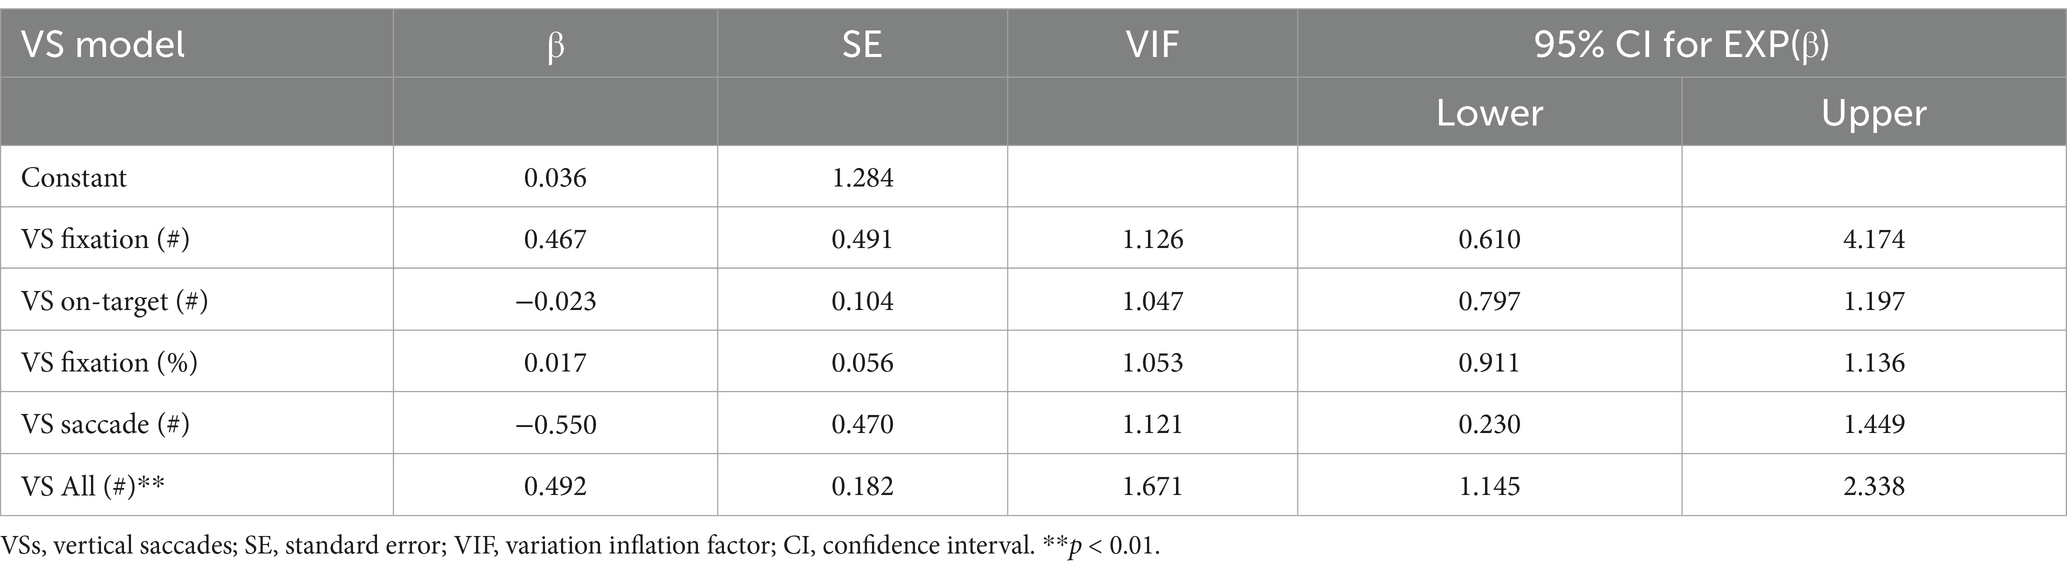
Table 6. Vertical saccade logistic regression model summary.
Expanded diagnostic metrics for each eye-tracking test are presented in Table 7, and a summary of the ROC curves is shown in Figure 3.
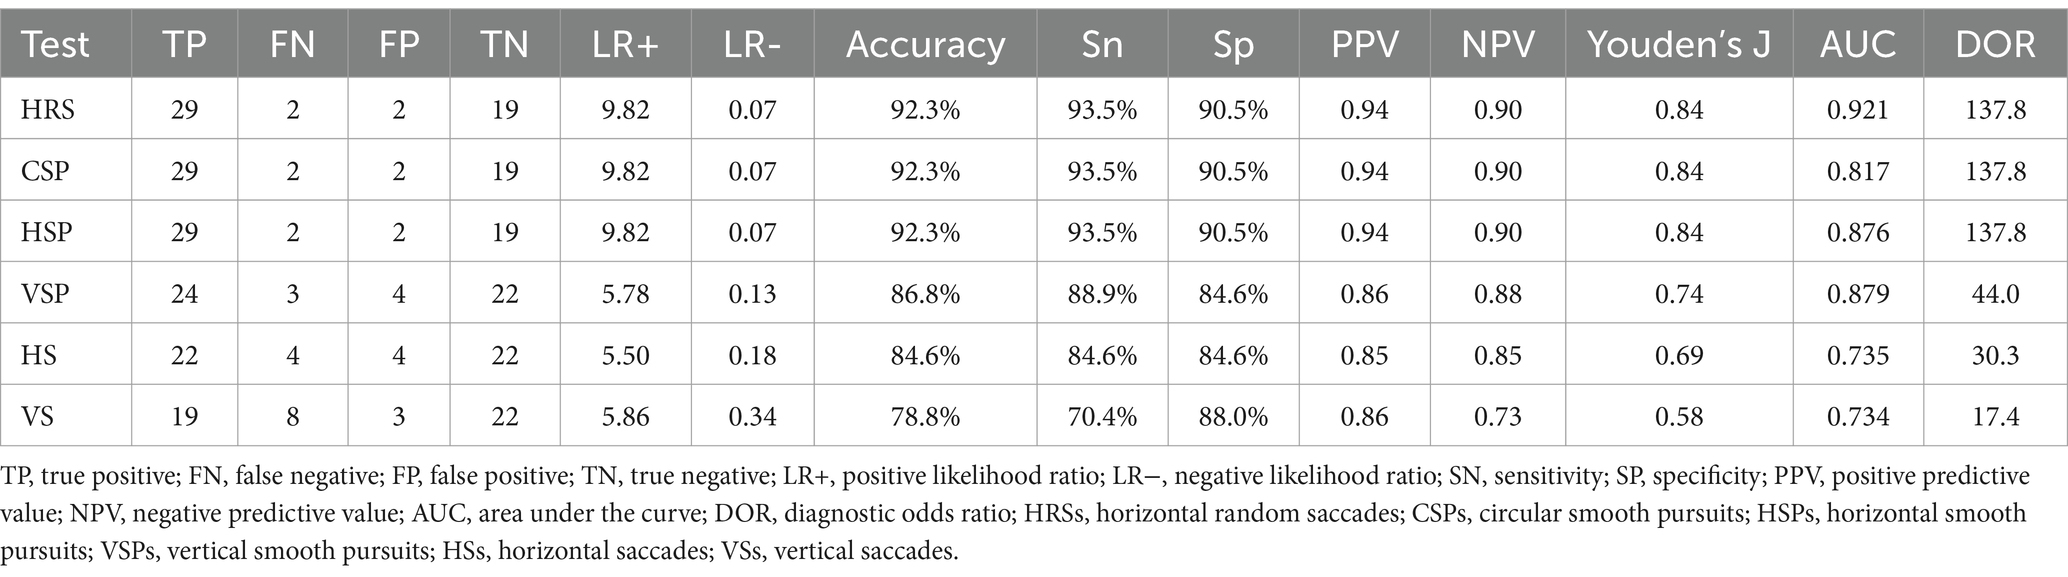
Table 7. Psychometric summary table.

Figure 3. RightEye tests summary ROC matrix for the following oculomotor tests: (A) horizontal random saccades, (B) circular smooth pursuits, (C) horizontal smooth pursuits, (D) vertical smooth pursuits, (E) horizontal saccades, and (F) vertical saccades.
Discussion
The purpose of this study was to assess the validity of a computerized eye-tracking apparatus by comparing the results of six computerized oculomotor tests (i.e., index tests) to the results of a clinician-administered oculomotor examination (both individual tests and overall performance) performed by a board-certified neurologist with 16 years of experience (i.e., reference standard). The clinician-administered oculomotor examination identified ≥50% of the participants as having an abnormal test. These rates are higher than previous studies involving college-aged participants (13.2%–34.2%) (García-Muñoz et al., 2016; Porcar and Martinez-Palomera, 1997; Badovinac et al., 2017) and healthy adults in their 50s (31%) (Leat et al., 2013), but comparable to those found in older adults ages 60 and above (41%–51%). All six eye-tracking tests independently predicted the classification of the corresponding oculomotor examination component or the overall classification determined by the neurologist. Sensitivity was highest in the HRS, CSP, and HSP tests (93.5%) and lowest in the HS tests (84.6%). Specificity was highest in the HRS, CSP, and HSP tests (90.5%) and lowest in the VS test (70.4%). Classification accuracy ranged from 78.8% (VS) to 92.3% (HRS, CSP, and HSP), and the AUC values ranged from 0.734 (VS) to 0.921 (HRS). Additionally, several individual test metrics independently predicted abnormal classification, including HSP SP, VSP sync-y, HS All (number), and VS All (number). The pursuit test demonstrated higher sensitivity and specificity, likely due to the type of test. In previous studies, pursuit tasks, in general, have demonstrated great sensitivity and specificity to differentiating populations’ neuro-dysfunction (e.g., mTBI), and our results align with this finding. It is important to mention that VOR, vergence, and OKR were not evaluated by the neurologist or by the computerized eye-tracking system. Although these are sometimes used as tests, we utilized oculomotor tests that, in our previous studies, distinguished these types of groups (Murray and Hunfalvay, 2017). The results suggest that each of the six computerized eye-tracking tests can accurately distinguish between normal and abnormal oculomotor movements. This study was not designed to determine the cause of abnormal movements.
These data represent the first evidence validating the computerized eye-tracking tests as clinically comparable to a board-certified neurologist’s oculomotor examination. This cohort reported being naïve to eye-tracking technology and was not under the influence of recreational drugs or alcohol, which likely reflects the expected target population for its intended use (i.e., clinical, office-based setting). We also believe that the random assignment of test order and the blinding of both the neurologist and researcher further strengthen the credibility of the results.
Neurologists, ophthalmologists, and optometrists may find that eye-tracking technologies offer three direct benefits to their clinical practice: (1) quantifying eye movements, (2) longitudinal tracking of a patient’s progress (or regression), and (3) standardizing patient evaluations to focus on treatment. Considering the results from this validation study in conjunction with the reliability and normative data previously published, (Murray and Hunfalvay, 2017) there is preliminary support for the computerized apparatus to be a tool for assessing saccades and smooth pursuits eye movements (excluding vergence, VOR, and OKR).
Conclusion
While the researchers were thoughtful in the design and execution of the project, this study was not without limitations. The characteristics of the participants may represent a limitation. Due to the unknown etiology of abnormal eye movements, we were unable to determine whether certain diagnosed or undiagnosed neurological diseases may have affected the accuracy of the computerized apparatus. Furthermore, the use of a single clinician and the study’s design are possible limitations. Although it is standard practice and the current ‘gold standard’ to have a single clinician perform these tests, it is possible that the conclusions derived by the clinician, even with 16 years of clinical practice, may have limitations. Eye-tracking has the potential to add value by contributing to a more objective conclusion. Another challenge was the relatively small sample size; however, a post-hoc power analysis indicated that the study was sufficiently powered. Furthermore, with the participants aged 20–43 years old, these results should not be generalized to all ages of the lifespan (e.g., minors or older adults). Additionally, the age range was chosen to reduce the opportunity for the results to be influenced by age. Importantly, the testing was described as an oculomotor exam, but we acknowledge that it was not a comprehensive assessment of the oculomotor system (VOR, OKR, and vergence excluded). HRSs, as an overall measure of oculomotor function, require further investigation to determine if the computerized test performance is predictive of VOR, OKR, or vergence testing results. Therefore, the results of HRS diagnostic performance should not be applied generally, and the “overall oculomotor function” must be framed within the context that VOR, OKR, and vergence testing were not analyzed in this study. As technological advances are introduced to the medical community, clinicians must learn how to incorporate biotechnology into their practice when appropriate. Leveraging technology may improve diagnostic capabilities, reduce inefficiencies, and enhance clinical care.
Data availability statement
The raw data supporting the conclusions of this article will be made available by the authors, without undue reservation.
Ethics statement
The studies involving humans were approved by the East Carolina University Institutional Review Board. The studies were conducted in accordance with the local legislation and institutional requirements. The participants provided their written informed consent to participate in this study.
Author contributions
BT: Conceptualization, Data curation, Formal analysis, Funding acquisition, Investigation, Methodology, Project administration, Resources, Software, Supervision, Validation, Visualization, Writing – original draft, Writing – review & editing. MH: Conceptualization, Data curation, Formal analysis, Funding acquisition, Investigation, Methodology, Project administration, Resources, Software, Supervision, Validation, Visualization, Writing – original draft, Writing – review & editing. NM: Conceptualization, Data curation, Formal analysis, Funding acquisition, Investigation, Methodology, Project administration, Resources, Software, Supervision, Validation, Visualization, Writing – original draft, Writing – review & editing. GM: Conceptualization, Data curation, Formal analysis, Funding acquisition, Investigation, Methodology, Project administration, Resources, Software, Supervision, Validation, Visualization, Writing – original draft, Writing – review & editing. FC: Conceptualization, Data curation, Formal analysis, Funding acquisition, Investigation, Methodology, Project administration, Resources, Software, Supervision, Validation, Visualization, Writing – original draft, Writing – review & editing.
Funding
The author(s) declare that financial support was received for the research and/or publication of this article.
Conflict of interest
MH is a full-time employee with RightEye and has relevant affiliations and financial involvement. Funding for this study was provided by RightEye, LLC, Bethesda, MD for participant compensation and research effort for GM. The sponsor or funding organization participated in the study’s design, conducting the study, and reviewing the manuscript.
The remaining authors declare that the research was conducted in the absence of any commercial or financial relationships that could be construed as a potential conflict of interest.
Generative AI statement
The authors declare that no Gen AI was used in the creation of this manuscript.
Publisher’s note
All claims expressed in this article are solely those of the authors and do not necessarily represent those of their affiliated organizations, or those of the publisher, the editors and the reviewers. Any product that may be evaluated in this article, or claim that may be made by its manufacturer, is not guaranteed or endorsed by the publisher.
References
Badovinac, S., Quaid, S., and Hutchison, M. G. Prevalence of Oculomotor Dysfunction in Healthy Athletes Preseason: Implications for Concussion in Sport. (2017); Available online at: www.covd.org (Accessed January 01, 2023).
Baeyens, J. P., Serrien, B., Goossens, M., and Clijsen, R. (2019). Questioning the “SPIN and SNOUT” rule in clinical testing. Arch Physiother. 9, 1–6. doi: 10.1186/s40945-019-0056-5
Bardsley, M. J., Astell, S., McCallum, A., and Home, P. D. (1993). The performance of three measures of health status in an outpatient diabetes population. Diabet. Med. 10, 619–626. doi: 10.1111/j.1464-5491.1993.tb00134.x
Berson, E. L., Rosner, B., Sandberg, M. A., Hayes, K. C., Nicholson, B. W., Weigel Difranco, C., et al. (1993). A randomized trial of vitamin a and vitamin E supplementation for retinitis pigmentosa. Arch. Ophthalmol. 111, 761–772. doi: 10.1001/archopht.1993.01090060049022
Boucart, M., Bubbico, G., Szaffarczyk, S., and Pasquier, F. (2014). Animal spotting in Alzheimer’s disease: an eye tracking study of object categorization. J. Alzheimers Dis. 39, 181–189. doi: 10.3233/JAD-131331
Ciuffreda, K. J., Ludlam, D. P., Thiagarajan, P., Yadav, N. K., and Capo-Aponte, J. (2014). Proposed objective visual system biomarkers for mild traumatic brain injury. Mil. Med. 179, 1212–1217. doi: 10.7205/MILMED-D-14-00059
de Villers-Sidani, É., Voss, P., Bastien, N., Cisneros-Franco, J. M., Hussein, S., Mayo, N. E., et al. (2023). Oculomotor analysis to assess brain health: preliminary findings from a longitudinal study of multiple sclerosis using novel tablet-based eye-tracking software. Front. Neurol. 14:1243594. doi: 10.3389/fneur.2023.1243594
García-Muñoz, Á., Carbonell-Bonete, S., Cantó-Cerdán, M., and Cacho-Martínez, P. (2016). Accommodative and binocular dysfunctions: prevalence in a randomised sample of university students. Clin. Exp. Optom. 99, 313–321. doi: 10.1111/cxo.12376
Gilbert, C. (2013) in Principles of neural science. eds. E. Kandell, J. Schwartz, T. Jessell, S. Siegelbaum, and A. Hudspeth. 5th ed (New York: McGraw-Hill), 556–576.
Green, S. B. (1991). How many subjects does it take to do a regression analysis? Multivariate Behav Res. 26, 499–510. doi: 10.1207/s15327906mbr2603_7
Han, S. J., Guo, Y., Granger-Donetti, B., Vicci, V. R., and Alvarez, T. L. (2010). Quantification of heterophoria and phoria adaptation using an automated objective system compared to clinical methods. Ophthalmic Physiol. Opt. 30, 95–107. doi: 10.1111/j.1475-1313.2009.00681.x
Holmqvist, K., and Nyström, M. (2011). Eye tracking: A comprehensive guide to methods and measures. Oxford, England: Oxford University Press, 131–134.
Jones, B. (1975). Spatial perception in the blind. Br. J. Psychol. 66, 461–472. doi: 10.1111/j.2044-8295.1975.tb01481.x
Kooiker, M. J. G., Pel, J. J. M., Verbunt, H. J. M., de Wit, G. C., van Genderen, M. M., and van der Steen, J. (2016). Quantification of visual function assessment using remote eye tracking in children: validity and applicability. Acta Ophthalmol. 94, 599–608. doi: 10.1111/aos.13038
Leat, S. J., Chan, L. L. L., Maharaj, P. D., Hrynchak, P. K., Mittelstaedt, A., Machan, C. M., et al. (2013). Binocular vision and eye movement disorders in older adults. Invest. Ophthalmol. Vis. Sci. 54, 3798–3805. doi: 10.1167/iovs.12-11582
Lynch, J. C., Mountcastle, V. B., Talbot, W. H., and Yin, T. C. T. (1977). Parietal lobe mechanisms for directed visual attention. J. Neurophysiol. 40, 362–389. doi: 10.1152/jn.1977.40.2.362
Murray, N. P., and Hunfalvay, M. (2017). Reliability and normative data of computerized dynamic visual acuity tests. Vis Dev Rehabil. 3, 24–33.
Murray, N., Kubitz, K., Roberts, C. M., Hunfalvay, M., Bolte, T., and Tyagi, A. (2019). An examination of the oculomotor metrics within a suite of digitized eye tracking tests. IEEE J Transl Eng Health Med. 5, 269–284. doi: 10.31707/VDR2019.5.4.p269
Niehorster, D. C., Cornelissen, T. H. W., Holmqvist, K., Hooge, I. T. C., and Hessels, R. S. (2018). What to expect from your remote eye-tracker when participants are unrestrained. Behav. Res. Methods 50, 213–227. doi: 10.3758/s13428-017-0863-0
Porcar, E., and Martinez-Palomera, A. (1997). Prevalence of general binocular dysfunctions in a population of university students. Optom. Vis. Sci. 74, 111–113. doi: 10.1097/00006324-199702000-00023
Raghuram, A., Cotter, S. A., Gowrisankaran, S., Kanji, J., Howell, D. R., Meehan, W. P., et al. (2019). Postconcussion: receded near point of convergence is not diagnostic of convergence insufficiency. Am. J. Ophthalmol. 206, 235–244. doi: 10.1016/j.ajo.2019.04.008
Renard, D., Ferraro, A., Lorenzini, M. C., Jeanjean, L., Portal, M. C., Llinares, E., et al. (2015). Orthoptic and video-oculographic analyses in oculopharyngeal muscular dystrophy. Muscle Nerve 52, 554–558. doi: 10.1002/mus.24600
Sharpe, J., and Wong, A. M. (2005) in Clinical Neuro-Ophthalmology. eds. N. R. Miller, N. Newman, V. Biousse, and W. F. Hoyt. 6th ed (Philadelphia PA: Lippincott Williams & Wilkins), 809–885.
Tabachnick, B., and Fidell, L. (2001). Tabachnick & Fidell, using multivariate statistics, 4th edition. 4th Edn. Boston, MA: Allyn & Bacon.
Keywords: eye tracking, oculomotor behavior, saccade, smooth pursuit, clinical examination, digital biomarkers
Citation: Trotter B, Hunfalvay M, Murray NP, Mathews GC and Carrick FR (2025) Development of oculomotor digital biomarkers using clinical examinations as “Ground Truth”. Front. Hum. Neurosci. 19:1556451. doi: 10.3389/fnhum.2025.1556451
Edited by:
Frouke Nienke Boonstra, Royal Dutch Visio, NetherlandsReviewed by:
Igor Straka, Comenius University, SlovakiaNadejda Bogdanova Bocheva, Bulgarian Academy of Sciences (BAS), Bulgaria
Copyright © 2025 Trotter, Hunfalvay, Murray, Mathews and Carrick. This is an open-access article distributed under the terms of the Creative Commons Attribution License (CC BY). The use, distribution or reproduction in other forums is permitted, provided the original author(s) and the copyright owner(s) are credited and that the original publication in this journal is cited, in accordance with accepted academic practice. No use, distribution or reproduction is permitted which does not comply with these terms.
*Correspondence: Nicholas P. Murray, bXVycmF5bmlAZWN1LmVkdQ==