 Guillermo Mendez-Rebolledo1
 Ignacio Orozco-Chavez2Joaquín Salazar-Méndez1Juan Morales-Verdugo3
 Eduardo Martinez-Valdes4*
- 1Laboratorio de Investigación Somatosensorial y Motora, Escuela de Kinesiología, Facultad de Salud, Universidad Santo Tomás, Talca, Chile
- 2Departamento de Ciencias del Movimiento Humano, Facultad de Ciencias de la Salud, Universidad de Talca, Talca, Chile
- 3Departamento de Ciencias Preclínicas, Facultad de Medicina, Universidad Católica del Maule, Talca, Chile
- 4School of Sport, Exercise and Rehabilitation Sciences, College of Life and Environmental Sciences, University of Birmingham, Birmingham, United Kingdom
Introduction: Musculoskeletal dysfunctions can significantly impair quality of life due to persistent pain and neuromuscular adaptations. While regional activation patterns in healthy muscles are well-documented, the effects of clinical and experimental pain on these patterns remain inconsistent. Accordingly, this study systematically evaluates the scientific evidence on alterations in the spatial distribution of muscle activity, quantified by shifts in the center of activity of high-density surface electromyography (HD-sEMG) signals, under experimental and clinical pain conditions.
Methods: A comprehensive database search was conducted from inception to June 6, 2025. The review included studies that evaluated the spatial distribution of muscle activity with HD-sEMG, analyzing two-dimensional shifts in the center of activity among individuals with clinical or experimentally induced pain. Methodological quality was assessed using the adapted Newcastle-Ottawa Scale, and evidence certainty was evaluated with the GRADE approach. A random-effects model was employed in the meta-analysis to account for variability across studies.
Results: Twenty studies involving 562 participants (231 control, 266 clinical pain, and 65 experimental pain) were included. The meta-analysis revealed a statistically significant shift in the center of activity in individuals with clinical pain compared with asymptomatic controls (SMD = 0.49; 95% CI = 0.15 to 1.84; p = 0.004), particularly those with chronic low back pain, with a low effect size (SMD = 0.43; 95% CI = 0.03 to 0.83; p = 0.04), indicating altered spatial distribution of muscle activity. A meta-analysis for experimental pain was not feasible due to limited data.
Conclusions: These findings underscore that clinical pain is associated with altered spatial distribution of muscle activity and emphasize the need for standardized methodologies and further research across diverse populations to enhance pain management and rehabilitation strategies.
Systematic review registration: This study was prospectively registered in the International Prospective Register of Systematic Reviews (PROSPERO) (identifier CRD42024534320), https://www.crd.york.ac.uk/PROSPERO/view/CRD42024534320.
1 Introduction
For chronic musculoskeletal dysfunctions, such as patellofemoral pain syndrome, chronic ankle instability, and chronic low back pain (CLBP), significantly impact global health, leading to reduced quality of life and increased healthcare expenditures (Chia et al., 2022; Perrot et al., 2022; Hong and Calder, 2023). These conditions are characterized by persistent or chronic pain, leading to non-stereotypical neuromuscular adaptations (Graven-Nielsen, 2022; Devecchi et al., 2023). These adaptations manifest as changes in range of motion, movement variability, amplitude and distribution of muscle activity, timing of muscle activity, and corticospinal excitability (Behnke et al., 2021; Devecchi et al., 2023; Rogoschin et al., 2024). According to current theories, pain does not uniformly affect groups of motoneurons but instead causes non-uniform effects on motoneuron pools, leading to a redistribution of activity within (i.e., altered regional activation) or between muscles (Hodges et al., 2021; Dernoncourt et al., 2025; Hug et al., 2025). It has been suggested that this adaptation aims to protect the painful area from further injury (Hodges and Tucker, 2011; Hodges and Smeets, 2015; Hodges et al., 2021).
High-density surface electromyography (HD-sEMG) has emerged as a valuable technique to overcome the limitations of traditional single-channel sEMG, which lacks the spatial resolution needed to detect regional muscle activation patterns (Besomi et al., 2020; Gallina et al., 2022; Mendez-Rebolledo et al., 2023b). HD-sEMG, which uses a grid of electrodes, enhances spatial resolution and allows for more precise mapping of muscle activity (Drost et al., 2006). A widely used analysis method is the center of activity, also referred to as the centroid, barycenter, or center of mass, which summarizes the distribution of sEMG amplitude across the electrode grid as x- and y-coordinates (Gallina et al., 2022). This center shifts during motor tasks and contractions, reflecting relative changes in the spatial location of activation. Displacements of the center of activity have been reported in muscles such as the pectoralis major (Cabral et al., 2022), erector spinae (Arvanitidis et al., 2021), vastus medialis (Gallina et al., 2019), and fibularis longus (Mendez-Rebolledo et al., 2021a), suggesting spatial reorganization of muscle activity in different tasks. The center of activity, while susceptible to artifacts such as electrode shift, cross-talk, and cardiovascular noise (Farina et al., 2004), is a commonly used measure in HD-sEMG research. Although its validity has not been systematically established, it is recommended in recent methodological guidelines for spatial EMG analysis (Gallina et al., 2022). While motor unit decomposition provides greater mechanistic insight, its application is more feasible during isometric or less demanding motor tasks, as it is highly sensitive to movement artifact and signal noise (Martinez-Valdes et al., 2023). In contrast, the center of activity remains commonly used in dynamic, functionally demanding tasks involving complex muscles like the erector spinae (e.g., lumbar endurance and lifting activities) (Arvanitidis et al., 2021; Sanderson et al., 2024). Given the heterogeneity of protocols in pain-related research, this method offers a practical and comparable approach for assessing spatial muscle activation across studies.
Despite the high prevalence of chronic musculoskeletal dysfunctions (Hiller et al., 2012), it remains unclear whether clinical pain consistently alters the spatial distribution of muscle activity, as previous studies have yielded conflicting results. For instance, Gallina et al. (2019) used HD-sEMG to examine vasti muscle activation in females with patellofemoral pain and found that healthy individuals displayed more complex spatial patterns, requiring a greater number of principal components to explain signal variance. In contrast, individuals with pain exhibited reduced spatial complexity and intermuscular coordination, suggesting a less adaptable motor strategy (Gallina et al., 2019). Even within a single contraction, shifts in the center of activity may reflect altered motor unit recruitment patterns associated with chronic pain. Although such neuromuscular adaptations may already be established, comparing spatial activation between patients and healthy controls remains essential. It enables the identification of reorganization patterns, quantification of their magnitude, and detection of potentially maladaptive spatial patterns. These insights are critical for informing targeted rehabilitation strategies. Similarly, experimental pain models, such as infrapatellar hypertonic saline injections, have shown reduced activation in the distal regions of the vastus medialis and lateralis (Gallina et al., 2018b). Conversely, other studies have reported a uniform activation pattern of the vastus medialis under induced pain (Hug et al., 2014a,b), highlighting the methodological variability across investigations. Such inconsistencies may result from methodological differences, variations in motor tasks, or the pain models used, and highlight the need to guide future research toward identifying spatial activation patterns that may be maladaptive and contribute to persistent dysfunction (Gallina et al., 2018b).
Current evidence indicates that pain may alter motor unit recruitment and regional activation patterns, changing the spatial distribution of force within the muscle. These changes can influence the orientation of the resulting joint force vector (Tucker and Hodges, 2010; Gallina et al., 2018b). However, it remains unclear whether these changes are primarily driven by experimental pain, clinical pain, or a combination of both (Hodges and Tucker, 2011; Hug et al., 2014b; Gallina et al., 2018b; Hodges et al., 2021). In addition, pain-related alterations in muscle activity may also be task-specific. These alterations may serve as adaptive strategies to mitigate pain, protect the affected area, and delay fatigue during repetitive tasks. Therefore, this study systematically evaluates the scientific evidence on alterations in the spatial distribution of muscle activity, quantified by shifts in the center of activity of HD-sEMG signals, under experimental and clinical pain conditions. Synthesizing these findings will provide an overview of how pain is reflected in spatial shifts of muscle activity, highlight methodological strengths and limitations, and outline directions for mechanistic research that could ultimately inform future treatment and rehabilitation strategies.
2 Methods
This systematic review and meta-analysis were conducted following the PRISMA and MOOSE reporting guidelines (Stroup, 2000; Page et al., 2021). This study was prospectively registered in the International Prospective Register of Systematic Reviews (PROSPERO) (CRD42024534320).
2.1 Data sources and searches
The search strategy was applied in PubMed/MEDLINE, Web of Science, Scopus, CINAHL, and SPORTDiscus using a combination of Medical Subject Headings terms, keywords, and Boolean operators. Specific search terms and combinations can be found in Table 1. In addition, the reference lists of eligible articles were manually searched in Google Scholar, and experts in the field were consulted to identify studies that were not found with the search strategy.
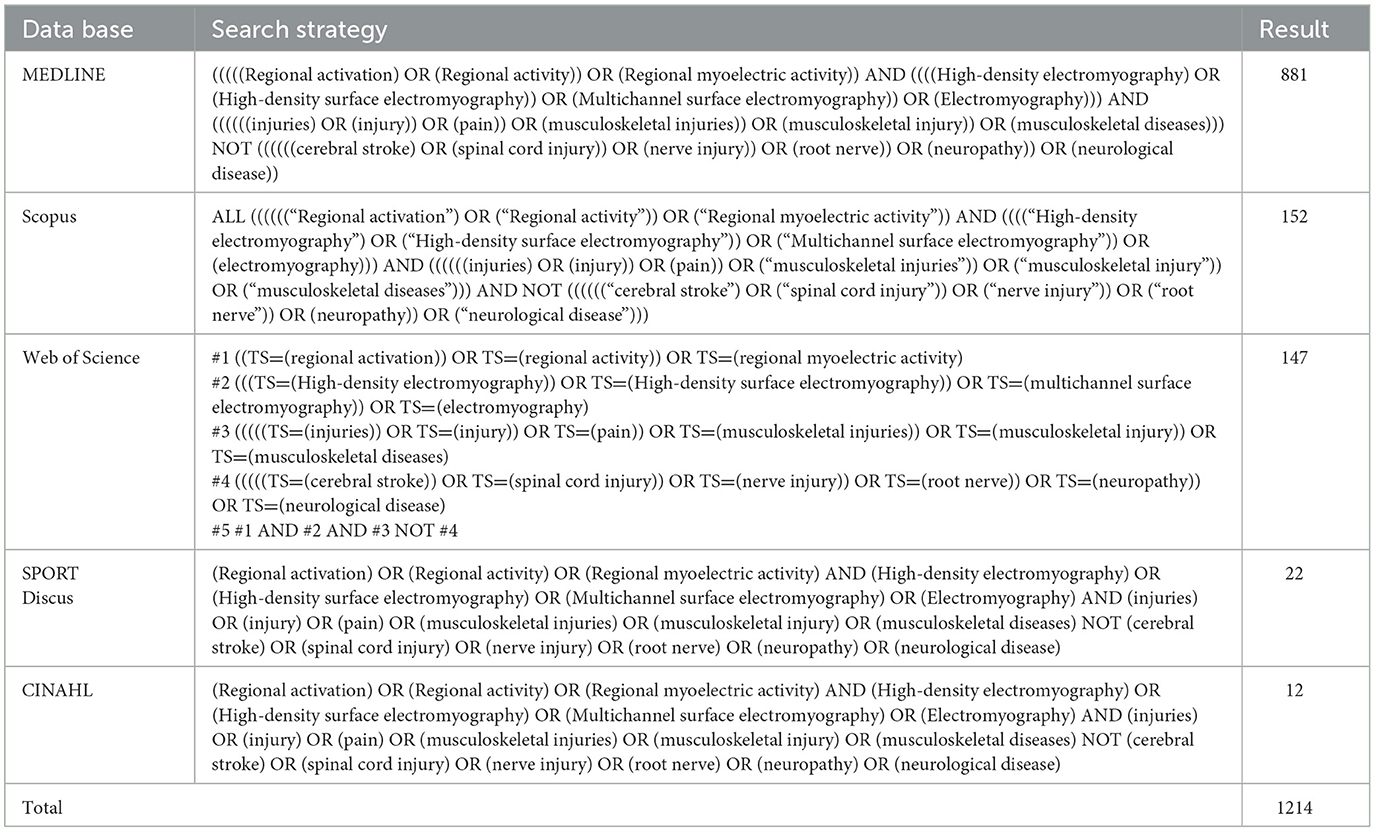
Table 1. Search strategy.
2.2 Eligibility criteria
The PECO framework was used as inclusion criteria (Populations, Exposures, Comparators and Outcomes) (Morgan et al., 2018; Dekkers et al., 2019): (i) populations: any human subject; (ii) exposures: any musculoskeletal chronic condition associated to clinical pain or experimentally induced pain; (iii) comparators: a non-exposed reference population, which includes healthy individuals with no history of musculoskeletal disease or dysfunction in the last 6 months, or healthy individuals serving as their own control when comparing results before (baseline) and after exposure to experimental pain (e.g., hypertonic saline injection); (iv) outcomes: spatial distribution of muscle activity, defined as the relative localization sEMG amplitude across a muscle (Gallina et al., 2022). This distribution can be assessed either by comparing the amplitude of the sEMG signal—such as root mean square (RMS) or average rectified value (ARV)—in specific regions, or by analyzing changes across multiple sEMG electrodes (i.e., HD-sEMG arrays). The latter approach involves computing displacements in the center of activity (also referred to as barycenter, centroid, center of mass, or locus) to summarize spatial shifts in muscle activity (Gallina et al., 2022). Cross-sectional studies of peer-reviewed articles written in English or Spanish, published from inception to June 6, 2025, were included. Exclusion criteria for this study were: (i) research on neurological disease; (ii) all editorials, letters, reviews, and meta-analyses.
2.3 Study selection
Two independent reviewers (IO-C and JM-V) used Rayyan web software (http://rayyan.qcri.org) to analyze the results (Ouzzani et al., 2016). After removing duplicates, studies were selected by title and abstract. Those potentially eligible studies were read in full text, and the inclusion and exclusion criteria were applied. In case of disagreement during any of the phases, a third author was consulted to resolve (GM-R).
2.4 Data collection
A standardized table was used for data collection. Two independent reviewers (IO-C and JM-V) extracted data from the studies. In case of disagreement, a third reviewer (GM-R) resolved the disagreement. Data collected for each study included: author, muscle group and electrode location, signal derivation and electrode specifications, sample size, sex, sEMG outcomes, task, pain intensity, and spatial distribution results. For studies with missing data, we attempted to contact the authors 3 times, by email.
2.5 Risk of bias assessment
The Newcastle-Ottawa Scale (NOS), adapted for this study, was utilized to assess the methodological quality of cross-sectional studies (Modesti et al., 2016). Previous systematic reviews on observational studies involving sEMG have employed this scale (Mendez-Rebolledo et al., 2021b). The adapted NOS comprises seven items, focusing on sample selection, comparability, and outcome. Each subitem is rated from 0 to 2 stars, with a maximum total score of 9. The comparability item examines the control of potential confounding factors. A single star is awarded when the study considered confounders related to the presence of clinical or experimental pain and conducted subgroup analyses accordingly (e.g., by pain type, pain location, or interaction with contraction type or movement phase). Methodological quality was classified using established thresholds from prior systematic reviews (Modesti et al., 2016; Mendez-Rebolledo et al., 2021b, 2022): studies scoring 0–4 stars were rated as low quality, 5–7 as moderate quality, and 8–9 as high quality. Discrepancies in scores will be resolved through consensus, and the agreed-upon rating will be assigned to each study. The reviewers must achieve substantial agreement (kappa coefficient ≥ 0.80) in the final classification of the studies. Additionally, an adaptation of the Consensus for Experimental Design in Electromyography (CEDE) checklist was implemented to assess the methodological quality and reporting transparency of the sEMG procedures employed in the included studies (Besomi et al., 2024). This checklist originally contained 40 items, divided into two sections. For this study, only the ‘Procedure for sEMG Recording' section was considered. Items that were not applicable due to study design or the type of electromyography (i.e., needle or wireless) were excluded, resulting in a modified 20-point checklist.
2.6 Certainty of evidence
The Grading of Recommendations Assessment, Development, and Evaluation (GRADE) approach was used to grade the certainty of the evidence for each outcome (Guyatt et al., 2008). Two reviewers (J S-M and G M-R) used GRADEpro (https://gradepro.org) to produce a summary table of results. The certainty of the evidence was determined in two stages. In the first, it was considered to reduce the certainty according to the following criteria: (i) limitation of the included studies: decrease one level if 25% or more of the included articles had a high risk of bias evaluated with NOS; (ii) inconsistency: decrease one level if there was high heterogeneity (I2 ≥ 75%); (iii) indirectness: down one level if there were differences between participants, interventions, outcome measures or indirect comparisons; (iv) imprecision: a markdown level was considered if there was a wide confidence interval, crosses the line of no effect, and small sample size (n < 300); (v) risk of publication bias: decrease one level if there was asymmetry in the funnel plot.
2.7 Data analysis
ReviewManager version 5.3 (The Nordic Cochrane Center, The Cochrane Collaboration) was used for statistical analysis. The standardized mean difference (SMD) (Anzures-Cabrera et al., 2011) and 95% confidence intervals (CIs) were calculated to estimate the differences in regional activity (e.g., center of activity) between patients with clinical pain (musculoskeletal injuries), experimental pain, and a combination of both, compared to healthy controls. When the standard deviation (SD) was not reported by the studies, standard formulas were used to derive it based on the standard error (SE), the 95% CI, or the p-value of a t-test (Deeks et al., 2021). Studies were pooled using a random-effects model with the DerSimonian and Laird method, as heterogeneity in true effect sizes was assumed between included studies (Borenstein et al., 2010). An SMD of 0.0 to 0.2 represented a trivial effect, 0.2 to 0.6 a small effect, 0.6 to 1.2 a moderate effect, 1.2 to 2.0 a large effect, 2.0–4.0 a very large effect, and 4.0 an extremely large effect (Hopkins et al., 2009). Heterogeneity was assessed using the I2 statistic, considering values of < 25% as low, 25%−75% as moderate, and >75% as high heterogeneity (Higgins, 2003). In addition, if there was a high level of heterogeneity (i.e. I2 > 75%), a sensitivity analysis was applied to remove one study at a time to determine the impact on the heterogeneity of the results (Higgins, 2003).
3 Results
3.1 Study selection
The results of the search are reported in Figure 1. In total, 1,214 articles were identified from databases. After the removal of duplicates (n = 147), 1,067 articles were screened by title and abstract, excluding 1,040 articles. The remaining 27 articles were included in the review process. Eleven articles were excluded due to outcomes not aligned with the review's focus on the spatial distribution of muscle activity (Supplementary Table S1). The reasons for exclusion were as follows: the absence of center of activity or comparable spatial analyses (n = 5) (Finneran et al., 2003; Yong et al., 2004; Gaudreault et al., 2005; Sung et al., 2005; Gallina et al., 2018a), use of non-HD-sEMG systems or the absence of a multichannel electrode configuration capable of spatially sampling muscle activity (n = 3) (Pirouzi et al., 2006; Schabrun et al., 2017; Claus et al., 2018), non-eligible populations (n = 2) (Kubo et al., 2019; Abboud et al., 2021), and studies applying therapeutic interventions that may have influenced the spatial distribution of muscle activity (n = 1) (Mendez-Rebolledo et al., 2025). Additionally, four articles were identified from reference citations, including a total of twenty articles in this review (Figure 1), of which fifteen were included in the meta-analysis based on available quantitative data on center of activity displacement.
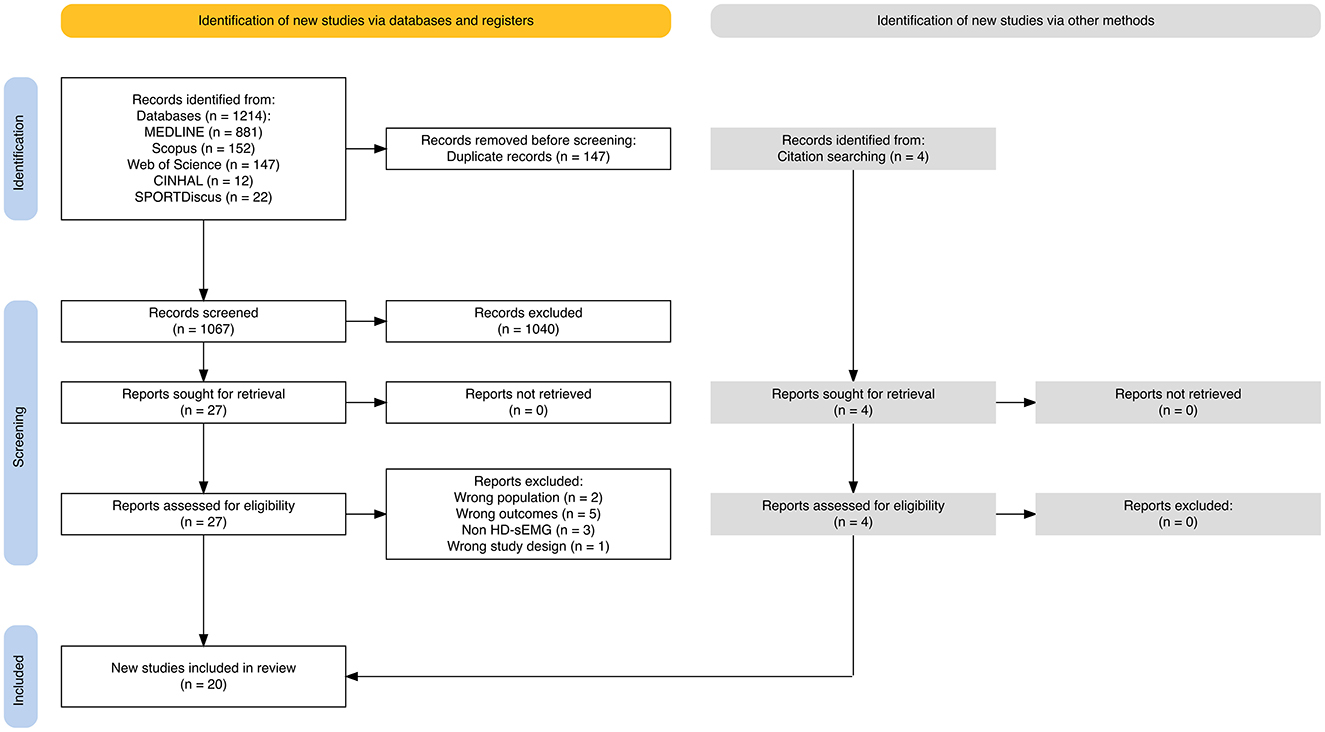
Figure 1. PRISMA flow diagram. PRISMA, preferred reporting items for systematic reviews and meta-analyses. HD-sEMG, high-density surface electromyography.
3.2 Characteristics of the studies
The characteristics of the 20 studies included in this review are summarized in Tables 2, 3. The sample was made up of 562 participants [231 control (healthy); 266 clinical pain; 65 experimental pain], including 245 females and 317 males. The reported age ranged from 17.8 to 46.6 years, with a pooled mean age of 30.5 ± 6.7 years. Four musculoskeletal dysfunctions associated with clinical pain were identified in the included studies: CLBP (n = 12) (Abboud et al., 2014; Falla et al., 2014; Martinez-Valdes et al., 2019; Sanderson et al., 2019a,b, 2024; Hao et al., 2020; Arvanitidis et al., 2021, 2022, 2023; Serafino et al., 2021; Sampieri et al., 2025), patellofemoral pain syndrome (n = 1) (Gallina et al., 2019), and chronic ankle instability (n = 1) (Mendez-Rebolledo et al., 2023a), and lumbar myofascial trigger point (n = 1) (Li et al., 2024). Two experimental pain conditions were identified: upper trapezius pain by hypertonic saline injection (n = 4) (Madeleine et al., 2006; Dideriksen et al., 2016; Falla et al., 2017; Ducas et al., 2024) and erector spinae pain by nociceptive electrical stimulation (n = 1) (Ducas et al., 2024). Neuromuscular activity was measured across different tasks and differentiated by the type of muscle contraction involved. This allowed the same study to provide information on both the concentric and eccentric phases when dynamic tasks were performed. Neuromuscular activity was measured during isometric (n = 11) (Madeleine et al., 2006; Abboud et al., 2014; Dideriksen et al., 2016; Gallina et al., 2018b; Sanderson et al., 2019b; Hao et al., 2020; Arvanitidis et al., 2022; Mendez-Rebolledo et al., 2023a; Ducas et al., 2024; Li et al., 2024; Sampieri et al., 2025), concentric (n = 9) (Falla et al., 2014, 2017; Gallina et al., 2019; Martinez-Valdes et al., 2019; Sanderson et al., 2019a, 2024; Arvanitidis et al., 2021, 2023; Serafino et al., 2021), and eccentric (n = 8) (Falla et al., 2014, 2017; Gallina et al., 2019; Martinez-Valdes et al., 2019; Sanderson et al., 2019a, 2024; Serafino et al., 2021; Arvanitidis et al., 2023) tasks.
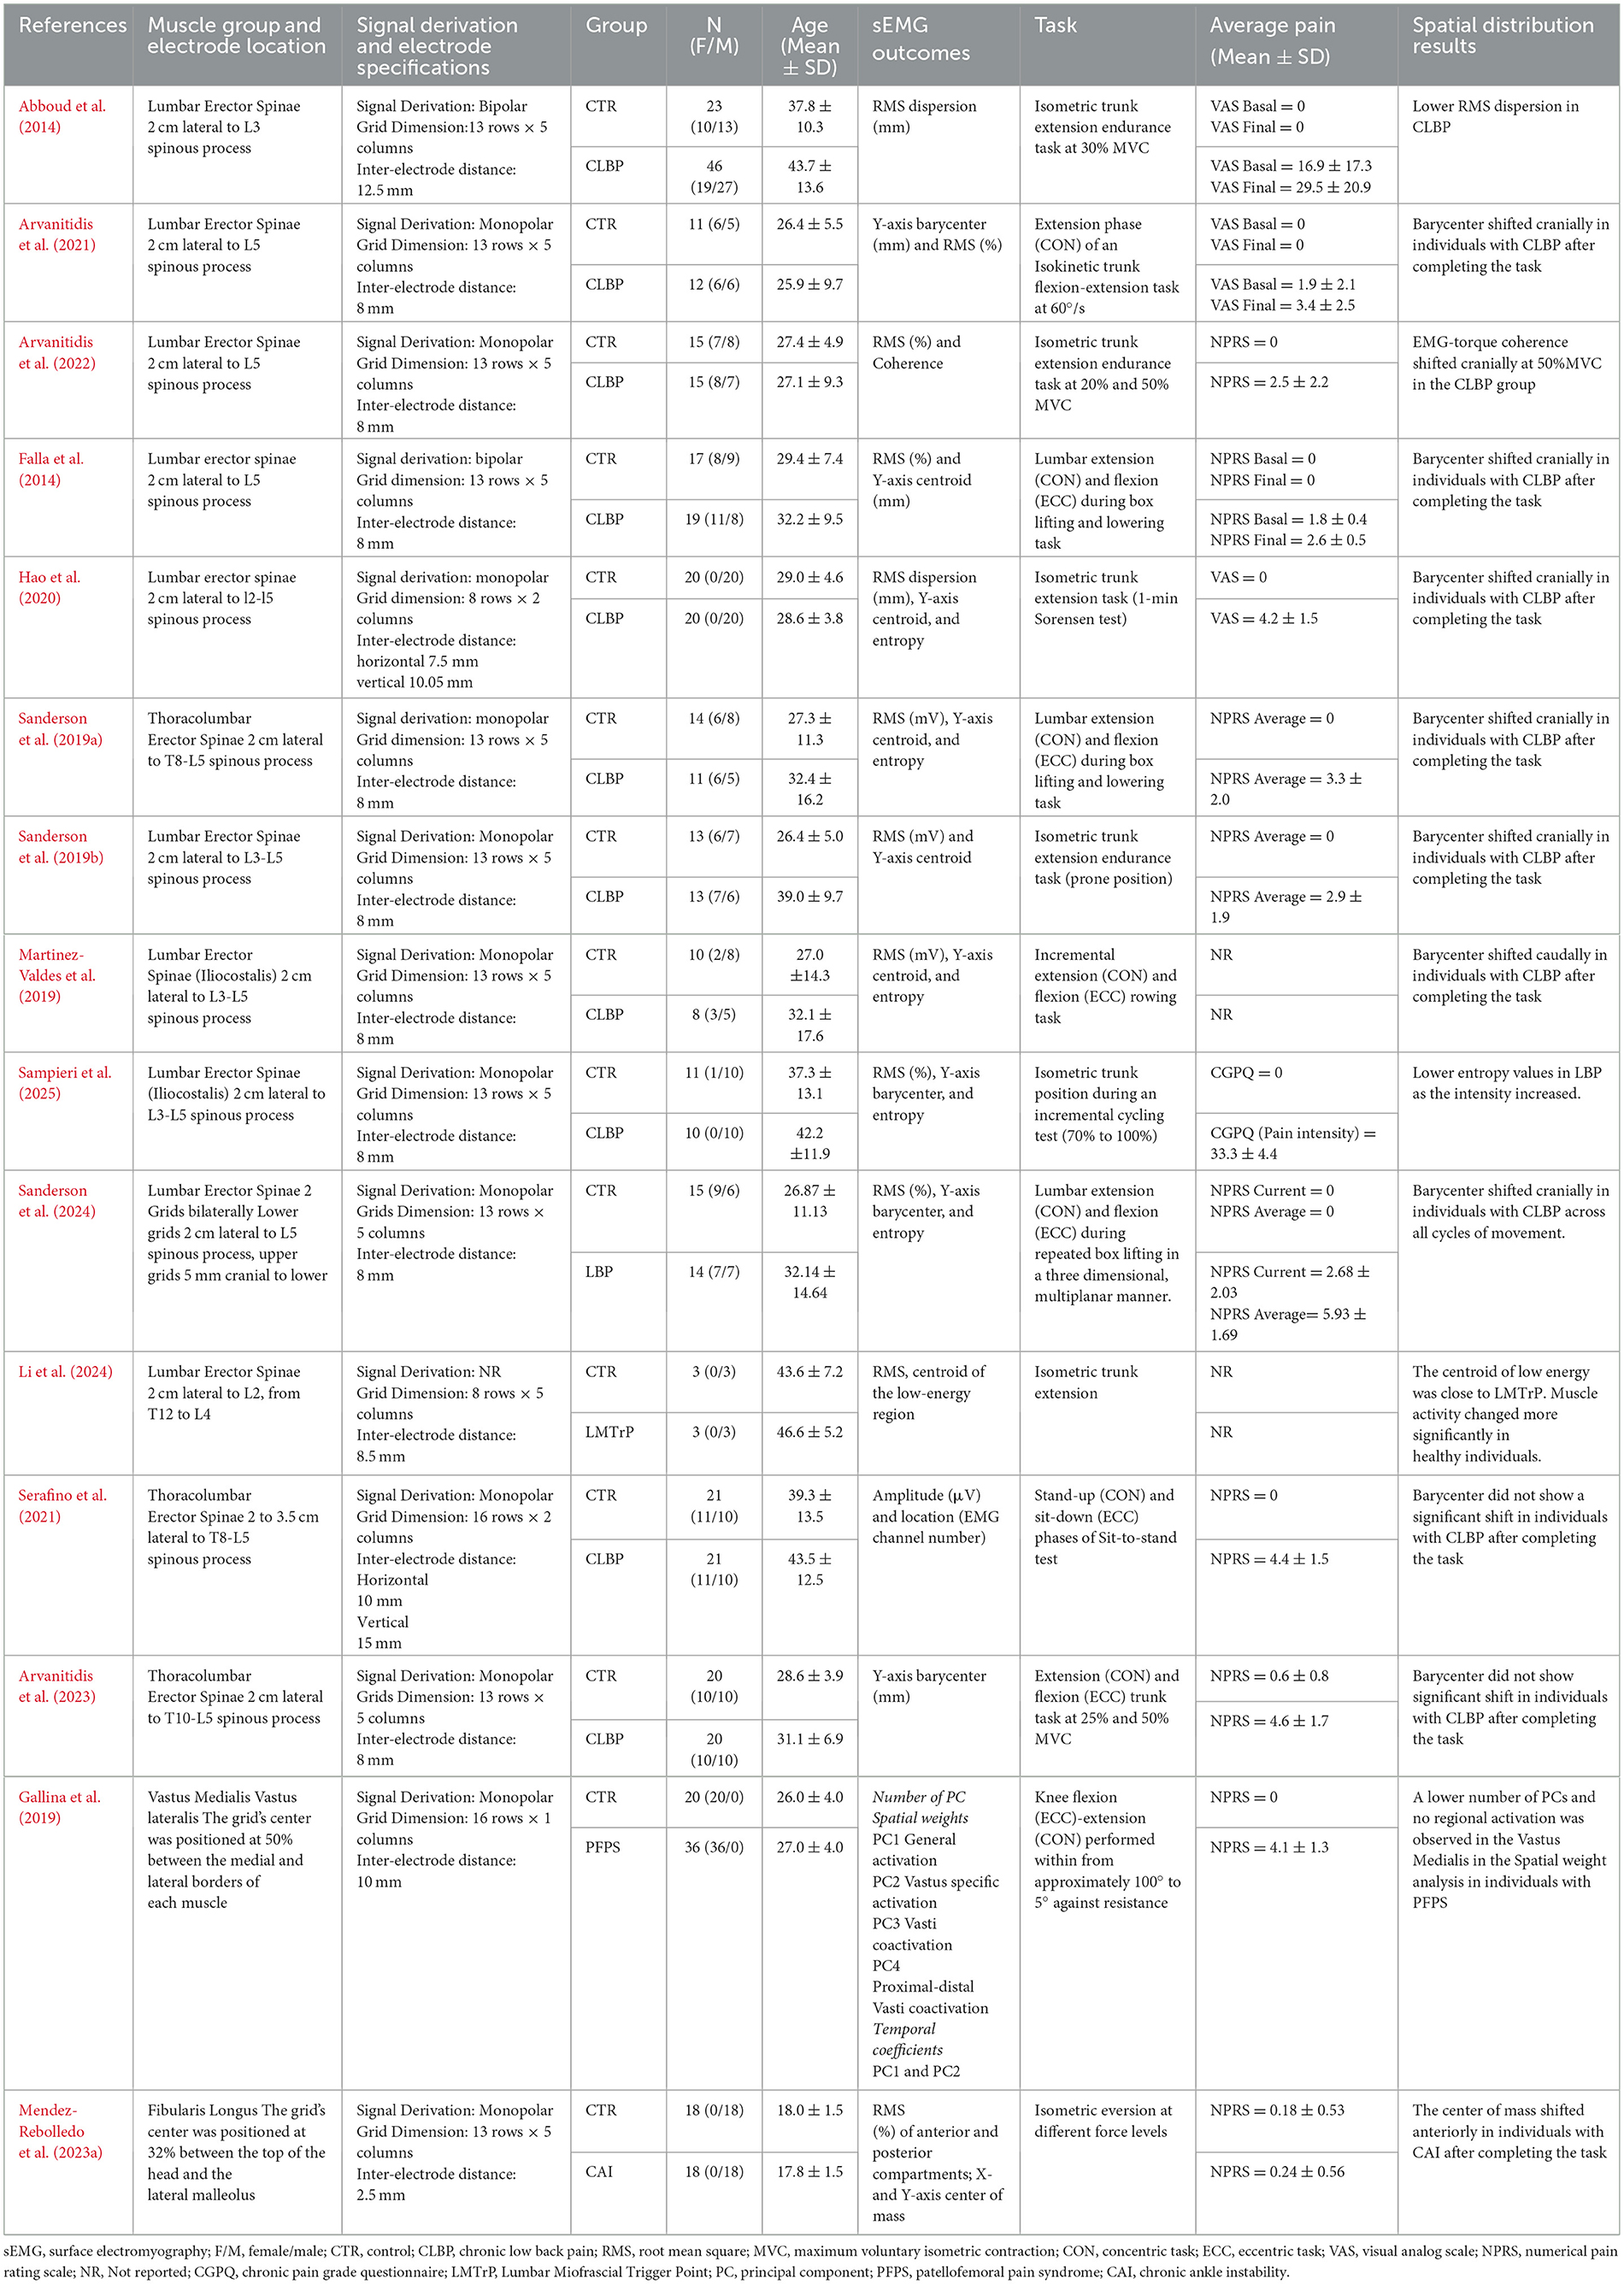
Table 2. Characteristics of the included articles: clinical pain.
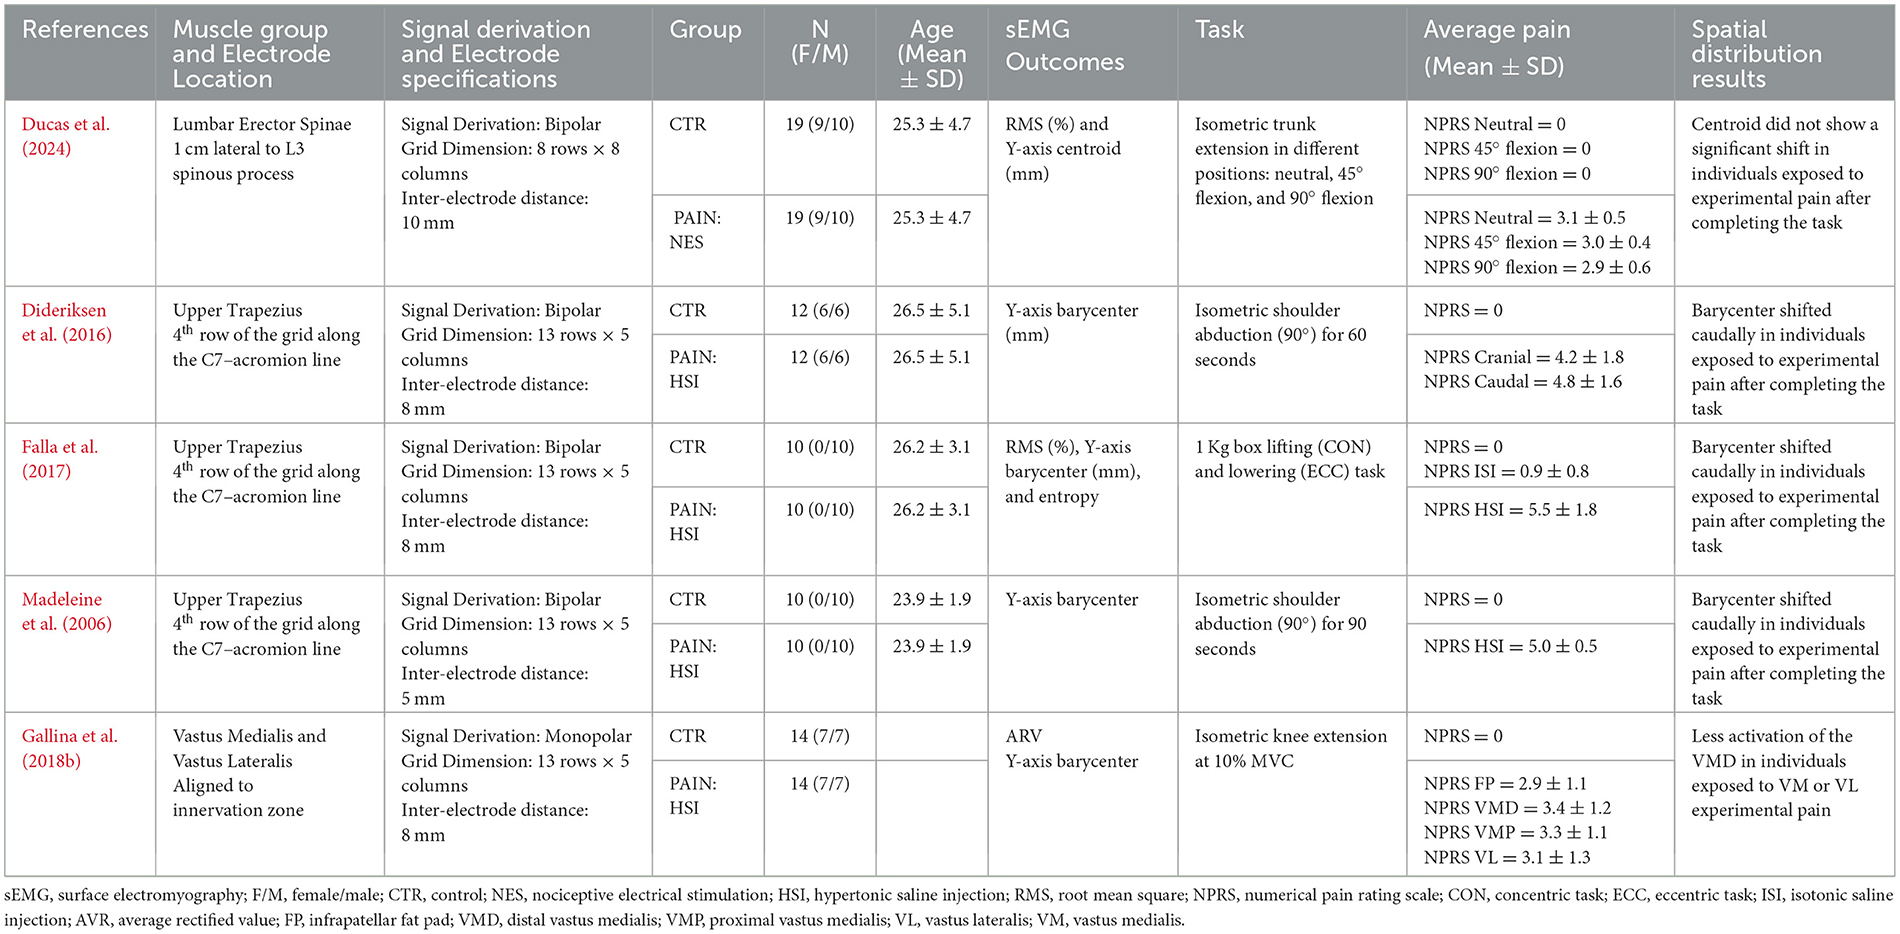
Table 3. Characteristics of included articles: experimental pain.
Regarding the spatial distribution of muscle activity, it was primarily characterized by the displacement of the center of activity (barycenter, center of mass, centroid, or locus) along the cephalocaudal axis (Y-axis) (n = 16) (Madeleine et al., 2006; Falla et al., 2014, 2017; Dideriksen et al., 2016; Gallina et al., 2019; Martinez-Valdes et al., 2019; Sanderson et al., 2019a,b, 2024; Hao et al., 2020; Arvanitidis et al., 2021, 2023; Mendez-Rebolledo et al., 2023a; Ducas et al., 2024; Li et al., 2024; Sampieri et al., 2025). In addition to center-of-activity analyses, several studies included other spatial or signal-based sEMG outcomes. Two studies assessed RMS dispersion (Abboud et al., 2014; Hao et al., 2020), one study performed coherence analysis (Arvanitidis et al., 2022), and one study used principal component analysis (Gallina et al., 2019). Additionally, several studies reported amplitude-based outcomes, including RMS (n = 12) (Falla et al., 2014, 2017; Martinez-Valdes et al., 2019; Sanderson et al., 2019a,b, 2024; Arvanitidis et al., 2021, 2022; Mendez-Rebolledo et al., 2023a; Ducas et al., 2024; Li et al., 2024; Sampieri et al., 2025), microvolts (μV) (n = 1) (Serafino et al., 2021), and ARV (Gallina et al., 2018b). The pain intensity was reported in eighteen articles using the visual analog scale (n = 3) (Abboud et al., 2014; Hao et al., 2020; Arvanitidis et al., 2021), the numerical pain rating scale (n = 14) (Madeleine et al., 2006; Falla et al., 2014, 2017; Dideriksen et al., 2016; Gallina et al., 2018b, 2019; Sanderson et al., 2019a,b, 2024; Serafino et al., 2021; Arvanitidis et al., 2022, 2023; Mendez-Rebolledo et al., 2023a; Ducas et al., 2024), and the chronic pain grade questionnaire (n = 1) (Sampieri et al., 2025). Only two article did not report pain data (Martinez-Valdes et al., 2019; Li et al., 2024). The average pain intensity varied from 1.8–4.43 (numerical pain rating scale, NPRS) in CLBP subjects and from 4.3–5.5 (NPRS) in upper trapezius experimental pain. Control subjects reported a pain value of 0.
3.3 Risk of bias
The evaluation of methodological quality with the adapted Newcastle-Ottawa Scale for cross-sectional studies is shown in Table 4. Three studies presented moderate methodological quality with a total score of 5 stars (Gallina et al., 2019; Mendez-Rebolledo et al., 2023a; Sanderson et al., 2024). The remaining 17 studies presented low methodological quality. All studies included a selected demographic group of participants and only five of them performed a sample size calculation (Arvanitidis et al., 2021, 2022, 2023; Mendez-Rebolledo et al., 2023a; Ducas et al., 2024). Additionally, no study provided information about the response rate of the participants. Ten studies obtained two stars in the item ascertainment of the exposure due to the application of clinical evaluations or validated tools to determine the presence of the clinical pain in the sample (Abboud et al., 2014; Gallina et al., 2019; Martinez-Valdes et al., 2019; Sanderson et al., 2019a,b, 2024; Hao et al., 2020; Serafino et al., 2021; Mendez-Rebolledo et al., 2023a; Sampieri et al., 2025). Regarding the comparability criterion, four studies received a star for including an analysis that addressed potential confounders, such as joint position (Gallina et al., 2018b; Ducas et al., 2024; Sanderson et al., 2024), or for performing multivariate analysis (Gallina et al., 2019). On the other hand, in the outcome items, 15 studies obtained one star in the assessment since they identified the presence of musculoskeletal disorders through a self-reported tool (Abboud et al., 2014; Falla et al., 2014; Gallina et al., 2019; Martinez-Valdes et al., 2019; Sanderson et al., 2019a,b, 2024; Hao et al., 2020; Arvanitidis et al., 2021, 2022, 2023; Serafino et al., 2021; Mendez-Rebolledo et al., 2023a; Li et al., 2024; Sampieri et al., 2025), and four of them were categorized as not applicable because they correspond to studies of experimental pain and not to a diagnosis of clinical pain (Madeleine et al., 2006; Dideriksen et al., 2016; Falla et al., 2017; Ducas et al., 2024). In addition, all studies obtained a star in the statistical analysis item.

Table 4. Adapted Newcastle-Ottawa Scale for cross-sectional studies.
The results of the critical evaluation of studies using sEMG, based on the CEDE checklist (Besomi et al., 2024), are presented in Table 5. Related to the electrode placement section, all of the included studies reported electrode type, muscles evaluated and specified the location of electrodes. Except for three articles (Sanderson et al., 2019a; Hao et al., 2020; Li et al., 2024), all included studies reported the skin preparation procedure, as well as the use and location of the reference electrode. Regarding the electrode characteristics items, all included studies reported the physical configuration of the electrode system, including the type, number, size, and inter-electrode distance, as well as the spatial arrangement of the grids (i.e., 5 × 13, 8 × 8, etc.). Within the items of sEMG signal and its preprocessing section, six studies did not report the signal detection mode (Abboud et al., 2014; Falla et al., 2014, 2017; Dideriksen et al., 2016; Hao et al., 2020; Li et al., 2024). Two of the included studies did not specify the brand and model of the sEMG acquisition system (Hao et al., 2020; Serafino et al., 2021). All included studies specified the gain of amplifier and cut-off frequencies, with the sampling frequency of the sEMG system. All studies reported analog-to-digital resolution and full-scale input range, except for one (Li et al., 2024). Of the total number of studies included, only four did not report the software used for processing the sEMG signal (Martinez-Valdes et al., 2019; Hao et al., 2020; Serafino et al., 2021; Li et al., 2024). Four studies did not report techniques applied for power line interference removal (Hao et al., 2020; Mendez-Rebolledo et al., 2023a; Sanderson et al., 2024; Sampieri et al., 2025). Finally, nine studies used other devices and reported the synchronization with the sEMG system (Gallina et al., 2018b, 2019; Martinez-Valdes et al., 2019; Sanderson et al., 2019a, 2024; Arvanitidis et al., 2021, 2022, 2023; Serafino et al., 2021; Mendez-Rebolledo et al., 2023a; Sampieri et al., 2025). Considering that the design of nine studies did not extract other data at the same time as the sEMG data (Madeleine et al., 2006; Abboud et al., 2014; Falla et al., 2014, 2017; Dideriksen et al., 2016; Sanderson et al., 2019b,a; Hao et al., 2020; Ducas et al., 2024), it was considered that the item of synchronization with other devices did not apply to them.
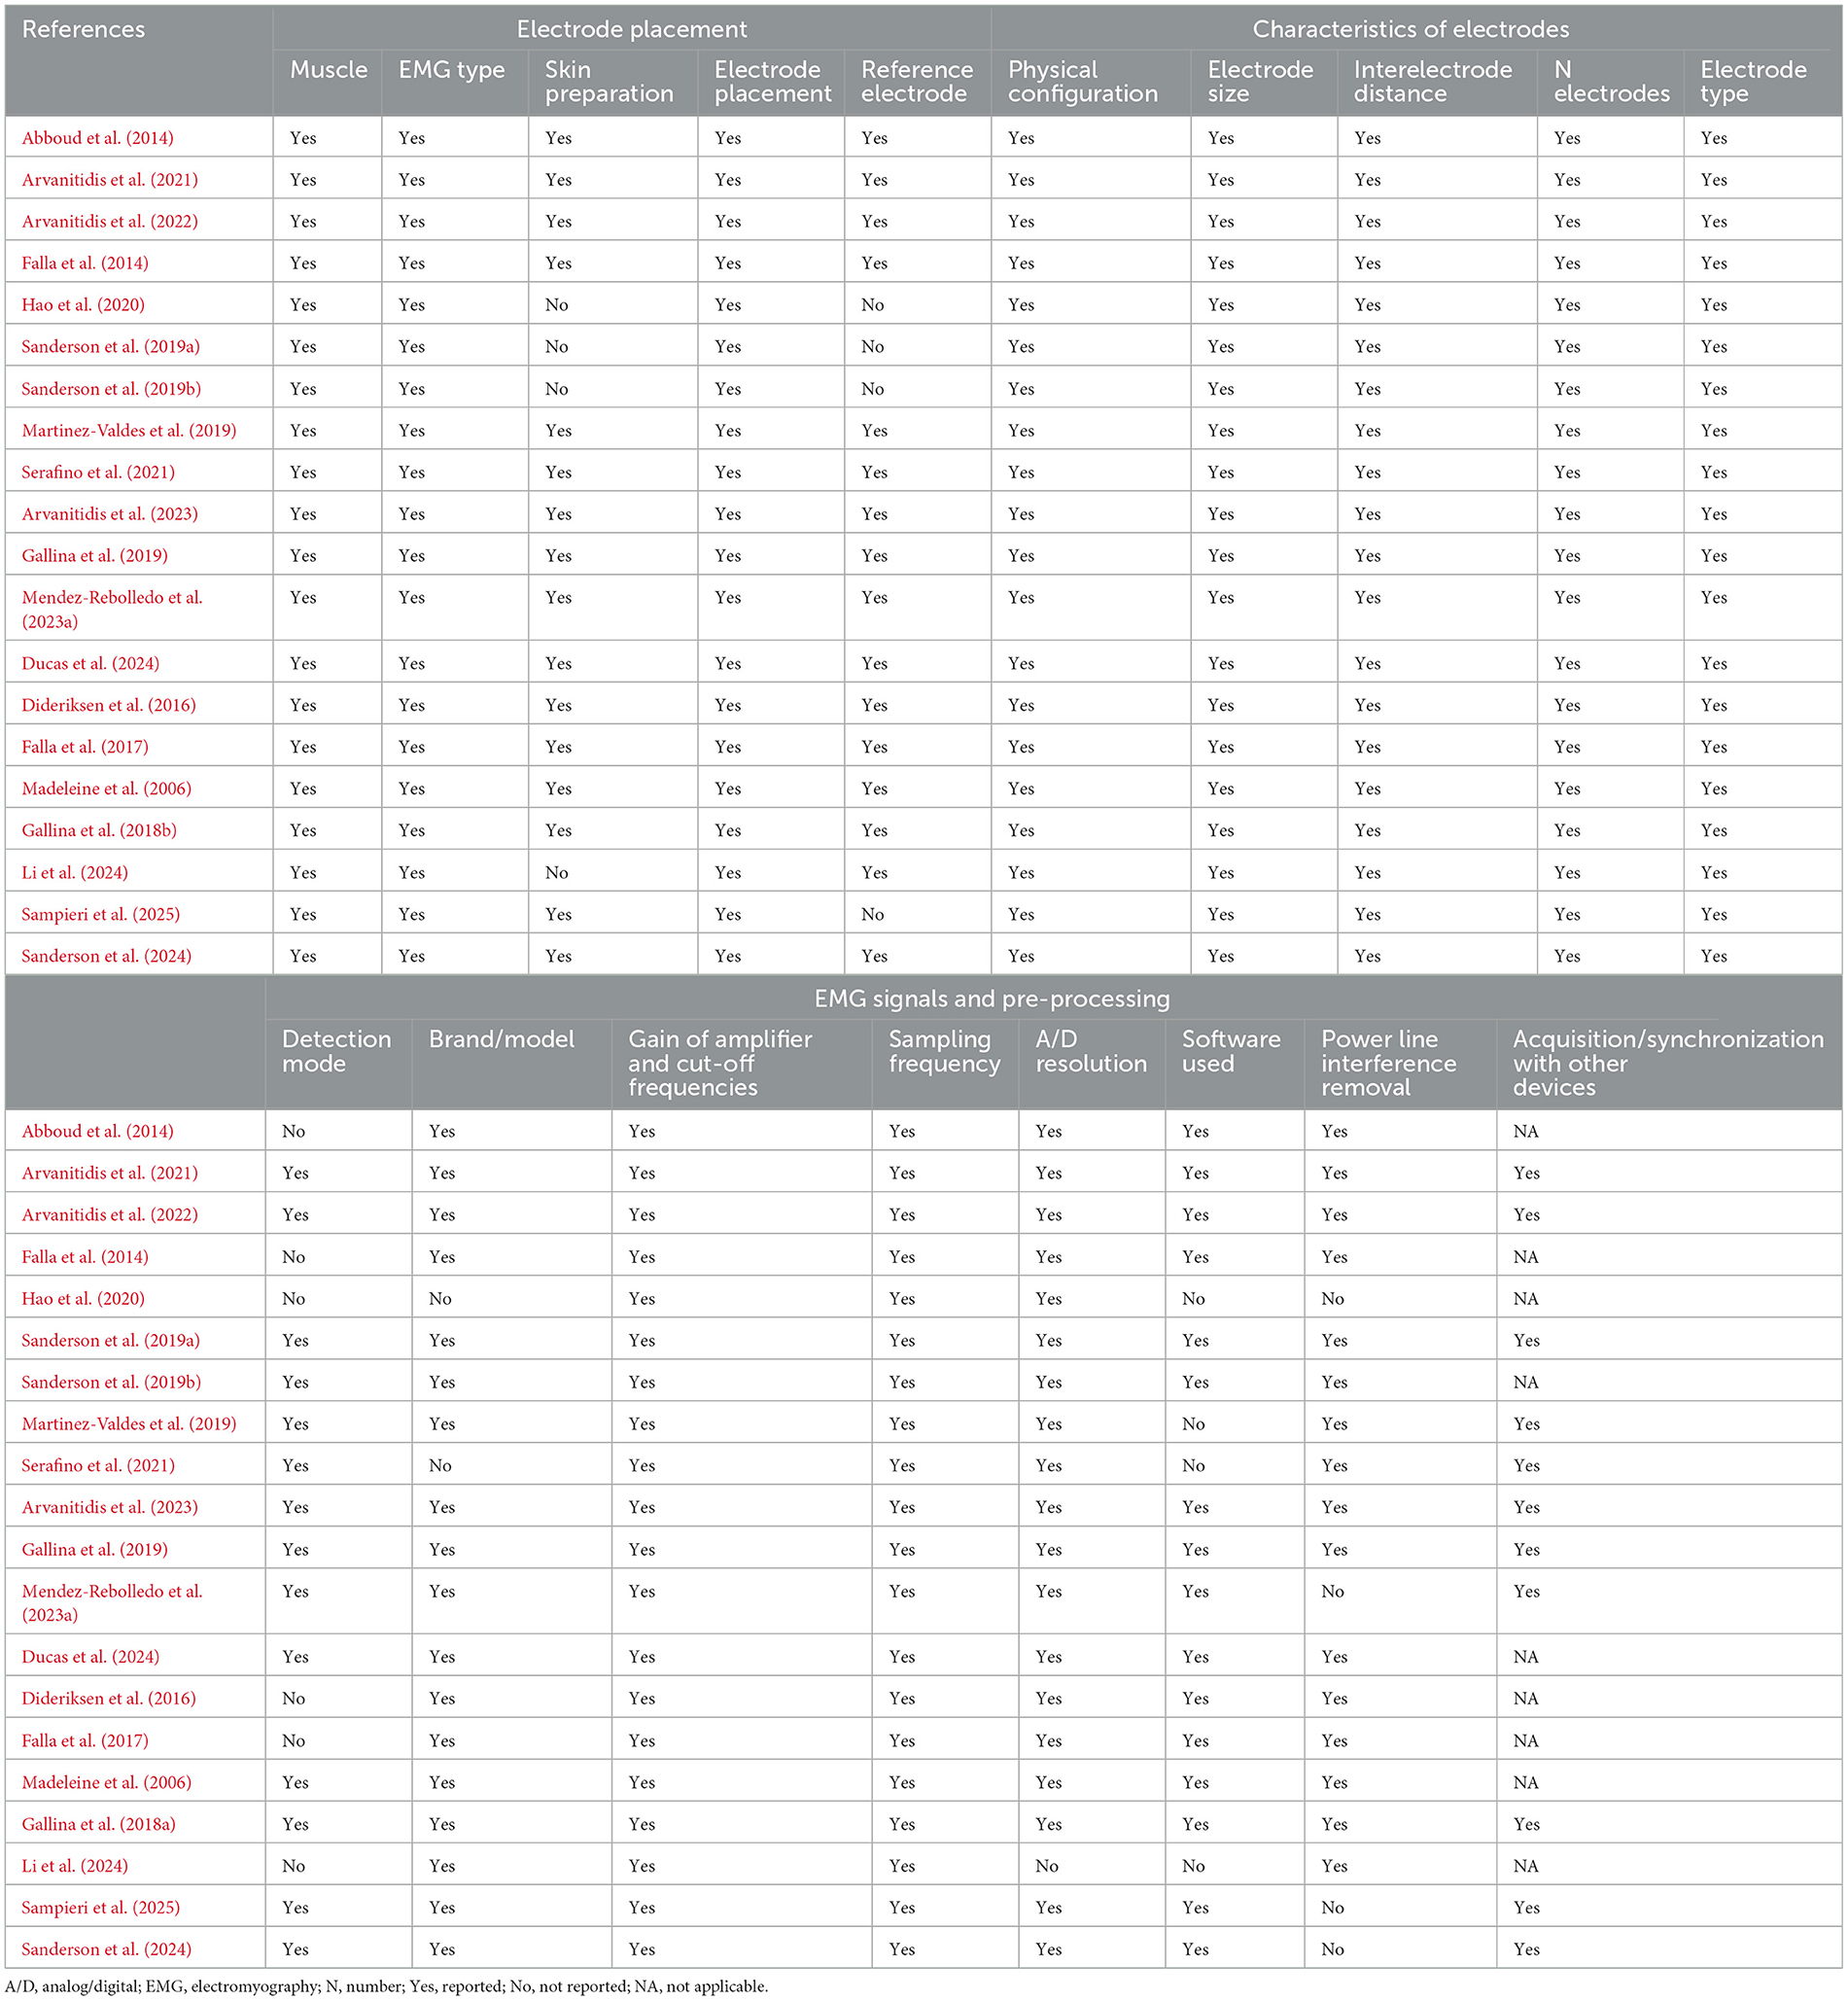
Table 5. Summary of the critical evaluation of studies using electromyography according to the Modified Consensus for Experimental Design in Electromyography (CEDE) checklist.
3.4 Certainty of the evidence
The results of the analyses, including both clinical and experimental pain, indicate a very low certainty of evidence, downgraded due to inconsistency, indirectness, and publication bias, with a moderate effect size. For clinical pain alone, the evidence was similarly downgraded for the same reasons, with a small effect size, as shown in Supplementary Table S2. The results of the analyses including CLBP show very low certainty of evidence and suggest that higher-quality studies are needed to strengthen it, despite the observation of a small effect size.
3.5 Data analysis
3.5.1 Clinical and experimental pain
Of the 20 studies included in the systematic review, 15 provided sufficient quantitative data on center of activity displacement to be included in the combined meta-analysis of clinical and experimental pain. This analysis revealed a statistically significant displacement of the center of activity in individuals with pain compared to asymptomatic controls, with a moderate effect size (n = 28; SMD = 0.62; 95% CI = 0.28 to 0.97; p = 0.0004), although these results showed significant heterogeneity (Tau2 = 0.61; p < 0.00001; I2 = 80%) (Figure 2). Due to the lack of homogeneity in sEMG outcomes and the limited number of available articles, it was not possible to conduct secondary analyses for other clinical conditions (e.g., patellofemoral pain syndrome and chronic ankle instability) or experimental pain.
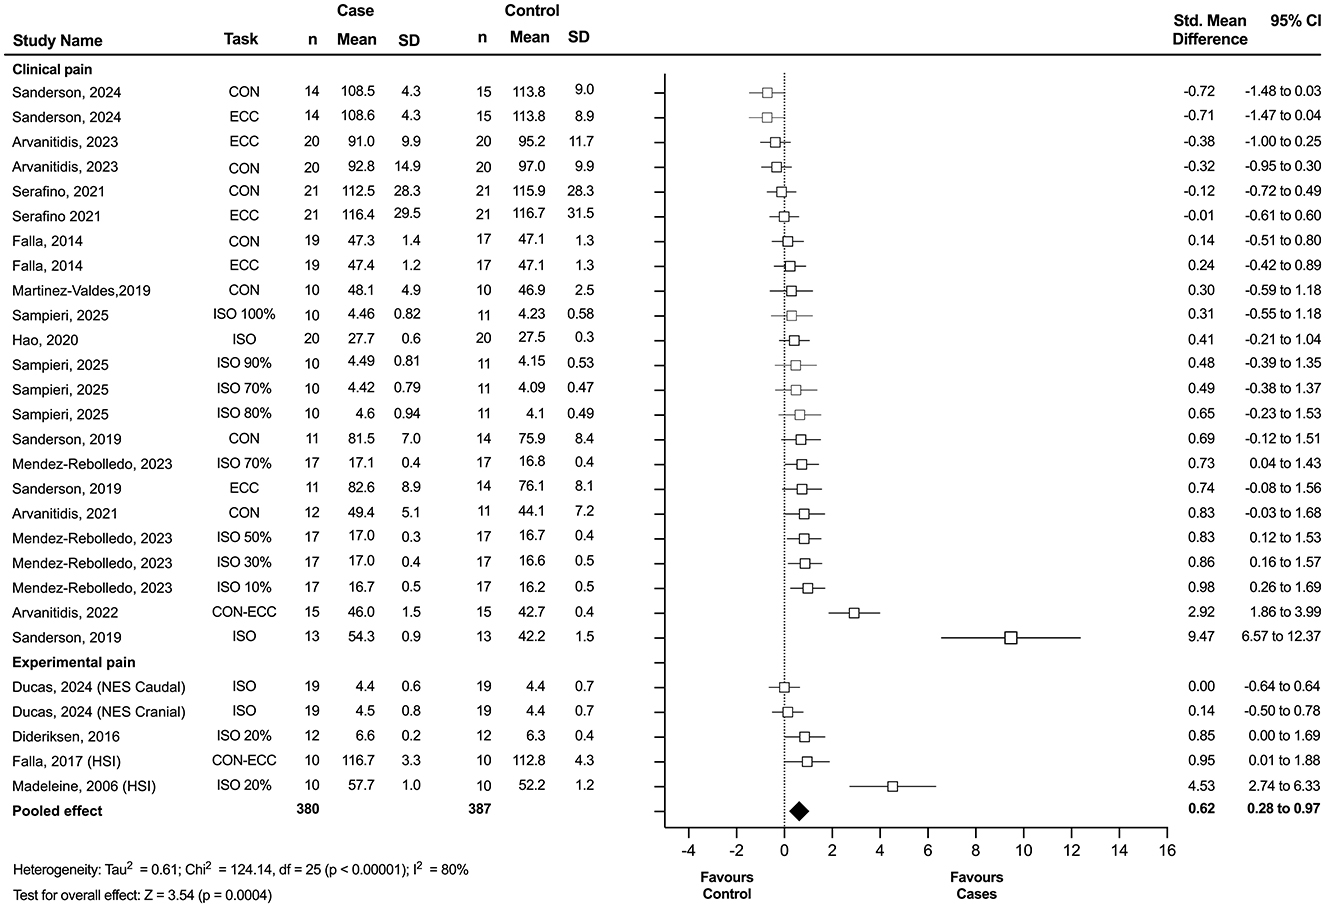
Figure 2. Forest plot showing the displacement of the center of activity for combined experimental and clinical pain. Each study included in the meta-analysis (random-effects model) corresponds to a point estimate with the corresponding 95% confidence interval (CI). The polygon at the bottom of the graph corresponds to the overall effect, and its width represents its 95% CI. Studies with larger squares contributed more to the overall effect size than other studies. Values expressed as percentages represent the relative level of effort with respect to the maximum voluntary contraction. ECC, eccentric task; CON, concentric task; ISO, isometric task; NES, neuromuscular stimulation; HIS, hypertonic saline injection; SD, standard deviation.
3.5.2 Clinical pain
Of the 15 studies included in the meta-analysis, 12 investigated clinical pain populations and were included in the clinical pain analysis. This analysis revealed a statistically significant displacement of the center of activity in individuals with clinical pain compared to asymptomatic controls, with a small effect size (n = 23; SMD = 0.49; 95% CI = 0.15 to 0.84; p = 0.004), although these results showed significant heterogeneity (Tau2 = 0.52; p < 0.00001; I2 = 78%) (Figure 3). Among these, 10 studies specifically examined individuals with CLBP and were included in the subgroup meta-analysis. This secondary analysis also revealed a statistically significant displacement of the center of activity in individuals with CLBP compared to controls, with a small effect size (n = 19; SMD = 0.43; 95% CI = 0.03 to 0.83; p = 0.04), although substantial heterogeneity was observed (Tau2 = 0.60; p < 0.00001; I2 = 80%) (Figure 4). Notably, studies consistently reported a significant redistribution of erector spinae muscle activity toward the cranial region in individuals with CLBP, as indicated by a marked difference in the location of the center of activity relative to control groups.
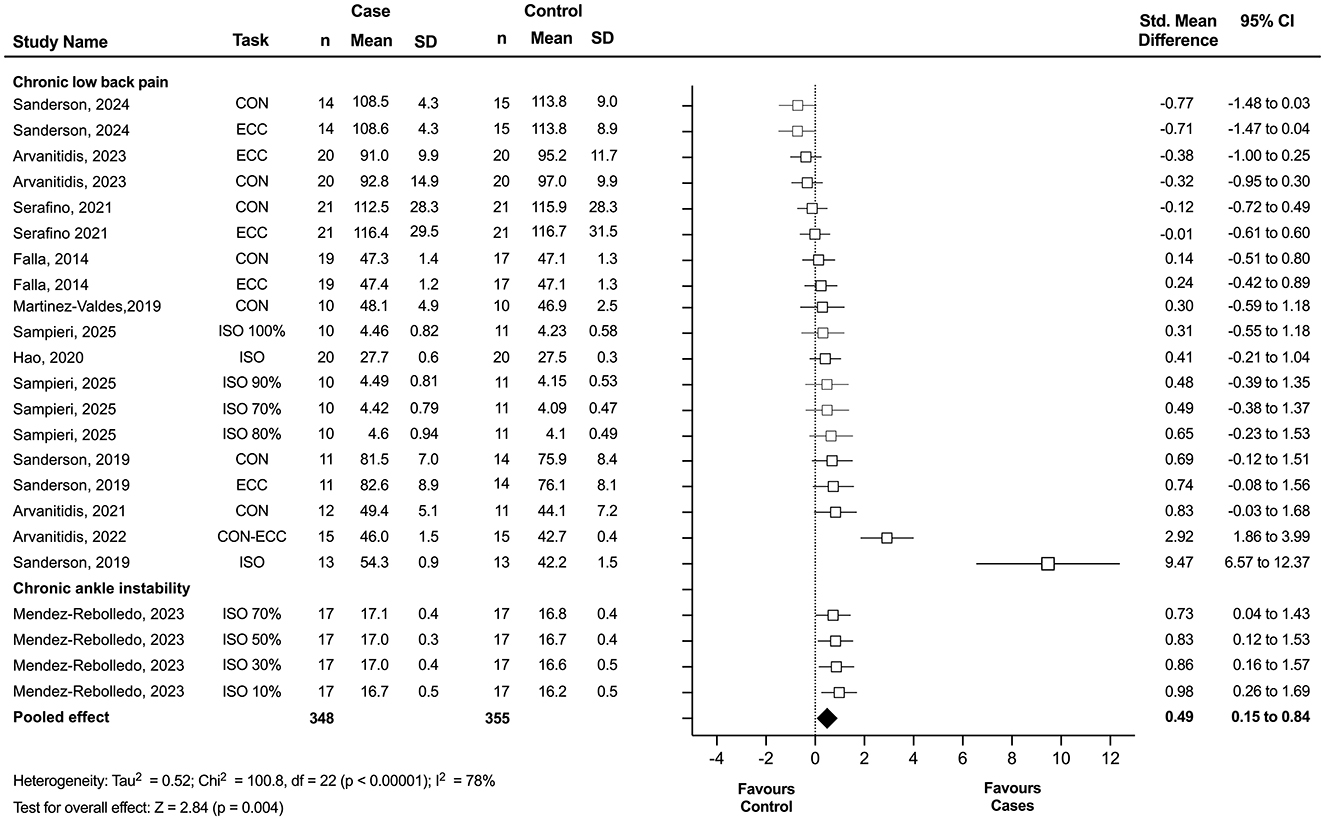
Figure 3. Forest plot showing the displacement of the center of activity for clinical pain. Each study included in the meta-analysis (random-effects model) corresponds to a point estimate with the corresponding 95% confidence interval (CI). The polygon at the bottom of the graph corresponds to the overall effect, and its width represents its 95% CI. Values expressed as percentages represent the relative level of effort with respect to the maximum voluntary contraction. Studies with larger squares contributed more to the overall effect size than other studies. ECC, eccentric task; CON, concentric task; ISO, isometric task; SD, standard deviation.
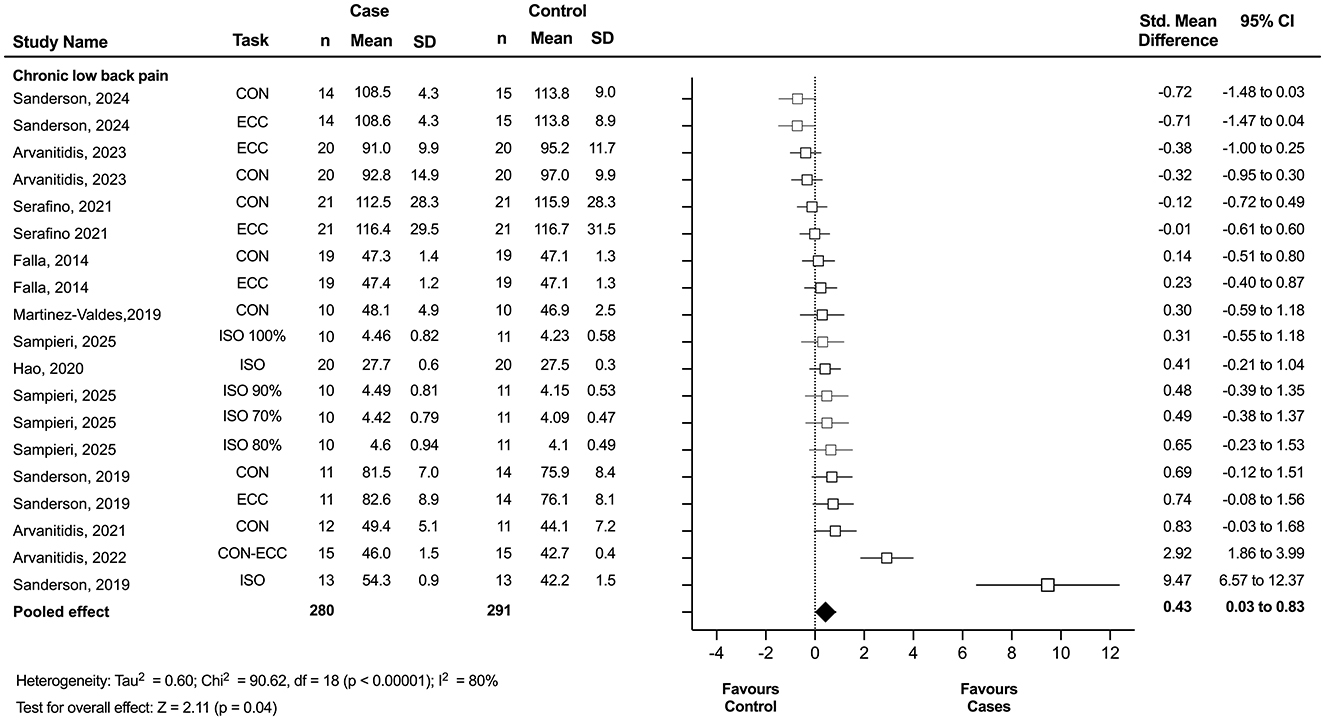
Figure 4. Forest plot showing the displacement of the center of activity for chronic low back pain. Each study included in the meta-analysis (random-effects model) corresponds to a point estimate with the corresponding 95% confidence interval (CI). The polygon at the bottom of the graph corresponds to the overall effect, and its width represents its 95% CI. Values expressed as percentages represent the relative level of effort with respect to the maximum voluntary contraction. Studies with larger squares contributed more to the overall effect size than other studies. ECC, eccentric task; CON, concentric task; ISO, isometric task; SD, standard deviation.
3.5.3 Sensitivity analysis
A sensitivity analysis was conducted by excluding the study with the largest effect size (Sanderson et al., 2019b) in each meta-analysis. The results remained consistent with the main analysis for combined clinical and experimental pain (n = 27; SMD = 0.46; 95% CI = 0.19 to 0.73; p = 0.0008), showing significant heterogeneity (Tau2 = 0.35; p < 0.01; I2 = 70%), and for clinical pain alone (n = 22; SMD = 0.38; 95% CI = 0.11 to 0.65; p = 0.007), also with significant heterogeneity (Tau2 = 0.28; p < 0.01; I2 = 66%). However, for CLBP, the sensitivity analysis revealed no statistically significant effects (n = 18; SMD = 0.27; 95% CI = −0.04 to 0.57; p = 0.09), with significant heterogeneity (Tau2 = 0.29; p < 0.01; I2 = 67%).
4 Discussion
This is the first meta-analysis to synthesize evidence on pain-related changes in the spatial distribution of muscle activity, aiming to provide a more robust and generalizable understanding of how chronic musculoskeletal pain and experimental models may alter neuromuscular activation patterns. The main findings indicate a statistically significant difference in the displacement of the center of activity—that is, the spatial distribution of muscle activity—in individuals with clinical pain, including chronic ankle instability, patellofemoral pain syndrome, and CLBP, observed across concentric, eccentric, and isometric muscle contractions. This difference showed a small effect size but was accompanied by a low certainty of evidence due to inconsistency, indirectness, and publication bias. Additionally, the findings were associated with low methodological quality in sample selection criteria and comparability. However, the evaluation of regional muscle activity in the selected studies adhered to current methodological recommendations for sEMG procedures, with most studies meeting the CEDE criteria for electrode placement and reporting of essential characteristics. These results suggest that alterations in the spatial distribution of muscle activity may reflect adaptive neuromuscular responses to chronic pain, potentially influencing motor control strategies. While the center of activity metric does not directly reveal the underlying mechanisms of such shifts, these spatial changes could inform the development of targeted rehabilitation strategies aimed at restoring more balanced activation patterns.
4.1 Clinical pain influences regional muscle activity
The alterations in regional muscle activation observed in clinical pain models, as highlighted in the findings of this meta-analysis, may be attributed to several neuromuscular mechanisms. The results suggest a redistribution of muscle activity in individuals with CLBP compared to healthy controls, as indicated by differences in the location of the center of activity. However, this finding was not robust in the sensitivity analysis, highlighting the need for additional studies to validate this effect. A key concept underlying the interpretation of spatial shifts in muscle activation is the phenomenon of “non-uniform motor unit recruitment,” which proposes that pain induces a reorganization of activation patterns within a muscle (Hodges and Tucker, 2011; Hodges and Smeets, 2015; Hodges et al., 2021; Hug et al., 2025). Instead of a uniform reduction in activity across the muscle, some motor units may be inhibited while others are facilitated, resulting in altered spatial distribution of activity (Hao et al., 2020; Arvanitidis et al., 2021). For instance, Hug et al. (2025) demonstrated that during experimental muscle pain, inhibitory inputs are not homogeneously distributed among motor units within the same muscle. By analyzing intrasubject variability, they found that some motor units exhibited significant decreases in discharge rate while others remained unchanged or slightly increased, indicating a non-uniform, task-dependent modulation of motor output. This heterogeneity may reflect an adaptive strategy by the nervous system to redistribute load away from sensitized regions while maintaining overall functional performance (Hug et al., 2025). In addition, previous work has proposed that the effective neural drive to the muscle is primarily governed by the common synaptic input received by the motoneuron pool (Farina and Negro, 2015). More recent findings suggest that biomechanical properties of the muscle, such as twitch duration, can influence how these common inputs are transmitted and expressed, implying that spatial shifts in muscle activity may result from both neural and biomechanical factors that shape how motor commands are distributed across the muscle (Cabral et al., 2024). While this review did not examine within-task temporal variation, the observed between-group differences in the location of the center of activity suggest a stable, pain-related reorganization that manifests during a given motor task. This redistribution could serve an adaptive role, potentially minimizing local tissue stress, redistributing load across muscle regions, or compensating for regional fatigue vulnerability in chronic pain populations (Hodges and Tucker, 2011; Hodges and Smeets, 2015; Hodges et al., 2021). However, whether such changes represent protective strategies or maladaptive compensations remains unclear, and further investigation is needed to explore the physiological mechanisms and functional implications of within-task spatial shifts in chronic pain conditions (Hodges and Tucker, 2011; Abboud et al., 2021).
Experimental studies have shown that nociceptive input can reduce motor unit discharge rates while recruiting additional units to maintain force output (Tucker and Hodges, 2009; Martinez-Valdes et al., 2021). While such evidence is based on pre- vs. post-pain comparisons in controlled settings, how these changes translate to within-task recruitment strategies in individuals with chronic pain remains to be fully elucidated. This recruitment strategy may result in a redistribution of muscle activity either within the same muscle or between synergistic muscles, potentially to unload painful regions or optimize force production under altered conditions (Gallina et al., 2018b; Nuccio et al., 2021). In axial muscles, such as the erector spinae, this redistribution may occur without necessarily altering the global force vector but rather reflect spatial shifts in neural drive across portions of large, multifunctional muscle groups (Abboud et al., 2020). In contrast, in peripheral muscles such as the vasti, changes in recruitment may also influence the direction or orientation of the force vector produced by the muscle (Gallina et al., 2018a,b). Similar adaptations have been reported in chronic musculoskeletal disorders such as CLBP, chronic ankle instability, and patellofemoral pain syndrome. Although not all studies used center of activity metrics, changes in muscle activation patterns, based on signal amplitude or spatial distribution, have been interpreted as evidence of intra- or intermuscular redistribution in response to pain or instability (Gallina et al., 2018b; Arvanitidis et al., 2021; Mendez-Rebolledo et al., 2023a, 2025).
Our meta-analysis revealed a significant redistribution of erector spinae muscle activity toward cranial regions in individuals with CLBP, as indicated by a marked difference in the center of activity location compared to control groups. During isometric and dynamic tasks, the center of activity in people with CLBP tends to shift toward the upper part of the lumbar spine (Sanderson et al., 2019b; Hao et al., 2020; Arvanitidis et al., 2021). This cranial shift may reflect a strategy to adopt a more favorable position for posture control and spinal stabilization, suggesting an effort by the nervous system to shift the load away from potentially affected regions of the lower back. Additionally, previous research has proposed a redistribution of muscle activity from deep to superficial layers of the erector spinae as a strategy to reduce load on injured structures, albeit at the expense of reduced efficiency in spinal stabilization. However, given that HD-sEMG primarily captures superficial muscle activity, such deep-to-superficial shifts are unlikely to be directly reflected in the center of activity measure (Van Dieën et al., 2019; Abboud et al., 2021). This change may be counterproductive in the long term, as excessive activation of superficial and cranial muscle parts can lead to fatigue, deterioration of force steadiness, and alteration of postural control, potentially further aggravating the CLBP condition (Hodges and Tucker, 2011; Arvanitidis et al., 2022). The reorganization of motor recruitment in this case could not only reduce pain but also alter movement dynamics, affecting posture and global motor control (Serafino et al., 2021).
The nature of the motor task also plays a crucial role in these alterations. Tasks that require dynamic movements, different contraction speeds, or prolonged static postures (e.g., isometric contraction) can exacerbate or reveal different activation patterns due to varying demands on the musculoskeletal system (Martinez-Valdes et al., 2021; Arvanitidis et al., 2023; Cruz-Montecinos et al., 2025). For example, in dynamic tasks such as rowing, a caudal shift in the activity of the erector spinae has been reported (Martinez-Valdes et al., 2019). In isometric resistance tasks, fatigue may induce a shift of the center of activity toward more cranial regions, potentially reflecting a strategy by the nervous system to redistribute activation and delay fatigue in areas affected by pain (Hao et al., 2020; Abboud et al., 2021). Additionally, pain induces changes in motor performance, motor unit recruitment, and rate coding behavior that vary across different contraction speeds (Martinez-Valdes et al., 2021). Notably, at higher contraction speeds, the inhibitory effect of pain on lower-threshold motor units is compensated by increased recruitment of higher-threshold motor units, allowing fast submaximal contractions to be maintained. Conversely, at slower speeds, pain reduces motor unit discharge rates and prolongs the neuromechanical delay, which could increase the risk of overload in other muscle regions or adjacent muscles, potentially leading to exacerbation of pain or new injuries.
4.2 Experimental pain and regional muscle activity
Although a secondary analysis specifically on experimental pain and its implications for regional muscle activation was not possible, the systematic review of the evidence revealed some key observations. The data suggest that in certain muscle groups, particularly the upper trapezius, there is a caudal shift of the center of activity following pain application by hypertonic saline injection (Madeleine et al., 2006; Falla et al., 2017). However, this redistribution of muscle activity was not observed across all muscle groups. For instance, a caudal shift in the center of activity of the erector spinae muscles was reported in only one study (Dideriksen et al., 2016), and no redistribution was observed in the vastus medialis and lateralis muscles (Gallina et al., 2018b). This suggests that the response may be muscle-specific and influenced by factors such as the nature of the task and the intensity of the painful stimulus (Ducas et al., 2024).
The difference in the shift of the center of activity between experimental and clinical pain models may be attributed to the nature and duration of the painful stimulus. Experimental pain, typically induced acutely by hypertonic saline injections, produces a strong and immediate pain response (Izumi et al., 2014; Christensen et al., 2022; Graven-Nielsen, 2022). In the erector spinae, this acute stimulus may elicit a protective neuromuscular response that shifts muscle activation away from the localized painful region. This has been associated with a caudal shift in activation within the muscle, interpreted as an effort to redistribute loading while maintaining spinal stability. This response could serve as a short-term strategy to minimize discomfort and prevent further irritation during sustained or intense contractions. In contrast, clinical pain, which is often chronic and persistent, likely induces distinct neuromuscular adaptations over time. In conditions such as CLBP, evidence suggests a cranial shift in the activation of the erector spinae muscles. This shift may represent a compensatory mechanism in response to the overload and fatigue that the erector spinae muscles initially endured during the onset of this condition. Holtermann et al. (2011) supports this idea by showing that pain intensity is closely related to the inability to evenly distribute muscle activity in the upper trapezius. The high intensity of pain induced by hypertonic saline in experimental models may contribute to the observed caudal shift in muscle activity in this group.
4.3 Clinical implications
This review suggests that individuals with clinical and experimental pain exhibit altered spatial distribution of muscle activity, reflecting potential maladaptive neuromuscular responses to chronic pain. While the clinical implications of these spatial shifts require further investigation, current evidence supports the integration of HD-sEMG as both an assessment and interventional tool in neuromuscular rehabilitation. These findings underscore the need for targeted rehabilitation strategies to promote more effective motor control. Unlike conventional bipolar EMG, HD-sEMG provides a detailed topography of muscle activity, enabling clinicians to detect regional imbalances and monitor neuromuscular adaptations with high spatial precision. This capability is particularly relevant in conditions such as chronic ankle instability, patellofemoral pain, and chronic low back pain, where alterations in motor unit recruitment contribute to recurrent symptoms and functional impairments. Recent studies have demonstrated the utility of HD-sEMG-based biofeedback for retraining the spatial distribution of muscle activity. For instance, Mendez-Rebolledo et al. (2025) used HD-sEMG maps to provide real-time feedback to individuals with CAI, promoting the activation of the under-recruited posterior region of the fibularis longus and restoring a more physiological distribution pattern (Mendez-Rebolledo et al., 2025). Similarly, Arvanitidis et al. (2019) showed that healthy subjects could volitionally modulate the barycenter of trapezius activation using spatial feedback, maintaining a caudal shift in the spatial distribution of muscle activity even under fatigue, highlighting its robustness and applicability during sustained contractions (Arvanitidis et al., 2019). Extending this paradigm, Gazzoni and Cerone (2021) introduced an augmented reality system that projects HD-sEMG-based activity maps directly onto the skin surface via smart-glasses or mobile devices. This immersive visualization allows both patients and clinicians to monitor and adjust muscle activation in real time, improving motor learning through embodied feedback (Gazzoni and Cerone, 2021). In proof-of-concept applications involving lumbar and fibular muscles, this approach revealed asymmetric or maladaptive patterns that were not visible with traditional displays. Collectively, these findings underscore HD-sEMG's potential to guide personalized rehabilitation strategies, enhance patient engagement through intuitive feedback, and objectively quantify progress. Future research should expand beyond observational studies and integrate HD-sEMG with complementary methodologies, such as motor unit decomposition and elastography, to better elucidate the underlying neuromechanical mechanisms. In parallel, testing these approaches across a broader range of clinical conditions (e.g., rotator cuff disorders, cervical pain syndromes, postoperative recovery) and functional contexts (e.g., gait, dual-task balance, or fatigue-inducing tasks) may inform the development of targeted interventions addressing both spatial activation deficits and their functional consequences.
5 Limitations and strengths
This study has several limitations that impact the certainty and generalizability of the findings. The combination of small sample sizes and participant variability likely introduced inconsistencies that mask the true nature of neuromuscular adaptations to chronic pain. Additionally, the methodological quality, as assessed by the adapted Newcastle-Ottawa Scale, was generally low, with only three studies achieving moderate quality. The indirectness of evidence, stemming from differences in experimental setups, pain models, and the limited number of muscles investigated, complicates the interpretation of the findings and raises concerns about their applicability across different populations and conditions. Physiologically, motor unit recruitment and muscle activation mechanisms in response to pain may vary depending on the specific chronic condition or muscle group involved, leading to distinct patterns of adaptation that were not fully captured in this meta-analysis. For instance, although a shift in the center of activity was observed in individuals with CLBP, sensitivity analysis indicated that this finding may not be robust. In contrast, for other conditions such as chronic ankle instability or patellofemoral pain syndrome, the limited number of studies prevented firm conclusions regarding the presence or direction of any consistent shift, likely due to their unique biomechanical and functional characteristics. Lastly, although the center of activity offers a convenient, centroid-based summary of the HD-sEMG map, it reduces complex two-dimensional information to two coordinates and is sensitive to several non-physiological factors—including electrode migration relative to the muscle belly, subcutaneous tissue deformation, cross-talk from adjacent or deeper muscles, and movement-related or cardiovascular artifacts, particularly in paraspinal recordings. In addition to these sources of variability, the configuration of signal derivation (monopolar vs. bipolar) also plays a critical role in shaping the spatial representation of muscle activity. Monopolar recordings, commonly used in the included studies, are preferred for estimating spatial distribution and calculating features like the center of activity, as they preserve the integrity of the activation map (Gallina et al., 2022). In contrast, bipolar derivations reduce cross-talk but distort spatial representations by computing differences between adjacent electrodes, leading to lower resolution and misrepresentation of activation shifts. Standardizing monopolar configurations is essential to ensure reliable comparisons across studies.
A further conceptual consideration is the interpretation of spatial distribution of muscle activity. Spatial complexity and displacement of the center of activity represent different but complementary aspects of neuromuscular control. Studies using principal component analysis have shown that people with chronic musculoskeletal pain may present reduced spatial complexity, reflecting a limited diversity of muscle activation patterns (Staudenmann et al., 2014; Gallina et al., 2019). In contrast, displacement of the center of activity indicates a shift in the overall location of muscle activation across the electrode grid. Depending on the context, this shift may reflect either an adaptive redistribution of activity to protect sensitive areas, or a maladaptive response associated with impaired motor control. While spatial complexity captures the variability and richness of muscle recruitment strategies, the center of activity reflects how these patterns are reorganized within the muscle. Therefore, a shift in the center of activity does not contradict reduced spatial complexity but instead highlights a complementary dimension of spatial adaptation of muscle activity.
A key strength of this review lies in its rigorous application of the CEDE checklist, which ensured methodological consistency in sEMG procedures, including electrode placement, configuration, and signal reporting. This promotes the reproducibility and reliability of the included data. However, since the study's conclusions are based on the center of activity, a simplified spatial summary metric, it is important to interpret findings cautiously. This measure does not directly reveal the neuromuscular mechanisms driving spatial shifts, which may also be influenced by factors beyond pain. For instance, variations in muscle fatigability between clinical and control groups could affect motor unit recruitment or firing rates, contributing to observed shifts. In the erector spinae, signals from fiber ends in lower lumbar areas (e.g., L3 or below) may generate non-propagating potentials that distort spatial estimates. To better understand pain-related adaptations, future studies should incorporate complementary methods, such as motor unit decomposition, to clarify the physiological sources of these spatial changes.
6 Conclusions
This systematic review and meta-analysis demonstrates that individuals with clinical pain, particularly CLBP, exhibit altered spatial distributions of muscle activity, as quantified by shifts in the center of activity. These findings support the hypothesis that neuromuscular adaptations may occur in the presence of chronic pain. However, it remains unclear whether these adaptations are exclusively pain-induced, as pre-existing differences in muscle fatigability, motor unit recruitment capacity, or muscle fiber characteristics may also contribute to the observed patterns. Therefore, spatial variation in muscle activity should be considered a relevant, but not isolated, component in the evaluation and management of chronic pain conditions. Although methodological variability limited the certainty of evidence, most studies adhered to rigorous sEMG guidelines, enhancing the reliability of the extracted data. Future research should incorporate standardized physiological assessments and complementary techniques, ideally within longitudinal or prospective study designs, to better isolate the influence of pain from pre-existing conditions and other contributing factors.
Data availability statement
The raw data supporting the conclusions of this article will be made available by the authors, without undue reservation.
Author contributions
GM-R: Validation, Project administration, Data curation, Formal analysis, Supervision, Visualization, Methodology, Conceptualization, Funding acquisition, Writing – review & editing, Investigation, Resources, Writing – original draft. IO-C: Investigation, Validation, Methodology, Formal analysis, Supervision, Writing – review & editing, Visualization, Conceptualization, Writing – original draft. JS-M: Validation, Formal analysis, Visualization, Writing – original draft, Data curation, Investigation, Writing – review & editing, Software, Methodology. JM-V: Writing – review & editing, Methodology, Validation, Investigation, Writing – original draft, Visualization, Data curation. EM-V: Visualization, Validation, Methodology, Writing – review & editing, Investigation, Conceptualization, Writing – original draft, Supervision.
Funding
The author(s) declare that financial support was received for the research and/or publication of this article. Eduardo Martinez-Valdes was supported by an Orthopaedic Research UK Early Career Research Fellowship (ORUK ref-574).
Conflict of interest
The authors declare that the research was conducted in the absence of any commercial or financial relationships that could be construed as a potential conflict of interest.
Generative AI statement
The author(s) declare that no Gen AI was used in the creation of this manuscript.
Publisher's note
All claims expressed in this article are solely those of the authors and do not necessarily represent those of their affiliated organizations, or those of the publisher, the editors and the reviewers. Any product that may be evaluated in this article, or claim that may be made by its manufacturer, is not guaranteed or endorsed by the publisher.
Supplementary material
The Supplementary Material for this article can be found online at: https://www.frontiersin.org/articles/10.3389/fnhum.2025.1603807/full#supplementary-material
References
Abboud, J., Kuo, C., Descarreaux, M., and Blouin, J. (2020). Regional activation in the human longissimus thoracis pars lumborum muscle. J. Physiol. 598, 347–359. doi: 10.1113/JP278260
Abboud, J., Lessard, A., and Descarreaux, M. (2021). Superficial lumbar muscle recruitment strategies to control the trunk with delayed-onset muscle soreness. Eur. J. Appl. Physiol. 121, 2573–2583. doi: 10.1007/s00421-021-04732-2
Abboud, J., Nougarou, F., Pagé, I., Cantin, V., Massicotte, D., and Descarreaux, M. (2014). Trunk motor variability in patients with non-specific chronic low back pain. Eur. J. Appl. Physiol. 114, 2645–2654. doi: 10.1007/s00421-014-2985-8
Anzures-Cabrera, J., Sarpatwari, A., and Higgins, J. P. (2011). Expressing findings from meta-analyses of continuous outcomes in terms of risks. Stat. Med. 30, 2967–2985. doi: 10.1002/sim.4298
Arvanitidis, M., Bikinis, N., Petrakis, S., Gkioka, A., Tsimpolis, D., Falla, D., et al. (2021). Spatial distribution of lumbar erector spinae muscle activity in individuals with and without chronic low back pain during a dynamic isokinetic fatiguing task. Clin. Biomech. 81:105214. doi: 10.1016/j.clinbiomech.2020.105214
Arvanitidis, M., Falla, D., and Martinez-Valdes, E. (2019). Can visual feedback on upper trapezius high-density surface electromyography increase time to task failure of an endurance task? J. Electromyogr. Kinesiol. 49:102361. doi: 10.1016/j.jelekin.2019.102361
Arvanitidis, M., Jiménez-Grande, D., Haouidji-Javaux, N., Falla, D., and Martinez-Valdes, E. (2022). People with chronic low back pain display spatial alterations in high-density surface EMG-torque oscillations. Sci. Rep. 12:15178. doi: 10.1038/s41598-022-19516-7
Arvanitidis, M., Jiménez-Grande, D., Haouidji-Javaux, N., Falla, D., and Martinez-Valdes, E. (2023). Low-back pain-induced dynamic trunk muscle control impairments are associated with altered spatial EMG-torque relationships. Med. Sci. Sports Exer. 56, 193–208. doi: 10.1249/MSS.0000000000003314
Behnke, A. L., Parola, L. R., Karamchedu, N. P., Badger, G. J., Fleming, B. C., and Beveridge, J. E. (2021). Neuromuscular function in anterior cruciate ligament reconstructed patients at long-term follow-up. Clin. Biomech. 81:105231. doi: 10.1016/j.clinbiomech.2020.105231
Besomi, M., Devecchi, V., Falla, D., McGill, K., Kiernan, M. C., Merletti, R., et al. (2024). Consensus for experimental design in electromyography (CEDE) project: checklist for reporting and critically appraising studies using EMG (CEDE-Check). J. Electromyogr. Kinesiol. 76:102874. doi: 10.1016/j.jelekin.2024.102874
Besomi, M., Hodges, P. W., Clancy, E. A., Van Dieën, J., Hug, F., Lowery, M., et al. (2020). Consensus for experimental design in electromyography (CEDE) project: amplitude normalization matrix. J. Electromyogr. Kinesiol. 53:102438. doi: 10.1016/j.jelekin.2020.102438
Borenstein, M., Hedges, L. V., Higgins, J. P. T., and Rothstein, H. R. (2010). A basic introduction to fixed-effect and random-effects models for meta-analysis. Res. Synth. Method 1, 97–111. doi: 10.1002/jrsm.12
Cabral, H. V., de Souza, L. M. L., Oliveira, L. F., and Vieira, T. M. (2022). Non-uniform excitation of the pectoralis major muscle during flat and inclined bench press exercises. Scandinavian Med. Sci. Sports 32, 381–390. doi: 10.1111/sms.14082
Cabral, H. V., Inglis, J. G., Cudicio, A., Cogliati, M., Orizio, C., Yavuz, U. S., et al. (2024). Muscle contractile properties directly influence shared synaptic inputs to spinal motor neurons. J. Physiol. 602, 2855–2872. doi: 10.1113/JP286078
Chia, L., Silva, D. D. O., Whalan, M., McKay, M. J., Sullivan, J., Fuller, C. W., et al. (2022). Epidemiology of gradual-onset knee injuries in team ball-sports: a systematic review with meta-analysis of prevalence, incidence, and burden by sex, sport, age, and participation level. J. Sci. Med. Sport 25, 834–844. doi: 10.1016/j.jsams.2022.08.016
Christensen, S. W. M., Elgueta-Cancino, E., Simonsen, M. B., Silva, P. D. B., Sørensen, L. B., Graven-Nielsen, T., et al. (2022). Effect of prolonged experimental neck pain on exercise-induced hypoalgesia. Pain 163, 2411–2420. doi: 10.1097/j.pain.0000000000002641
Claus, A. P., Hides, J. A., Moseley, G. L., and Hodges, P. W. (2018). Different ways to balance the spine in sitting: Muscle activity in specific postures differs between individuals with and without a history of back pain in sitting. Clin. Biomech. 52, 25–32. doi: 10.1016/j.clinbiomech.2018.01.003
Cruz-Montecinos, C., Sanzana-Cuche, R., and Mendez-Rebolledo, G. (2025). Regional muscle fiber conduction velocity of the fibularis longus in individuals with chronic ankle instability. J. Anatomy 17:joa.14244. doi: 10.1111/joa.14244
Deeks, J., Higgins, J., and Altman, D. (2021). “Chapter 10: analysing data and undertaking meta-analyses,” in Cochrane Handbook for Systematic Reviews of Interventions version 6.2, eds. J. P. T. Higgins, J. Thomas, J. Chandler, M. Cumpston, T. Li, M. J. Page, V. A. Welch (London: Cochrane).
Dekkers, O. M., Vandenbroucke, J. P., Cevallos, M., Renehan, A. G., Altman, D. G., and Egger, M. (2019). COSMOS-E: Guidance on conducting systematic reviews and meta-analyses of observational studies of etiology. PLoS Med. 16:e1002742. doi: 10.1371/journal.pmed.1002742
Dernoncourt, F., Avrillon, S., Logtens, T., Cattagni, T., Farina, D., and Hug, F. (2025). Flexible control of motor units: is the multidimensionality of motor unit manifolds a sufficient condition? J. Physiol. 603, 2349–2368. doi: 10.1113/JP287857
Devecchi, V., Falla, D., Cabral, H. V., and Gallina, A. (2023). Neuromuscular adaptations to experimentally induced pain in the lumbar region: systematic review and meta-analysis. Pain 164, 1159–1180. doi: 10.1097/j.pain.0000000000002819
Dideriksen, J. L., Holobar, A., and Falla, D. (2016). Preferential distribution of nociceptive input to motoneurons with muscle units in the cranial portion of the upper trapezius muscle. J. Neurophysiol. 116, 611–618. doi: 10.1152/jn.01117.2015
Drost, G., Stegeman, D. F., Van Engelen, B. G. M., and Zwarts, M. J. (2006). Clinical applications of high-density surface EMG: a systematic review. J. Electromyogr. Kinesiol. 16, 586–602. doi: 10.1016/j.jelekin.2006.09.005
Ducas, J., Pano-Rodriguez, A., Couture, S., Gallina, A., and Abboud, J. (2024). The effect of trunk position and pain location on lumbar extensor muscle recruitment strategies. J. Appl. Physiol. 137, 540–553. doi: 10.1152/japplphysiol.00086.2024
Falla, D., Cescon, C., Lindstroem, R., and Barbero, M. (2017). Muscle pain induces a shift of the spatial distribution of upper trapezius muscle activity during a repetitive task: a mechanism for perpetuation of pain with repetitive activity? Clin. J. Pain 33, 1006–1013. doi: 10.1097/AJP.0000000000000513
Falla, D., Gizzi, L., Tschapek, M., Erlenwein, J., and Petzke, F. (2014). Reduced task-induced variations in the distribution of activity across back muscle regions in individuals with low back pain. Pain 155, 944–953. doi: 10.1016/j.pain.2014.01.027
Farina, D., Merletti, R., and Enoka, R. M. (2004). The extraction of neural strategies from the surface EMG. J. Appl. Physiol. 96, 1486–1495. doi: 10.1152/japplphysiol.01070.2003
Farina, D., and Negro, F. (2015). Common synaptic input to motor neurons, motor unit synchronization, and force control. Exerc. Sport Sci. Rev. 43, 23–33. doi: 10.1249/JES.0000000000000032
Finneran, M. T., Mazanec, D., Marsolais, M. E., Marsolais, E. B., and Pease, W. S. (2003). Large-array surface electromyography in low back pain: a pilot study. Spine 28, 1447–1454. doi: 10.1097/01.BRS.0000067565.16832.B9
Gallina, A., Disselhorst-Klug, C., Farina, D., Merletti, R., Besomi, M., Holobar, A., et al. (2022). Consensus for experimental design in electromyography (CEDE) project: High-density surface electromyography matrix. J. Electromyogr. Kinesiol. 64:102656. doi: 10.1016/j.jelekin.2022.102656
Gallina, A., Hunt, M. A., Hodges, P. W., and Garland, S. J. (2018a). Vastus lateralis motor unit firing rate is higher in women with patellofemoral pain. Arch. Phys. Med. Rehabil. 99, 907–913. doi: 10.1016/j.apmr.2018.01.019
Gallina, A., Salomoni, S. E., Hall, L. M., Tucker, K., Garland, S. J., and Hodges, P. W. (2018b). Location-specific responses to nociceptive input support the purposeful nature of motor adaptation to pain. Pain 159, 2192–2200. doi: 10.1097/j.pain.0000000000001317
Gallina, A., Wakeling, J. M., Hodges, P. W., Hunt, M. A., and Garland, S. J. (2019). Regional vastus medialis and vastus lateralis activation in females with patellofemoral pain. Med. Sci. Sports Exerc. 51, 411–420. doi: 10.1249/MSS.0000000000001810
Gaudreault, N., Arsenault, A. B., Larivière, C., DeSerres, S. J., and Rivard, C.-H. (2005). Assessment of the paraspinal muscles of subjects presenting an idiopathic scoliosis: an EMG pilot study. BMC Musculoskelet. Disord. 6:14. doi: 10.1186/1471-2474-6-14
Gazzoni, M., and Cerone, G. L. (2021). “Augmented reality biofeedback for muscle activation monitoring: proof of concept,” in 8th European Medical and Biological Engineering Conference, eds. T. Jarm, A. Cvetkoska, S. Mahnič-Kalamiza, and D. Miklavcic (Cham: Springer International Publishing), 143–150. doi: 10.1007/978-3-030-64610-3_17
Graven-Nielsen, T. (2022). Mechanisms and manifestations in musculoskeletal pain: from experimental to clinical pain settings. Pain 163, S29–S45. doi: 10.1097/j.pain.0000000000002690
Guyatt, G. H., Oxman, A. D., Vist, G. E., Kunz, R., Falck-Ytter, Y., Alonso-Coello, P., et al. (2008). GRADE: an emerging consensus on rating quality of evidence and strength of recommendations. BMJ 336, 924–926. doi: 10.1136/bmj.39489.470347.AD
Hao, Z., Xie, L., Wang, J., and Hou, Z. (2020). Spatial distribution and asymmetry of surface electromyography on lumbar muscles of soldiers with chronic low back pain. Pain Res. Manag. 2020, 1–8. doi: 10.1155/2020/6946294
Higgins, J. P. T. (2003). Measuring inconsistency in meta-analyses. BMJ 327, 557–560. doi: 10.1136/bmj.327.7414.557
Hiller, C. E., Nightingale, E. J., Raymond, J., Kilbreath, S. L., Burns, J., Black, D. A., et al. (2012). Prevalence and impact of chronic musculoskeletal ankle disorders in the community. Arch. Phys. Med. Rehabil. 93, 1801–1807. doi: 10.1016/j.apmr.2012.04.023
Hodges, P. W., Butler, J., Tucker, K., MacDonell, C. W., Poortvliet, P., Schabrun, S., et al. (2021). Non-uniform effects of nociceptive stimulation to motoneurones during experimental muscle pain. Neuroscience 463, 45–56. doi: 10.1016/j.neuroscience.2021.03.024
Hodges, P. W., and Smeets, R. J. (2015). Interaction between pain, movement, and physical activity: short-term benefits, long-term consequences, and targets for treatment. Clin. J. Pain 31, 97–107. doi: 10.1097/AJP.0000000000000098
Hodges, P. W., and Tucker, K. (2011). Moving differently in pain: a new theory to explain the adaptation to pain. Pain 152, S90–S98. doi: 10.1016/j.pain.2010.10.020
Holtermann, A., Grönlund, C., Roeleveld, K., and Gerdle, B. (2011). The relation between neuromuscular control and pain intensity in fibromyalgia. J. Electromyogr. Kinesiol. 21, 519–524. doi: 10.1016/j.jelekin.2011.01.004
Hong, C. C., and Calder, J. (2023). The Burden of the “Simple Ankle Sprains.” Foot Ankle Clin. 28, 187–200. doi: 10.1016/j.fcl.2022.12.002
Hopkins, W. G., Marshall, S. W., Batterham, A. M., and Hanin, J. (2009). Progressive statistics for studies in sports medicine and exercise science. Med. Sci. Sports Exerc. 41, 3–12. doi: 10.1249/MSS.0b013e31818cb278
Hug, F., Dernoncourt, F., Avrillon, S., Thorstensen, J., Besomi, M., Van Den Hoorn, W., et al. (2025). Non-homogeneous distribution of inhibitory inputs among motor units in response to nociceptive stimulation at moderate contraction intensity. J. Physiol. 603, 3445–3461. doi: 10.1113/JP288504
Hug, F., Hodges, P. W., Hoorn, W. V. D., and Tucker, K. (2014a). Between-muscle differences in the adaptation to experimental pain. J. Appl. Physiol. 117, 1132–1140. doi: 10.1152/japplphysiol.00561.2014
Hug, F., Hodges, P. W., and Tucker, K. (2014b). Task dependency of motor adaptations to an acute noxious stimulation. J. Neurophysiol. 111, 2298–2306. doi: 10.1152/jn.00911.2013
Izumi, M., Petersen, K. K., Arendt-Nielsen, L., and Graven-Nielsen, T. (2014). Pain referral and regional deep tissue hyperalgesia in experimental human hip pain models. Pain 155, 792–800. doi: 10.1016/j.pain.2014.01.008
Kubo, Y., Watanabe, K., Nakazato, K., Koyama, K., Hakkaku, T., Kemuriyama, S., et al. (2019). The effect of a previous strain injury on regional neuromuscular activation within the rectus femoris. J. Hum. Kinet. 66, 89–97. doi: 10.2478/hukin-2018-0066
Li, N., Wang, Q., Ai, S., He, H., He, J., and Jiang, N. (2024). “Assessment of lumbar muscles activation in patients with unilateral myofascial pain syndrome based on high-density surface electromyography: a preliminary study,” in 2024 46th Annual International Conference of the IEEE Engineering in Medicine and Biology Society (EMBC) (Orlando, FL, USA: IEEE), 1–4. doi: 10.1109/EMBC53108.2024.10782284
Madeleine, P., Leclerc, F., Arendt-Nielsen, L., Ravier, P., and Farina, D. (2006). Experimental muscle pain changes the spatial distribution of upper trapezius muscle activity during sustained contraction. Clin. Neurophysiol. 117, 2436–2445. doi: 10.1016/j.clinph.2006.06.753
Martinez-Valdes, E., Enoka, R. M., Holobar, A., McGill, K., Farina, D., Besomi, M., et al. (2023). Consensus for experimental design in electromyography (CEDE) project: Single motor unit matrix. J. Electromyogr. Kinesiol. 68:102726. doi: 10.1016/j.jelekin.2022.102726
Martinez-Valdes, E., Negro, F., Arvanitidis, M., Farina, D., and Falla, D. (2021). Pain-induced changes in motor unit discharge depend on recruitment threshold and contraction speed. J. Appl. Physiol. 131, 1260–1271. doi: 10.1152/japplphysiol.01011.2020
Martinez-Valdes, E., Wilson, F., Fleming, N., McDonnell, S.-J., Horgan, A., and Falla, D. (2019). Rowers with a recent history of low back pain engage different regions of the lumbar erector spinae during rowing. J. Sci. Med. Sport 22, 1206–1212. doi: 10.1016/j.jsams.2019.07.007
Mendez-Rebolledo, G., Calatayud, J., and Martinez-Valdes, E. (2025). High-density surface electromyography feedback enhances fibularis longus recruitment in chronic ankle instability. Med. Sci. Sports Exerc. 57, 1–10. doi: 10.1249/MSS.0000000000003537
Mendez-Rebolledo, G., Guzmán-Venegas, R., Cruz-Montecinos, C., Watanabe, K., Calatayud, J., and Martinez-Valdes, E. (2023a). Individuals with chronic ankle instability show altered regional activation of the peroneus longus muscle during ankle eversion. Scand. Med. Sci. Sports 34:e14535. doi: 10.1111/sms.14535
Mendez-Rebolledo, G., Guzmán-Venegas, R., Orozco-Chavez, I., Cruz-Montecinos, C., Watanabe, K., and Martinez-Valdes, E. (2023b). Task-related differences in peroneus longus muscle fiber conduction velocity. J. Electromyogr. Kinesiol. 71:102795. doi: 10.1016/j.jelekin.2023.102795
Mendez-Rebolledo, G., Guzmán-Venegas, R., Valencia, O., and Watanabe, K. (2021a). Contribution of the peroneus longus neuromuscular compartments to eversion and plantarflexion of the ankle. PLoS ONE 16:e0250159. doi: 10.1371/journal.pone.0250159
Mendez-Rebolledo, G., Morales-Verdugo, J., Orozco-Chavez, I., Habechian, F. A. P., Padilla, E. L., and de la Rosa, F. J. B. (2021b). Optimal activation ratio of the scapular muscles in closed kinetic chain shoulder exercises: a systematic review. BMR 34, 3–16. doi: 10.3233/BMR-191771
Mendez-Rebolledo, G., Orozco-Chavez, I., Morales-Verdugo, J., Ramirez-Campillo, R., and Cools, A. M. J. (2022). Electromyographic analysis of the serratus anterior and upper trapezius in closed kinetic chain exercises performed on different unstable support surfaces: a systematic review and meta-analysis. PeerJ 10:e13589. doi: 10.7717/peerj.13589
Modesti, P. A., Reboldi, G., Cappuccio, F. P., Agyemang, C., Remuzzi, G., Rapi, S., et al. (2016). Panethnic differences in blood pressure in europe: a systematic review and meta-analysis. PLoS ONE 11:e0147601. doi: 10.1371/journal.pone.0147601
Morgan, R. L., Whaley, P., Thayer, K. A., and Schünemann, H. J. (2018). Identifying the PECO: A framework for formulating good questions to explore the association of environmental and other exposures with health outcomes. Environ. Int. 121, 1027–1031. doi: 10.1016/j.envint.2018.07.015
Nuccio, S., Del Vecchio, A., Casolo, A., Labanca, L., Rocchi, J. E., Felici, F., et al. (2021). Deficit in knee extension strength following anterior cruciate ligament reconstruction is explained by a reduced neural drive to the vasti muscles. J. Physiol. 599, 5103–5120. doi: 10.1113/JP282014
Ouzzani, M., Hammady, H., Fedorowicz, Z., and Elmagarmid, A. (2016). Rayyan—a web and mobile app for systematic reviews. Syst. Rev. 5:210. doi: 10.1186/s13643-016-0384-4
Page, M. J., McKenzie, J. E., Bossuyt, P. M., Boutron, I., Hoffmann, T. C., Mulrow, C. D., et al. (2021). The PRISMA 2020 statement: an updated guideline for reporting systematic reviews. BMJ 372:n71. doi: 10.1136/bmj.n71
Perrot, S., Doane, M. J., Jaffe, D. H., Dragon, E., Abraham, L., Viktrup, L., et al. (2022). Burden of chronic low back pain: Association with pain severity and prescription medication use in five large European countries. Pain Pract. 22, 359–371. doi: 10.1111/papr.13093
Pirouzi, S., Hides, J., Richardson, C., Darnell, R., and Toppenberg, R. (2006). Low back pain patients demonstrate increased hip extensor muscle activity during standardized submaximal rotation efforts: Spine 31, E999–E1005. doi: 10.1097/01.brs.0000250076.74366.9d
Rogoschin, J., Komnik, I., and Potthast, W. (2024). Neuromuscular adaptations related to medial knee osteoarthritis and influence of unloader braces on neuromuscular activity in knee osteoarthritis subjects—a systematic review. Am. J. Phys. Med. Rehabil. 103, 1051–1059. doi: 10.1097/PHM.0000000000002521
Sampieri, A., Marcolin, G., Gennaro, F., Magistrelli, E., Del Vecchio, A., Moro, T., et al. (2025). Alterations in magnitude and spatial distribution of erector spinae muscle activity in cyclists with a recent history of low back pain. Eur. J. Appl. Physiol. 125, 967–976. doi: 10.1007/s00421-024-05628-7
Sanderson, A., Cescon, C., Heneghan, N. R., Kuithan, P., Martinez-Valdes, E., Rushton, A., et al. (2019a). People with low back pain display a different distribution of erector spinae activity during a singular mono-planar lifting task. Front. Sports Act. Living 1:65. doi: 10.3389/fspor.2019.00065
Sanderson, A., Cescon, C., Martinez-Valdes, E., Rushton, A., Heneghan, N. R., Kuithan, P., et al. (2024). Reduced variability of erector spinae activity in people with chronic low back pain when performing a functional 3D lifting task. J. Electromyogr. Kinesiol. 78:102917. doi: 10.1016/j.jelekin.2024.102917
Sanderson, A., Martinez-Valdes, E., Heneghan, N. R., Murillo, C., Rushton, A., and Falla, D. (2019b). Variation in the spatial distribution of erector spinae activity during a lumbar endurance task in people with low back pain. J. Anat. 234, 532–542. doi: 10.1111/joa.12935
Schabrun, S. M., Elgueta-Cancino, E. L., and Hodges, P. W. (2017). Smudging of the motor cortex is related to the severity of low back pain. Spine 42, 1172–1178. doi: 10.1097/BRS.0000000000000938
Serafino, F., Trucco, M., Occhionero, A., Cerone, G. L., Chiarotto, A., Vieira, T., et al. (2021). Understanding regional activation of thoraco-lumbar muscles in chronic low back pain and its relationship to clinically relevant domains. BMC Musculoskelet. Disord. 22:432. doi: 10.1186/s12891-021-04287-5
Staudenmann, D., Van Dieën, J. H., Stegeman, D. F., and Enoka, R. M. (2014). Increase in heterogeneity of biceps brachii activation during isometric submaximal fatiguing contractions: a multichannel surface EMG study. J. Neurophysiol. 111, 984–990. doi: 10.1152/jn.00354.2013
Stroup, D. F. (2000). Meta-analysis of observational studies in epidemiology a proposal for reporting. JAMA 283:2008. doi: 10.1001/jama.283.15.2008
Sung, P. S., Zurcher, U., and Kaufman, M. (2005). Nonlinear analysis of electromyography time series as a diagnostic tool for low back pain. Med. Sci. Monit. 11, CS1-5.
Tucker, K. J., and Hodges, P. W. (2009). Motoneurone recruitment is altered with pain induced in non-muscular tissue. Pain 141, 151–155. doi: 10.1016/j.pain.2008.10.029
Tucker, K. J., and Hodges, P. W. (2010). Changes in motor unit recruitment strategy during pain alters force direction. Eur. J. Pain 14, 932–938. doi: 10.1016/j.ejpain.2010.03.006
Van Dieën, J. H., Reeves, N. P., Kawchuk, G., Van Dillen, L. R., and Hodges, P. W. (2019). Motor control changes in low back pain: divergence in presentations and mechanisms. J. Orthop. Sports Phys. Ther. 49, 370–379. doi: 10.2519/jospt.2019.7917
Yong, H.u, Mak, J. N. F., Lu, W. W., Cheung, K. M. C., and Luk, K. D. K. (2004). “Visualization of lumbar muscle contraction synergy using surface electromyography (sEMG) streaming topography,” in The 26th Annual International Conference of the IEEE Engineering in Medicine and Biology Society (San Francisco, CA, USA: IEEE), 2337–2340. doi: 10.1109/IEMBS.2004.1403678
Keywords: clinical pain, experimental pain, regional muscle activity, electromyography, high density surface electromyography, neuromuscular adaptation
Citation: Mendez-Rebolledo G, Orozco-Chavez I, Salazar-Méndez J, Morales-Verdugo J and Martinez-Valdes E (2025) Effect of experimental and clinical pain on the spatial distribution of muscle activity: a systematic review and meta-analysis. Front. Hum. Neurosci. 19:1603807. doi: 10.3389/fnhum.2025.1603807
Received: 01 April 2025; Accepted: 17 June 2025;
Published: 10 July 2025.
Edited by:
Nadia Dominici, VU Amsterdam, NetherlandsReviewed by:
Giacomo Rossettini, University of Verona, ItalyZengming Hao, Wenzhou Business College, China
Niels Brouwer, Bern University of Applied Sciences, Switzerland
Copyright © 2025 Mendez-Rebolledo, Orozco-Chavez, Salazar-Méndez, Morales-Verdugo and Martinez-Valdes. This is an open-access article distributed under the terms of the Creative Commons Attribution License (CC BY). The use, distribution or reproduction in other forums is permitted, provided the original author(s) and the copyright owner(s) are credited and that the original publication in this journal is cited, in accordance with accepted academic practice. No use, distribution or reproduction is permitted which does not comply with these terms.
*Correspondence: Eduardo Martinez-Valdes, ZS5hLm1hcnRpbmV6dmFsZGVzQGJoYW0uYWMudWs=