 Marta Kopańska
 Danuta Ochojska3
 Jacek Szczygielski
- 1Faculty of Medicine, Department of Medical Psychology, Collegium Medicum, University of Rzeszów, Rzeszów, Poland
- 2Laboratory of Neurophysiology, Clinimetrics and Microsurgical Training, Centre for Innovative Research in Medical and Natural Sciences, Collegium Medicum, University of Rzeszów, Rzeszów, Poland
- 3Faculty of Health Sciences and Psychology, Collegium Medicum, University of Rzeszów, Rzeszów, Poland
- 4Student Research Club “Reh-Tech”, Collegium Medicum, University of Rzeszów, Rzeszów, Poland
- 5Faculty of Medicine, Department of Neurosurgery, Collegium Medicum, University of Rzeszów, Rzeszów, Poland
- 6Faculty of Medicine and Saarland University Medical Centre, Department of Neurosurgery, Saarland University, Homburg, Germany
Context: Depressive disorders are one of the greatest public health challenges, affecting more than 300 million people worldwide. Traditional diagnostic methods are based on subjective clinical assessments, which limits their accuracy and reproducibility. Therefore, there is an urgent need to implement objective, easily accessible diagnostic tools. One such tool is quantitative electroencephalography (QEEG), which allows for the analysis of the bioelectrical activity of the brain in a non-invasive and precise manner.
Methods: In this narrative review, the latest research on the use of QEEG and traditional EEG in the assessment of patients with major depressive disorder (MDD) was analyzed. The literature search was carried out in the PubMed and SpringerLink databases, focusing on articles investigating the correlations between spectral EEG properties (alpha, beta, theta, delta, gamma waves) and symptoms of depression.
Results: The literature review indicates the presence of characteristic patterns of brain activity in patients with MDD, such as alpha wave asymmetry in the frontal areas, increased beta band activity, and changes in the theta and delta waves. This indicates the potential use of these parameters as biomarkers for early detection and monitoring of therapy effectiveness.
Conclusions: QEEG and classical EEG may play an important role in the diagnosis and treatment of depression, supporting the development of personalized therapeutic strategies. Despite promising results, further research on the standardization of methods and validation of neurophysiological indicators is needed to enable their wider application in psychiatric clinical practice.
1 Introduction
One of the main challenges facing modern psychiatry today is the identification of biomarkers that will enable the accurate diagnosis of major depressive disorder (MDD). The diagnostic methods currently used are based on subjective assessments, which limits their reliability and leads to an incomplete reflection of the patient's real condition (Boby and Veerasingam, 2025).
Depression is currently one of the most commonly diagnosed mental disorders in the world, affecting people of all ages. According to the World Health Organization (WHO), more than 300 million people suffer from depression. MDD is a serious challenge, both socially and economically. It is a disease that not only leads to a reduced quality of life, but also generates significant economic costs, including reduced productivity, absenteeism and increased healthcare expenditure. It mainly manifests itself in general discouragement, a feeling of uselessness, a pessimistic vision of the future, a decrease in concentration, and a constant feeling of guilt. Patients also experience physical symptoms such as pain, fatigue, and sleep problems (de Aguiar Neto and Rosa, 2019; Rakel, 1999). Patients with MDD often suffer from cognitive impairments, which include not only a reduced ability to think, but also a weakened ability to make decisions, which may result from the fact that patients mainly focus their attention on negative emotions. Therefore, people suffering from MDD are characterized by a specific way of thinking, based on persistent and intense consideration of the causes and consequences of their negative emotions (Dehn and Beblo, 2019).
According to the World Health Organization around 20 percent of people with MDD die, while around 35 percent attempt suicide every year (Boby and Veerasingam, 2025). It is therefore important that depressive disorders are diagnosed effectively and quickly, as this makes it possible to prevent serious health consequences associated with the course of the disease. Depression is characterized by moderate and severe episodes and is often treated with pharmacological agents or psychosomatic therapies. For many people, it can become a chronic condition or last a lifetime, often with relapses. On average, people suffering from depression experience four to five depressive episodes in their lifetime (Ghiasi et al., 2021). MDD is classified into three main categories: severe, moderate and mild. Patients with severe depressive disorders can be diagnosed relatively easily and quickly. However, identifying moderate and mild episodes of depression is much more difficult, which is why it is important to develop tests that enable quick and effective detection of depression (Wu et al., 2022).
The causes of depression are complex and multifactorial, and the literature on the subject is not clearly systematized, but it is generally known that its development can be influenced by various factors, such as genetics, long-term stress, trauma or adverse environmental conditions (Remes et al., 2021). It is believed that one of the factors of depression is the ongoing active inflammatory processes in the body, which weaken the blood-brain barrier (Anderson, 2016; Bobińska et al., 2016).
Other studies have shown that there is a relationship between chronic stress and depressive disorders (Hansson et al., 2015). Interestingly, it is believed that the brains of people suffering from depression are characterized by impaired signal transmission between neurons, which may result from the malfunctioning of neurotransmitters responsible for mood regulation, pleasure sensation, reward system and executive functions (Durisko et al., 2015). People suffering from depression experience elevated levels of cortisol at night. This contributes to structural changes in brain areas responsible for emotional processing, such as the enlargement of the amygdala in the anterior part of the temporal lobes (Yasin et al., 2023).
According to the Diagnostic and Statistical Manual of Mental Disorders, 5th Edition (DSM-5) criteria, depression is diagnosed when five or more symptoms of MDD occur for about 2 weeks, including depressed mood or loss of interest, causing significant suffering or impairment of functioning, not resulting from another cause (Kendler, 2016). Depression is now considered a risk factor for cardiovascular diseases such as hypertension, arteriosclerosis and myocardial infarction. Depression can also weaken the immune system, increasing susceptibility to infections and chronic inflammation. It is also closely related to metabolic disorders such as type 2 diabetes, as well as neurological problems. In addition, depression often coexists with anxiety disorders, insomnia and chronic pain syndrome, which significantly worsens the quality of life of patients (Carney, 2017; Ma and Li, 2017; McGregor et al., 2014; Levenstein et al., 2001; Berntson et al., 2017; Anderson et al., 2001). That is why it is so important to diagnose depression quickly, which will allow for the implementation of appropriate treatment at an earlier stage, minimizing the negative consequences for the patient and society.
The QEEG seems to be a helpful tool in the diagnosis of the neurological mechanisms causing depression. Many scientists are using and QEEG to find biomarkers that may play a key role in the diagnosis and treatment of depressive disorders in the future. It is now known that depression affects three areas of the brain: the prefrontal cortex at the front of the frontal lobe of the frontal bone, the amygdala at the front of the temporal lobe and the hippocampus in the temporal lobe (Wu et al., 2022).
Traditional electroencephalography involves monitoring brain activity in different areas of the skull and recording the currents generated by brain neurons using electrodes placed on the surface of the head, which are then amplified by an electroencephalograph. Traditional EEG is a widely available, easy-to-use technique (Figure 1) (Fingelkurts and Fingelkurts, 2022). In contrast, quantitative electroencephalography is a test that can assess the functioning of the central nervous system. QEEG can be used to assess brain activity and examine the correlations between areas of the cerebral cortex. QEEG is also known as “mapping” of the bioelectrical activity of the brain. It refers to the numerical analysis and visual transformation of raw electroencephalographic signals. An additional advantage of this test is that it is non-invasive (Kopańska et al., 2023). In QEEG analysis, the most commonly used measures are spectral power, which reflects the intensity of activity within a given frequency band, and coherence, which indicates the phase consistency between signals recorded at different points on the scalp (Leuchter et al., 2012).
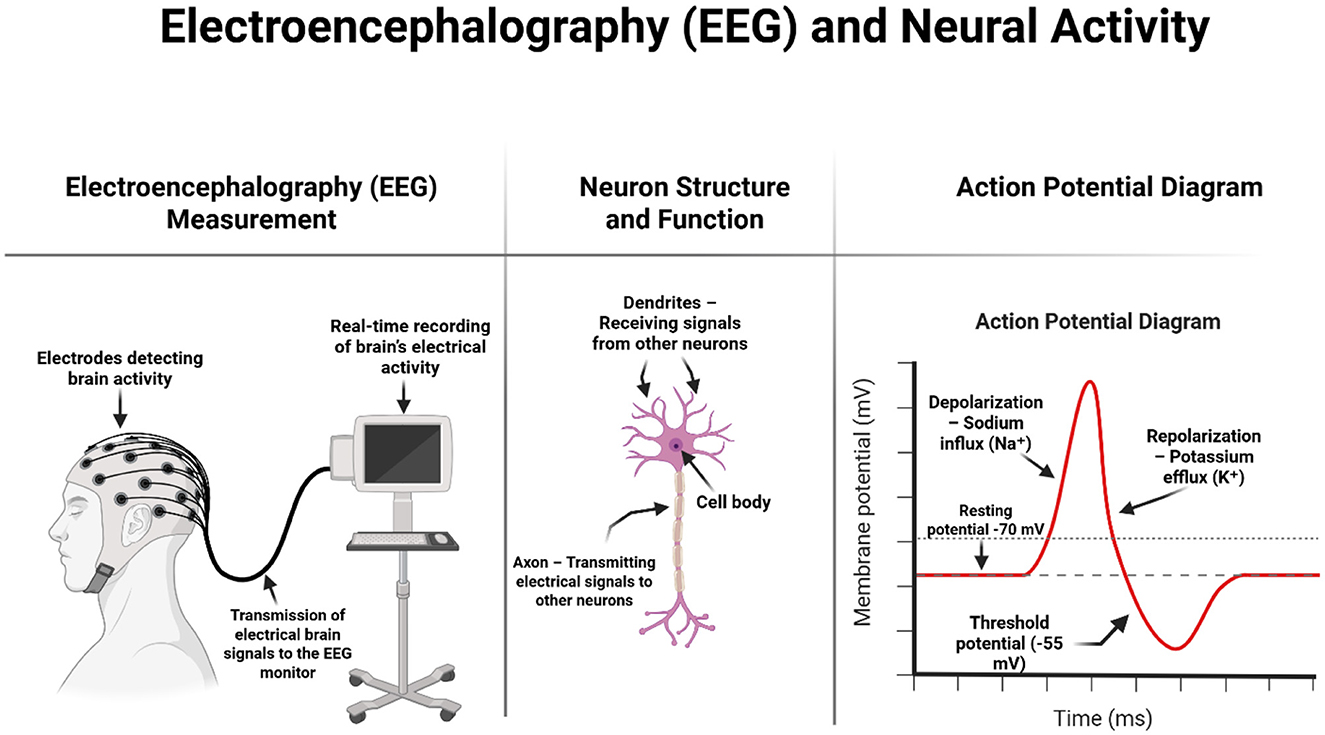
Figure 1. Schematic representation of EEG measurement, neuron structure, and the action potential process. On the left, the diagram shows how surface electrodes placed on the scalp detect the brain's electrical activity, which is transmitted in real time to an EEG recording system. The center illustrates the basic structure of a neuron, including dendrites (which receive input), the cell body (soma), and the axon (which transmits signals). On the right, a graph of the action potential explains key phases of neuronal firing: resting state, depolarization due to sodium influx, and repolarization due to potassium efflux. This electrophysiological process is the basis of the brain signals captured during EEG recording. Image created using Biorender.
Several researchers point out that various impairments in brain performance and emotional state are noticeable in the bioelectric activity of the brain. Therefore, both EEG and QEEG are valuable tools for obtaining information on changes in neuronal functioning in the presence of MDD (Bachmann et al., 2017). As early as the 1950s, some authors were already considering the use of electroencephalography in the diagnosis of MDD (Williams, 1954). Nowadays, not only plain EEG is used for diagnostic workup of depressive disorders. Meanwhile modified version of EEG, namely quantitative electroencephalography was included in the list of diagnostic tools for MDD assessment (Deslandes et al., 2004; Leuchter et al., 2009b; Widge et al., 2019).
Both of these tests play an important role in the precise identification of optimal therapeutic strategies, which contributes to more targeted and effective treatment (Schiller, 2019).
The aim of this review is to summarize the latest research on the application of traditional EEG and QEEG in the diagnosis of depression and to identify specific biomarkers characteristic of MDD. Currently, there is a growing interest in objective methods for assessing brain function in MDD, and this article seeks to organize the available knowledge and indicate directions for further research.
2 Materials and methods
This systematic review was conducted in accordance with the PRISMA (Preferred Reporting Items for Systematic Reviews and Meta-Analyses) guidelines and the recommendations of the Cochrane Collaboration Handbook for Systematic Reviews of Interventions. The literature search included an analysis of scientific articles on the use of electroencephalography and quantitative electroencephalography in the diagnosis and monitoring of depression.
The literature search was conducted in two key databases: PubMed and SpringerLink, to ensure broad access to peer-reviewed publications of high scientific value. In order to identify relevant studies, various combinations of keywords were used, taking into account both general concepts related to traditional EEG and depression, as well as more specific aspects concerning neurophysiological biomarkers. Examples of search phrases used included: “EEG/QEEG depression”, “EEG biomarkers depression”, “QEEG MDD”, “frontal alpha asymmetry depression”, “EEG spectral analysis in major depressive disorder”, “brain oscillations in mood disorders” (Figure 2).
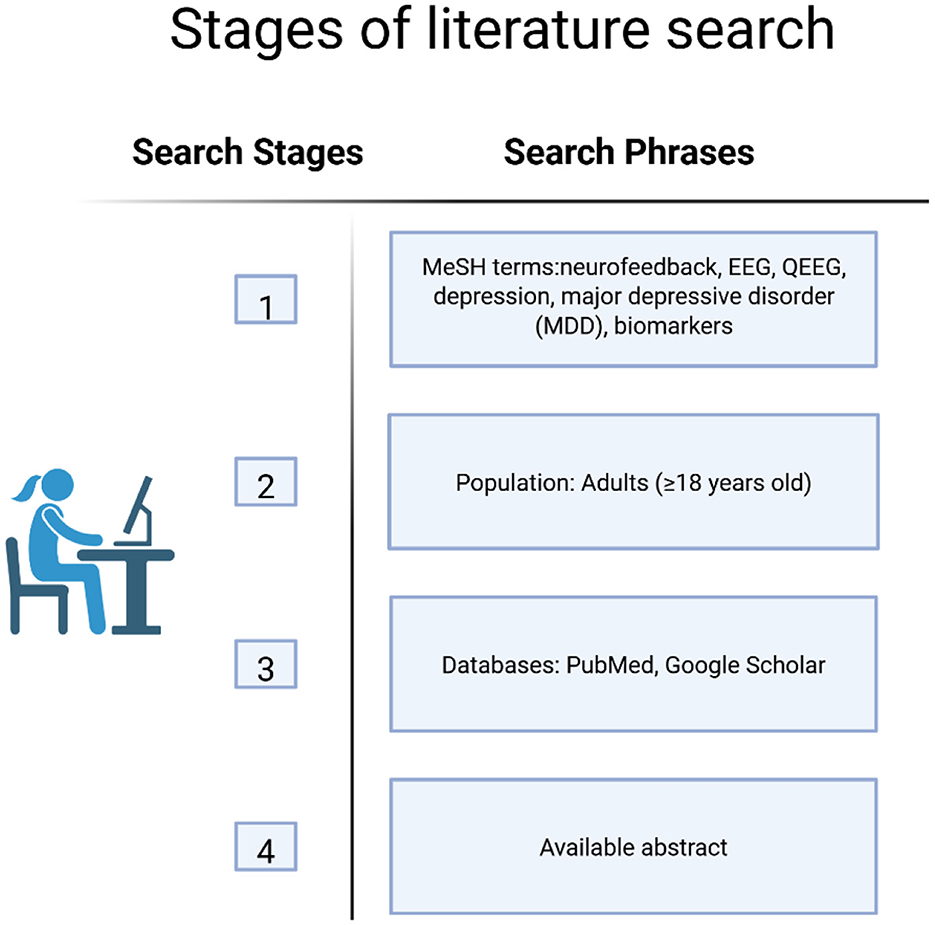
Figure 2. The process of identifying relevant scientific literature in PubMed and Google Scholar databases. Search terms were selected based on MeSH terminology and inclusion criteria related to QEEG, EEG and biomarkers of MDD. Image created using Biorender.
The review included studies that met the following criteria: original studies that analyzed EEG or QEEG activity in adults (≥18 years old) with depression, peer-reviewed publications available in English or Polish, works analyzing specific brainwave bands (alpha, beta, theta, delta, gamma) and their potential diagnostic significance, studies that included traditional EEG spectral analysis methods, including frontal asymmetry and brainwave synchronization indices. Studies with a large study group were also considered important, enabling comparison of results between different clinical subgroups, which could increase the scientific value of the conclusions. However, the following studies were not included in the review: studies conducted on children and adolescents (< 18 years of age), due to differences in neurophysiological development, without access to the full text or publications that were not scientifically reviewed, conference papers, case studies and narrative reviews (with the exception of meta-analyses).
A total of 4296 studies were identified in the databases (PubMed: 2583, SpringerLink: 1713). After removing 1015 duplicates, 3281 studies remained for further analysis. Subsequently, 495 studies were rejected due to lack of access to the full text and 420 studies were excluded because they involved an unsuitable population. Ultimately, 2366 studies were screened for eligibility. During the initial selection (review of titles and abstracts), 1500 studies were excluded due to lack of relevance to the study topic. The full texts of the remaining 866 studies were subjected to a detailed evaluation. After the full-text evaluation, 696 studies were rejected because they did not meet the inclusion criteria:
• Studies conducted on children and adolescents (n = 400)
• Lack of complete traditional EEG data (n = 200)
• Low methodological quality (n = 96)
Ultimately, according to the inclusion and exclusion criteria, 98 studies were included in the systematic review, of which 69 were subjected to detailed analysis, and 29 were used as contextual sources in the introduction (Figure 3).
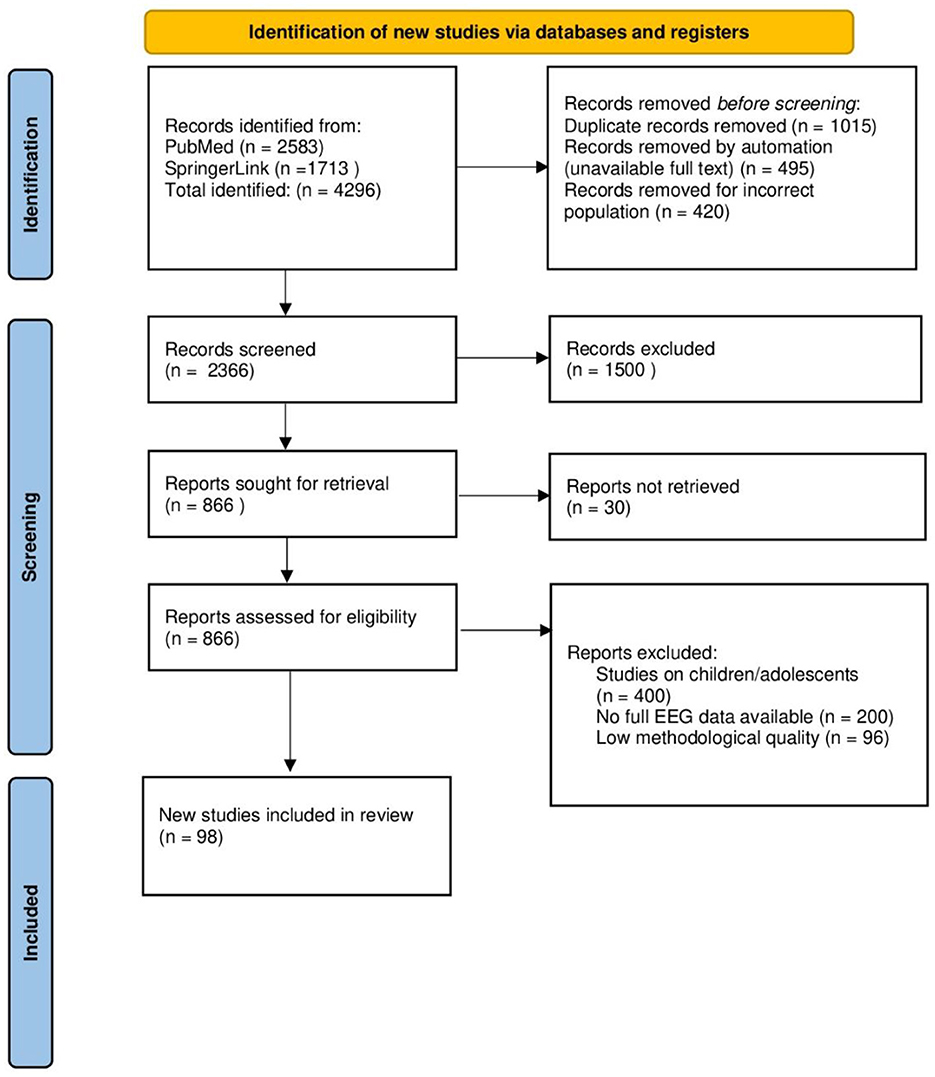
Figure 3. PRISMA chart for included studies.
3 Results
The aim of this paper is to analyse the results of studies that evaluated the usefulness of EEG and QEEG as diagnostic tools in the diagnosis of depressive disorders. The focus was on identifying specific patterns of bioelectrical brain activity characteristic of MDD. The results were categorized according to activity in individual brainwave bands, taking into account their potential diagnostic and prognostic significance.
Quantitative electroencephalography is becoming an increasingly common tool in psychiatric neurodiagnostics. The literature emphasizes its usefulness in assessing the current state of brain function and the possibility of early detection of mood disorders (Kopańska et al., 2023).
3.1 Frequency domain analysis
One of the most commonly used methods in QEEG is frequency domain analysis, which is based on the fast Fourier transform. It allows for the assessment of EEG signal power within specific frequency bands, which reflect the activity of various neural circuits, particularly thalamocortical and cortical networks (Smailovic and Jelic, 2019).
Studies conducted over the past 10 years using traditional electroencephalography in patients with depression indicate significant methodological issues that hinder the comparability of results. The main limitations include the diversity of diagnostic criteria within study groups, the lack of appropriate control groups, and substantial variability in EEG techniques used across studies (Thoduparambil et al., 2020; Pollock, 1990). Despite these limitations, increasing attention is being given to the identification of specific biomarkers that could aid in earlier diagnosis.
Soares de Aguiar Neto and Garcia Rosa emphasize that alpha waves in EEG recordings have significant diagnostic relevance in the context of depressive disorders (de Aguiar Neto and Rosa, 2019). Alpha waves occur in the frequency range of 8–12 Hz and are observed with eyes closed, in a state of relaxation and wakefulness. They most commonly appear in the occipital region. In individuals suffering from depression, researchers observe alpha wave asymmetry in the frontal part of the brain (van der Vinne et al., 2019). Kana et al. identified differences in alpha waves between a group of healthy individuals and a group of individuals with depression. It was found that alpha waves in the MDD group were lower compared to the control group. Additionally, these abnormalities were observed in the frontal, parietal, occipital, and temporal regions (Kan and Lee, 2015). An international team of researchers specializing in neurobiology and psychiatry, while analyzing the role of alpha waves in major neuropsychiatric disorders, recorded reduced activity of these waves in depression, particularly in the prefrontal cortex. These findings suggest that such a wave pattern may lead to difficulties in emotion regulation and impaired cognitive functioning (Ippolito et al., 2022). According to some studies, qEEG can be used to predict the effectiveness of pharmacological treatment in MDD. Female patients who do not respond to treatment are characterized by greater alpha wave power in the left frontal lobe compared to the right (Ip et al., 2021). Similarly, in the study by Arikan et al., it was shown that patients with MDD who respond to treatment exhibit significant changes in cortical activity in the theta, alpha, and high beta bands, with qEEG improvement ranging from 15 to 67% (Arikan et al., 2025). In turn, treatment with citalopram, a selective serotonin reuptake inhibitor (SSRI), results in an increase in alpha power (Pariante et al., 2012).
In a study involving 1,008 patients with MDD and 336 individuals in the control group, traditional EEG was performed, and it was observed that patients with MDD had elevated theta values in the frontal cortex. The authors concluded that increased theta waves in the frontal region were associated with a lack of response to treatment. On the other hand, other researchers noted that low theta wave values in the frontal cortex occur in individuals who respond poorly to antidepressant therapy (Arns et al., 2015). Theta waves fall within the frequency range of 4–8 Hz and are most commonly recorded during drowsiness, relaxation, or meditation (Kopańska et al., 2023). In MDD, a significant increase in spectral power in the theta frequency bands can be observed in the parietal and occipital regions, both with eyes open and closed (Grin-Yatsenko et al., 2009). Recent studies suggest a correlation between depression and pathological theta wave values. In their study, Melinda L. Morgan et al. examined 104 individuals suffering from depression using quantitative electroencephalography. The obtained results were compared with a control group. The authors noted that theta wave correlation in the prefrontal regions may serve as a biomarker of depression, as it is associated with the pathophysiology of the disorder and with predicting treatment response. Interestingly, absolute prefrontal power was higher in women than in men (Morgan et al., 2005).
Suzuki et al. conducted a quantitative EEG analysis on three groups of participants: 27 patients with melancholic depression, 21 patients in remission, and 17 individuals without mental disorders. The latter two groups served as the control group. After completing the study, the authors observed that individuals suffering from depression were characterized by higher theta power in the bilateral frontal regions compared to the remission group. Moreover, they noted that individuals who had experienced depression showed lower theta and alpha power in the bilateral frontal regions and lower alpha-1 power in the parietal regions compared to the control group, which may indicate specific neural dysfunctions related to emotional regulation and information processing in this population (Suzuki et al., 1996). Other authors also point out that patients with MDD are characterized by anomalies in the theta frequency range. In patients with depression, lower theta activity and faster activity in the frontal areas of both hemispheres and the posterior part of the right hemisphere can be observed compared to the control group (Begić et al., 2011; Ohashi, 1994; Yamada et al., 1995; Fingelkurts et al., 2007). Interestingly, patients with MDD show elevated theta wave values in frontal regions (Suzuki et al., 1996).
Begić et al. observed increased beta wave activity in patients with depression (Begić et al., 2011). Therefore, Cai H. et al. conducted an EEG study in patients with MDD, focusing, among other things, on beta wave analysis. The authors noted that beta wave activity, which is associated with mental activity and focus, may have atypical patterns in patients with depression, indicating disturbances in cognitive activity (Cai et al., 2018). In the study of Cai et al., the concept of simplified three channel EEG collection covering frontal area has been implemented. This is in concordance with canonical prefrontal EEG asymmetry pattern as the hallmark of affective disorders, including depression (Davidson, 1998). The anatomical attribution of beta-wave relevant changes may be however more complex, including not only frontal, but also temporoparietal sites, including their bilateral interconnectivity (Li et al., 2017).
An intriguing finding is that Internet addiction combined with depression is associated with specific brainwave patterns. Studies have shown that these patients exhibit increased relative theta power and decreased alpha power across all brain regions (Lee et al., 2014). As early as the end of the 20th century, researchers noticed a connection between the occurring traditional EEG abnormalities in the delta wave range in people suffering from depression. Kwon et al. showed that delta wave activity is increased in people with MDD and that the dominance of these waves is more common in the right hemisphere (Kwon et al., 1996). Depression patients are characterized by a higher delta and theta spectral power in the left superior temporal gyrus at the level of Brodmann areas. Increased activity of these waves may reflect difficulties in concentration, reduced ability to process emotional stimuli and problems with mood regulation (Spironelli et al., 2021). In contrast, a study of 60 menopausal patients diagnosed with depression observed anomalies in EEG activity. These included an increase in the relative values of delta/theta and beta waves, a decrease in alpha band activity, and a slowing of the center of gravity of delta/theta wave activity (Saletu et al., 2010). An interesting example of EEG research is the analysis of the effect of music therapy on functional brain connectivity in patients with MDD. In a study involving 8 patients with depression and 8 control subjects, a greater delay in the delta wave phase was observed in the patients with depression, which may indicate characteristic changes in brain activity in this group (Simmatis et al., 2023). It is worth noting that lower delta wave activity has also been identified as a potential indicator of susceptibility to depressive episodes in people suffering from this disease (Buysse et al., 1997). An EEG study conducted during sleep in hospitalized patients diagnosed with depression who were not taking medication showed that both low and high delta sleep index values are characteristic of people suffering from depression. This could potentially be a useful diagnostic marker in identifying this disorder (Nissen et al., 2001).
According to neurobiological research, a reduced level of gamma waves is associated with depression, and people suffering from this disorder often show poorer concentration than healthy people. Therefore, gamma waves can significantly affect the effectiveness of classification processes (Jiang et al., 2021). Gamma brain wave activity will help diagnose depression more than other frequency bands (Malik et al., 2018). Researchers at the University of Wisconsin-Madison examined 17 patients using a 128-channel EEG. After conducting the study, they noticed that people suffering from depression are characterized by a significantly reduced gamma frequency density (Pizzagalli et al., 2006). Numerous studies indicate that gamma rhythms in people with unipolar depression differ from those observed in bipolar disorder, including episodes of bipolar depression (Isomura et al., 2016; Liu et al., 2012; Lee et al., 2010). Listening to an instrumental piece of music by 19 people with diagnosed unipolar depression caused an increase in gamma wave activity in the prefrontal area. This result suggests that such an intervention can modulate cortical activity, which potentially indicates the therapeutic effect of music on brain function in depression (Mosabbir et al., 2022). The analysis of gamma and delta bands shows increased gamma activity in patients with MDD, especially in response to emotional stimuli. Other authors, on the other hand, observed a reduced resting gamma density in people with depression, which may indicate a reduced activity of tonic processes in the anterior regions of the cingulate gyrus (Akdemir Akar et al., 2015). Individuals with MDD exhibited significantly increased current density in the delta, theta, alpha, beta1, and beta2 frequency bands compared to control subjects in the anterior cingulate cortex and prefrontal cortex (Korb et al., 2008). Roemer et al., on the other hand, used traditional EEG to examine elderly people diagnosed with depression. The patients were observed to have lower delta values and higher theta wave values, which has also been noted by other researchers, as shown in Table 1 (Roemer et al., 1992).
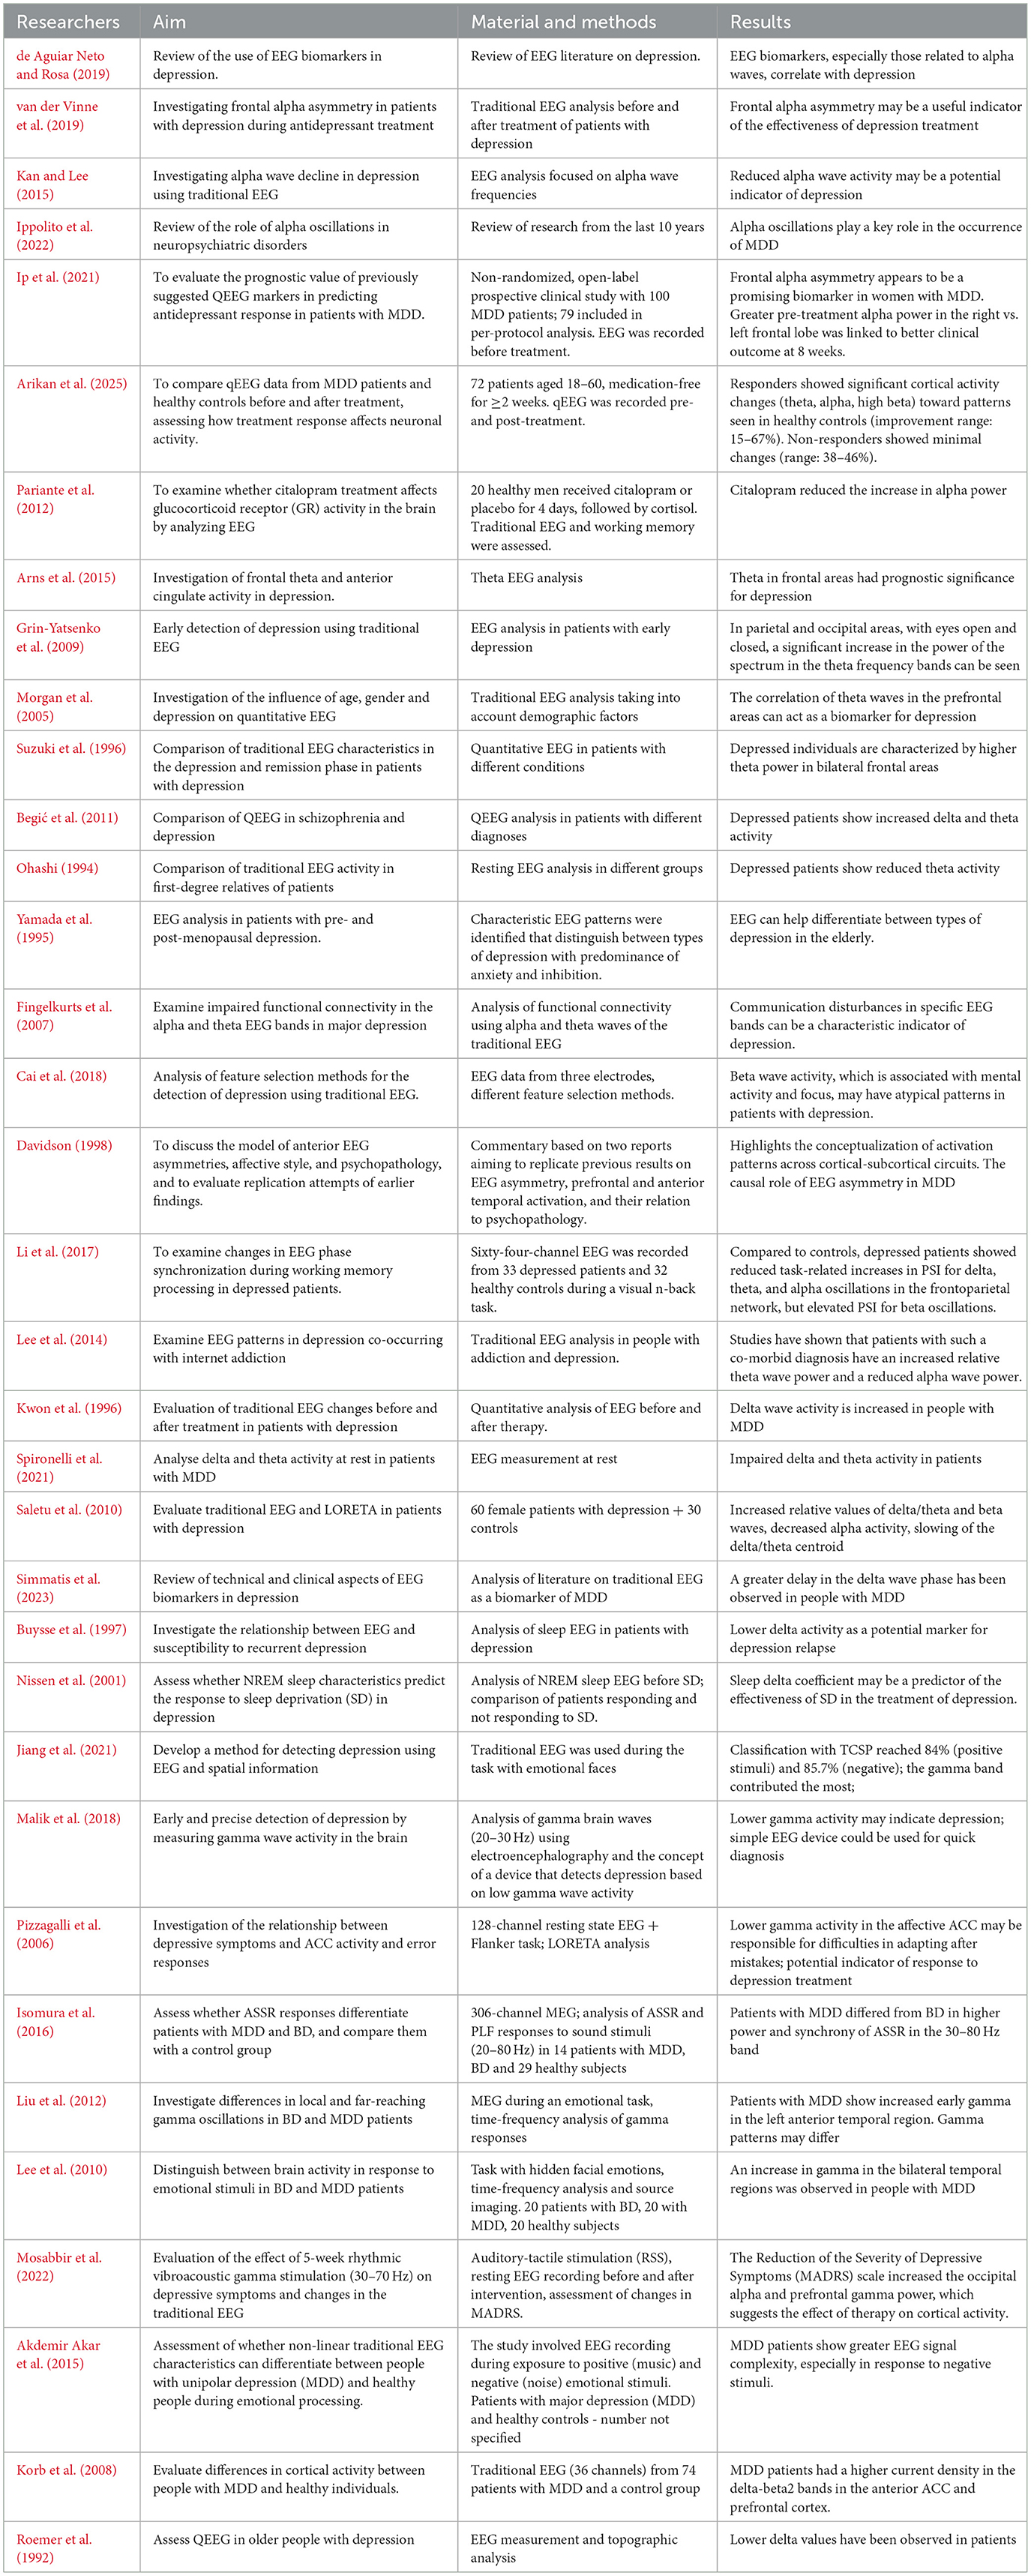
Table 1. Summary of EEG frequency domain analysis findings in major depressive disorder.
3.2 Asymmetry analysis
One of the frequently studied anomalies in MDD using EEG is asymmetry in brain activity, particularly in the alpha wave range. The researchers suggests that the relative difference between the left and right frontal brain regions in alpha wave activity may be a predictor of depression vulnerability. Withdrawal and negative behaviors are often related to high levels of right cortical activity, while positive reactions and mood have been related to increased left cortical activity. Therefore, frontal alpha asymmetry (FAA), with greater right-sided frontal activity, may be an important biomarker in diagnosing depression and anxiety (Barros et al., 2022). Alessandra Monni et al. analyzed a latent factorial approach to measure FAA. The research was conducted among 139 non-clinical participants. The authors distinguished a frontal alpha asymmetry factor (FAAf) and a parietal factor (PAAf) subjecting all asymmetry indices to a varimax-rotated, principal component analysis. Next the researchers explored among others the associations of latent factor and raw FAA scores with symptoms of depression and anxiety to determine which correlations were driven by FAA after variance from parietal activity was removed. Next, after correcting for false discovery rate, it turned out that only FAAf at the low alpha band was negatively correlated with depression symptoms (a latent CES-D factor) and significantly diverged from PAAf's association with depressive disorder. Therefore, the latent factor approach indicates beneficial effects for isolating functionally distinct resting-state EEG signatures (Monni et al., 2022).
The studies conducted by Ambrish Dharmadhikari et al. among 24 participants with Mild Depression indicates that results by measuring of FAA at resting stage was inconsistent. Researchers suggesting that it is necessary to revisit our approach from conventional search of diagnostic marker. Frontal Alpha Asymmetry might reflect component of depression but not the syndrome depressive disorder (Dharmadhikari et al., 2019). In turn, the meta-analysis by Luo et al., which includes 23 studies involving over 1,900 patients with MDD, showed that frontal alpha asymmetry measured with traditional EEG has a limited but statistically significant diagnostic value, which may support the clinical assessment of depression (Luo et al., 2025). It should be noted that frontal alpha asymmetry recorded during emotional stimulus processing differentiates individuals with MDD from healthy subjects more effectively than measurements taken at rest (Stewart et al., 2014; Périard et al., 2024). Arns et al. also investigated whether alpha wave asymmetry in the occipital and frontal regions of the brain could distinguish between outpatients with MDD and healthy individuals, assess the predictive power for antidepressant treatment outcomes, and account for the influence of gender on these relationships. The results did not show significant differences in alpha wave levels in the occipital and frontal cortex. However, for FAA, a specific interaction effect between gender and the type of medication used was observed. The findings suggest that future research on EEG alpha markers in depression should stratify participants by gender (Arns et al., 2016). Many researchers indicate a link between depression and EEG asymmetry, especially in the alpha and theta wave ranges in the frontal regions. In a study aimed at comparing the occurrence of regional brain asymmetries in severe depression with or without anxiety disorders, traditional EEG analysis of 44 patients revealed alpha asymmetry in individuals with MDD, indicating lower activation in the right posterior region compared to the left posterior region (Bruder et al., 1997). Another study showed that EEG spectral asymmetry (SA)—based on differences in power across frequency bands and their sources—differentiated women with depression from healthy individuals. This suggests that SA may serve as a useful marker of treatment outcome specifically in female patients (Hinrikus et al., 2010).
Abnormalities in traditional EEG activity are associated with various mental disorders, including depression, suicide and aggression. An EEG study conducted by Graae F. et al. showed differences in alpha wave asymmetry compared to the control group. Alpha asymmetry in the posterior regions of the brain was associated with suicidal ideation, but not with the severity of depression. The results suggest reduced activation of the left posterior brain as a factor associated with suicidal or aggressive behavior (Graae et al., 1996). Also, a reduction in the power of alpha wave activity in the left frontal lobe, which plays a key role in coping with emotional stress, may contribute to suicidal tendencies (Rasouli et al., 2024). This was also noted by Roh et al., who observed a reduced alpha wave power in the left frontal lobe in patients with MDD with suicidal thoughts compared to patients with MDD without such thoughts. Therefore, it can be seen that suicidal thoughts are an important moderator of alpha wave asymmetry in the frontal part of the brain in patients with MDD, as shown in Table 2 (Roh et al., 2020).
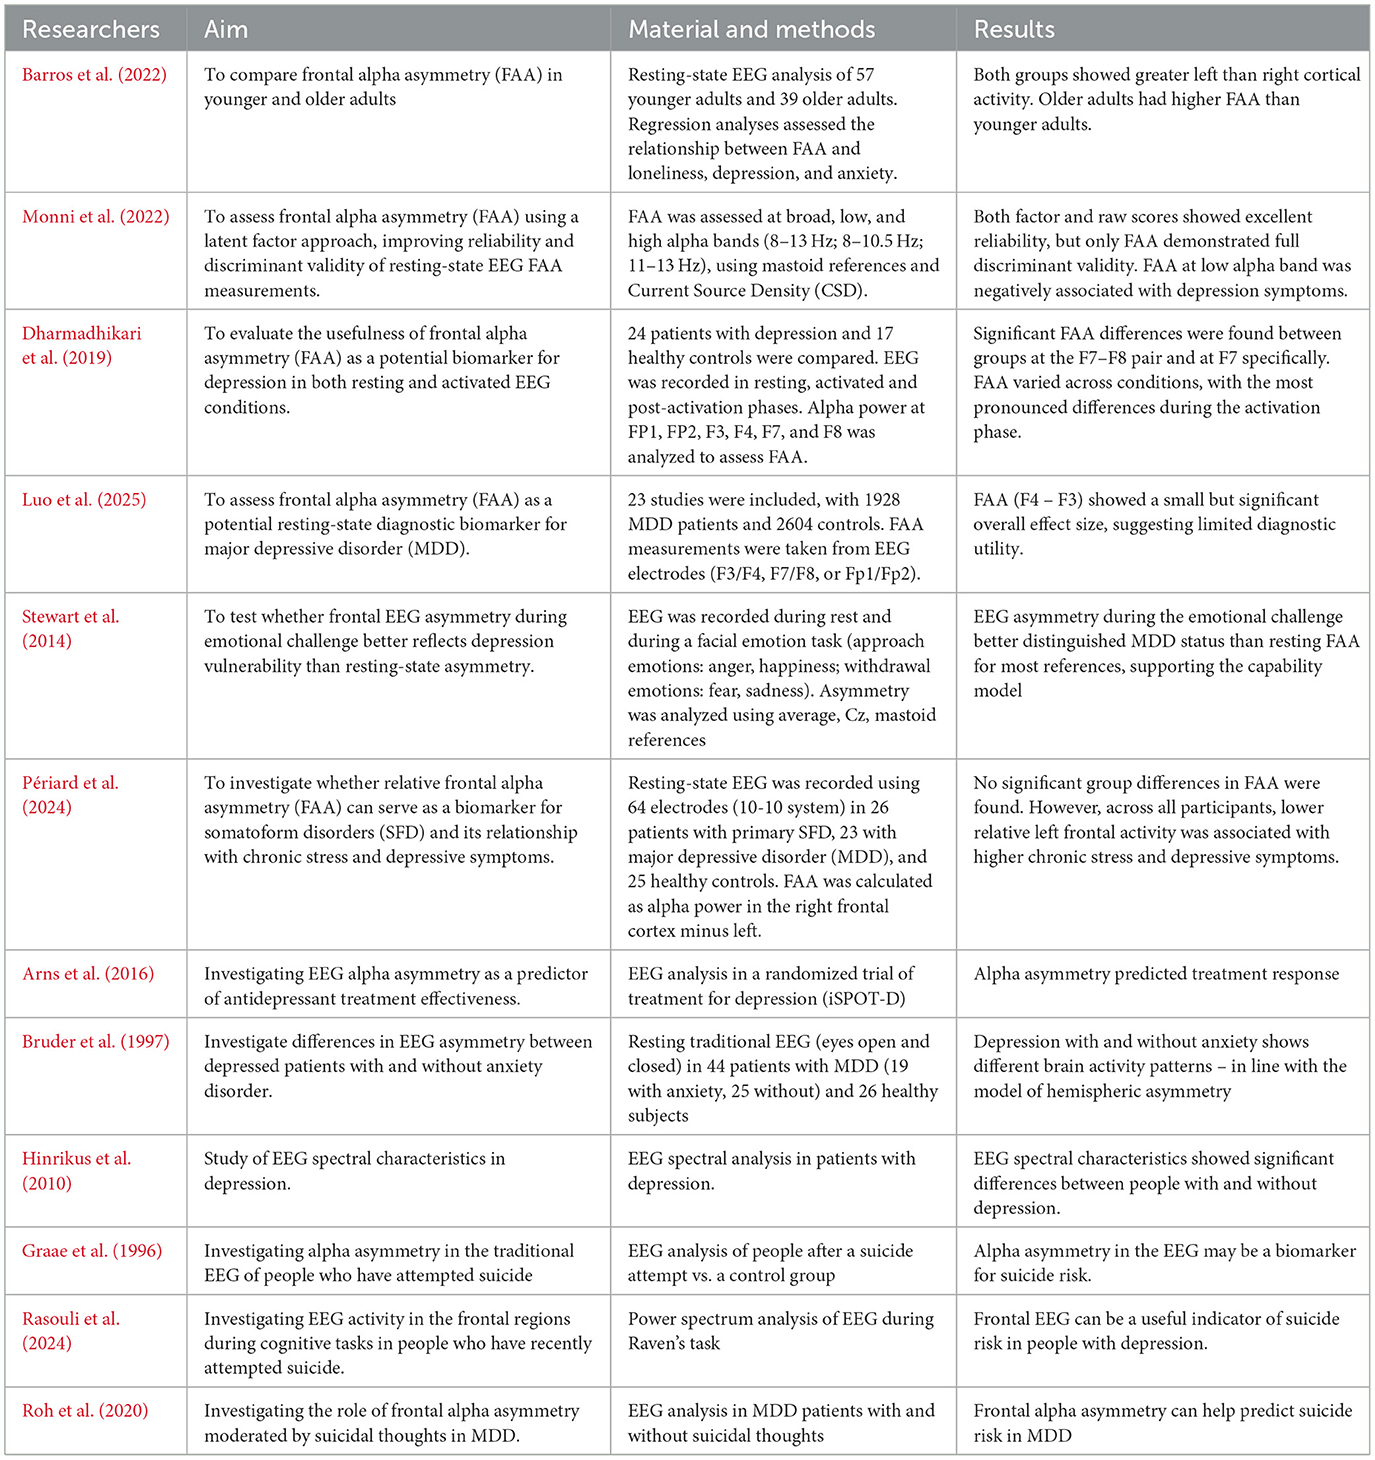
Table 2. Summary of EEG asymmetry analysis in patients with major depressive disorder.
3.3 Functional connectivity analysis
Functional connectivity refers to the statistical relationships between EEG signals recorded from different brain regions, allowing for the assessment of the degree of their mutual synchronization and functional integration (Smailovic and Jelic, 2019).
Studies indicate that patients with depression may exhibit abnormalities in EEG signal coherence, particularly in high-frequency bands. In one experiment, Li et al. compared a group of healthy individuals and patients with MDD during an emotional face recognition task. The patient group showed significantly higher gamma-band coherence compared to healthy participants (Li et al., 2015). Similar results were observed in a study analyzing activity in the 35–45 Hz range among healthy individuals, those with depression, and those with schizophrenia—individuals with depression demonstrated increased gamma wave activity throughout the emotional task (Siegle et al., 2010). In addition to task-related activity, resting-state EEG also provides valuable diagnostic insights. In a study by Sun et al., the Phase Lag Index (PLI) was used to assess resting-state functional connectivity. The results showed that patients with depression had significantly disrupted intrahemispheric connectivity, particularly in the left hemisphere. The application of PLI achieved a classification accuracy of 82.3%, indicating its potential as a biomarker for MDD (Sun et al., 2020). Changes in connectivity are also observed during pharmacological treatment. Studies have shown that MDD patients who respond poorly to SSRI treatment exhibit stronger connectivity in the right frontotemporal network within the delta and theta bands (Lee et al., 2011). On the other hand, serotonin-norepinephrine reuptake inhibitors (SNRIs) tend to reduce theta-band coherence (Bares et al., 2008; Cook et al., 2002; Bares et al., 2015). In a review of studies, Armitage highlighted that individuals with depression show reduced interhemispheric coherence, particularly during sleep. The authors point out that computer-assisted EEG analysis can detect subtle changes in neural communication patterns that may underlie depressive symptoms and treatment outcomes, as shown in Table 3 (Armitage, 1995).
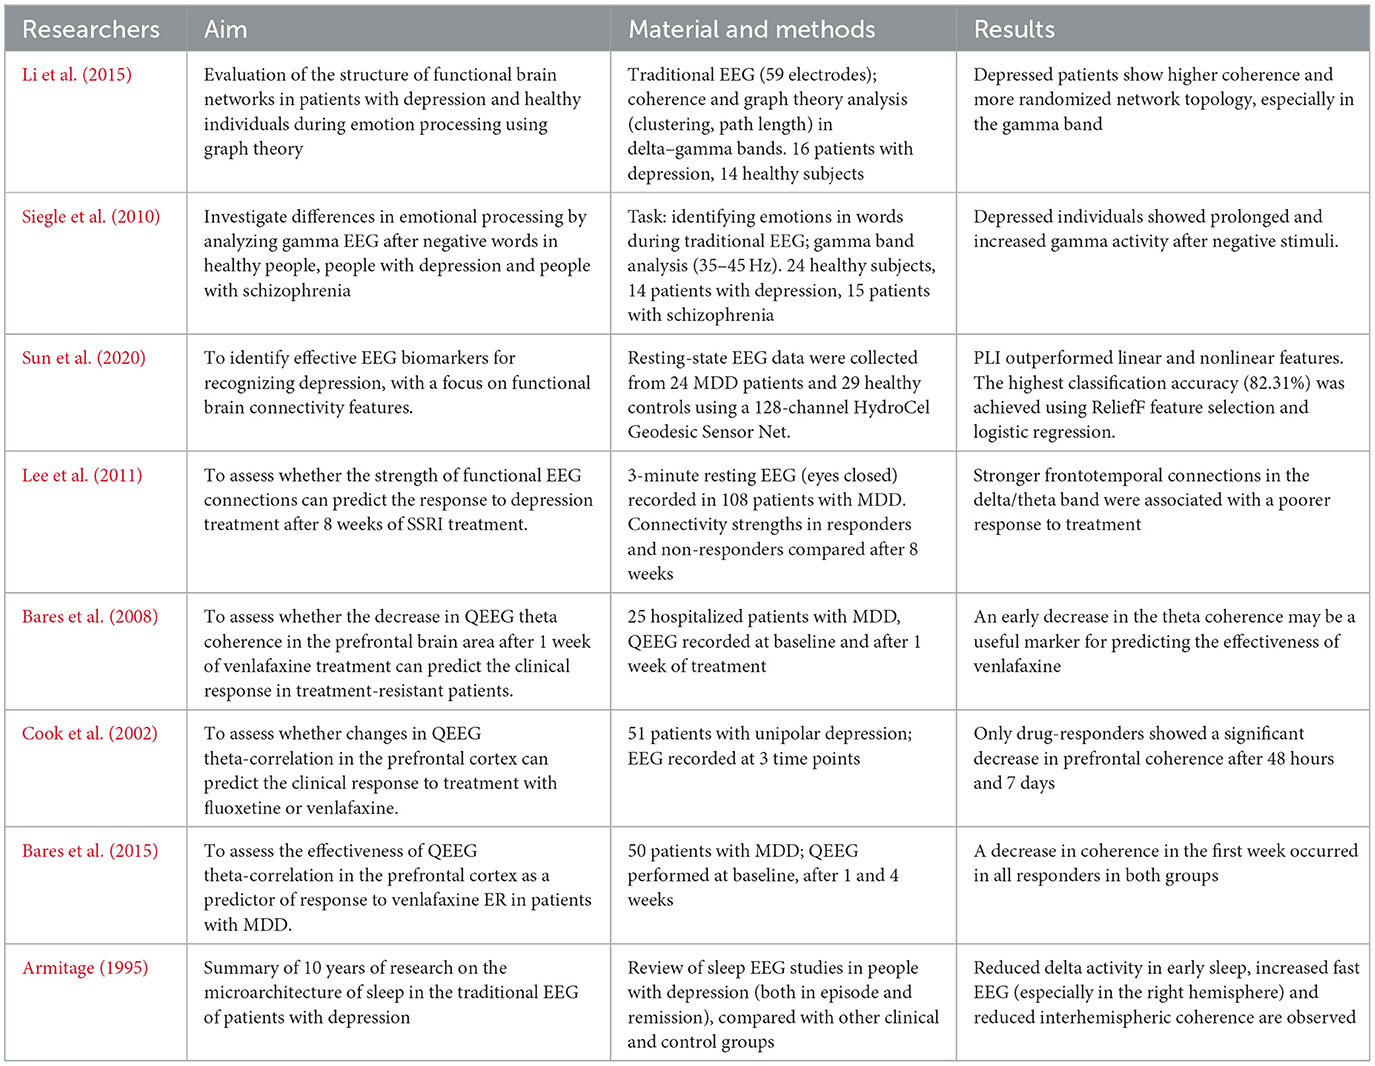
Table 3. Summary of functional connectivity analysis findings in major depressive disorder.
3.4 Spatial analysis, machine learning
Source mapping of the brain's electrical activity responsible for the distribution of potentials on the scalp allows for the mathematical solution of the EEG inverse problem. One of the popular methods used is LORETA—a functional imaging technique that estimates the cortical sources of EEG signals in a three-dimensional brain model (Smailovic and Jelic, 2019). In depression, patients show reduced source current density in the left hemisphere. Differences in brain volume distribution are observed in the delta band, which is characterized by increased source current density, suggesting specific alterations in brain activity in this patient group (Flor-Henry et al., 2004). Bachmann and Lass identified EEG-based biomarkers of depression using a combination of two analysis methods: the linear Spectral Asymmetry Index (SASI) and the nonlinear Detrended Fluctuation Analysis (DFA). Results showed the most significant differences in SASI values in channel Pz and DFA values in channels Pz and O2, indicating that analyzing signals from a single parietal channel using these parameters may enable high classification accuracy between healthy individuals and those with depression (Bachmann et al., 2017). Additionally, patients with MDD exhibit higher Lempel-Ziv complexity (LZC) and lower power spectral density (PSD). The highest classification accuracy (up to 92.4%) was observed in the frontal, temporal, and central sources (Yang et al., 2023).
One study involving 36 participants analyzed brain activity changes before and after 12 weeks of antidepressant pharmacotherapy. It demonstrated that responders had lower multiscale entropy (MSE) at small scales and higher MSE at large scales, particularly in the fronto-central region (Jaworska et al., 2017). Korb et al. examined 74 individuals using 36-channel EEG and found significantly increased values in the delta, theta, alpha, beta1, and beta2 frequency bands in the anterior cingulate cortex and prefrontal cortex of patients with depression compared to the control group (Korb et al., 2008). In another study, Li et al. examined individuals with MDD using Event-Related Potential (ERP) measurements at frontotemporal sites. The results suggested that depressed participants had lower P300 amplitudes and significant differences in both fast and slow neural responses in the frontal and parietal lobes (Li et al., 2023). Bilateral projections of frontal activity and right parietotemporal activity were observed in participants with depression and comorbid disorders (Mathersul et al., 2008). It is worth noting that the use of simple EEG methods in combination with machine learning may serve as an effective diagnostic aid for depression. Ahmadlou et al. observed that individuals suffering from depression exhibit elevated gamma wave values in the frontal region. Their study also used Higuchi's fractal dimension (HFD) and Katz's fractal dimension (KFD) analyses (Ahmadlou et al., 2012). In another study, a simple 3-channel EEG system combined with linear and non-linear feature analysis and machine learning algorithms enabled discrimination between depressed and healthy individuals with a maximum classification accuracy of 76.4%, offering a potentially effective and accessible diagnostic tool for depression (Cai et al., 2018). In the study by Cai Hanshu et al., an EEG with three electrodes was used, placed at the points Fp1, Fp2 and Fpz. The collected data was analyzed using machine-learning based soft computing techniques. This approach enables automated QEEG signal denoising and categorization and in the cited study K-Nearest Neighbor (KNN), Support Vector Machine (SVM), Approximate Nearest Neighbor (ANN) and Deep Belief Network (DBN) classifying algorithms were used. The results showed that the DBN method outperformed traditional approaches using shallow algorithms. In addition, the researchers suggest that the absolute power of beta waves is one of the helpful indicators for detecting depression (Cai et al., 2016). Li et al. also noted after conducting an analysis that the average classification accuracy for the beta band was higher than for the alpha and theta bands in patients with depression which suggests that the beta band may be more suitable for machine-learning based detection of MDD features in QEEG than the other bands. However, this study was performed in individuals with mild form of depression, making its conclusion not necessarily applicable to MDD subjects (Li et al., 2019).
Traditional EEG studies conducted during depression treatment increasingly highlight characteristic changes in brain activity patterns influenced by different forms of pharmacotherapy. Analyzing these changes helps to better understand the neurophysiological mechanisms of antidepressant medications and identify potential markers of therapeutic efficacy (Leuchter et al., 2009a). Bruder et al. also observed that SSRI treatment resulted in increased alpha power among responders, particularly in the occipital region (Bruder et al., 2008). Detailed spatial EEG features and machine learning applications are presented in Table 4.
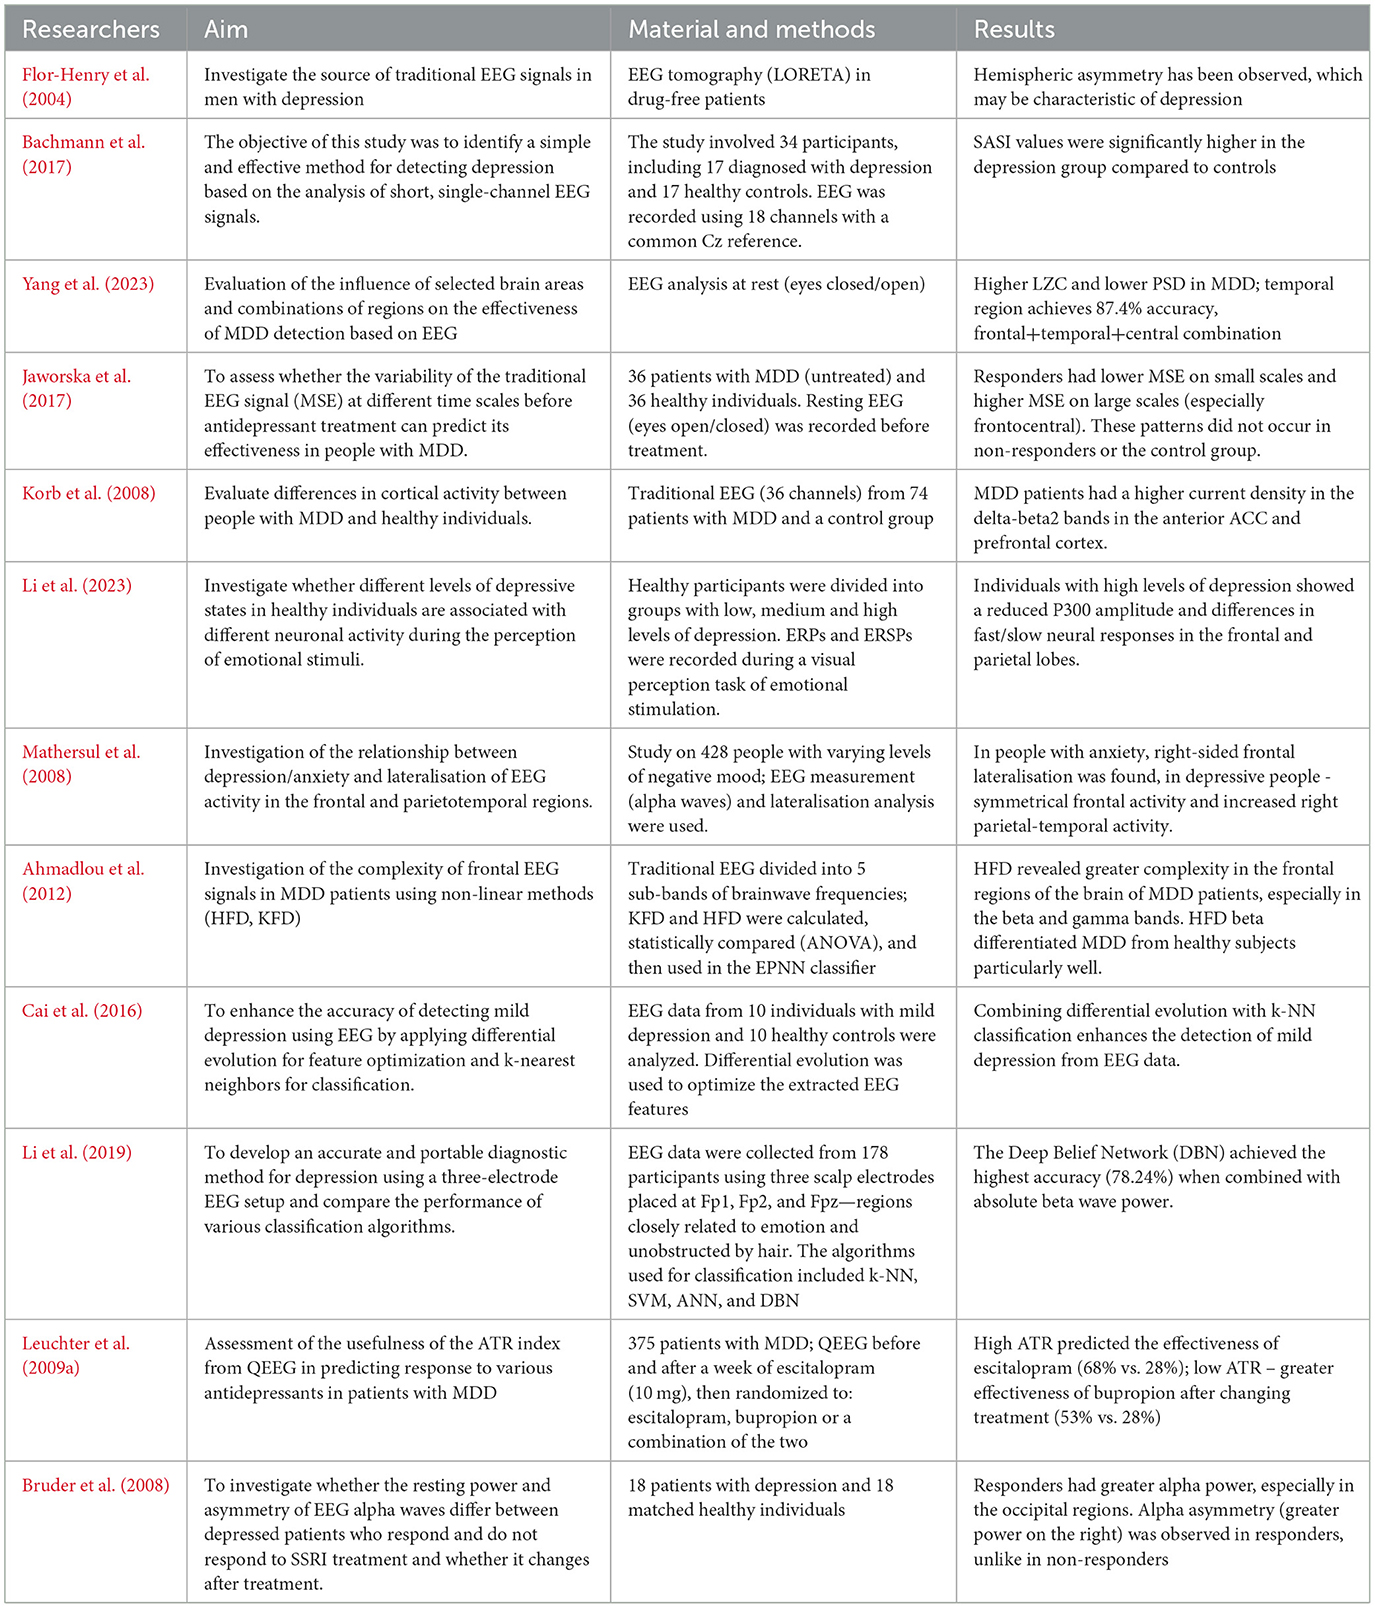
Table 4. Spatial EEG features and machine learning applications in the diagnosis of depression.
4 Discussion
4.1 Summary of main findings
Depressive disorders are among the most commonly diagnosed mental disorders worldwide, but they remain difficult to diagnose accurately, especially in cases with a mild or atypical course. Current traditional diagnostic methods, which rely on clinical interviews and rating scales, are prone to errors due to subjective opinion. Therefore, they do not provide a complete picture of the neurobiological basis of depression. For this reason, increasing attention is now being paid to objective methods which include the analysis of bioelectrical brain activity by means of EEG and QEEG (Kopańska et al., 2023; Williams, 1954).
This article analyses the results of a study that looked for patterns of brain wave activity characteristic of patients with major depression. The analysis focuses on specific EEG bands which include alpha, beta, theta, delta and gamma waves. The most common phenomenon observed by other researchers was the asymmetry of alpha waves in the prefrontal regions (with dominant activity on the right side), which seems to be related to the severity of depressive symptoms and the presence of suicidal thoughts (Graae et al., 1996; Rasouli et al., 2024; Roh et al., 2020). In the case of waves, their increased activity has been shown in some studies to be a positive predictor of response to treatment, especially drug treatment (Grin-Yatsenko et al., 2009; Suzuki et al., 1996). In contrast, gamma waves, which are associated with the integration of cognitive and emotional information, tend to decrease in patients with MDD (Jiang et al., 2021; Malik et al., 2018; Pizzagalli et al., 2006; Akdemir Akar et al., 2015).
It is worth noting that the results of traditional EEG studies in depression are not entirely consistent (Arns et al., 2015). An additional complication is that many studies rely on small samples and different analytical techniques (including band power analysis, coherence, source activity mapping and non-linear indices). Despite these limitations, EEG/QEEG has not only diagnostic but also prognostic potential. Changes in specific wavebands prior to treatment can serve as predictors of treatment efficacy—for example, higher theta activity and lower gamma activity prior to SSRI treatment were associated with better response to pharmacotherapy (Leuchter et al., 2009a). Schiller noted that the use of QEEG in depressed patients may help to adjust pharmacotherapy, especially in treatment-resistant cases (Schiller, 2019). Additionally, the increasing importance of combining QEEG with advanced computational tools, such as machine learning algorithms or signal source localization methods, deserves special attention. These approaches not only improve the accuracy of classification between MDD patients and controls, but also open new perspectives for medicine in psychiatry (Cai et al., 2018; Ahmadlou et al., 2012). In conclusion, quantitative electroencephalography is a promising tool to aid the diagnosis of depression.
5 Restrictions
Despite the interesting results obtained, this study has certain limitations that should be taken into account when interpreting the data. First, the source studies analyzed in this review differed significantly in terms of methodology, making it difficult to directly compare the results. Variability concerned both the study populations (age, gender, severity of depressive symptoms, presence of comorbidities) and the technical parameters of QEEG number and placement of electrodes, recording conditions, signal length. Secondly, some of the studies analyzed were based on small groups of participants, which limits the possibility of generalizing the results to the general population. It is also worth noting that not all studies took into account the control of significant confounding variables, such as the use of psychotropic drugs, which can affect EEG activity. In addition, it is worth noting that most studies are cross-sectional, which limits the possibility of drawing causal conclusions. Further studies with a large number of participants and standardized protocols for quantitative electroencephalography recording are needed to better understand the role of bioelectrical brain activity patterns in depression.
6 Conclusion
Based on the studies and literature analyzed in this study, it appears that the treatment of depression requires an interdisciplinary approach combining pharmacotherapy, psychotherapy and advanced diagnostic techniques. Therefore, research on biomarkers of depression can open new perspectives for personalized medicine, offering the possibility of tailoring therapy to the individual needs of the patient. After analyzing the available publications, it can be seen that quantitative electroencephalography and traditional EEG examination are promising tools in the diagnosis and monitoring of depression. The data collected in this study indicate that the analysis of bioelectric brain activity can provide valuable information on specific neurophysiological changes associated with depression. The results of the study suggest that abnormalities in brainwave frequency bands – especially alpha wave asymmetry, increased beta activity and changes in the theta and delta waves – may be potential biomarkers for depression. Some studies have shown that selected EEG and QEEG parameters can distinguish individuals with depression from healthy controls with high accuracy—for example, the use of the Phase Lag Index (PLI) achieved a classification accuracy of over 80%. Despite these promising results, there is still a lack of standardized procedures and analysis protocols, which limits the practical application of these methods in clinical diagnostics.
Author contributions
MK: Methodology, Supervision, Writing – original draft, Conceptualization. DO: Data curation, Writing – original draft, Formal analysis. IS: Methodology, Writing – review & editing. OB: Writing – review & editing, Formal analysis. JS: Project administration, Writing – original draft, Investigation.
Funding
The author(s) declare that no financial support was received for the research and/or publication of this article.
Conflict of interest
The authors declare that the research was conducted in the absence of any commercial or financial relationships that could be construed as a potential conflict of interest.
Generative AI statement
The author(s) declare that no Gen AI was used in the creation of this manuscript.
Publisher's note
All claims expressed in this article are solely those of the authors and do not necessarily represent those of their affiliated organizations, or those of the publisher, the editors and the reviewers. Any product that may be evaluated in this article, or claim that may be made by its manufacturer, is not guaranteed or endorsed by the publisher.
Abbreviations
ANN, approximate nearest neighbor; DBN, deep belief network; DSM-5, diagnostic and statistic manual of mental disorders, fifth edition; EEG, electroencephalography; MDD, major depressive disorder; KNN, K-nearest neighbor; QEEG, quantitative electroencephalography; SVM, support vector machine; WHO, World Health Organization.
References
Ahmadlou, H., Adeli, H., and Adeli, A. (2012). Fractality analysis of frontal brain in major depressive disorder. Int. J. Psychophysiol. 85, 206–211. doi: 10.1016/j.ijpsycho.2012.05.001
Akdemir Akar, S., Kara, S., Agambayev, S., and Bilgiç, V. (2015). Nonlinear analysis of EEGs of patients with major depression during different emotional states. Comput. Biol. Med. 67, 49–60. doi: 10.1016/j.compbiomed.2015.09.019
Anderson, G. (2016). Editorial: the kynurenine and melatonergic pathways in psychiatric and CNS disorders. Curr. Pharm. Des. 22, 947–948. doi: 10.2174/1381612822999160104143932
Anderson, R. J., Freedland, K. E., Clouse, R. E., and Lustman, P. J. (2001). The prevalence of comorbid depression in adults with diabetes: a meta-analysis. Diabetes Care 24, 1069–1078. doi: 10.2337/diacare.24.6.1069
Arikan, M. K, Gica, S., Ilhan, R., Orhan, Ö., Kalaba, Ö., and Günver, M. G. (2025). Monitoring the response of treatment in major depressive disorder with EEG: could it be an indicator of returning to health in responders. Clin. EEG Neurosci. doi: 10.1177/15500594241310949
Armitage, R. (1995). Microarchitectural findings in sleep EEG in depression: diagnostic implications. Biol. Psychiatry 37, 72–84. doi: 10.1016/0006-3223(Cai et al., 2016)00082-E
Arns, M., Bruder, G., Hegerl, U., Spooner, C., Palmer, D. M., Etkin, A., et al. (2016). EEG alpha asymmetry as a gender-specific predictor of outcome to acute treatment with different antidepressant medications in the randomized iSPOT-D study. Clin. Neurophysiol. 127, 509–519. doi: 10.1016/j.clinph.2015.05.032
Arns, M., Etkin, A., Hegerl, U., Fallahpour, K., Frodl, T., Gatt, J. M., et al. (2015). Frontal and rostral anterior cingulate (rACC) theta EEG in depression: implications for treatment outcome? Eur. Neuropsychopharmacol. 25, 1190–1200. doi: 10.1016/j.euroneuro.2015.03.007
Bachmann, M., Lass, J., and Hinrikus, H. (2017). Single-channel EEG analysis for detection of depression. Biomed. Signal Process Control 31, 391–397. doi: 10.1016/j.bspc.2016.09.010
Bares, M., Brunovsky, M., Kopecek, M., Novak, T., Stopkova, P., Kozeny, J., et al. (2008). Early reduction in prefrontal theta QEEG cordance value predicts response to venlafaxine treatment in patients with resistant depressive disorder. Eur. Psychiatry 23, 350–355. doi: 10.1016/j.eurpsy.2008.03.001
Bares, M., Brunovsky, M., Novak, T., Kopecek, M., Stopkova, P., Sos, P., et al. (2015). QEEG theta cordance in the prediction of treatment outcome to prefrontal repetitive transcranial magnetic stimulation or venlafaxine ER in patients with major depressive disorder. Clin. EEG Neurosci. 46, 73–80. doi: 10.1177/1550059413520442
Barros, C., Pereira, A. R., Sampaio, A., Buján, A., and Pinal, D. (2022). Frontal alpha asymmetry and negative mood: a cross-sectional study in older and younger adults. Symmetry 14:1579. doi: 10.3390/sym14081579
Begić, D., Popović-Knapić, V., Grubišin, J., Kosanović-Rajačić, B., Filipčić, I., Telarović, I., et al. (2011). Quantitative electroencephalography in schizophrenia and depression. Psychiatr. Danub. 23, 355–362.
Berntson, J., Patel, J. S., and Stewart, J. C. (2017). Number of recent stressful life events and incident cardiovascular disease: moderation by lifetime depressive disorder. J. Psychosom. Res. 99, 149–154. doi: 10.1016/j.jpsychores.2017.06.008
Bobińska, K., Szemraj, J., Czarny, P., and Gałecki, P. (2016). Role of MMP-2, MMP-7, MMP-9, and TIMP-2 in the development of recurrent depressive disorder. J. Affect. Disord. 205, 119–129. doi: 10.1016/j.jad.2016.03.068
Boby, K., and Veerasingam, S. (2025). Depression diagnosis: EEG-based cognitive biomarkers and machine learning. Behav. Brain Res. 478:115325. doi: 10.1016/j.bbr.2024.115325
Bruder, G. E., Fong, R., Tenke, C. E., Leite, P., Towey, J. P., Stewart, J. E., et al. (1997). Regional brain asymmetries in major depression with or without an anxiety disorder: a quantitative electroencephalographic study. Biol. Psychiatry 41, 939–948. doi: 10.1016/S0006-3223(96)00260-0
Bruder, G. E., Sedoruk, J. P., Stewart, J. W., McGrath, P. J., Quitkin, F. M., Tenke, C. E., et al. (2008). Electroencephalographic alpha measures predict therapeutic response to a selective serotonin reuptake inhibitor antidepressant: pre- and post-treatment findings. Biol. Psychiatry 63, 1171–1177. doi: 10.1016/j.biopsych.2007.10.009
Buysse, D. J., Frank, E., Lowe, K. K., Cherry, C. R., and Kupfer, D. J. (1997). Electroencephalographic sleep correlates of episode and vulnerability to recurrence in depression. Biol. Psychiatry 41, 406–418. doi: 10.1016/S0006-3223(96)00041-8
Cai, H., Chen, Y., Han, J., and Hu, B. (2018). Study on feature selection methods for depression detection using three-electrode EEG data. Interdiscip. Sci. Comput. Life Sci. 10, 558–565. doi: 10.1007/s12539-018-0292-5
Cai, H., Sha, X., Han, X., Wei, S., and Hu, B. (2016). “Pervasive EEG diagnosis of depression using Deep Belief Network with three-electrodes EEG collector,” in 2016 IEEE International Conference on Bioinformatics and Biomedicine (BIBM) (Shenzhen: IEEE), 1239–1246. doi: 10.1109/BIBM.2016.7822696
Carney, R. M. (2017). Depression and coronary heart disease. Nat. Rev. Cardiol. 14, 145–155. doi: 10.1038/nrcardio.2016.181
Cook, I. A., Leuchter, A. F., Morgan, M., Witte, E., Stubbeman, W. F., Abrams, M., et al. (2002). Early changes in prefrontal activity characterize clinical responders to antidepressants. Neuropsychopharmacology 27, 120–131. doi: 10.1016/S0893-133X(02)00294-4
Davidson, R. J. (1998). Anterior electrophysiological asymmetries, emotion, and depression: conceptual and methodological conundrums. Psychophysiology 35, 607–614. doi: 10.1017/S0048577298000134
de Aguiar Neto, F. S., and Rosa, J. L. G. (2019). Depression biomarkers using non-invasive EEG: a review. Neurosci. Biobehav. Rev. 105, 83–93. doi: 10.1016/j.neubiorev.2019.07.021
Dehn, L. B., and Beblo, T. (2019). Verstimmt, verzerrt, vergesslich: Das Zusammenwirken emotionaler und kognitiver Dysfunktionen bei Depression. Neuropsychiatr. 33, 123–130. doi: 10.1007/s40211-019-0307-4
Deslandes, A., Veiga, H., Cagy, M., Fiszman, A., Piedade, R., Ribeiro, P., et al. (2004). Quantitative electroencephalography (qEEG) to discriminate primary degenerative dementia from major depressive disorder (depression). Arq. Neuropsiquiatr. 62, 44–50. doi: 10.1590/S0004-282X2004000100008
Dharmadhikari, A. S., Jaiswal, S. V., Tandle, A. L., Sinha, D., and Jog, N. (2019). Study of frontal alpha asymmetry in mild depression: a potential biomarker or not? J. Neurosci. Rural. Pract. 10, 250–255. doi: 10.4103/jnrp.jnrp_293_18
Durisko, Z., Mulsant, B. H., and Andrews, P. W. (2015). An adaptationist perspective on the etiology of depression. J. Affect. Disord. 172, 315–323. doi: 10.1016/j.jad.2014.09.032
Fingelkurts, A. A., and Fingelkurts, A. A. (2022). Quantitative electroencephalogram (qEEG) as a natural and non-invasive window into living brain and mind in the functional continuum of healthy and pathological conditions. Appl. Sci. 12:9560. doi: 10.3390/app12199560
Fingelkurts, A. A., Fingelkurts, A. A., Rytsälä, H., Suominen, K., Isometsä, E., Kähkönen, S., et al. (2007). Impaired functional connectivity at EEG alpha and theta frequency bands in major depression. Hum. Brain Mapp. 28, 247–261. doi: 10.1002/hbm.20275
Flor-Henry, P., Lind, J. C., and Koles, Z. J. A. (2004). source-imaging (low-resolution electromagnetic tomography) study of the EEGs from unmedicated males with depression. Psychiatry Res. Neuroimaging 130, 191–207. doi: 10.1016/j.pscychresns.2003.08.006
Ghiasi, S., Dell'Acqua, C., Benvenuti, S. M., Scilingo, E. P., Gentili, C., Valenza, G., et al. (2021). “Classifying subclinical depression using EEG spectral and connectivity measures,” in Proceedings of the 43rd Annual International Conference of the IEEE Engineering in Medicine & Biology Society (EMBC) (Mexico: IEEE), 2050–2053. doi: 10.1109/EMBC46164.2021.9630044
Graae, F., Tenke, C., Bruder, G., Rotheram, M. J., Piacentini, J., Castro-Blanco, D., et al. (1996). Abnormality of EEG alpha asymmetry in female adolescent suicide attempters. Biol. Psychiatry 40, 706–713. doi: 10.1016/0006-3223(95)00493-9
Grin-Yatsenko, V. A., Baas, I., Ponomarev, V. A., and Kropotov, J. D. E. E. G. (2009). power spectra at early stages of depressive disorders. J. Clin. Neurophysiol. 26, 401–406. doi: 10.1097/WNP.0b013e3181c298fe
Hansson, P. B., Murison, R., Lund, A., and Hammar, Å. (2015). Cognitive functioning and cortisol profiles in first episode major depression. Scand. J. Psychol. 56, 379–383. doi: 10.1111/sjop.12230
Hinrikus, H., Suhhova, A., Bachmann, M., Aadamsoo, K., Võhma, Ü., Pehlak, H., et al. (2010). Spectral features of EEG in depression. Biomed. Eng. 55, 155–161. doi: 10.1515/bmt.2010.011
Ip, C. T., Olbrich, S., Ganz, M., Ozenne, B., Köhler-Forsberg, K., Dam, V. H., et al. (2021). Pretreatment qEEG biomarkers for predicting pharmacological treatment outcome in major depressive disorder: independent validation from the NeuroPharm study. Euro. Neuropsychopharmacol. 49, 101–112. doi: 10.1016/j.euroneuro.2021.03.024
Ippolito, G., Bertaccini, R., Tarasi, L., Di Gregorio, F., Trajkovic, J., Battaglia, S., et al. (2022). The role of alpha oscillations among the main neuropsychiatric disorders in the adult and developing human brain: evidence from the last 10 years of research. Biomedicines 10:3189. doi: 10.3390/biomedicines10123189
Isomura, S., Onitsuka, T., Tsuchimoto, R., Nakamura, I., Hirano, S., Oda, Y., et al. (2016). Differentiation between major depressive disorder and bipolar disorder by auditory steady-state responses. J. Affect. Disord. 190, 800–806. doi: 10.1016/j.jad.2015.11.034
Jaworska, N., Wang, H., Smith, D. M., Blier, P., Knott, V., Protzner, A. B., et al. (2017). Pre-treatment EEG signal variability is associated with treatment success in depression. NeuroImage Clin. 17, 368–377. doi: 10.1016/j.nicl.2017.10.035
Jiang, C., Li, Y., Tang, Y., and Guan, C. (2021). Enhancing EEG-based classification of depression patients using spatial information. IEEE Trans. Neural. Syst. Rehabil. Eng. 29, 566–575. doi: 10.1109/TNSRE.2021.3059429
Kan, D. P. X., and Lee, P. F. (2015). “Decrease alpha waves in depression: an electroencephalogram (EEG) study,” in 2015 International Conference on BioSignal Analysis, Processing and Systems (ICBAPS) (Kuala Lumpur: IEEE), 156–161. doi: 10.1109/ICBAPS.2015.7292237
Kendler, K. S. (2016). The phenomenology of major depression and the representativeness and nature of DSM criteria. Am. J. Psychiatry 173, 771–780. doi: 10.1176/appi.ajp.2016.15121509
Kopańska, M., Rydzik, Ł., Błajda, J., Sarzyńska, I., Jachymek, K., Pałka, T., et al. (2023). The use of quantitative electroencephalography (QEEG) to assess post-COVID-19 concentration disorders in professional pilots: an initial concept. Brain Sci. 13:1264. doi: 10.3390/brainsci13091264
Korb, A. S., Kucharz, I. A., Hunter, A. M., and Leuchter, A. F. (2008). Brain electrical source differences between depressed subjects and healthy controls. Brain Topogr. 21, 138–146. doi: 10.1007/s10548-008-0070-5
Kwon, J. S., Youn, T., and Jung, H. Y. (1996). Right hemisphere abnormalities in major depression: quantitative electroencephalographic findings before and after treatment. J. Affect. Disord. 40, 169–173. doi: 10.1016/0165-0327(96)00057-2
Lee, J., Hwang, J. Y., Park, S. M., Jung, H. Y., Choi, S. W., Kim, D. J., et al. (2014). Differential resting-state EEG patterns associated with comorbid depression in Internet addiction. Prog. Neuropsychopharmacol. Biol. Psychiatry 50, 21–26. doi: 10.1016/j.pnpbp.2013.11.016
Lee, P. S., Chen, Y. S., Hsieh, J. C., Su, T. P., and Chen, L. F. (2010). Distinct neuronal oscillatory responses between patients with bipolar and unipolar disorders: a magnetoencephalographic study. J. Affect. Disord. 123, 270–275. doi: 10.1016/j.jad.2009.08.020
Lee, T. W., Wu, Y. T., Yu, Y. W., Chen, M. C., and Chen, T. J. (2011). The implication of functional connectivity strength in predicting treatment response of major depressive disorder: a resting EEG study. Psychiatry Res. Neuroimaging 194, 372–377. doi: 10.1016/j.pscychresns.2011.02.009
Leuchter, A. F., Cook, I. A., Gilmer, W. S., Marangell, L. B., Burgoyne, K. S., Howland, R. H., et al. (2009a). Effectiveness of a quantitative electroencephalographic biomarker for predicting differential response or remission with escitalopram and bupropion in major depressive disorder. Psychiatry Res. 169, 132–138. doi: 10.1016/j.psychres.2009.04.004
Leuchter, A. F., Cook, I. A., Hunter, A. M., Cai, C., and Horvath, S. (2012). Resting-state quantitative electroencephalography reveals increased neurophysiologic connectivity in depression. PLoS One 7:e32508. doi: 10.1371/journal.pone.0032508
Leuchter, A. F., Cook, I. A., Marangell, L. B., Gilmer, W. S., Burgoyne, K. S., Howland, R. H., et al. (2009b). Comparative effectiveness of biomarkers and clinical indicators for predicting outcomes of SSRI treatment in major depressive disorder: results of the BRITE-MD study. Psychiatry Res. 169, 124–131. doi: 10.1016/j.psychres.2009.06.004
Levenstein, S., Smith, M. W., and Kaplan, G. A. (2001). Psychosocial predictors of hypertension in men and women. Arch. Intern Med. 161, 1341–1346. doi: 10.1001/archinte.161.10.1341
Li, P., Yokoyama, M., Okamoto, D., Nakatani, H., and Yagi, T. (2023). Depressive states in healthy subjects lead to biased processing in frontal-parietal ERPs during emotional stimuli. Sci. Rep. 13:17175. doi: 10.1038/s41598-023-44368-0
Li, Y., Cao, D., Wei, L., Tang, Y., and Wang, J. (2015). Abnormal functional connectivity of EEG gamma band in patients with depression during emotional face processing. Clin. Neurophysiol. 126, 2078–2089. doi: 10.1016/j.clinph.2014.12.026
Li, Y., Hu, B., Zheng, X., and Li, X. (2019). EEG-based mild depressive detection using differential evolution. IEEE Access 7, 7814–7822. doi: 10.1109/ACCESS.2018.2883480
Li, Y., Kang, C., Wei, Z., et al. (2017). Beta oscillations in major depression - signalling a new cortical circuit for central executive function. Sci. Rep. 7:18021. doi: 10.1038/s41598-017-18306-w
Liu, T. Y., Hsieh, J. C., Chen, Y. S., Tu, P. C., Su, T. P., Chen, L. F., et al. (2012). Different patterns of abnormal gamma oscillatory activity in unipolar and bipolar disorder patients during an implicit emotion task. Neuropsychologia 50, 1514–1520. doi: 10.1016/j.neuropsychologia.2012.03.004
Luo, Y., Tang, M., and Fan, X. (2025). Meta-analysis of resting frontal alpha asymmetry as a biomarker of depression. NPJ Ment. Health Res. 4:2. doi: 10.1038/s44184-025-00117-x
Ma, L., and Li, Y. (2017). The effect of depression on sleep quality and the circadian rhythm of ambulatory blood pressure in older patients with hypertension. J. Clin. Neurosci. 39, 49–52. doi: 10.1016/j.jocn.2017.02.039
Malik, J., Dahiya, M., and Kumari, N. (2018). Brain wave frequency measurement in gamma wave range for accurate and early detection of depression. Int. J. Adv. Res. Innov. 6, 21–24. doi: 10.51976/ijari.611809
Mathersul, D., Williams, L. M., Hopkinson, P. J., and Kemp, A. H. (2008). Investigating models of affect: relationships among EEG alpha asymmetry, depression, and anxiety. Emotion 8, 560–572. doi: 10.1037/a0012811
McGregor, R. A., Cameron-Smith, D., and Poppitt, S. D. (2014). It is not just muscle mass: a review of muscle quality, composition and metabolism during ageing as determinants of muscle function and mobility in later life. Longev. Healthspan. 3:9. doi: 10.1186/2046-2395-3-9
Monni, A., Collison, K. L., Hill, K. E., Oumeziane, B. A., and Foti, D. (2022). The novel frontal alpha asymmetry factor and its association with depression, anxiety, and personality traits. Psychophysiology 59:e14109. doi: 10.1111/psyp.14109
Morgan, M. L., Witte, E. A., Cook, I. A., Leuchter, A. F., Abrams, M., Siegman, B., et al. (2005). Influence of age, gender, health status, and depression on quantitative EEG. Neuropsychobiology 52, 71–76. doi: 10.1159/000086608
Mosabbir, A. A., Braun Janzen, T., Al Shirawi, M., Rotzinger, S., Kennedy, S. H., Farzan, F., et al. (2022). Investigating the effects of auditory and vibrotactile rhythmic sensory stimulation on depression: an EEG pilot study. Cureus 14:e22557. doi: 10.7759/cureus.22557
Nissen, C., Feige, B., König, A., Voderholzer, U., Berger, M., Riemann, D., et al. (2001). Delta sleep ratio as a predictor of sleep deprivation response in major depression. J. Psychiatr. Res. 35, 155–163. doi: 10.1016/S0022-3956(01)00021-8
Ohashi, Y. (1994). (The baseline EEG traits and the induced EEG changes by chronic antidepressant medication in patients with major depression. Early prediction of clinical outcomes solely based on quantification and mapping of EEG). Seishin Shinkeigaku Zasshi 96, 444–460.
Pariante, C. M., Alhaj, H. A., Arulnathan, V. E., Gallagher, P., Hanson, A., Massey, E., et al. (2012). Central glucocorticoid receptor-mediated effects of the antidepressant, citalopram, in humans: a study using EEG and cognitive testing. Psychoneuroendocrinology 37, 618–628. doi: 10.1016/j.psyneuen.2011.08.011
Périard, I. A. C., Dierolf, A. M., Lutz, A., Vögele, C., Voderholzer, U., Koch, S., et al. (2024). Frontal alpha asymmetry is associated with chronic stress and depression, but not with somatoform disorders. Int. J. Psychophysiol. 200:112342. doi: 10.1016/j.ijpsycho.2024.112342
Pizzagalli, D. A., Peccoralo, L. A., Davidson, R. J., and Cohen, J. D. (2006). Resting anterior cingulate activity and abnormal responses to errors in subjects with elevated depressive symptoms: a 128-channel EEG study. Hum. Brain Mapp. 27, 185–201. doi: 10.1002/hbm.20172
Pollock, V. E, and Schneider, L. S. (1990). Quantitative, waking EEG research on depression. Biol. Psychiatry 27, 757–780. doi: 10.1016/0006-3223(90)90591-O
Rasouli, N., Malakouti, S. K., Bayat, M., Mahjoubnavaz, F., Fallahinia, N., Khosrowabadi, R., et al. (2024). Frontal activity of recent suicide attempters: EEG spectrum power performing Raven task. Clin. EEG Neurosci. 56, 140–149. doi: 10.1177/15500594241273125
Remes, O., Mendes, J. F., and Templeton, P. (2021). Biological, psychological, and social determinants of depression: a review of recent literature. Brain Sci. 11:1633. doi: 10.3390/brainsci11121633
Roemer, R. A., Shagass, C., Dubin, W., Jaffe, R., and Straumanis, J. J. (1992). Quantitative EEG in elderly depressives. Brain Topogr. 4, 285–290. doi: 10.1007/BF01135566
Roh, S. C., Kim, J. S., Kim, S., Kim, Y., and Lee, S. H. (2020). Frontal alpha asymmetry moderated by suicidal ideation in patients with major depressive disorder: a comparison with healthy individuals. Clin. Psychopharmacol. Neurosci. 18, 58–66. doi: 10.9758/cpn.2020.18.1.58
Saletu, B., Anderer, P., and Saletu-Zyhlarz, G. M. (2010). EEG topography and tomography (LORETA) in diagnosis and pharmacotherapy of depression. Clin. EEG Neurosci. 41, 203–210. doi: 10.1177/155005941004100407
Schiller, M. J. (2019). Quantitative electroencephalography in guiding treatment of major depression. Front. Psychiatry 9:779. doi: 10.3389/fpsyt.2018.00779
Siegle, G. J., Condray, R., Thase, M. E., Keshavan, M., and Steinhauer, S. R. (2010). Sustained gamma-band EEG following negative words in depression and schizophrenia. Int. J. Psychophysiol. 75, 107–118. doi: 10.1016/j.ijpsycho.2008.04.008
Simmatis, L., Russo, E. E., Geraci, J., Harmsen, I. E., and Samuel, N. (2023). Technical and clinical considerations for electroencephalography-based biomarkers for major depressive disorder. NPJ Ment. Health Res. 2:18. doi: 10.1038/s44184-023-00038-7
Smailovic, U., and Jelic, V. (2019). Neurophysiological markers of Alzheimer's disease: quantitative EEG Approach. Neurol. Ther. 8, 37–55. doi: 10.1007/s40120-019-00169-0
Spironelli, C., Fusina, F., and Angrilli, A. (2021). Delta and theta EEG activity during resting state is altered in patients affected by major depression. Eur. Psychiatry 64, S338–S339. doi: 10.1192/j.eurpsy.2021.908
Stewart, J. L., Coan, J. A., Towers, D. N., and Allen, J. J. B. (2014). Resting and task-elicited prefrontal EEG alpha asymmetry in depression: support for the capability model. Psychophysiology 51, 446–455. doi: 10.1111/psyp.12191
Sun, S., Li, J., Chen, H., Gong, T., Li, X., Hu, B., et al. (2020). Resting-state EEG biomarkers for depression recognition. arXiv preprint. doi: 10.48550/arXiv.2002.11039
Suzuki, H., Mori, T., Kimura, M., and Endo, S. (1996). (Quantitative EEG characteristics of the state of depressive phase and the state of remission in major depression). Seishin Shinkeigaku Zasshi 98, 363–377.
Thoduparambil, P. P., Dominic, A., and Varghese, S. M. (2020). EEG-based deep learning model for the automatic detection of clinical depression. Phys. Eng. Sci. Med. 43, 1349–1360. doi: 10.1007/s13246-020-00938-4
van der Vinne, N., Vollebregt, M. A., van Putten, M. J. A. M., and Arns, M. (2019). Stability of frontal alpha asymmetry in depressed patients during antidepressant treatment. Neuroimage Clin. 24:102056. doi: 10.1016/j.nicl.2019.102056
Widge, A. S., Bilge, M. T., Montana, R., Chang, W., Rodriguez, C. I., Deckersbach, T., et al. (2019). Electroencephalographic biomarkers for treatment response prediction in Major Depressive Illness: a meta-analysis. Am. J. Psychiatry 176, 44–56. doi: 10.1176/appi.ajp.2018.17121358
Williams, D. (1954). The electroencephalogram in affective disorders. J. R. Soc. Med. 47, 779–782. doi: 10.1177/003591575404700912
Wu, W., Ma, L., Lian, B., Cai, W., and Zhao, X. (2022). Few-electrode EEG from the wearable devices using domain adaptation for depression detection. Biosensors 12:1087. doi: 10.3390/bios12121087
Yamada, M., Kimura, M., Mori, T., and Endo, S. (1995). (EEG power and coherence in presenile and senile depression. Characteristic findings related to differences between anxiety type and retardation type). Nihon Ika Daigaku Zasshi 62, 176–185. doi: 10.1272/jnms1923.62.176
Yang, J., Zhang, Z., Xiong, P., and Liu, X. (2023). Depression detection based on analysis of EEG signals in multi brain regions. J. Integr. Neurosci. 22:93. doi: 10.31083/j.jin2204093
Yasin, S., Othmani, A., Raza, I., and Hussain, S. A. (2023). Machine learning-based approaches for clinical and non-clinical depression recognition and depression relapse prediction using audiovisual and EEG modalities: a comprehensive review. Comput. Biol. Med. 159:106741. doi: 10.1016/j.compbiomed.2023.106741
Keywords: depressive disorders, EEG, QEEG, neurophysiological biomarkers, frontal alpha asymmetry, brain wave activity, diagnosis of depression
Citation: Kopańska M, Ochojska D, Sarzyńska I, Bartkowska O and Szczygielski J (2025) Quantitative and qualitative electroencephalography in the diagnosis and monitoring of depression. A modern approach to clinical neurophysiology. Front. Hum. Neurosci. 19:1624434. doi: 10.3389/fnhum.2025.1624434
Received: 07 May 2025; Accepted: 17 July 2025;
Published: 08 August 2025.
Edited by:
BeomJun Min, Seoul National University Hospital, Republic of KoreaReviewed by:
Nathaniel A. Shanok, Florida Atlantic University, United StatesChanda Simfukwe, Gachon University, Republic of Korea
Copyright © 2025 Kopańska, Ochojska, Sarzyńska, Bartkowska and Szczygielski. This is an open-access article distributed under the terms of the Creative Commons Attribution License (CC BY). The use, distribution or reproduction in other forums is permitted, provided the original author(s) and the copyright owner(s) are credited and that the original publication in this journal is cited, in accordance with accepted academic practice. No use, distribution or reproduction is permitted which does not comply with these terms.
*Correspondence: Marta Kopańska, bWtvcGFuc2thQHVyLmVkdS5wbA==