 Rémi Patriat1*
 Jayashree Chandrasekaran1,2Karianne Sretavan1,3Henry Braun1
 Samuel Brenny1Yasamin Seddighi1
 Joshua E. Aman4
 Meghan Hill4
 Jerrold L. Vitek4
 Noam Harel1,5
 Leonardo Almeida4
- 1Center for Magnetic Resonance Research, Department of Radiology, University of Minnesota, Minneapolis, MN, United States
- 2Department of Biomedical Engineering, University of Minnesota, Minneapolis, MN, United States
- 3Graduate Program in Neuroscience, University of Minnesota, Minneapolis, MN, United States
- 4Department of Neurology, University of Minnesota, Minneapolis, MN, United States
- 5Department of Neurosurgery, University of Minnesota, Minneapolis, MN, United States
Introduction: Difficulties in direct visualization of thalamic subnuclei are likely a contributor to inconsistent surgical outcomes among patients with medication refractory tremors. We present a new MRI landmark, represented by a bright signal in the posterior limb of the internal capsule signal (PICS), that can serve as a consistent marker for indirect location of the Vim nucleus of the thalamus. We evaluated the visibility of PICS across multiple MRI sequences at 7Tesla (T) and 3T, and its anatomical characteristics were identified using tractography.
Methods: One healthy control and 15 essential tremor (ET) patients were scanned. To characterize the PICS fibers, two posterior limb of internal capsule (pLIC) tractography schemes were conducted with cortical ROIs as seeds and the pLIC as a waypoint: (i) gross motor cortical ROIs, (ii) M1 and S1 homunculus. Finally, intra- and post-operative clinical data were merged for one ET DBS patient to show correspondence between the parcellation results and clinical observations.
Results: PICS was consistently identified across multiple MRI sequences. Tractography analyses identified PICS to correlate with the distribution of motor fibers from the internal capsule. For the M1 homunculus, two somatotopic clusters were observed: one including mostly trunk, lower and upper limbs; and another, more anteriorly, with head/face clustering with tongue/larynx. For the S1 homunculus, the trunk region was overall the most posterior region followed by the upper limb/face anteriorly and Area2. Intra-operative stimulation at two different depths resulted in pLIC-specific side effect in the tongue/face. At those depths, measurements showed closer proximity of the DBS electrode to M1 clusters of head/face and tongue/larynx, validating the imaging findings.
Conclusion: PICS appears to be a reliable radiological marker comprising cortico-spinal tracts, in isolation from corticobulbar tracts fibers. It is consistently located lateral to the Vim, making it a potential landmark to infer Vim location and help refine targeting for thalamic procedures. The parcellations of the pLIC using M1 homunculus could potentially inform lead or ablation location based on side effect profiles (e.g., head/face/tongue vs. trunk/limbs). Therefore, proximity or distance to PICS may potentially guide lead placement to avoid procedure-related capsular side effects while optimizing benefits.
1 Introduction
Essential tremor (ET) is the most prevalent movement disorder, impacting individuals at all ages, including approximately 4% of adults over the age of 65 (Louis, 2005). ET can greatly impact the quality of life with tremors affecting not only the upper limbs, but also the lower extremities, trunk, head and speech (Zesiewicz et al., 2010; Whaley et al., 2007). Unfortunately, up to 50% of ET patients either become refractory to or unable to tolerate medications at the doses required to achieve adequate symptom control. For refractory cases, more advanced treatments including lesional therapies and neuromodulation such as gamma knife, high- and low-intensity focused ultrasound (FUS), or deep brain stimulation (DBS) can be considered (Zesiewicz et al., 2011; Koller and Vetere-Overfield, 1989).
The most common neuromodulation option offered to ET patients is DBS. In this procedure, an electrode is implanted in the region of the ventrointermediate subnucleus of the thalamus (Vim), and electrical current is continuously delivered through selected contacts of the DBS lead. Also, in recent years, thalamotomies targeting the Vim using magnetic resonance-guided focused ultrasound (MRgFUS) have received increased interest because it is a less invasive FDA-approved procedure (Ferreira Felloni Borges et al., 2023). Although these interventions can be very effective, standard DBS and lesioning approaches often yield variable outcomes with tremor improvements ranging from 35 to 80% (Giordano et al., 2020), sometimes leading to repeat surgeries (Agrawal et al., 2021; Rolston et al., 2016; Ferreira Felloni Borges et al., 2023). Some groups have also reported a gradual loss of therapeutic efficacy over time (so-called habituation), which can start as early as 6 months post-surgery (Fasano and Helmich, 2019; Ferreira Felloni Borges et al., 2023). Reports of habituation vary widely across ET DBS studies, ranging from no habituation (Cury et al., 2017) up to affecting 73% of Vim-DBS cases over time (Shih et al., 2013). Lastly, non-invasive approaches such as lesional therapies preclude intraoperative mapping (e.g., microelectrode recording (MER)), as well as testing of the implanted electrode (as done with DBS), which are opportunities of refinement of the surgical targeting to ensure more consistent outcomes.
Some of the variability in clinical efficacy may arise from challenges in directly visualizing and targeting specific thalamic subnuclei because of the inter-individual variability in the size, shape, and geometric configuration of these subnuclei. Several imaging methods have been proposed to directly visualize thalamic subnuclei including susceptibility-weighted imaging (SWI) (Abosch et al., 2010; Najdenovska et al., 2019), quantitative magnetic susceptibility mapping (QSM) (Chiang et al., 2018), white-matter nulled T1 imaging, such as FGATIR (Sudhyadhom et al., 2009), 3D-EDGE (Middlebrooks et al., 2021), and WMn-MPRAGE (Su et al., 2019), as well as a new diffusion MRI (dMRI) method called DiMANI (Patriat et al., 2024). Each one of these methods has its limitations, ranging from clinical feasibility (acquisition, processing and expertise availability) to lack of sufficient independent clinical validation. Patriat et al. (2024), demonstrated that, by using the DiMANI method, it is possible to directly visualize the subnuclei of the thalamus, potentially facilitating surgical targeting of these structures by using the “zebra pattern” (Patriat et al., 2024). Further, a hyperintense posterior limb of the internal capsule signal (PICS), was consistently visualized on DiMANI images (Figure 1), warranting further investigation as a potential radiological landmark to improve surgical targeting accuracy.

Figure 1. Visibility of PICS (top) on DiMANI images across ET patients, (middle) in a variety of MR contrasts in one healthy participant, and (bottom) on templates. Red arrows indicate where PICS is visible. Vop = posterior ventralis oralis nucleus, Vim = ventrointermediate nucleus, Vc = ventral caudalis nucleus. Outlines on DiMANI images: Pink = Vop, Red = Vim, Green = Vc, Blue = PICS.
The present study aims to evaluate the visibility of PICS across multiple MRI sequences, and identify its anatomical characteristics using tractography in order to determine its potential to serve as a clinical and radiological landmark to refine Vim targeting in lesional or neuromodulatory procedures.
2 Methods
2.1 Subjects
Fifteen ET patients were enrolled from the University of Minnesota DBS program. Inclusion criteria required patients to have a diagnosis of ET and be suitable candidates for Vim-DBS surgery, as defined by the institution’s standard of care practice. The study did not interfere or change the patients’ routine treatment protocol. These participants completed a research-only 7 Tesla (7 T) MRI scan prior to surgery. Additionally, we obtained 3 T data from one of our patients. However, our institution clinical workup only includes a 3-direction DTI dataset which is insufficient for computing a meaningful DiMANI image; therefore, we downloaded 3 T diffusion data from the Human Connectome Project (HCP – Subject 100,610) to show that PICS is visible using DiMANI at 3T. The participants’ demographics are summarized in Table 1. Additionally, one healthy volunteer (M, 72 years old) was recruited to enable collection of MR images that are not typically included in our clinical 7 T protocol. The study was approved by the Institutional Review Board at the University of Minnesota and informed consent was obtained from all participants prior to inclusion in the study. All experiments were performed in accordance with relevant guidelines and regulations.
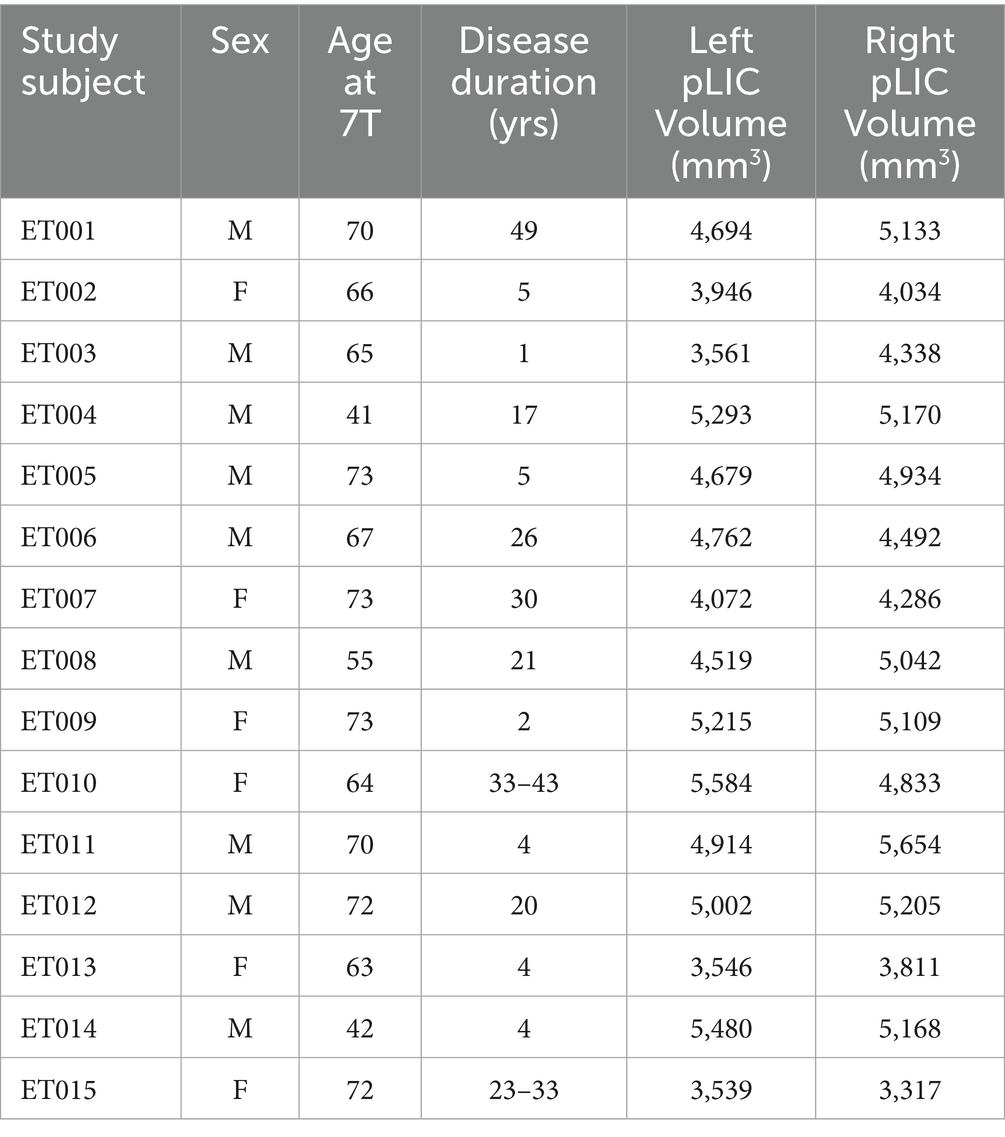
Table 1. Demographics information and pLIC volumes.
2.2 MRI acquisition and processing
All participants were scanned at the Center for Magnetic Resonance Research on a 7 T Siemens Magnetom Terra MRI scanner using SC72 gradients capable of 70 mT/m and a 200 T/m/s slew rate, driven by a Siemens console (Erlangen, Germany). The images were acquired with a 32-element head array coil (Nova Medical, Inc., Burlington, MA). The MRI clinical protocol for ET patients included: Diffusion-weighted images, T1 MPRAGE, FGATIR, and SWI. Additionally, to assess whether PICS was visible on other MRI contrasts, we also acquired the following scans for the healthy volunteer: QSM, T2*, Neuromelanin, and multi-echo MP2RAGE in order to generate a synthetic WMn-MPRAGE. Table 2 lists the MRI protocol parameters. The 3 T dataset was acquired on a Siemens Prisma system using gradients capable of 80 mT/m and a 200 T/m/s slew rate, driven by a Siemens console (Erlangen, Germany). Scans included: T1, T2 dark fluid, T2tse, T2space and T2blade.
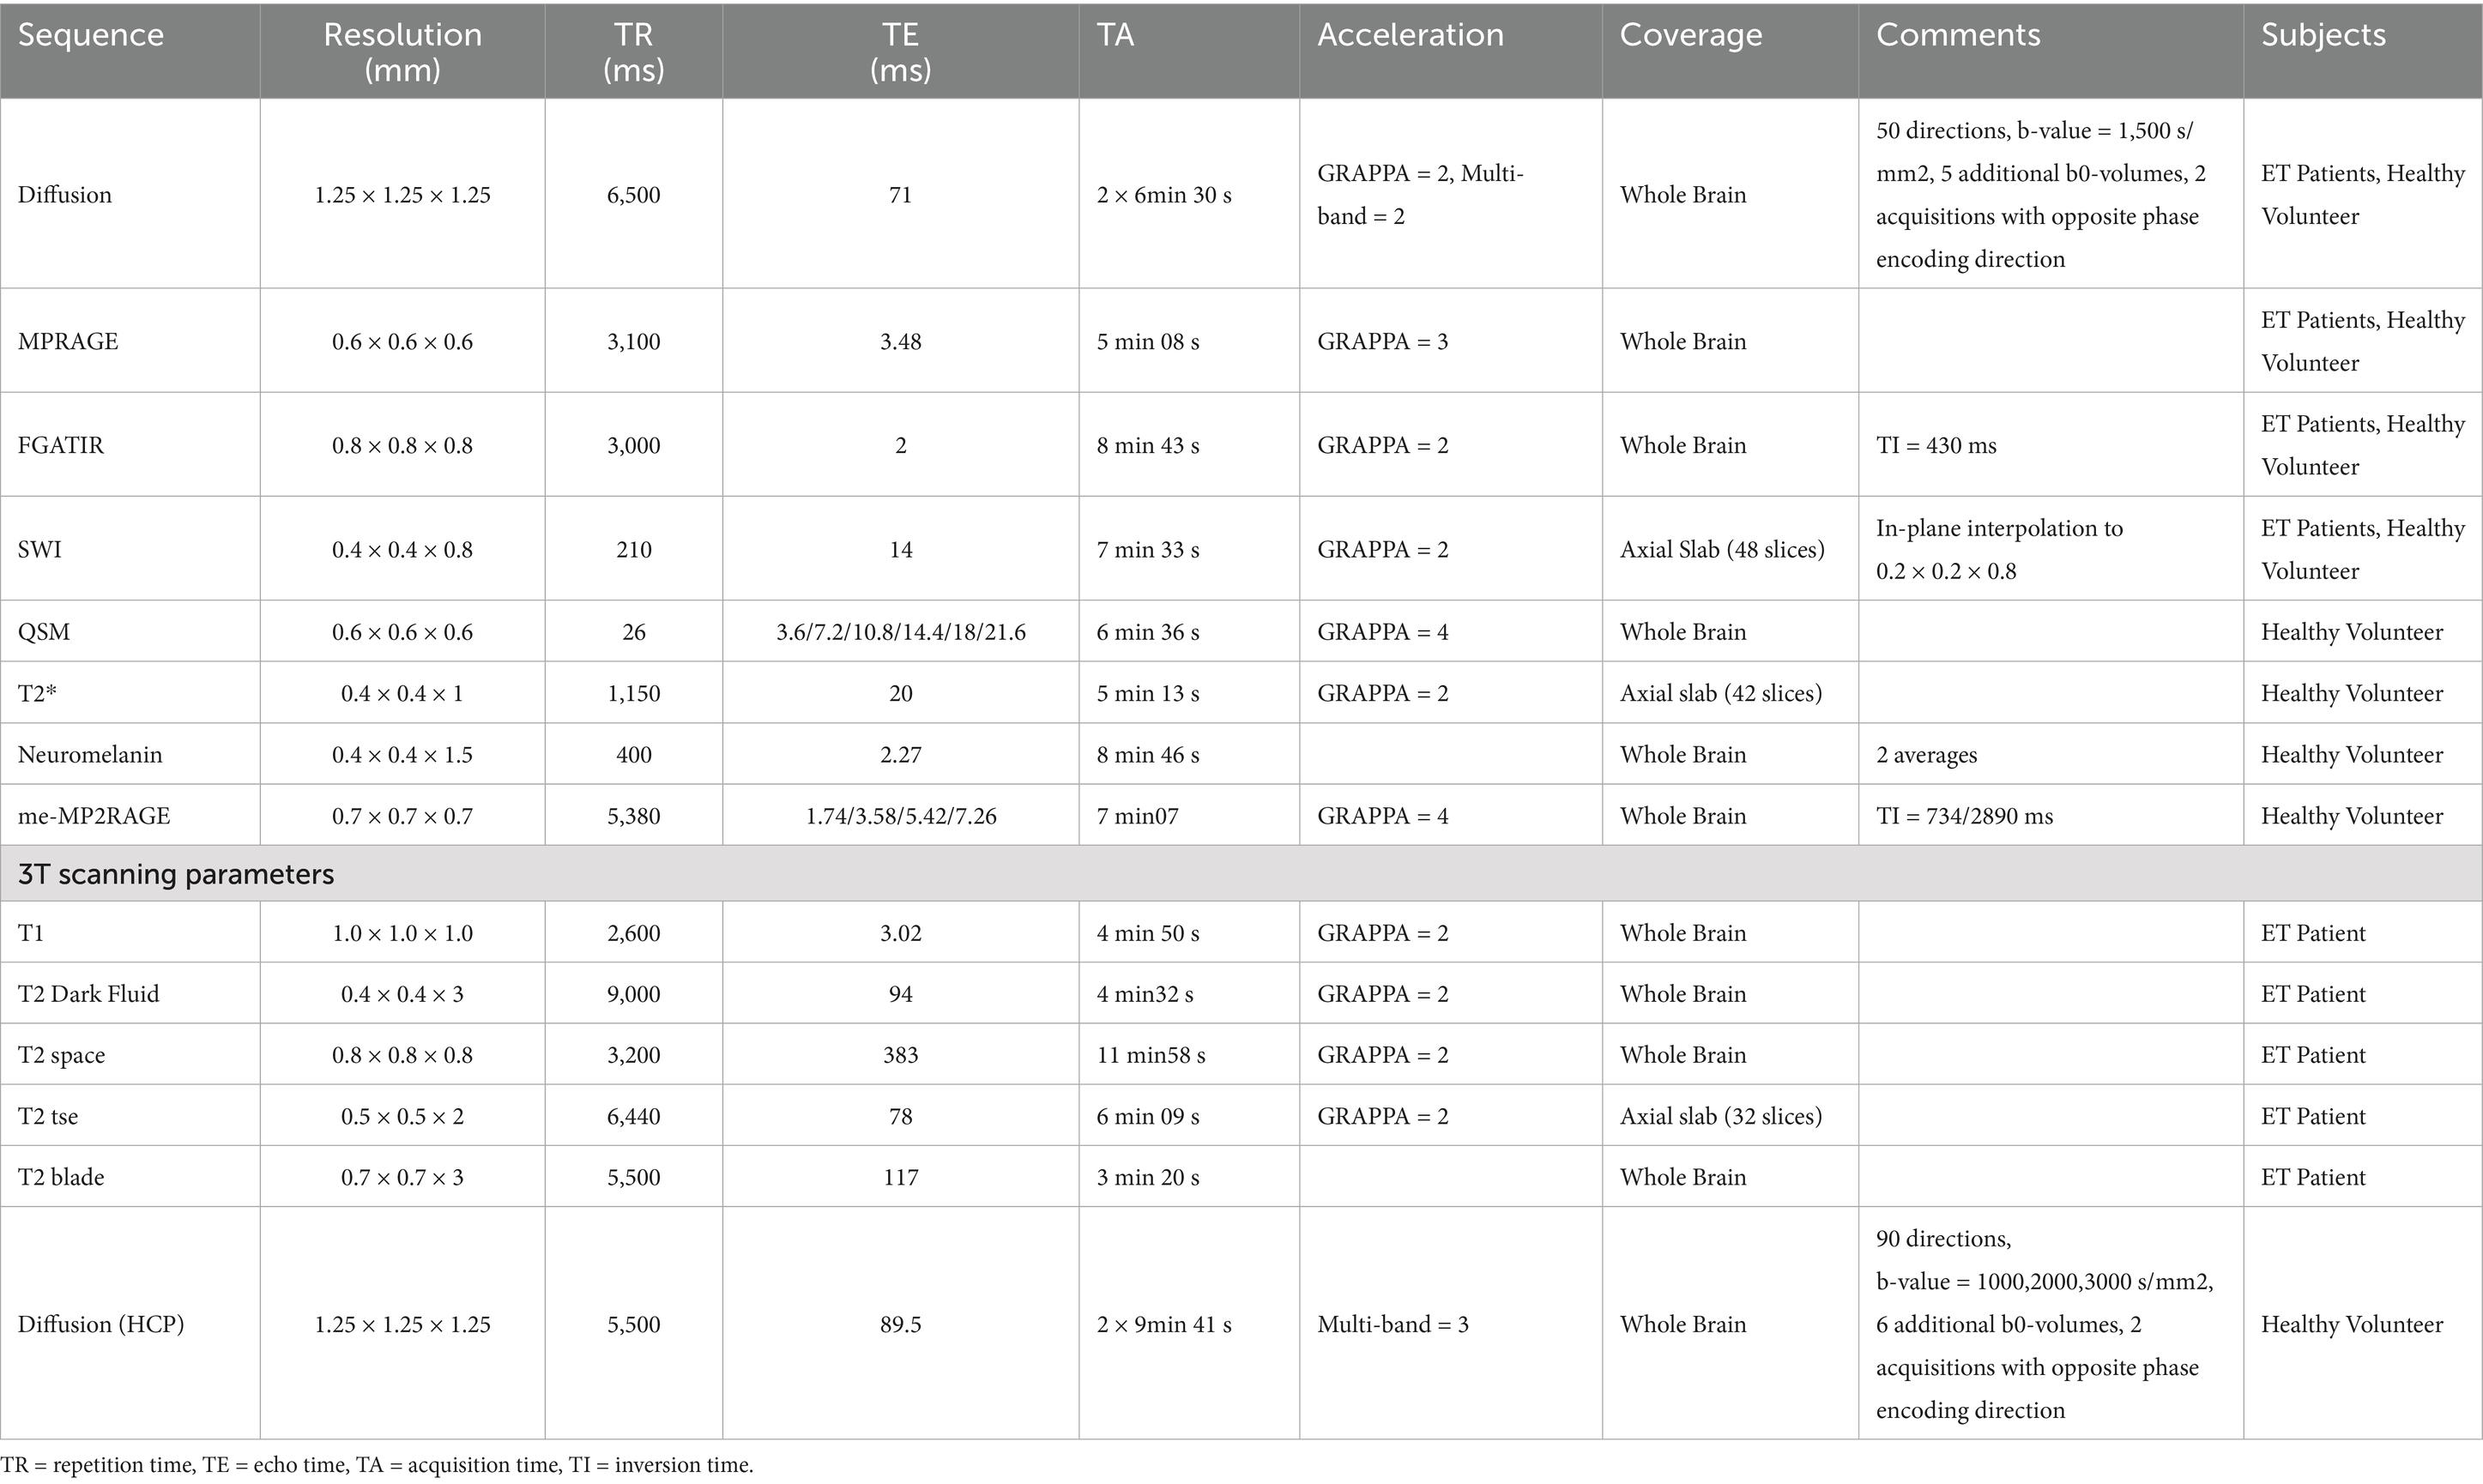
Table 2. MRI scanning parameters.
dMRI preprocessing steps included: motion, susceptibility, and eddy current distortions correction using FSL’s eddy and topup algorithms. The DiMANI images were generated by computing the mean, voxelwise, of the diffusion weighted volumes (e.g., only b > 100 volumes were kept) (Patriat et al., 2024). For visualization purposes, DiMANI images were intensity equalized using an adaptive histogram equalization1. For the healthy volunteer, a non-linear registration between the subject’s native space and MNI template space was obtained using the HCP pipelines in order to study whether high signal-to-noise ratio average images also display PICS. Average T1, T2, FA and FGATIR images were obtained from the Lead-DBS toolbox2. We also used the MuSus-100 QSM template (He et al., 2023), the χ-separation atlas (Min et al., 2024), and the BigBrain histological atlas (Amunts et al., 2013).
2.3 Posterior limb of the internal capsule segmentation
The pLIC was manually segmented on the DiMANI image using Slicer3D3. The lateral and medial borders were defined as the pallidum/putamen and the thalamus, respectively. The anterior border was the genu of the internal capsule. The posterior, inferior and superior extent were chosen following the definition of the IC from the ICBM-DTI-81 template (Mori et al., 2008).
2.4 Posterior limb of the internal capsule vs. PICS region tractography
The first exploratory experiment was to generate tracts from PICS and the regions from the pLIC immediately anterior and posterior to this landmark. The purpose was to observe whether the PICS region was discriminately connected to a particular part of the cortex while the rest of the pLIC connect to other cortical regions and decide if there was merit in performing a larger scale parcellation analysis of the pLIC. This experiment was conducted in DSI studio4 using the heathy volunteer data, where manual segmentations of the pLIC regions (PICS and pLIC regions anterior and posterior to PICS) were used as seeds and tracts were allowed to freely propagate ipsilaterally throughout the brain. To that effect, a rectangular exclusion mask, the length of the brain in sagittal orientation going from the top of the brain down to just above the superior cerebellar peduncles (SCP), was placed at the midline. Note that this allowed for tracts to cross hemispheres at the SCP and below. The default deterministic tracking parameters were used, and tracking was stopped once 10,000 tracts were created. The default parameters, as described by dsi studio, were as such “The anisotropy threshold was randomly selected between 0.5 and 0.7 otsu threshold. The angular threshold was randomly selected from 45 degrees to 90 degrees. The step size was set to voxel spacing.”
2.5 Posterior limb of the internal capsule parcellation
All parcellation experiments were carried out using FSL’s probtrackx2 (Behrens et al., 2007). Each cortical ROI was used as a seed, the ipsilateral pLIC as a waypoint and all other ROIs (all contralateral and the remaining ipsilateral ROIs) as regions of avoidance. To visualize the location of all the functional territories within the pLIC, we thresholded each parcel to 80% of its maximum connectivity value instead of flowing a winner-take-all approach. This resulted in parcels with some overlap, so we also show skeletonized maps where, at each axial slice, the center of mass of the connectivity distribution is displayed for each region. This builds a center-of-mass “skeleton” in the direction that the majority pLIC fibers run. For this study, we conducted three parcellation experiments. First, following Archer et al. (2018; Mori et al., 2008), we used the HMAT atlas to define M1, S1, supplemental motor area (SMA), pre-SMA, as well as ventral and dorsal premotor (PMv and PMd)(Mayka et al., 2006). Since a similar approach was used to generate an atlas of the corticospinal tract parcellation (Archer et al., 2018), we also brought the SMATT to the patient’s native space to compare how this normative parcellation compares to patient-specific parcellations at the level of pLIC. Second, we used the Brainnetome atlas to define the subdivisions of M1 corresponding to lower limbs, upper limbs, trunk, tongue/larynx and head/face (Fan et al., 2016). Finally, we used the Brainnetome atlas to define the subdivisions of S1 corresponding to upper limbs, trunk, tongue/larynx and upper limbs - head/face (Xu et al., 2016). Fiber tracking settings included FSL’s default curvature threshold of 0.2, maximum number of steps per sample of 2000, number of sample equal to 5,000, step length of 0.5 mm, subsidiary fiber volume threshold of 0.01, and termination of pathways that looped back on themselves.
2.6 Compiling results in a common space
In order to facilitate visualization of the parcellation results across patients, we generated a study-specific template from each patient’s DiMANI and fractional anisotropy map. This was achieved using DTI-TK, which has been shown to excel at creating templates based on diffusion data (Zhang et al., 2007). The non-linear transformations to bring each patient’s native space data into template space were then used to bring parcellation results from each patient to the study-specific common space using DTI-TK.
2.7 DBS data
The purpose of this experiment was to use clinical data in a case example to show a within-subject correspondence between the pLIC parcellations and clinical observations, as well as provide a window to the potential proof-of-concept clinical relevance to our results. We obtained the intraoperative and post-operative data relevant to the right Vim DBS surgery for patient ET015 (Table 1). These included surgical notes containing information from microelectrode recordings (MER) trajectories and micro-stimulation, a 4-week high resolution post-operative computed tomography image (CT; free from brain shift), as well as programming notes. To reconstruct the final location of the DBS electrodes and contacts with respect to the patient’s own anatomy, the CT was non-linearly registered to the MR images using Elastix (Klein et al., 2010). From the surgical and programming notes, we extracted the information (depth, track) regarding pLIC-related side effects observed clinically and mapped those in 3DSlicer. Finally, in order to relate the clinical observations to the patient-specific pLIC parcellation results, we used the ModelToModelDistance module5 within 3DSlicer.
3 Results
3.1 Posterior limb of the internal capsule and PICS
Table 1 shows the volumes of manually segmented left and right ICs for all fifteen ET patients. Volume sizes were found to be similar within patient (t-test p-value = 0.3) but quite variable across patients with a mean of 4,587 ± 704 mm3 for the left IC and 4,701 ± 635 mm3 for the right.
Figure 1 shows images from our healthy participant for a wide variety of contrasts. PICS was clearly identified on the B0 image (hyperintense) and more subtly on the T1 (MP2RAGE uni, hypointense), T2* (hyperintense), FGATIR (mildly hyperintense), Tensor, and QSM (hyperintense with respect to pLIC but not thalamus) images. However, it was not visible on the patient’s SWI, T2space, χpara, χdia or Neuromelanin image. PICS was clearly visible on the T1 (hypointense), T2 (hyperintense) templates, and more subtly on the FGATIR and FA templates. PICS could be easily identified in DiMANI images for all 15 patients (Figure 1). The clear visibility in some of the templates indicates that visualizing PICS might require very high signal-to-noise ratio (SNR) to be visible on some contrasts, potentially explaining its ease of localization on the DiMANI sequences. Figure 2 shows the presence of PICS at 3 T in one of our ET patients. Similarly, PICS is hyperintense in DiMANI, T2 space, T2tse, T2 dark fluid and T2blade and hyperintense in T1.

Figure 2. Evidence of PICS visibility on 3T data from one of the ET DBS patients. Note that we downloaded a 3 T diffusion dataset from the HCP database (subject 100,610) since our current 3 T clinical protocol does not include dMRI data, only a 3-direction DTI dataset is acquired. Red arrows indicate the location of PICS. The black dotted outline shows PICS outline on one side of the brain. Note that PICS is generally more intense than its surrounding internal capsule regions except for T1.
Figure 3 shows deterministic tracts of the pLIC with respect to PICS in one participant. In this exploratory experiment, fibers passing through the pLIC reached regions all over the cortex, including frontal, precentral, postcentral and posterior areas. Subdividing the pLIC into PICS, anterior and posterior pLIC ROIs showed that the anterior–posterior organization of cortex is preserved at the level of the pLIC with motor fibers passing through PICS (Figure 3C).

Figure 3. Deterministic tractography shows segregated white matter pathways for the PICS fibers with respect to anterior and posterior portions of pLIC. (A) Manual segmentation of the PICS, anterior and posterior regions of the pLIC. (B) Tracts for all these regions. (C) End of tract location for the PICS fibers in the cortex with respect to the HMAT atlas. Ant = anterior, Post = posterior, SMA = supplementary motor area, M1 = primary motor cortex, S1 = primary sensory cortex, PMv = ventral premotor cortex, PMd = dorsal premotor cortex.
3.2 Parcellation based on HMAT atlas
Figure 4 shows the pLIC parcellation results based on the HMAT definitions of M1, S1, SMA, preSMA, PMv and PMd. The average tractography results demonstrate an anterior–posterior organization in the pLIC with S1 posterior most followed anteriorly by M1, PMv, PMd, SMA and preSMA corresponding closely to the cortical organization. The regions of SMA and PMd of pLIC overlapped the most and maintained similar anterior–posterior distribution across subjects (Figure 4C). Further, the PMv region appeared to be the most variable across subjects included in our sample (Figure 4C).

Figure 4. pLIC parcellation based on HMAT. (A) 3D visualization of the mean tractography across all 15 ET patients. (B) 2D visualization of the mean tractography across all 15 ET patients. (C) Skeletons of all individual ET patients tractography maps ordered from anteriormost to posteriormost; each dot represents one patient. SMA = supplementary motor area, M1 = primary motor cortex, S1 = primary sensory cortex, PMv = ventral premotor cortex, PMd = dorsal premotor cortex.
Figure 5 shows the comparison between patient-specific pLIC parcellation based on HMAT and the SMATT template registered to the patient native space. The organization and the location of the parcels in the anterior–posterior direction matched closely between the two methods. The main differences arose in the medial-lateral direction and could be attributed to potential registration inaccuracies that are typical when registering average anatomical data (e.g., MNI T1) to older, diseased, brains in which atrophy and asymmetries are commonplace, even with non-linear registration algorithms.

Figure 5. Patient-specific pLIC parcellation skeletons (filled circles) versus SMATT (outlines) for all 15 ET patients. Pink = S1, Dark blue = M1, Light blue = preSMA, Cyan = SMA, Green = PMv, Light green = PMd.
3.3 Parcellation based on M1 and S1 homunculus
Figures 5, 6 show the pLIC parcellation results based on the Brainnetome definitions of the homunculus of M1 and S1. Similar to the HMAT parcellation results, the S1 homunculus regions of pLIC were located posterior and lateral to M1 homunculus. As expected, overlap occurred within the homunculus regions (e.g., M1 head/face vs. M1 tongue/larynx vs. M1 trunk vs. M1 upper limb vs. M1 lower limb).

Figure 6. pLIC parcellation based on the M1 and S1 homunculus from the Brainnetome atlas. (A) 3D visualization of the mean tractography across all 15 ET patients. (B) 3D visualization of the mean tractography skeletons. (C) Skeletons of all individual ET patients tractography maps ordered from anteriormost to posteriormost; each dot represents one patient. (D) 3D visualization of the mean tractography skeletons. (E) Skeletons of all individual ET patients tractography maps ordered from anteriormost to posteriormost; each dot represents one patient.
For the M1 homunculus, two somatotopic clusters were observed: one including trunk, lower and upper limbs; and another with head/face clustering with tongue/larynx. Within the trunk and limbs cluster, lower limb was found more medial to the trunk region, while upper limb was distributed more anterolateral to trunk (Figure 6). As with the HMAT parcellation experiment, the most ventral cortical ROI (tongue/larynx) was the most variable across the 15 participants. Note that the participants with M1 tongue/larynx skeletons located posteriorly typically had a focal probabilistic maps with tracts also located anterior.
For the S1 homunculus, the trunk region was overall the most posterior region followed by the upper limb/face anteriorly and Area2. The position of the tongue/larynx region of S1was the most variable across the subjects (Figure 6E).
3.4 Case study including data from stimulation-induced side effects
DiMANI images yielded an easily identifiable PICS landmark (Figure 7A). The pLIC parcellation results were similar to those described above (Figure 7B), replicating the findings from the population of 15 individuals. Final DBS electrode and contact locations corresponded to the Vop/Vim border (Figure 7C), which is typical for our center. Prior to DBS implantation, two MER tracks separated by 2 mm in the anterior–posterior direction (center and posterior BenGun holes) were recorded intra-operatively. Stimulation in the center track using the semi-micro (ring) electrode (length = 1.0 mm) located 3 mm superior to the microelectrode tip, at 3.7 mm above our target depth (130 Hz, 90 μs and 4.0 mA) and 2.3 mm above target (130 Hz, 90 μs and 4.5 mA) resulted in focal muscle contractions observable in the tongue/face, which were indicative of stimulation of the pLIC. For Vim, our target depth is at the level of the midpoint of the AC/PC line, typically equating to approximately the ventral border of the thalamus. Figure 7D shows the locations of these stimulations with respect to the patient-specific M1 homunculus parcellation of pLIC. Figure 7E shows that the shortest distance between these stimulation sites and the pLIC parcellation corresponds to M1 cluster of head/face and tongue/larynx, validating the clinical findings obtained intraoperatively.

Figure 7. ET DBS case study. (A) Location of PICS on the patient’s DiMANI image. (B) pLIC parcellation results for this patient in an axial slice (left) and in 3D (right). (C) Electrode location within the thalamus (transparent mesh) with respect to Vop (pink), Vim (blue) and Vc (green) in sagittal (left) and axial (right) orientations. (D) Locations at which pLIC side effects were observed (yellow is 3.7 mm above target depth and green is 2.3 mm above target depth) with respect to the patient’s pLIC parcellation using the M1 homunculus (skeleton representation). The semitransparent gold shape represents the pLIC segmentation. (E) Shortest distance between the location where semi-microstimulation elicited pLIC side effects and the pLIC parcellation skeletons based on M1.
4 Discussion
Here, we present a new potential imaging landmark, within the pLIC, that could serve as a patient-specific refinement tool for targeting of the Vim subnucleus of the thalamus for neurosurgery applications. PICS can be particularly helpful with estimating the electrode (or lesion) location in neurosurgical application by inferring the location of Vim even in standard-of-care images that do not allow direct visualization of thalamic subnuclei. Our findings demonstrate that PICS can not only be identified across several MRI sequences including T1, FGATIR, and T2* (Figure 1) but more clearly and reliably visible using DiMANI in all 15 participants from our sample (Figures 1, 2, 7). Rather than replacing current methods, we suggest the use of PICS as a complementary targeting strategy. Its visibility on routinely acquired data (T1, FGATIR, T2*) provides ease of implementation.
Further, our data show that PICS is visible not only 7 T images, but also on 3 T images (Figure 2), which makes it more scalable for implementation across the majority of DBS centers as 7 T is not yet a routine scanner to be found at the majority of DBS locations. Our findings demonstrate that PICS appears to comprise mostly motor-related fibers (Figures 3–7), bordering laterally the Vim subnucleus, while sometimes partially bordering anterior Vc and posterior Vop (Figures 1, 5 and (see Patriat et al., 2024) for details on how to identify the Vim, Vop, and Vc on DiMANI images). To our knowledge, this is the first work to radiologically parcellate the region of pLIC into functional subregions corresponding to the motor and sensory homunculus in individual patients (Figures 6, 7). Further, our proof-of-concept case demonstrates correspondence between somatotopic organization within the pLIC, based on tractography, and clinical manifestation of tonic contractions in the respective body part, based on intra-operative stimulation testing. These parcellations have the potential to help clinical teams intra- and post-operatively with refining final DBS electrode location or guide potential surgical planning although correlations with clinical outcomes still need to be further studied.
4.1 Validity of pLIC parcellations
Our pLIC HMAT parcellation results were similar to prior work using 3T datasets (Archer et al., 2018; Lee and Park, 2022), thus replicating 3 T findings at 7 T at both the group level and the individual level. Furthermore, these results also parallel tracer studies conducted in the non-human primate (Morecraft et al., 2017).
The patient-specific pLIC parcellations at 7T also showed good correspondence to the cross-section of the SMATT atlas with the pLIC. Parcellation of the pLIC using homunculus M1 and S1 tractography has not been extensively explored in humans. Weiss et al. (2015) demonstrated in one intracranial tumor patient, that at the level of pLIC, the M1 foot region was posterior to M1 hand, which itself was posterior to M1 tongue using transcranial magnetic stimulation and dMRI. Further, all three regions were concentrated in the posterior third quarter of the pLIC with maintenance of the anterior–posterior organization, consistent with the location of PICS demonstrated in our results (Figure 6). Our M1 homunculus results are consistent with anatomo-pathological findings (plate 746 from Gray’s anatomy, 1918; King’s College London, 2011) (Gray and Lewis, 1918; Bannister, 2011). Second, using imaging data, Northam et al. (2019) demonstrated that the corticospinal tract (CST), containing fibers responsible for limbs and trunk movements, were located more posteriorly to corticobulbar tracts (CBT), which carry information correlated with head and neck. Finally, non-human primate tracer evidence also suggests that upper limb fibers run posteriorly to orofacial fibers in the pLIC (Morecraft et al., 2017), which is replicated by our results. Although no neuroimaging studies conducting parcellation of the pLIC based on S1 homunculus have been published, to our knowledge, it is believed that the fibers from the S1 homunculus follow a similar pattern to the M1 homunculus in pLIC but located posteriorly to these (Figures 10–22 from Clinical Neuroanatomy) (Waxman, 2013), which also is consistent with our findings (Figure 6).
4.2 What is this PICS?
The IC is well known to be a heterogenous white matter structure. In fact, laser microscopy studies have shown that parcellations of the IC can be performed based on the local fiber orientation, density and diameter (Axer and Keyserlingk, 2000). The pLIC can be subdivided into two regions with a small gradient-like transition: one with larger diameter fibers running nearly perpendicular to the ACPC plane, and one with smaller diameter and more transversally oriented fibers (Axer and Keyserlingk, 2000). Axer and Keyserlingk (2000) call them CI 3 and CI 4, respectively. Additionally, they have demonstrated that CI 3 contains the pyramidal tracts (PyT). PyT is comprised of CBT and CST; therefore, given that CBT is more anterior than CST, it remains to be determined whether PICS is the posterior part of CI 3 or the overlapping region between CI 3 and CI 4. Figures 3, 4, 6 show that PICS is made of motor-related fibers. Although Figure 6 shows the majority of CBT tracts anterior to PICS, the inter-subject variability of tractography results for these more ventral ROIs prohibits one from making a definitive statement. This variability is likely due to dMRI/tractography methodology limitations (see below). However, the same figure clearly shows the CST results contained within PICS. These CST tractography results are in line with previous results showing a “hot spot” in a group-level probabilistic map located in a similar location to our PICS (Bürgel et al., 2006). A 7T study reported the presence of a PICS on T2-weighted images in young healthy individuals and attributed this region to CST fibers (Hervé et al., 2011) but they did not show correspondence with tractography. In this study, we unify the tractography results with anatomical observations on structural MRI.
4.3 How to visualize PICS?
Figure 1 shows that PICS can be visible on several MRI contrasts (T2*, T1, FGATIR, B0, QSM, DiMANI, Tensor) as a hyperintense or hypointense signal depending on the MRI sequence. dMRI data (B0 and DiMANI) appears to more readily show PICS but the other promising sequences could potentially be optimized to improve the visualization of the landmark further. The visibility of PICS on routinely used sequences such as FGATIR, T1, and T2star suggests a potentially easy translation of the use of PICS in the clinic. Note that we did not see PICS on our T2, but it was visible on the template; while it could be a matter of SNR, it could be the result of comparing images from very different T2 protocols. Further, in Figure 1, while our QSM image appears to show PICS, the template QSM did not. This again may be due to differences with the MRI protocol used in the acquisition of the images that make up the template. Finally, different approaches have been utilized to generate a neuromelanin-sensitive contrast, so while we did not see PICS with the common magnetization transfer-weighted TFL approach, others might be able to view it using a turbo spin echo approach.
4.4 Clinical relevance and next steps
After decades of successful experiences with surgical interventions for movement disorders, variability in outcomes can be potentially explained in part by electrode location. Improving targeting accuracy to specific subregions and correlations with outcomes is a growing research field (Vitek et al., 2022; Schrock et al., 2021; Gunalan et al., 2017; Brinda et al., 2023; Ikramuddin et al., 2023). Although recent advances to directly visualize the Vim (Najdenovska et al., 2019; Chiang et al., 2018; Sudhyadhom et al., 2009; Su et al., 2019; Middlebrooks et al., 2021; Patriat et al., 2024) have been proposed, many of these are still lacking routine clinical adoption as visualizing the borders of thalamic subnuclei remains a challenge. Figure 1 shows that the simple PICS landmark could be more easily seen than the thalamic subnuclei on a T1, FGATIR, B0 and T2* image. Therefore, PICS can be potentially used as an extra tool to improve target accuracy even in poor quality cases when thalamic borders cannot be well delineated, as Vim is directly medial to the center of mass of PICS, and that there can be partial overlap between the posterior region of PICS and regions lateral to Vc. Further, the knowledge of PICS corresponding to motor internal capsule allows clinicians to translate it into a clinical marker that can be identified in real time during intraoperative testing and outpatient programming. Given the novelty of PICS, there are currently, to our knowledge, no studies evaluating the clinical validity and applicability of this landmark across different medical conditions, age groups, and MRI protocols and manufacturers. Therefore, future studies could focus on comparing PICS identification across different populations with varying degrees of cortical and subcortical atrophy (either due to age or disorder). This would be an interesting topic to explore further. Subsequent studies could also evaluate potential correlations between lead (or lesion) location relative to PICS and clinical outcomes.”
4.5 Limitations
Despite rigorous protocol to ensure quality of the dataset, we acknowledge potential heterogeneity in localizations of the tractography, within the pLIC, from the most ventral cortical ROIs. This is likely due to a suboptimal performance in determining fiber orientation in regions of crossing fibers. Higher b-values and/or multi-shell acquisition schemes should remedy this issue. Additionally, while we did not directly explore the relationship between stimulation-induced side effects and pLIC parcellation, the proof-of-concept presented hopefully exemplifies a hypothesis to serve as a foundation for future exploratory analysis. Future studies should focus on clinically validating PICS as a landmark to help with Vim targeting.
5 Conclusion
PICS is a novel imaging landmark located in the pLIC. It appears to be consistently detected in both 3 T and 7 T imaging, and although it is best visible on DiMANI, it can also be detected in other methods. Tractography analysis shows that it is mostly comprised of CST, but not CBT fibers. Given its location lateral to the Vim with the most posterior aspect sometimes located lateral to Vc, it can be potentially used as a tool to further refine surgical targeting, including cases where the quality of preoperative imaging may not provide accurate thalamic subnuclei border detection. Further studies are needed to correlate proximity to PICS and lead/lesion location and clinical outcomes.
Data availability statement
The raw data supporting the conclusions of this article will be made available by the authors, without undue reservation.
Ethics statement
The studies involving humans were approved by University of Minnesota Internal Review Board. The studies were conducted in accordance with the local legislation and institutional requirements. The participants provided their written informed consent to participate in this study.
Author contributions
RP: Conceptualization, Data curation, Formal analysis, Investigation, Methodology, Validation, Visualization, Writing – original draft, Writing – review & editing. JC: Data curation, Formal analysis, Writing – review & editing. KS: Writing – review & editing. HB: Data curation, Writing – review & editing. SB: Writing – review & editing. YS: Data curation, Writing – review & editing. JA: Data curation, Formal analysis, Methodology, Writing – review & editing. MH: Data curation, Formal analysis, Methodology, Writing – review & editing. JV: Data curation, Methodology, Resources, Supervision, Writing – review & editing. NH: Conceptualization, Data curation, Funding acquisition, Resources, Supervision, Writing – review & editing. LA: Conceptualization, Data curation, Formal analysis, Methodology, Resources, Supervision, Visualization, Writing – review & editing.
Funding
The author(s) declare that financial support was received for the research and/or publication of this article. This study was funded by the following National Institution of Health Grants: R01 NS081118, R01 NS113746, S10 OD025256, P41EB027061 and P50 NS123109.
Conflict of interest
The authors declare that the research was conducted in the absence of any commercial or financial relationships that could be construed as a potential conflict of interest.
Generative AI statement
The authors declare that no Gen AI was used in the creation of this manuscript.
Any alternative text (alt text) provided alongside figures in this article has been generated by Frontiers with the support of artificial intelligence and reasonable efforts have been made to ensure accuracy, including review by the authors wherever possible. If you identify any issues, please contact us.
Publisher’s note
All claims expressed in this article are solely those of the authors and do not necessarily represent those of their affiliated organizations, or those of the publisher, the editors and the reviewers. Any product that may be evaluated in this article, or claim that may be made by its manufacturer, is not guaranteed or endorsed by the publisher.
Footnotes
References
Abosch, A., Yacoub, E., Ugurbil, K., and Harel, N. (2010). An assessment of current brain targets for deep brain stimulation surgery with susceptibility-weighted imaging at 7 tesla. Neurosurgery 67, 1745–1756; discussion 1756. doi: 10.1227/NEU.0b013e3181f74105
Agrawal, M., Garg, K., Samala, R., Rajan, R., Naik, V., and Singh, M. (2021). Outcome and complications of MR guided focused ultrasound for essential tremor: a systematic review and Meta-analysis. Front. Neurol. 12:654711. doi: 10.3389/fneur.2021.654711
Amunts, K., Lepage, C., Borgeat, L., Mohlberg, H., Dickscheid, T., Rousseau, M., et al. (2013). BigBrain: an ultrahigh-resolution 3D human brain model. Science 340, 1472–1475. doi: 10.1126/science.1235381
Archer, D. B., Vaillancourt, D. E., and Coombes, S. A. (2018). A template and probabilistic atlas of the human sensorimotor tracts using diffusion MRI. Cereb. Cortex 28, 1685–1699. doi: 10.1093/cercor/bhx066
Axer, H., and Keyserlingk, D. G. (2000). Mapping of fiber orientation in human internal capsule by means of polarized light and confocal scanning laser microscopy. J. Neurosci. Methods 94, 165–175. doi: 10.1016/s0165-0270(99)00132-6
Bannister, L. (2011). Internal capsule [Online]. King's College London. Available online at: https://ehealth.kcl.ac.uk/tel/NA1-HTML5/Pages/Shared/02-02_internal-capsule_02.html (Accessed November 20, 2025).
Behrens, T. E., Berg, H. J., Jbabdi, S., Rushworth, M. F., and Woolrich, M. W. (2007). Probabilistic diffusion tractography with multiple fibre orientations: what can we gain? NeuroImage 34, 144–155. doi: 10.1016/j.neuroimage.2006.09.018
Brinda, A., Slopsema, J. P., Butler, R. D., Ikramuddin, S., Beall, T., Guo, W., et al. (2023). Lateral cerebellothalamic tract activation underlies DBS therapy for essential tremor. Brain Stimul. 16, 445–455. doi: 10.1016/j.brs.2023.02.002
Bürgel, U., Amunts, K., Hoemke, L., Mohlberg, H., Gilsbach, J. M., and Zilles, K. (2006). White matter fiber tracts of the human brain: three-dimensional mapping at microscopic resolution, topography and intersubject variability. NeuroImage 29, 1092–1105. doi: 10.1016/j.neuroimage.2005.08.040
Chiang, G. C., Hu, J., Morris, E., Wang, Y., and Gauthier, S. A. (2018). Quantitative susceptibility mapping of the thalamus: relationships with thalamic volume, Total Gray matter volume, and T2 lesion burden. AJNR Am. J. Neuroradiol. 39, 467–472. doi: 10.3174/ajnr.A5537
Cury, R. G., Fraix, V., Castrioto, A., Pérez Fernández, M. A., Krack, P., Chabardes, S., et al. (2017). Thalamic deep brain stimulation for tremor in Parkinson disease, essential tremor, and dystonia. Neurology 89, 1416–1423. doi: 10.1212/WNL.0000000000004295
Fan, L., Li, H., Zhuo, J., Zhang, Y., Wang, J., Chen, L., et al. (2016). The human Brainnetome atlas: a new brain atlas based on connectional architecture. Cereb. Cortex 26, 3508–3526. doi: 10.1093/cercor/bhw157
Fasano, A., and Helmich, R. C. (2019). Tremor habituation to deep brain stimulation: underlying mechanisms and solutions. Mov. Disord. 34, 1761–1773. doi: 10.1002/mds.27821
Ferreira Felloni Borges, Y., Cheyuo, C., Lozano, A. M., and Fasano, A. (2023). Essential tremor - deep brain stimulation vs. focused ultrasound. Expert. Rev. Neurother. 23, 603–619. doi: 10.1080/14737175.2023.2221789
Giordano, M., Caccavella, V. M., Zaed, I., Foglia Manzillo, L., Montano, N., Olivi, A., et al. (2020). Comparison between deep brain stimulation and magnetic resonance-guided focused ultrasound in the treatment of essential tremor: a systematic review and pooled analysis of functional outcomes. J. Neurol. Neurosurg. Psychiatry 91, 1270–1278. doi: 10.1136/jnnp-2020-323216
Gray, H., and Lewis, W. H. (1918). Anatomy of the human body. Philadelphia and New York: Lea & Febiger. Available at: https://archive.org/details/anatomyofhumanbo1918gray/page/n5/mode/2up
Gunalan, K., Chaturvedi, A., Howell, B., Duchin, Y., Lempka, S. F., Patriat, R., et al. (2017). Creating and parameterizing patient-specific deep brain stimulation pathway-activation models using the hyperdirect pathway as an example. PLoS One 12:e0176132. doi: 10.1371/journal.pone.0176132
He, C., Guan, X., Zhang, W., Li, J., Liu, C., Wei, H., et al. (2023). Quantitative susceptibility atlas construction in Montreal neurological institute space: towards histological-consistent iron-rich deep brain nucleus subregion identification. Brain Struct. Funct. 228, 1045–1067. doi: 10.1007/s00429-022-02547-1
Hervé, P. Y., Cox, E. F., Lotfipour, A. K., Mougin, O. E., Bowtell, R. W., Gowland, P. A., et al. (2011). Structural properties of the corticospinal tract in the human brain: a magnetic resonance imaging study at 7 tesla. Brain Struct. Funct. 216, 255–262. doi: 10.1007/s00429-011-0306-0
Ikramuddin, S. S., Brinda, A. K., Butler, R. D., Hill, M. E., Dharnipragada, R., Aman, J. E., et al. (2023). Active contact proximity to the cerebellothalamic tract predicts initial therapeutic current requirement with DBS for ET: an application of 7T MRI. Front. Neurol. 14:1258895. doi: 10.3389/fneur.2023.1258895
Klein, S., Staring, M., Murphy, K., Viergever, M. A., and Pluim, J. P. (2010). Elastix: a toolbox for intensity-based medical image registration. IEEE Trans. Med. Imaging 29, 196–205. doi: 10.1109/TMI.2009.2035616
Koller, W. C., and Vetere-Overfield, B. (1989). Acute and chronic effects of propranolol and primidone in essential tremor. Neurology 39, 1587–1588. doi: 10.1212/WNL.39.12.1587
Lee, D., and Park, H. J. (2022). A populational connection distribution map for the whole brain white matter reveals ordered cortical wiring in the space of white matter. NeuroImage 254:119167. doi: 10.1016/j.neuroimage.2022.119167
Louis, E. D. (2005). Essential tremor. Lancet Neurol. 4, 100–110. doi: 10.1016/S1474-4422(05)00991-9
Mayka, M. A., Corcos, D. M., Leurgans, S. E., and Vaillancourt, D. E. (2006). Three-dimensional locations and boundaries of motor and premotor cortices as defined by functional brain imaging: a meta-analysis. NeuroImage 31, 1453–1474. doi: 10.1016/j.neuroimage.2006.02.004
Middlebrooks, E. H., Okromelidze, L., Lin, C., Jain, A., Westerhold, E., Ritaccio, A., et al. (2021). Edge-enhancing gradient echo with multi-image co-registration and averaging (Edge-Micra) for targeting thalamic centromedian and parafascicular nuclei. Neuroradiol. J. 34, 667–675. doi: 10.1177/19714009211021781
Min, K., Sohn, B., Kim, W. J., Park, C. J., Song, S., Shin, D. H., et al. (2024). A human brain atlas of χ-separation for normative iron and myelin distributions. NMR Biomed. 37:e5226. doi: 10.1002/nbm.5226
Morecraft, R. J., Binneboese, A., Stilwell-Morecraft, K. S., and Ge, J. (2017). Localization of orofacial representation in the corona radiata, internal capsule and cerebral peduncle in Macaca mulatta. J. Comp. Neurol. 525, 3429–3457. doi: 10.1002/cne.24275
Mori, S., Oishi, K., Jiang, H., Jiang, L., Li, X., Akhter, K., et al. (2008). Stereotaxic white matter atlas based on diffusion tensor imaging in an Icbm template. NeuroImage 40, 570–582. doi: 10.1016/j.neuroimage.2007.12.035
Najdenovska, E., Tuleasca, C., Jorge, J., Maeder, P., Marques, J. P., Roine, T., et al. (2019). Comparison of Mri-based automated segmentation methods and functional neurosurgery targeting with direct visualization of the Ventro-intermediate thalamic nucleus at 7T. Sci. Rep. 9:1119. doi: 10.1038/s41598-018-37825-8
Northam, G. B., Morgan, A. T., Fitzsimmons, S., Baldeweg, T., and Liégeois, F. J. (2019). Corticobulbar tract injury, Oromotor impairment and language plasticity in adolescents born preterm. Front. Hum. Neurosci. 13:45. doi: 10.3389/fnhum.2019.00045
Patriat, R., Palnitkar, T., Chandrasekaran, J., Sretavan, K., Braun, H., Yacoub, E., et al. (2024). Dimani: diffusion MRI for anatomical nuclei imaging-application for the direct visualization of thalamic subnuclei. Front. Hum. Neurosci. 18:1324710. doi: 10.3389/fnhum.2024.1324710
Rolston, J. D., Englot, D. J., Starr, P. A., and Larson, P. S. (2016). An unexpectedly high rate of revisions and removals in deep brain stimulation surgery: analysis of multiple databases. Parkinsonism Relat. Disord. 33, 72–77. doi: 10.1016/j.parkreldis.2016.09.014
Schrock, L. E., Patriat, R., Goftari, M., Kim, J., Johnson, M. D., Harel, N., et al. (2021). 7T MRI and computational modeling supports a critical role of Lead location in determining outcomes for deep brain stimulation: a case report. Front. Hum. Neurosci. 15:631778. doi: 10.3389/fnhum.2021.631778
Shih, L. C., Lafaver, K., Lim, C., Papavassiliou, E., and Tarsy, D. (2013). Loss of benefit in vim thalamic deep brain stimulation (Dbs) for essential tremor (et): how prevalent is it? Parkinsonism Relat. Disord. 19, 676–679. doi: 10.1016/j.parkreldis.2013.03.006
Su, J. H., Thomas, F. T., Kasoff, W. S., Tourdias, T., Choi, E. Y., Rutt, B. K., et al. (2019). Thalamus optimized multi atlas segmentation (Thomas): fast, fully automated segmentation of thalamic nuclei from structural MRI. NeuroImage 194, 272–282. doi: 10.1016/j.neuroimage.2019.03.021
Sudhyadhom, A., Haq, I. U., Foote, K. D., Okun, M. S., and Bova, F. J. (2009). A high resolution and high contrast MRI for differentiation of subcortical structures for Dbs targeting: the fast Gray matter acquisition T1 inversion recovery (Fgatir). NeuroImage 47, T44–T52. doi: 10.1016/j.neuroimage.2009.04.018
Vitek, J. L., Patriat, R., Ingham, L., Reich, M. M., Volkmann, J., and Harel, N. (2022). Lead location as a determinant of motor benefit in subthalamic nucleus deep brain stimulation for Parkinson's disease. Front. Neurosci. 16:1010253. doi: 10.3389/fnins.2022.1010253
Weiss, C., Tursunova, I., Neuschmelting, V., Lockau, H., Nettekoven, C., Oros-Peusquens, A. M., et al. (2015). Improved ntms- and Dti-derived Cst tractography through anatomical Roi seeding on anterior pontine level compared to internal capsule. Neuroimage Clin 7, 424–437. doi: 10.1016/j.nicl.2015.01.006
Whaley, N. R., Putzke, J. D., Baba, Y., Wszolek, Z. K., and Uitti, R. J. (2007). Essential tremor: phenotypic expression in a clinical cohort. Parkinsonism Relat. Disord. 13, 333–339. doi: 10.1016/j.parkreldis.2006.12.004
Xu, F., Ma, W., Huang, Y., Qiu, Z., and Sun, L. (2016). Deep brain stimulation of pallidal versus subthalamic for patients with Parkinson's disease: a meta-analysis of controlled clinical trials. Neuropsychiatr. Dis. Treat. 12, 1435–1444. doi: 10.2147/NDT.S105513
Zesiewicz, T. A., Chari, A., Jahan, I., Miller, A. M., and Sullivan, K. L. (2010). Overview of essential tremor. Neuropsychiatr. Dis. Treat. 6, 401–408. doi: 10.2147/ndt.s4795
Zesiewicz, T. A., Elble, R. J., Louis, E. D., Gronseth, G. S., Ondo, W. G., Dewey, R. B., et al. (2011). Evidence-based guideline update: treatment of essential tremor: report of the quality standards subcommittee of the American Academy of Neurology. Neurology 77, 1752–1755. doi: 10.1212/WNL.0b013e318236f0fd
Zhang, H., Avants, B. B., Yushkevich, P. A., Woo, J. H., Wang, S., Mccluskey, L. F., et al. (2007). High-dimensional spatial normalization of diffusion tensor images improves the detection of white matter differences: an example study using amyotrophic lateral sclerosis. IEEE Trans. Med. Imaging 26, 1585–1597. doi: 10.1109/TMI.2007.906784
Keywords: DBS, DiMANI, direct targeting, patient-specific, diffusion MRI, internal capsule
Citation: Patriat R, Chandrasekaran J, Sretavan K, Braun H, Brenny S, Seddighi Y, Aman JE, Hill M, Vitek JL, Harel N and Almeida L (2025) “PICS”: a novel patient-specific landmark for thalamic surgical interventions in the posterior limb of the internal capsule signal. Front. Hum. Neurosci. 19:1707031. doi: 10.3389/fnhum.2025.1707031
Edited by:
Joshua K. Wong, University of Florida, United StatesReviewed by:
Cherry Yu, Vanderbilt University Medical Center, United StatesVineesh Varghese, Pantai Jerudong Specialist Centre (PJSC), Brunei
Copyright © 2025 Patriat, Chandrasekaran, Sretavan, Braun, Brenny, Seddighi, Aman, Hill, Vitek, Harel and Almeida. This is an open-access article distributed under the terms of the Creative Commons Attribution License (CC BY). The use, distribution or reproduction in other forums is permitted, provided the original author(s) and the copyright owner(s) are credited and that the original publication in this journal is cited, in accordance with accepted academic practice. No use, distribution or reproduction is permitted which does not comply with these terms.
*Correspondence: Rémi Patriat, cGF0cmkxMDhAdW1uLmVkdQ==