 Peter T. Shyu
 Samuel T. Robinson
 X. Edward Guo
- Bone Bioengineering Lab, Department of Biomedical Engineering, Columbia University, New York, NY, United States
Bone is constantly adapting each of its microstructural compartments by modeling and remodeling. These adaptations are delineated by whether bone formation and resorption are coupled in space and time. Time-lapse microCT imaging has become a valuable technique for characterizing bone dynamics in 3D. Our previous study used longitudinal microCT imaging to quantify modeling and remodeling across the bone microstructure in response to PTH treatment and mechanical loading. Here, we detail our technique of voxel-tracking to specifically identify time-dependent modeling and remodeling by examining the sequence of formation and resorption events in trabecular and cortical bone. We apply this technique to WT and SOST KO littermate mice under long-term mechanical loading and quantify site-specific bone volume changes. Loading particularly affected WT trabecular and periosteal bone by increasing anabolic modeling and remodeling while decreasing catabolic modeling. Under load-controlled loading, these effects were reduced in SOST KO mice. Endosteal bone was less responsive to loading for both genotypes, with subtler and more time-dependent responses resulting in a load-dependent increase in WT catabolic modeling. Thus, we present a technique that directly assesses longitudinal 3D bone modeling and remodeling across the bone microstructure.
1 Introduction
Bone is a dynamic organ that constantly adapts to fulfill its mechanical and metabolic functions (Raisz, 1999; Wolff, 1893; Fukumoto and Martin, 2009). The cellular activity of osteoblasts for bone formation and osteoclasts for bone resorption are coordinated for healthy bone modeling and remodeling (Rodan, 1992; Bonewald, 2011). In metabolic bone diseases like osteoporosis, there is an imbalance between formation and resorption dynamics (Greenblatt et al., 2017; Feng and McDonald, 2011), resulting in a systemic degradation of bone mass, architecture, and strength, increasing one’s risk for fragility fractures (Rachner et al., 2011; Wood et al., 1992). It has been estimated that globally, fractures affect 1 in 2 women and 1 in 5 men over the age of 50, and the economic burden of fractures in US women may increase to over $95 billion by 2040 (Melton et al., 1998; Burge et al., 2007; Lewiecki et al., 2019).
The mechanisms by which bone modifies its structure can be separated into modeling and remodeling, depending on the sequence of bone formation and resorption events (Parfitt, 1984; Raggatt and Partridge, 2010). Remodeling is bone formation and resorption coupled in space and time, while the events are uncoupled in modeling (Hadjidakis and Androulakis, 2006; Seeman, 2009). Basic multicellular units (BMUs) carry out bone remodeling, where osteoclasts resorb bone and leave behind a scalloped surface, followed by a reversal phase, allowing osteoblasts to form bone at the previously resorbed bone locations (Hattner et al., 1965; Erben, 1996; Bolamperti et al., 2022). Regions of bone resorption and sites of modeling versus remodeling activity can be identified by examining the curvature of bone cement lines in 2D histology sections (Wang et al., 2021; Tkachenko et al., 2009). Bone formation is standardly analyzed by 2D dynamic histomorphometry by administering multiple fluorochromes that chelate to the calcium in mineralizing bone, separated by a time interval (van Gaalen et al., 2010; Dempster et al., 2013; Frost, 1969; Parfitt et al., 1987), while bone resorption is only measured indirectly (Courpron et al., 1980). Other challenges and technical difficulties with traditional bone histomorphometry include subjectivity in distinguishing smooth and scalloped bone cement lines, overlapping spectra from multiple fluorochrome labels, lack of labels with osteoporosis therapeutics, and the need for ex vivo processing and analysis of 2D samples (Recker et al., 2011; Pautke et al., 2005). Standard dynamic histomorphometry has also been applied in 3D (Slyfield et al., 2012), but there remains the potential for an improved technique to characterize the 3D bone dynamics.
The advancement of computed tomography (CT) imaging technologies has facilitated the direct evaluation of the in vivo 3D bone structure and application to preclinical animal models and human studies (Feldkamp et al., 1989; Kapadia et al., 1998; Laib and Ruegsegger, 1999; David et al., 2003). Using image registration, the application of CT imaging to accurately (Boyd et al., 2006)and longitudinally identify bone formation and resorption was first shown in the rat tibia (Waarsing et al., 2004). This technique was then developed to quantify bone formation and resorption dynamics in the mouse tail vertebral trabecular and cortical bone (Schulte et al., 2011; Lambers et al., 2011) and tibial cortical bone (Birkhold et al., 2014a). Due to continual growth plate activity in the rat tibia, a 2-step image registration scheme has been used to quantify in vivo trabecular bone formation and resorption (de Bakker et al., 2015; Altman et al., 2015; Lan et al., 2013). Studies on bone remodeling have typically been limited to formation and resorption, while few have specifically quantified remodeling as bone formation following bone resorption at a specific location. The use of time-lapse microCT to identify modeling and remodeling events by coupled bone resorption and formation events was detailed by Birkhold et al. in cortical bone (Birkhold et al., 2015). In a previous study, our group used a method of longitudinal in vivo microCT and image registration to specifically quantify bone modeling and remodeling in terms of independent formation (anabolic modeling), independent resorption (catabolic modeling), and formation coupled to resorption at the voxel-level (remodeling) in both trabecular and cortical bone microstructure (Robinson et al., 2021).
Although there is no cure for osteoporosis, several pharmaceutical treatments are available to improve bone strength, and their mechanism of action can be classified as either anti-catabolic or anabolic (Riggs and Parfitt, 2005). Bisphosphonates and denosumab are anti-catabolic drugs that primarily affect remodeling by reducing bone resorption and activating BMUs (Liberman et al., 1995; Chesnut et al., 2004; Reid et al., 2002; Harris et al., 1999; Cummings et al., 2009). Conversely, teriparatide/abaloparatide and romosozumab are anabolic drugs that mostly stimulate bone formation in remodeling (Neer et al., 2001; Leder et al., 2015; McClung et al., 2014). While these therapies target bone formation or resorption in remodeling, they also have coupled effects on other metabolic responses (Langdahl et al., 2016; Reid and Billington, 2022). Romosozumab, a humanized antibody against sclerostin (encoded by the SOST gene), is a treatment with time-dependent effects on trabecular and cortical bone (McClung et al., 2014; Cosman et al., 2016). Romosozumab has been shown to affect bone modeling and remodeling dynamics at the BMU level (Boyce et al., 2017; Chavassieux et al., 2019; Eriksen et al., 2024; Ominsky et al., 2017). However, the use of these therapies is limited, and guidelines suggest taking drug holidays or a drug transition for continual improvement in a patient’s bone strength (Reid and Billington, 2022; McClung et al., 2013; Nuti et al., 2019).
A promising noninvasive treatment option for osteoporosis is mechanical loading, or exercise, to improve bone strength and reduce fracture risk (Feskanich et al., 2002; Harding et al., 2020; Howe et al., 2011; Watson et al., 2018). Bone adapts to mechanical loading (Wolff, 1893), with a strain-dependent modeling and remodeling response described by the mechanostat hypothesis (Frost, 1983; Frost, 2003; Frost, 1987). The mouse tibia loading model has become widely used to study bone mechanoadaptation (Main et al., 2020; Melville et al., 2015; Gross et al., 2002; Turner et al., 1991). However, most analyses only measure bone adaptations in terms of formation and resorption, and do not quantify whether these changes are coupled together. Given the limitations of current treatments, it is critical to distinguish bone modeling and remodeling across the bone microstructure and their dynamics over time (Foessl et al., 2023; Dent et al., 2023; Hoffmann et al., 2023; Schumm et al., 2023). Here, we describe a method for directly quantifying in vivo 3D modeling and remodeling over time in trabecular and cortical bone compartments and apply it to investigate the effects of SOST depletion and mechanical loading.
2 Materials and methods
2.1 Animals
SOST KO mice on the C57Bl/6 background were donated by Dr. Alexander Robling (Indiana University). Wildtype C57Bl/6 (WT) mice were purchased from The Jackson Laboratory (Strain No. 000664). Heterozygous breeding pairs were established to produce WT and SOST KO littermate mice. Genotypes were confirmed via qPCR using the primers for WT mice (forward primer, 5′-TTGTGCACGCTGCCTTCTG-3’; reverse primer, 5′-CTCCAAGCCCTGGGATGAC-3′) and SOST KO mice (forward primer, 5′GTGAGGAAACATGGGACCAG-3’; reverse primer, 5′-AGTTGCTGGCTTGGTCTGTC-3′). Animals had access to standard rodent chow and drinking water ad libitum. No animals were singly housed. All experiments were performed under a protocol approved by the Columbia Institutional Animal Care and Use Committee.
2.2 In vivo tibial loading
Mechanical loading was applied to 16-week-old mice 5 consecutive days per week for 5 weeks, as previously described (Robinson et al., 2021). The right tibia of each animal was unilaterally loaded by axial tibial compression, with the left tibia as the internal, nonloaded control. The knee joint and foot of the loaded tibia were fit into a hemispherical cavity and a custom 3D-printed angled plate, respectively (Figure 1A), under isoflurane anesthesia at 1.5%–2.5% v/v in oxygen delivered at 1.5–1.0 L/min. A standard load frame with a linear actuator and control system (Bose ElectroForce, TA Instruments) was used to apply a preload of 1 N compression for 4 min, followed by a haversine waveform between 1 N and 9 N compression for 100 cycles at 2 Hz. After loading, mice were allowed to recover in a private cage on a heating pad and were monitored for normal gait and behavior before being returned to their standard housing.
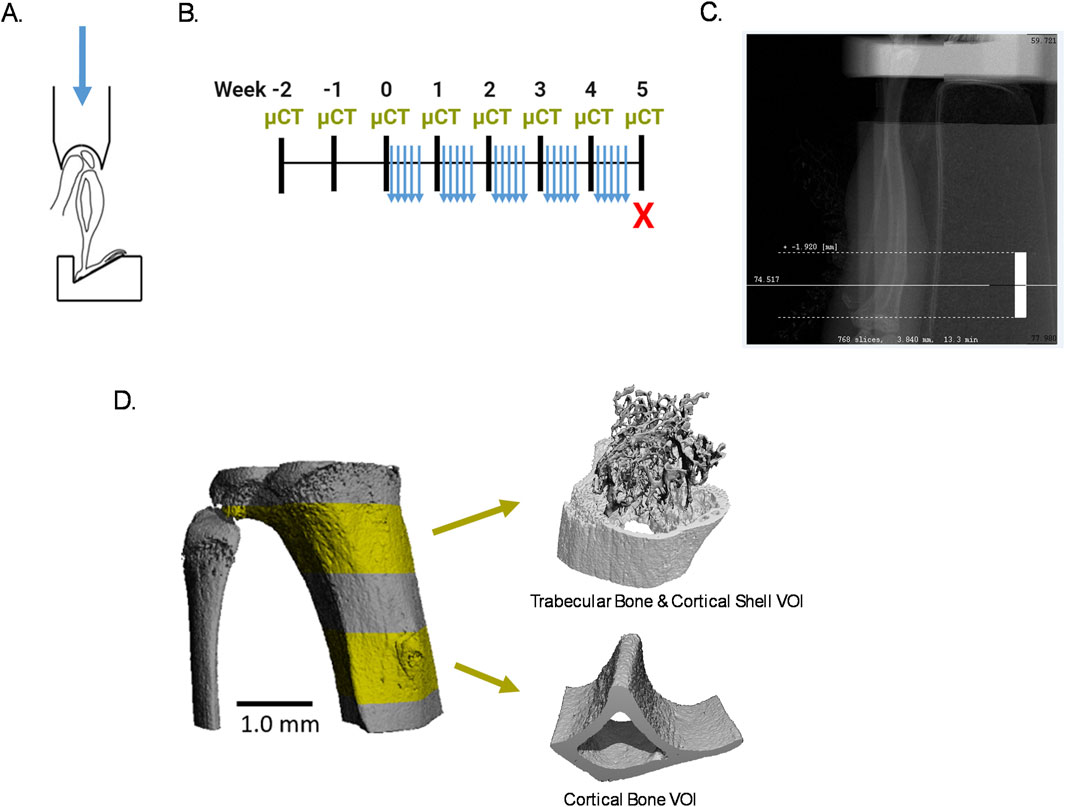
Figure 1. Experimental design. (A) Schematic of mouse tibia in mechanical loader. Used and adapted from Robinson (2020) with permission. (B) Experimental timeline. (C) Radiograph of a microCT scout view with the white dashed lines around the scanned VOI. (D) Representative 3D segmentation of the scanned region with the trabecular and cortical VOIs in highlighted in yellow.
2.3 In vivo MicroCT
To quantify modeling and remodeling from the onset of mechanical loading, it was necessary to begin in vivo microCT imaging (Scanco vivaCT 80, Scanco Medical AG) of the tibia 2 weeks before the start of mechanical loading with weekly follow-up imaging (Figure 1B), which follows our previous work (Robinson et al., 2021). Scanning parameters were 55 kVp energy (X-ray tube potential, peak voltage), 145 µA intensity (X-ray tube current), 300 ms integration time (for each tomographic projection), and no frame averaging, using a 0.5 mm Al filter. Projections over 180° were set to 1,000 and images were reconstructed at 5 µm isotropic voxel size. Each tibia scan included a 3.84 mm region in length, starting from the proximal growth plate and extending distally, consisting of one full cone beam stack of 768 slices, resulting in a scan time of 13.3 min (Figure 1C).
For each mouse, both tibiae were scanned in succession while under nose cone isoflurane anesthesia at 1.5%–2.5% v/v in oxygen delivered at 1.5–1.0 L/min. Using a fixture provided by the manufacturer, each mouse was placed in the lateral position, and the contralateral lower limb was fit through the fixture and further secured with tape and gauze over the foot, ankle, and tibia to prevent possible motion artifacts. After scanning the right tibia, the mouse was turned over, replacing the tape and gauze, to scan the left tibia. Like after mechanical loading, each mouse recovered from scanning in a private cage on a heating pad before returning to standard housing.
2.4 Regions of interest
In each weekly scan, a 1.0 mm region in length of trabecular and cortical bone was extracted, beginning 0.15 mm and 2.0 mm distal to the proximal metaphyseal growth plate, respectively (Figure 1D). An additional 0.2 mm region in length was included at the proximal and distal ends of the trabecular and cortical bone regions to ensure that after alignment of all microCT images by image registration, a full 1.0 mm region in length could be analyzed each week.
2.5 Image registration
Image registration and analysis follow our previous work (Robinson et al., 2021). Full-resolution 16-bit grayscale images of extracted trabecular and cortical bone regions were registered and transformed to a common 3D position using Scanco Image Processing Language (IPL V5.16/regis V1.06) algorithms on an HP OpenVMS Industry Standard 64 Operating System, V8.4 (Figure 2A). To minimize bias from interpolation of voxel values during image transformation, the first pair of weekly microCT images were transformed to their midpoint so that every weekly image is transformed (de Bakker et al., 2015). To do so, the transformation matrix T was determined from the first set of images, and a custom MATLAB script was used to calculate T1/2 which was applied to the first set’s follow-up image. The remaining microCT images were then transformed to this position in the same global coordinate system by registering consecutive pairs of weekly images, resulting in every image being subject to similar interpolation effects of image transformation.
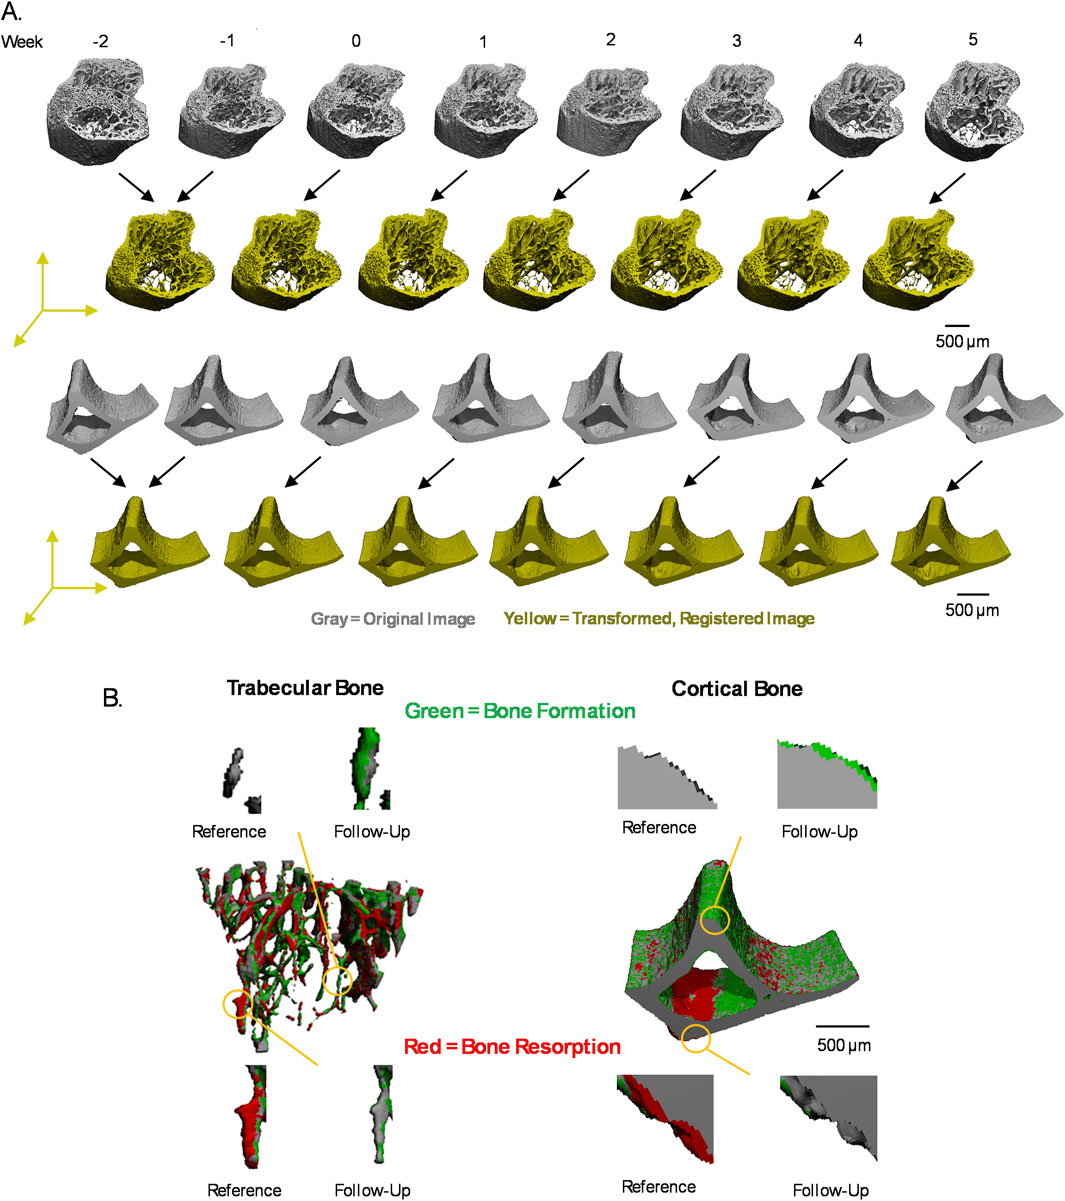
Figure 2. Image registration scheme and voxel labeling. (A) Each of the weekly microCT images (gray) are transformed to a common 3D position (yellow) by image registration of paired images from consecutive weeks for trabecular and cortical bone. Representative figures shown are grayscale images, segmented for visualization. (B) Voxel-level events were labeled by formation (green), resorption (red), constant bone (gray), and background in weekly transition images generated by comparing consecutive pairs of weekly, registered trabecular or cortical bone.
Images were first aligned by center of mass, followed by 3D rigid registration using a downhill simplex method to maximize the normalized correlation coefficient. Registration of images was performed when downscaled to three levels (10, 4, 1) to avoid local maxima during registration. Two registration steps were used to align trabecular bone regions because the trabecular bone shifts distally over time due to the continually active growth plate in mice of this age (de Bakker et al., 2015; Robinson et al., 2021; Glatt et al., 2007; Jilka, 2013). First, a mask, including the whole bone (trabecular bone and cortical shell), was used to register the images, followed by a trabecular bone-specific mask (Supplementary Figure S1A). Registration of the cortical bone regions followed the same procedures but required only one step using a mask of the entire cortical bone (Supplementary Figure S1B). Each follow-up image was then overlaid on the reference image for visual inspection of accurate image registration.
2.6 In vivo quantification of (Re)modeling
After image registration, a Gaussian filter (sigma = 0.8, support = 1) was applied to both reference and follow-up images to reduce noise. Images were segmented by applying global threshold values of 360 and 400 per mille (%0), equal to 584.3 and 668.1 mgHa/cm3 or 3,864.7 and 4,404.9 Hounsfield units, for trabecular bone and cortical bone, respectively (Bouxsein et al., 2010; Luo et al., 2022). The reference image was then subtracted from the follow-up image to identify bone formed and bone resorbed, which were saved as separate images. To capture bone formation at its earliest stage, as osteoid is first secreted and then mineralized over time, voxels with values greater than 75% of the global threshold value after image subtraction were also classified as formed bone (Robinson et al., 2021). The resulting images of only bone formed and only bone resorbed were further filtered by removing clusters of less than 15 voxels, as they were considered likely to be noise (Christen et al., 2014). Masking algorithms were used to ensure that voxels classified as bone formed were labeled as bone in the follow-up image and as background in the reference image, and vice versa for voxels classified as bone resorbed. The segmented reference image was converted to a mask, inverted, saved as a mask, and then applied to the bone-formed image, ensuring that bone formation only occurred in regions with no bone previously. Similarly, a mask of the segmented reference image and an inverted mask of the segmented follow-up image were applied to the bone resorbed image, ensuring that bone resorption occurred only in the bone of the reference image and resulted in background in the follow-up image. The segmented reference and follow-up images were added together to identify voxels labeled as bone in both time points, resulting in a constant bone image. The constant bone image, formed bone image, and resorbed bone images were concatenated to generate weekly transition images with each voxel labeled with the bone event that occurred (Figure 2B). Background voxels were also labeled with a non-zero value so that after conversion of the image to a text file, the 3D coordinate information of each voxel was preserved.
Quantifying bone volume changes was done by tracking the events at the voxel-level over the experimental timeline. Once all the weekly transition images were generated (Figures 3A, B), they were cut with a mask so that each image was the same size and contained the same number of voxels. Weekly transition images were added together to generate a mask that includes voxels labelled in all images. The mask was then used to cut all weekly images to the same size. For cortical bone, a mask was drawn to divide endosteal and periosteal bone from the cut cortical bone images. Cut images were converted to text files listing each voxel’s coordinate and a value designating its bone adaptation event (formation, resorption, constant bone, background) using a custom C-based program. A custom script in MATLAB was then used to quantify bone volume changes at each voxel. The dimensions of each weekly transition image were additionally checked to confirm that they were all the same size. A matrix spanning the length of the number of voxels contained in the cut weekly images was initialized so that the weekly bone events at each voxel could be recorded. Each weekly transition image was read in and the bone events occurring at each voxel were recorded to the corresponding location in the matrix. The sequence of bone events at each voxel was then characterized by applying a moving window to count the bone events at that voxel to quantify the overall bone volume, formation, resorption, anabolic modeling, remodeling, and catabolic modeling events at each applicable timepoint. Bone formation and resorption were defined as formation and resorption events that occurred in a single weekly transition image. Modeling and remodeling were defined as a sequence of 3 events: remodeling as resorption–quiescence–formation, anabolic modeling as quiescence–quiescence–formation, and catabolic modeling as resorption–quiescence–quiescence (Figure 3C). Bone voxels formed by anabolic modeling and remodeling can be quantified through the duration of mechanical loading because baseline µCT scanning began 2 weeks prior to the start of mechanical loading. With 5 weeks of mechanical loading, catabolic modeling can be quantified at the first 3 time points because week 3 is the last week with 2 follow-up images (week 4 and 5) available to distinguish catabolic modeling. Bone volume changes, formation, and resorption events were normalized to their respective values at baseline (week 0) prior to the start of loading. Modeling and remodeling values were normalized to the baseline bone volume prior to the start of loading.
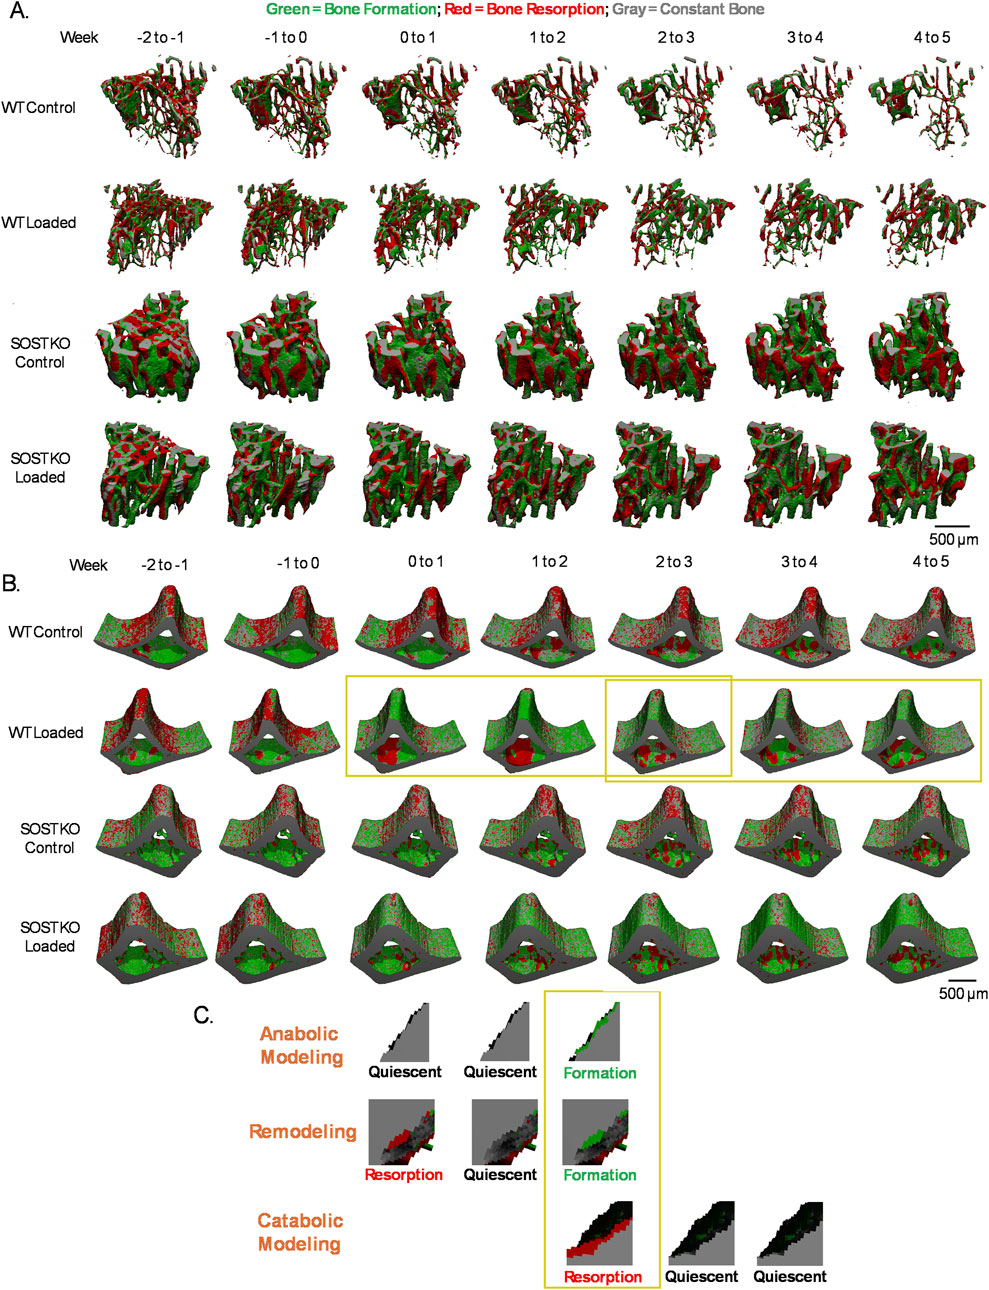
Figure 3. Changes in bone dynamics and quantification of modeling and remodeling. Control and loaded tibiae of WT and SOST KO mice over time for (A) trabecular bone and (B) cortical bone. (C) Modeling and remodeling events are defined by examining a sequence of 3 consecutive events. Representative images shown are from analysis of the yellow boxed regions in (B).
2.7 Statistics
All values were reported as the mean ± SD. Bone volume changes over time were compared by two-way repeated measures ANOVA using Tukey’s post hoc test for comparisons of the effects of loading (control vs loaded) within genotypes (WT vs KO) each week. Bone volumes and accumulated bone volumes after 5 weeks of loading were compared by two-way ANOVA using Fisher’s Least Significant Difference post hoc tests for comparisons of the effects of loading (control vs loaded) and between genotypes (WT vs. KO). P < 0.05 were considered statistically significant. GraphPad Prism 10.3.1 (GraphPad Software) was used for statistical analysis.
3 Results
In the trabecular bone of control limbs, BV/TV decreased more drastically over time in WT mice due to greater levels of bone resorption and a decline in bone formation compared to SOST KO mice (Supplementary Figure S2A). Loading increased WT BV/TV relative to control limbs, due to elevated levels of bone formation, while SOST KO BV/TV change was more attenuated and due to a slight trend of decreased bone resorption after loading (Supplementary Figure S2B). After further classification of formation and resorption into modeling and remodeling events, loading was observed to stimulate anabolic modeling and remodeling and reduce catabolic modeling throughout the course loading in WT mice (Figure 4A). The accumulated bone volumes by anabolic modeling and remodeling in WT mice increased after loading, and these values were greater than that in SOST KO mice (Figure 4B). Catabolic modeling bone volume changes were decreased after loading in WT mice, particularly due to an early response in week 1, while the response in SOST KO mice was more attenuated.
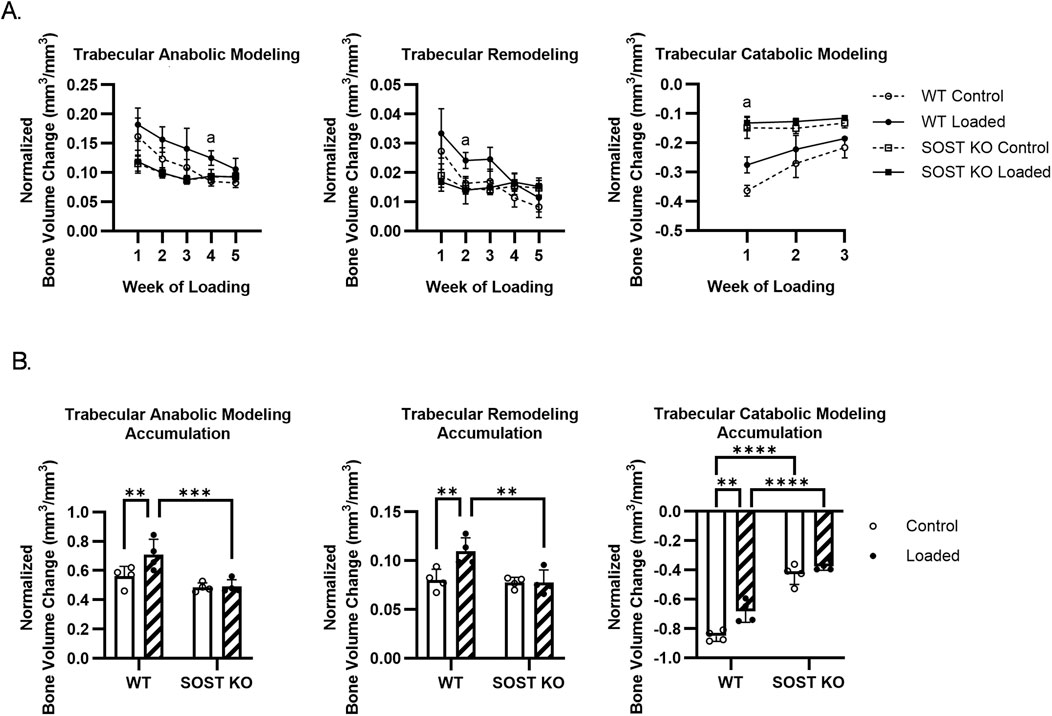
Figure 4. Effects of loading on trabecular bone modeling and remodeling in WT and SOST KO mice. (A) Time course trabecular bone volume changes. (B) Accumulated trabecular bone volume changes during loading. n=4/group. a, b denote p<0.05 for loading effects in WT and KO mice, respectively. ∗p < 0.05, ∗∗p < 0.01, ***p < 0.001, ∗∗∗∗p < 0.0001. Data were presented as the mean±SD.
Cortical bone also responded to loading in WT and SOST KO mice with increases in normalized bone volumes. Endosteal bone volumes remained relatively stable over the course of loading, where loading had a trend for an early increase in WT endosteal bone volumes, which then decreased by week 5 of loading (Supplementary Figure S3A). Periosteal bone volumes increased more robustly due to loading, resulting in increases in overall cortical bone volume to levels above baseline for both WT and SOST KO mice (Supplementary Figure S3B). Cortical formation peaked by week 2 for WT mice and then decreased with continued loading, while SOST KO showed a more level formation response (Supplementary Figure S4A). Although cortical resorption in WT mice trended to an increase compared to controls in week 5 of loading, there was an overall trend for decreased bone resorption after loading in both WT and SOST KO mice (Supplementary Figure S4B). From dividing the overall cortical bone into endosteal and periosteal compartments, distinct responses are identified. There was a trend for a transient increase in WT endosteal formation through week 2 of loading and an increase in WT endosteal resorption throughout loading (Supplementary Figure S5A). Periosteal bone was more responsive to loading with significant increases in formation and decreases in resorption throughout loading in WT mice, and a similar but more attenuated response in SOST KO mice (Supplementary Figure S5B).
The overall cortical bone response was dominated by modeling (anabolic and catabolic modeling) rather than remodeling. Like cortical formation, WT anabolic modeling peaked in week 2, while SOST KO response was more of a steady increase compared to controls (Supplementary Figure S6A). WT catabolic modeling decreased with loading, particularly due to an early response in week 1, while there was more of a diminished response in SOST KO mice (Supplementary Figure S6B). In control SOST KO limbs, there was an overall increase in modeling and remodeling compared to WT bone over time (Figure 5A). Endosteal bone was not as sensitive to loading, although transient effects resulted in an overall increase in catabolic modeling (Figure 5B). Periosteal modeling and remodeling were not as active compared to endosteal bone in the control limbs, although periosteal remodeling and catabolic modeling was greater in WT compared to SOST KO mice. Loading affected WT modeling and remodeling from the onset of loading, particularly with an early increase in remodeling through week 2 (Figure 5C). SOST KO mice showed a similar but reduced response to loading in accumulated changes of modeled and remodeled bone (Figure 5D).
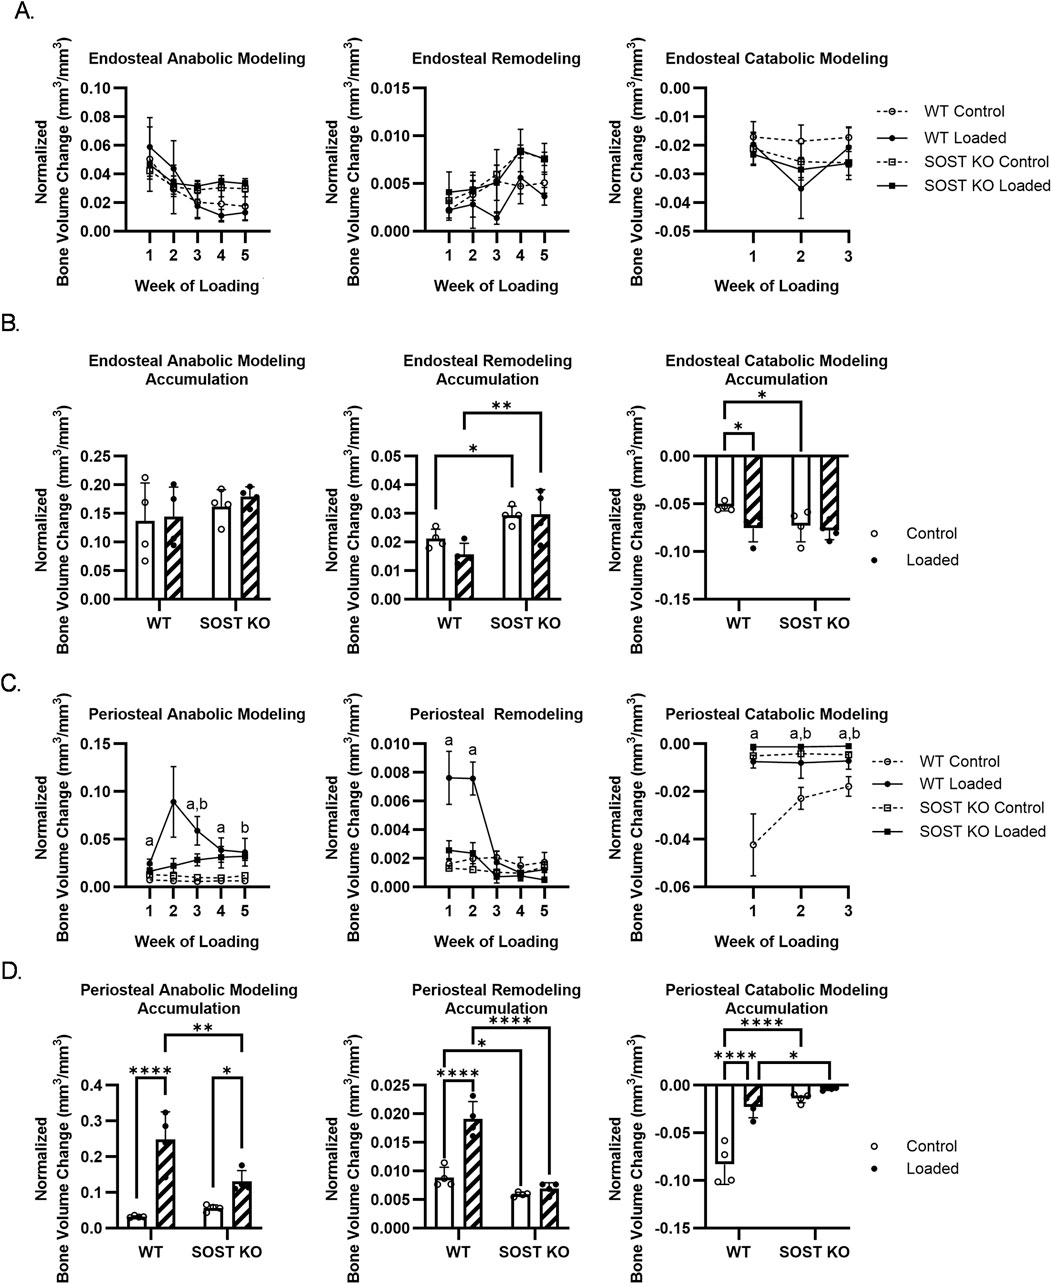
Figure 5. Effects of loading on (A, B) endosteal and (C, D) periosteal bone modeling and remodeling in WT and SOST KO mice. (A, C) Time course bone volume changes. (B, D) Accumulated bone volume changes during loading. n=4/group. a, b denote p < 0.05 for loading effects in WT and KO mice, respectively. ∗p < 0.05, ∗∗p < 0.01, ***p < 0.001, ∗∗∗∗p < 0.0001. Data were presented as the mean±SD.
4 Discussion
In this study, we detail a novel imaging technique our group previously used (Robinson et al., 2021) to quantify the time-dependent changes in trabecular and cortical bone modeling and remodeling explicitly as coupled or uncoupled formation and resorption events. This technique simultaneously captures trabecular and cortical (endosteal and periosteal compartments), microstructural regions of interest in the proximal tibia. We applied this technique here to characterize the bone adaptations in WT and SOST KO littermate mice and the differential responses to tibial loading. Over the experimental timeline, we find that WT trabecular and periosteal bone responded to loading with effects on anabolic modeling, remodeling, and catabolic modeling, and that these effects were diminished in SOST KO bone. Endosteal modeling and remodeling were not as sensitive to loading, but transient effects were observed.
Using a load-controlled tibia loading protocol with a peak compressive force of 9 N, we stimulated an increase in trabecular and cortical bone volumes in WT mice. SOST KO mice demonstrated a similar but more attenuated response where the trabecular BV/TV change did not reach statistical significance, likely due to the small sample size of 4 mice per group. In line with previous studies, Morse et al. found that loading increased trabecular and cortical bone volumes under load- and strain-controlled loading to 9 N compression (Morse et al., 2014). Similarly, Pflanz et al. showed similar loading effects in cortical bone with increased bone formation dynamics and reduced volumes of resorbed bone using dynamic histomorphometry and microCT 3D dynamic in vivo morphometry, while strain-controlled loading amplified the increase in SOST KO mineralized surface (Pflanz et al., 2017). Also, using strain-controlled loading and time-lapse microCT, Albiol et al. found that the trabecular bone volume in female SOST KO mice increased with loading due to decreased bone resorption (Albiol et al., 2020). While our results of female WT and SOST KO mice responding to loading for increased trabecular and cortical bone volumes align with previous studies, some differences in the bone dynamics may result from the different ages of mice and slightly different cortical volumes of interest. An advantage of our analysis is that we gain further insight into bone dynamics by separating bone formation and resorption into anabolic modeling, remodeling, and catabolic modeling adaptations in trabecular and cortical bone microstructure over an extended loading period.
Although microCT has become an established tool for the study of bone dynamics, studies on in vivo bone remodeling are lacking (Harrison and Cooper, 2015; Vanderoost and van Lenthe, 2014), and to our knowledge, our group has been the first to employ a microCT analysis technique to quantify the time-dependent changes of in vivo 3D modeling and remodeling in trabecular and cortical bone. 4D microCT has previously been proposed to quantify cortical modeling and remodeling (Birkhold et al., 2015), but mouse tibial loading studies have focused on the analysis of bone remodeling as independent formation and resorption events (Pflanz et al., 2017; Albiol et al., 2020; Birkhold et al., 2014b; Yang et al., 2020). Time-lapse CT analysis is a versatile technique, having also been applied using microCT to evaluate bone dynamics in aging (Scheuren et al., 2020), fracture healing (Wehrle et al., 2021; Tourolle Ne Betts et al., 2020), calvarial defects (Umoh et al., 2009), PTH treatment (Brouwers et al., 2009), and HR-pQCT in clinical studies (Christen et al., 2014; Atkins et al., 2021; Collins et al., 2022; van Rietbergen et al., 2021; Brunet et al., 2020). However, the analysis in these studies does not distinguish between coupled and uncoupled formation and resorption events. MicroCT scanning with a voxel resolution of 10.5 µm is effective in quantifying in vivo bone formation and resorption events in mouse trabecular and cortical bone, with significant correlations between the bone dynamics captured by in vivo microCT and traditional histomorphometric analysis (Schulte et al., 2011; Lambers et al., 2011; Birkhold et al., 2014a). In vivo tibia loading in skeletally mature C57BL/6J mice resulted in mineral apposition rates ranging from (between control and loaded limbs) 0.91–1.59 µm/day in trabecular bone (Willie et al., 2013), 0.8–1.9 µm/day in endocortical bone and 0.7–1.9 µm/day in periosteal bone (Sun et al., 2018). With our microCT imaging being every 7 days, we chose to reconstruct the images at a voxel size of 5 µm to improve the precision of voxel tracking. While this voxel size could potentially be further optimized, and given the resolution limits of current microCT scanners, we find that it effectively captures significant modeling and remodeling bone responses to loading in trabecular and cortical bone.
Although we demonstrate separate modeling and remodeling responses in trabecular and cortical bone, our study does include limitations. Choice of scanning parameters and postprocessing can influence bone morphological results (Christiansen, 2016; Oliviero et al., 2017). While other in vivo longitudinal microCT studies have not typically included a cluster removal step, we considered clusters below 15 voxels as noise, compared to the 30 voxels used in Christen et al. due to differences in HR-pQCT images of human bone and our microCT images of mouse bone (Christen et al., 2014). However, this parameter could be further optimized to distinguish bone versus noise voxels (Patterson et al., 2012). Particularly with longitudinal in vivo microCT imaging, radiation effects are considered. Using the same weekly microCT scanning protocol, we previously did not detect any significant effects of repeated scanning on BV/TV (Robinson et al., 2021). Although we did not analyze radiation effects beyond bone volume changes, other groups using comparable scanning protocols found no side effects from repeated scanning in bone architecture and marrow cells (Brouwers et al., 2007; Laperre et al., 2011). Studies suggest that repeated microCT imaging with a dose above 460 mGy per scan can significantly decrease trabecular bone volume fraction, with increased trabecular thickness and spacing, and decreased trabecular number in C57BL/6 mice (Laperre et al., 2011; Oliviero et al., 2019). Bone mineral density and cortical bone were not as affected by longitudinal microCT (Oliviero et al., 2017; Oliviero et al., 2019). The different responses to radiation between trabecular and cortical bone may be due to greater radiation sensitivity in osteoclasts than osteoblasts (Zhang et al., 2017). Willey et al. reported that irradiating C57BL/6 mice with an acute dose of 2 Gy by microCT increased osteoclast activity and number (Willey et al., 2008). However, differing results of bone’s response to radiation from longitudinal microCT have been reported, likely due to several factors, including different scanning protocols, regions scanned, and subject age (Laperre et al., 2011). With the increased use of in vivo time-lapse HR-pQCT to evaluate human bone turnover and adaptations (Zhou et al., 2025; Troy et al., 2020; Hosseinitabatabaei et al., 2025; Walle et al., 2024), where scans have an effective dose of 3–4 µSv (Burghardt et al., 2011; Nishiyama and Shane, 2013), it is important to consider radiation exposure, especially in the case of younger patients (Mitchell and Logan, 1998; Damilakis et al., 2010).
While we quantify modeling and remodeling adaptations, our analysis relies on tracking resorption and formation events at the voxel-level. This may result in a bias favoring modeling and underestimating remodeling events. Modeling and remodeling adaptations have also been distinguished by characterizing the underlying cement line and collagen fiber alignment from 2D sections ex vivo (Wang et al., 2021; Wang et al., 2022). Although multiple fluorochrome labeling and histology allow for examining bone dynamics at a higher resolution, time-lapse CT imaging can directly quantify in vivo modeling and remodeling changes in 3D. Because our scanning is performed weekly, it relies on identifying resorption, quiescence, and formation events at this interval. However, as we label each voxel with its specific bone adaptations over time, the labeling and segmentation scheme could be expanded to include any formation within a previous resorption pit as remodeling and to account for overflow bone formation.
While we focused on the effects of tibial loading on mice at a skeletally mature age by analyzing the response of the secondary spongiosa (trabecular bone) and diaphyseal cortical bone, the metaphyseal cortical bone is also captured in our weekly scans and could be included in future analyses (Altman et al., 2015). An advantage with time-lapse CT analysis is that longitudinal real-time subject-specific FEA (Walle et al., 2024; Walle et al., 2021; Walle et al., 2023; Griesbach et al., 2024; Paul et al., 2021) can be incorporated and combined with other segmentation techniques to label the trabecular microarchitecture by individual plates and rods (Robinson et al., 2021). From distinguishing modeling and remodeling adaptations, further insight into mechanical parameters can be gained (Young et al., 2022; Marques et al., 2023). Labeling the 3D bone microarchitecture also enables more mechanistic studies of corresponding cellular responses by registration of the CT volume to a 2D histology section (Lundin et al., 2017).
In summary, we detail an advancement of time-lapse CT imaging techniques for directly classifying in vivo modeling and remodeling over time in the trabecular and cortical microstructure. We characterize the distinct, time-dependent responses of WT and SOST KO trabecular, endosteal, and periosteal bone to mechanical loading by modeling and remodeling. Tracking coupled and uncoupled bone formation and resorption events at the voxel-level is particularly valuable because the scanning and image analysis techniques can be adapted to suit different subjects, from animal to human studies, with different regions of interest. Analysis of modeling and remodeling dynamics in space and time will provide critical inputs for computational models of bone adaptations and disease progression and function as a valuable tool for analyzing the long-term effects of therapies for bone diseases.
Data availability statement
The datasets presented in this study can be found in online repositories. The names of the repository/repositories and accession number(s) can be found below: https://github.com/pts2116/BBL-ModRemod.
Ethics statement
The animal study was approved by Columbia University Institutional Animal Care And Use Committee. The study was conducted in accordance with the local legislation and institutional requirements.
Author contributions
PS: Writing–original draft, Writing–review and editing. SR: Writing–original draft, Writing–review and editing. XG: Writing–review and editing, Writing–original draft.
Funding
The author(s) declare that financial support was received for the research and/or publication of this article. The NIAMS of NIH supports this work through R01 AR069148 and R01 AR062177.
Conflict of interest
The authors declare that the research was conducted in the absence of any commercial or financial relationships that could be construed as a potential conflict of interest.
Generative AI statement
The author(s) declare that no Generative AI was used in the creation of this manuscript.
Publisher’s note
All claims expressed in this article are solely those of the authors and do not necessarily represent those of their affiliated organizations, or those of the publisher, the editors and the reviewers. Any product that may be evaluated in this article, or claim that may be made by its manufacturer, is not guaranteed or endorsed by the publisher.
Supplementary material
The Supplementary Material for this article can be found online at: https://www.frontiersin.org/articles/10.3389/fmede.2025.1547895/full#supplementary-material
References
Albiol, L., Büttner, A., Pflanz, D., Mikolajewicz, N., Birkhold, A. I., Kramer, I., et al. (2020). Effects of long-term sclerostin deficiency on trabecular bone mass and adaption to limb loading differ in male and female mice. Calcif. Tissue Int. 106 (4), 415–430. doi:10.1007/s00223-019-00648-4
Altman, A. R., Tseng, W. J., de Bakker, C. M., Chandra, A., Lan, S., Huh, B. K., et al. (2015). Quantification of skeletal growth, modeling, and remodeling by in vivo micro computed tomography. Bone 81, 370–379. doi:10.1016/j.bone.2015.07.037
Atkins, P. R., Stock, K., Ohs, N., Collins, C. J., Horling, L., Benedikt, S., et al. (2021). Formation dominates resorption with increasing mineralized density and time postfracture in cortical but not trabecular bone: a longitudinal HRpQCT imaging study in the distal radius. JBMR Plus 5 (6), e10493. doi:10.1002/jbm4.10493
Birkhold, A. I., Razi, H., Duda, G. N., Weinkamer, R., Checa, S., and Willie, B. M. (2014a). Mineralizing surface is the main target of mechanical stimulation independent of age: 3D dynamic in vivo morphometry. Bone 66, 15–25. doi:10.1016/j.bone.2014.05.013
Birkhold, A. I., Razi, H., Duda, G. N., Weinkamer, R., Checa, S., and Willie, B. M. (2014b). The influence of age on adaptive bone formation and bone resorption. Biomaterials 35 (34), 9290–9301. doi:10.1016/j.biomaterials.2014.07.051
Birkhold, A. I., Razi, H., Weinkamer, R., Duda, G. N., Checa, S., and Willie, B. M. (2015). Monitoring in vivo (re)modeling: a computational approach using 4D microCT data to quantify bone surface movements. Bone 75, 210–221. doi:10.1016/j.bone.2015.02.027
Bolamperti, S., Villa, I., and Rubinacci, A. (2022). Bone remodeling: an operational process ensuring survival and bone mechanical competence. Bone Res. 10 (1), 48. doi:10.1038/s41413-022-00219-8
Bonewald, L. F. (2011). The amazing osteocyte. J. Bone Mineral Res. 26 (2), 229–238. doi:10.1002/jbmr.320
Bouxsein, M. L., Boyd, S. K., Christiansen, B. A., Guldberg, R. E., Jepsen, K. J., and Müller, R. (2010). Guidelines for assessment of bone microstructure in rodents using micro-computed tomography. J. Bone Mineral Res. 25 (7), 1468–1486. doi:10.1002/jbmr.141
Boyce, R. W., Niu, Q. T., and Ominsky, M. S. (2017). Kinetic reconstruction reveals time-dependent effects of romosozumab on bone formation and osteoblast function in vertebral cancellous and cortical bone in cynomolgus monkeys. Bone 101, 77–87. doi:10.1016/j.bone.2017.04.005
Boyd, S. K., Moser, S., Kuhn, M., Klinck, R. J., Krauze, P. L., Müller, R., et al. (2006). Evaluation of three-dimensional image registration methodologies for in vivo micro-computed tomography. Ann. Biomed. Eng. 34 (10), 1587–1599. doi:10.1007/s10439-006-9168-7
Brouwers, J. E., van Rietbergen, B., and Huiskes, R. (2007). No effects of in vivo micro-CT radiation on structural parameters and bone marrow cells in proximal tibia of wistar rats detected after eight weekly scans. J. Orthop. Res. 25 (10), 1325–1332. doi:10.1002/jor.20439
Brouwers, J. E., van Rietbergen, B., Huiskes, R., and Ito, K. (2009). Effects of PTH treatment on tibial bone of ovariectomized rats assessed by in vivo micro-CT. Osteoporos. Int. 20 (11), 1823–1835. doi:10.1007/s00198-009-0882-5
Brunet, S. C., Kuczynski, M. T., Bhatla, J. L., Lemay, S., Pauchard, Y., Salat, P., et al. (2020). The utility of multi-stack alignment and 3D longitudinal image registration to assess bone remodeling in rheumatoid arthritis patients from second generation HR-pQCT scans. BMC Med. Imaging 20 (1), 36. doi:10.1186/s12880-020-00437-8
Burge, R., Dawson-Hughes, B., Solomon, D. H., Wong, J. B., King, A., and Tosteson, A. (2007). Incidence and economic burden of osteoporosis-related fractures in the United States, 2005-2025. J. Bone Mineral Res. 22 (3), 465–475. doi:10.1359/jbmr.061113
Burghardt, A. J., Link, T. M., and Majumdar, S. (2011). High-resolution computed tomography for clinical imaging of bone microarchitecture. Clin. Orthop. and Relat. Res. 469 (8), 2179–2193. doi:10.1007/s11999-010-1766-x
Chavassieux, P., Chapurlat, R., Portero-Muzy, N., Roux, J. P., Garcia, P., Brown, J. P., et al. (2019). Bone-forming and antiresorptive effects of romosozumab in postmenopausal women with osteoporosis: bone histomorphometry and microcomputed tomography analysis after 2 and 12 Months of treatment. J. Bone Mineral Res. 34 (9), 1597–1608. doi:10.1002/jbmr.3735
Chesnut, C. H., Skag, A., Christiansen, C., Recker, R., Stakkestad, J. A., Hoiseth, A., et al. (2004). Effects of oral ibandronate administered daily or intermittently on fracture risk in postmenopausal osteoporosis. J. Bone Mineral Res. 19 (8), 1241–1249. doi:10.1359/jbmr.040325
Christen, P., Ito, K., Ellouz, R., Boutroy, S., Sornay-Rendu, E., Chapurlat, R. D., et al. (2014). Bone remodelling in humans is load-driven but not lazy. Nat. Commun. 5, 4855. doi:10.1038/ncomms5855
Christiansen, B. A. (2016). Effect of micro-computed tomography voxel size and segmentation method on trabecular bone microstructure measures in mice. Bone Rep. 5, 136–140. doi:10.1016/j.bonr.2016.05.006
Collins, C. J., Atkins, P. R., Ohs, N., Blauth, M., Lippuner, K., and Müller, R. (2022). Clinical observation of diminished bone quality and quantity through longitudinal HR-pQCT-derived remodeling and mechanoregulation. Sci. Rep. 12 (1), 17960. doi:10.1038/s41598-022-22678-z
Cosman, F., Crittenden, D. B., Adachi, J. D., Binkley, N., Czerwinski, E., Ferrari, S., et al. (2016). Romosozumab treatment in postmenopausal women with osteoporosis. N. Engl. J. Med. 375 (16), 1532–1543. doi:10.1056/nejmoa1607948
Courpron, P., Lepine, P., Arlot, M., Lips, P., and Meunier, P. J. (1980). Mechanisms underlying the reduction with age of the mean wall thickness of the trabecular basic structure unit (BSU) in human iliac bone. In: W. S. S. Jee, and A. M. Parfitt, editors. Bone histomorphometry, 3rd international workshop. Paris: Armour Montagu, 323–329.
Cummings, S. R., Martin, J. S., McClung, M. R., Siris, E. S., Eastell, R., Reid, I. R., et al. (2009). Denosumab for prevention of fractures in postmenopausal women with osteoporosis. N. Engl. J. Med. 361 (8), 756–765. doi:10.1056/nejmoa0809493
Damilakis, J., Adams, J. E., Guglielmi, G., and Link, T. M. (2010). Radiation exposure in X-ray-based imaging techniques used in osteoporosis. Eur. Radiol. 20 (11), 2707–2714. doi:10.1007/s00330-010-1845-0
David, V., Laroche, N., Boudignon, B., Lafage-Proust, M. H., Alexandre, C., Ruegsegger, P., et al. (2003). Noninvasive in vivo monitoring of bone architecture alterations in hindlimb-unloaded female rats using novel three-dimensional microcomputed tomography. J. Bone Mineral Res. 18 (9), 1622–1631. doi:10.1359/jbmr.2003.18.9.1622
de Bakker, C. M., Altman, A. R., Tseng, W. J., Tribble, M. B., Li, C., Chandra, A., et al. (2015). μCT-based, in vivo dynamic bone histomorphometry allows 3D evaluation of the early responses of bone resorption and formation to PTH and alendronate combination therapy. Bone 73, 198–207. doi:10.1016/j.bone.2014.12.061
Dempster, D. W., Compston, J. E., Drezner, M. K., Glorieux, F. H., Kanis, J. A., Malluche, H., et al. (2013). Standardized nomenclature, symbols, and units for bone histomorphometry: a 2012 update of the report of the ASBMR Histomorphometry Nomenclature Committee. J. Bone Mineral Res. 28 (1), 2–17. doi:10.1002/jbmr.1805
Dent, E., Daly, R. M., Hoogendijk, E. O., and Scott, D. (2023). Exercise to prevent and manage frailty and fragility fractures. Curr. Osteoporos. Rep. 21 (2), 205–215. doi:10.1007/s11914-023-00777-8
Erben, R. G. (1996). Trabecular and endocortical bone surfaces in the rat: modeling or remodeling? Anat. Rec. 246 (1), 39–46. doi:10.1002/(sici)1097-0185(199609)246:1<39::aid-ar5>3.0.co;2-a
Eriksen, E. F., Boyce, R. W., Shi, Y., Brown, J. P., Betah, D., Libanati, C., et al. (2024). Reconstruction of remodeling units reveals positive effects after 2 and 12 months of romosozumab treatment. J. Bone Mineral Res. 39 (6), 729–736. doi:10.1093/jbmr/zjae055
Feldkamp, L. A., Goldstein, S. A., Parfitt, M. A., Jesion, G., and Kleerekoper, M. (1989). The direct examination of three-dimensional bone architecture in vitro by computed tomography. J. Bone Mineral Res. 4 (1), 3–11. doi:10.1002/jbmr.5650040103
Feng, X., and McDonald, J. M. (2011). Disorders of bone remodeling. Annu. Rev. Pathology Mech. Dis. 6, 121–145. doi:10.1146/annurev-pathol-011110-130203
Feskanich, D., Willett, W., and Colditz, G. (2002). Walking and leisure-time activity and risk of hip fracture in postmenopausal women. JAMA 288 (18), 2300–2306. doi:10.1001/jama.288.18.2300
Foessl, I., Dimai, H. P., and Obermayer-Pietsch, B. (2023). Long-term and sequential treatment for osteoporosis. Nat. Rev. Endocrinol. 19 (9), 520–533. doi:10.1038/s41574-023-00866-9
Frost, H. M. (1969). Tetracycline-based histological analysis of bone remodeling. Calcif. Tissue Res. 3 (3), 211–237. doi:10.1007/bf02058664
Frost, H. M. (1983). A determinant of bone architecture. The minimum effective strain. Clin. Orthop. Relat. Res. 175 (175), 286–292. doi:10.1097/00003086-198305000-00047
Frost, H. M. (1987). Bone “mass” and the “mechanostat”: a proposal. Anat. Rec. 219 (1), 1–9. doi:10.1002/ar.1092190104
Frost, H. M. (2003). Bone's mechanostat: a 2003 update. Anatomical Rec. Part A Discov. Mol. Cell. Evol. Biol. 275A (2), 1081–1101. doi:10.1002/ar.a.10119
Fukumoto, S., and Martin, T. J. (2009). Bone as an endocrine organ. Trends Endocrinol. and Metabolism 20 (5), 230–236. doi:10.1016/j.tem.2009.02.001
Glatt, V., Canalis, E., Stadmeyer, L., and Bouxsein, M. L. (2007). Age-related changes in trabecular architecture differ in female and male C57BL/6J mice. J. Bone Mineral Res. 22 (8), 1197–1207. doi:10.1359/jbmr.070507
Greenblatt, M. B., Tsai, J. N., and Wein, M. N. (2017). Bone turnover markers in the diagnosis and monitoring of metabolic bone disease. Clin. Chem. 63 (2), 464–474. doi:10.1373/clinchem.2016.259085
Griesbach, J. K., Schulte, F. A., Schädli, G. N., Rubert, M., and Müller, R. (2024). Mechanoregulation analysis of bone formation in tissue engineered constructs requires a volumetric method using time-lapsed micro-computed tomography. Acta Biomater. 179, 149–163. doi:10.1016/j.actbio.2024.03.008
Gross, T. S., Srinivasan, S., Liu, C. C., Clemens, T. L., and Bain, S. D. (2002). Noninvasive loading of the murine tibia: an in vivo model for the study of mechanotransduction. J. Bone Mineral Res. 17 (3), 493–501. doi:10.1359/jbmr.2002.17.3.493
Hadjidakis, D. J., and Androulakis, I. I. (2006). Bone remodeling. Ann. N. Y. Acad. Sci. 1092 (1), 385–396. doi:10.1196/annals.1365.035
Harding, A. T., Weeks, B. K., Lambert, C., Watson, S. L., Weis, L. J., and Beck, B. R. (2020). A comparison of bone-targeted exercise strategies to reduce fracture risk in middle-aged and older men with osteopenia and osteoporosis: LIFTMOR-M semi-randomized controlled trial. J. Bone Mineral Res. 35 (8), 1404–1414. doi:10.1002/jbmr.4008
Harris, S. T., Watts, N. B., Genant, H. K., McKeever, C. D., Hangartner, T., and Keller, M. (1999). Effects of risedronate treatment on vertebral and nonvertebral fractures in women with postmenopausal osteoporosis: a randomized controlled trial. Vertebral Efficacy with Risedronate Therapy (VERT) Study Group. JAMA 282 (14), 1344–1352. doi:10.1001/jama.282.14.1344
Harrison, K. D., and Cooper, D. M. (2015). Modalities for visualization of cortical bone remodeling: the past, present, and future. Front. Endocrinol. (Lausanne) 6, 122. doi:10.3389/fendo.2015.00122
Hattner, R., Epker, B. N., and Frost, H. M. (1965). Suggested sequential mode of control of changes in cell behaviour in adult bone remodelling. Nature 206 (983), 489–490. doi:10.1038/206489a0
Hoffmann, I., Kohl, M., von Stengel, S., Jakob, F., Kerschan-Schindl, K., Lange, U., et al. (2023). Exercise and the prevention of major osteoporotic fractures in adults: a systematic review and meta-analysis with special emphasis on intensity progression and study duration. Osteoporos. Int. 34 (1), 15–28. doi:10.1007/s00198-022-06592-8
Hosseinitabatabaei, S., Vitienes, I., Rummler, M., Birkhold, A., Rauch, F., and Willie, B. M. (2025). Non-invasive quantification of bone (re) modeling dynamics in adults with osteogenesis imperfecta treated with Setrusumab using timelapse HR-pQCT. J. Bone Min. Res., zjaf013. doi:10.1093/jbmr/zjaf013
Howe, T. E., Shea, B., Dawson, L. J., Downie, F., Murray, A., Ross, C., et al. (2011). Exercise for preventing and treating osteoporosis in postmenopausal women. Cochrane Database Syst. Rev. (7), CD000333. doi:10.1002/14651858.CD000333.pub2
Jilka, R. L. (2013). The relevance of mouse models for investigating age-related bone loss in humans. J. Gerontology Ser. A Biol. Sci. Med. Sci. 68 (10), 1209–1217. doi:10.1093/gerona/glt046
Kapadia, R. D., Stroup, G. B., Badger, A. M., Koller, B., Levin, J. M., Coatney, R. W., et al. (1998). Applications of micro-CT and MR microscopy to study pre-clinical models of osteoporosis and osteoarthritis. Technol. Health Care 6 (5-6), 361–372. doi:10.3233/thc-1998-65-609
Laib, A., and Ruegsegger, P. (1999). Calibration of trabecular bone structure measurements of in vivo three-dimensional peripheral quantitative computed tomography with 28-μm-resolution microcomputed tomography. Bone 24 (1), 35–39. doi:10.1016/s8756-3282(98)00159-8
Lambers, F. M., Schulte, F. A., Kuhn, G., Webster, D. J., and Müller, R. (2011). Mouse tail vertebrae adapt to cyclic mechanical loading by increasing bone formation rate and decreasing bone resorption rate as shown by time-lapsed in vivo imaging of dynamic bone morphometry. Bone 49 (6), 1340–1350. doi:10.1016/j.bone.2011.08.035
Lan, S., Luo, S., Huh, B. K., Chandra, A., Altman, A. R., Qin, L., et al. (2013). 3D image registration is critical to ensure accurate detection of longitudinal changes in trabecular bone density, microstructure, and stiffness measurements in rat tibiae by in vivo microcomputed tomography (μCT). Bone 56 (1), 83–90. doi:10.1016/j.bone.2013.05.014
Langdahl, B., Ferrari, S., and Dempster, D. W. (2016). Bone modeling and remodeling: potential as therapeutic targets for the treatment of osteoporosis. Ther. Adv. Musculoskelet. Dis. 8 (6), 225–235. doi:10.1177/1759720x16670154
Laperre, K., Depypere, M., van Gastel, N., Torrekens, S., Moermans, K., Bogaerts, R., et al. (2011). Development of micro-CT protocols for in vivo follow-up of mouse bone architecture without major radiation side effects. Bone 49 (4), 613–622. doi:10.1016/j.bone.2011.06.031
Leder, B. Z., O'Dea, L. S., Zanchetta, J. R., Kumar, P., Banks, K., McKay, K., et al. (2015). Effects of abaloparatide, a human parathyroid hormone-related peptide analog, on bone mineral density in postmenopausal women with osteoporosis. J. Clin. Endocrinol. and Metabolism 100 (2), 697–706. doi:10.1210/jc.2014-3718
Lewiecki, E. M., Ortendahl, J. D., Vanderpuye-Orgle, J., Grauer, A., Arellano, J., Lemay, J., et al. (2019). Healthcare policy changes in osteoporosis can improve outcomes and reduce costs in the United States. JBMR Plus 3 (9), e10192. doi:10.1002/jbm4.10192
Liberman, U. A., Weiss, S. R., Bröll, J., Minne, H. W., Quan, H., and Bell, N. H. (1995). Effect of oral alendronate on bone mineral density and the incidence of fractures in postmenopausal osteoporosis. The Alendronate Phase III Osteoporosis Treatment Study Group. N. Engl. J. Med. 333 (22), 1437–1443. doi:10.1056/NEJM199511303332201
Lundin, E. L., Stauber, M., Papageorgiou, P., Ehrbar, M., Ghayor, C., Weber, F. E., et al. (2017). Automatic registration of 2D histological sections to 3D microCT volumes: trabecular bone. Bone 105, 173–183. doi:10.1016/j.bone.2017.08.021
Luo, N., Mosialou, I., Capulli, M., Bisikirska, B., Lin, C. S., Huang, Yy, et al. (2022). A neuronal action of sirtuin 1 suppresses bone mass in young and aging mice. J. Clin. Investigation 132 (23), e152868. doi:10.1172/jci152868
Main, R. P., Shefelbine, S. J., Meakin, L. B., Silva, M. J., van der Meulen, M. C. H., and Willie, B. M. (2020). Murine axial compression tibial loading model to study bone mechanobiology: implementing the model and reporting results. J. Orthop. Res. 38 (2), 233–252. doi:10.1002/jor.24466
Marques, F. C., Boaretti, D., Walle, M., Scheuren, A. C., Schulte, F. A., and Müller, R. (2023). Mechanostat parameters estimated from time-lapsed in vivo micro-computed tomography data of mechanically driven bone adaptation are logarithmically dependent on loading frequency. Front. Bioeng. Biotechnol. 11, 1140673. doi:10.3389/fbioe.2023.1140673
McClung, M., Harris, S. T., Miller, P. D., Bauer, D. C., Davison, K. S., Dian, L., et al. (2013). Bisphosphonate therapy for osteoporosis: benefits, risks, and drug holiday. Am. J. Med. 126 (1), 13–20. doi:10.1016/j.amjmed.2012.06.023
McClung, M. R., Grauer, A., Boonen, S., Bolognese, M. A., Brown, J. P., Diez-Perez, A., et al. (2014). Romosozumab in postmenopausal women with low bone mineral density. N. Engl. J. Med. 370 (5), 412–420. doi:10.1056/nejmoa1305224
Melton, L. J., Atkinson, E. J., O'Connor, M. K., O'Fallon, W. M., and Riggs, B. L. (1998). Bone density and fracture risk in men. J. Bone Min. Res. 13 (12), 1915–1923. doi:10.1359/jbmr.1998.13.12.1915
Melville, K. M., Robling, A. G., and van der Meulen, M. C. (2015). In vivo axial loading of the mouse tibia. Methods Mol. Biol. 1226, 99–115. doi:10.1007/978-1-4939-1619-1_9
Mitchell, M. J., and Logan, P. M. (1998). Radiation-induced changes in bone. Radiographics 18 (5), 1125–1136. quiz 1242-3. doi:10.1148/radiographics.18.5.9747611
Morse, A., McDonald, M. M., Kelly, N. H., Melville, K. M., Schindeler, A., Kramer, I., et al. (2014). Mechanical load increases in bone formation via a sclerostin-independent pathway. J. Bone Mineral Res. 29 (11), 2456–2467. doi:10.1002/jbmr.2278
Neer, R. M., Arnaud, C. D., Zanchetta, J. R., Prince, R., Gaich, G. A., Reginster, J. Y., et al. (2001). Effect of parathyroid hormone (1-34) on fractures and bone mineral density in postmenopausal women with osteoporosis. N. Engl. J. Med. 344 (19), 1434–1441. doi:10.1056/nejm200105103441904
Nishiyama, K. K., and Shane, E. (2013). Clinical imaging of bone microarchitecture with HR-pQCT. Curr. Osteoporos. Rep. 11 (2), 147–155. doi:10.1007/s11914-013-0142-7
Nuti, R., Brandi, M. L., Checchia, G., Di Munno, O., Dominguez, L., Falaschi, P., et al. (2019). Guidelines for the management of osteoporosis and fragility fractures. Intern Emerg. Med. 14 (1), 85–102. doi:10.1007/s11739-018-1874-2
Oliviero, S., Giorgi, M., Laud, P. J., and Dall’Ara, E. (2019). Effect of repeated in vivo microCT imaging on the properties of the mouse tibia. PLoS One 14 (11), e0225127. doi:10.1371/journal.pone.0225127
Oliviero, S., Lu, Y., Viceconti, M., and Dall'Ara, E. (2017). Effect of integration time on the morphometric, densitometric and mechanical properties of the mouse tibia. J. Biomechanics 65, 203–211. doi:10.1016/j.jbiomech.2017.10.026
Ominsky, M. S., Boyd, S. K., Varela, A., Jolette, J., Felx, M., Doyle, N., et al. (2017). Romosozumab improves bone mass and strength while maintaining bone quality in ovariectomized cynomolgus monkeys. J. Bone Mineral Res. 32 (4), 788–801. doi:10.1002/jbmr.3036
Parfitt, A. M. (1984). The cellular basis of bone remodeling: the quantum concept reexamined in light of recent advances in the cell biology of bone. Calcif. Tissue Int. 36 (Suppl. 1), S37–S45. doi:10.1007/bf02406132
Parfitt, A. M., Drezner, M. K., Glorieux, F. H., Kanis, J. A., Malluche, H., Meunier, P. J., et al. (1987). Bone histomorphometry: standardization of nomenclature, symbols, and units. Report of the ASBMR Histomorphometry Nomenclature Committee. J. Bone Mineral Res. 2 (6), 595–610. doi:10.1002/jbmr.5650020617
Patterson, B. M., Escobedo-Diaz, J. P., Dennis-Koller, D., and Cerreta, E. (2012). Dimensional quantification of embedded voids or objects in three dimensions using X-ray tomography. Microsc. Microanal. 18 (2), 390–398. doi:10.1017/s1431927611012554
Paul, G. R., Wehrle, E., Tourolle, D. C., Kuhn, G. A., and Müller, R. (2021). Real-time finite element analysis allows homogenization of tissue scale strains and reduces variance in a mouse defect healing model. Sci. Rep. 11 (1), 13511. doi:10.1038/s41598-021-92961-y
Pautke, C., Vogt, S., Tischer, T., Wexel, G., Deppe, H., Milz, S., et al. (2005). Polychrome labeling of bone with seven different fluorochromes: enhancing fluorochrome discrimination by spectral image analysis. Bone 37 (4), 441–445. doi:10.1016/j.bone.2005.05.008
Pflanz, D., Birkhold, A. I., Albiol, L., Thiele, T., Julien, C., Seliger, A., et al. (2017). Sost deficiency led to a greater cortical bone formation response to mechanical loading and altered gene expression. Sci. Rep. 7 (1), 9435. doi:10.1038/s41598-017-09653-9
Rachner, T. D., Khosla, S., and Hofbauer, L. C. (2011). Osteoporosis: now and the future. Lancet 377 (9773), 1276–1287. doi:10.1016/s0140-6736(10)62349-5
Raggatt, L. J., and Partridge, N. C. (2010). Cellular and molecular mechanisms of bone remodeling. J. Biol. Chem. 285 (33), 25103–25108. doi:10.1074/jbc.r109.041087
Raisz, L. G. (1999). Physiology and pathophysiology of bone remodeling. Clin. Chem. 45 (8 Pt 2), 1353–1358. doi:10.1093/clinchem/45.8.1353
Recker, R. R., Kimmel, D., Dempster, D., Weinstein, R., Wronski, T., and Burr, D. (2011). Issues in modern bone histomorphometry. Bone 49 (5), 955–964. doi:10.1016/j.bone.2011.07.017
Reid, I. R., and Billington, E. O. (2022). Drug therapy for osteoporosis in older adults. Lancet 399 (10329), 1080–1092. doi:10.1016/s0140-6736(21)02646-5
Reid, I. R., Brown, J. P., Burckhardt, P., Horowitz, Z., Richardson, P., Trechsel, U., et al. (2002). Intravenous zoledronic acid in postmenopausal women with low bone mineral density. N. Engl. J. Med. 346 (9), 653–661. doi:10.1056/nejmoa011807
Riggs, B. L., and Parfitt, A. M. (2005). Drugs used to treat osteoporosis: the critical need for a uniform nomenclature based on their action on bone remodeling. J. Bone Mineral Res. 20 (2), 177–184. doi:10.1359/jbmr.041114
Robinson, S. T. (2020). Bone mechanobiology of modeling and remodeling and the effect of hematopoietic lineage cells. Doctoral dissertation, Columbia University. doi:10.7916/d8-qjgy-3866
Robinson, S. T., Shyu, P. T., and Guo, X. E. (2021). Mechanical loading and parathyroid hormone effects and synergism in bone vary by site and modeling/remodeling regime. Bone 153, 116171. doi:10.1016/j.bone.2021.116171
Rodan, G. A. (1992). Introduction to bone biology. Bone 13 (Suppl. 1), S3–S6. doi:10.1016/s8756-3282(09)80003-3
Scheuren, A. C., Kuhn, G. A., and Muller, R. (2020). Effects of long-term in vivo micro-CT imaging on hallmarks of osteopenia and frailty in aging mice. PLoS One 15 (9), e0239534. doi:10.1371/journal.pone.0239534
Schulte, F. A., Lambers, F. M., Kuhn, G., and Müller, R. (2011). In vivo micro-computed tomography allows direct three-dimensional quantification of both bone formation and bone resorption parameters using time-lapsed imaging. Bone 48 (3), 433–442. doi:10.1016/j.bone.2010.10.007
Schumm, A. K., Craige, E. A., Arora, N. K., Owen, P. J., Mundell, N. L., Buehring, B., et al. (2023). Does adding exercise or physical activity to pharmacological osteoporosis therapy in patients with increased fracture risk improve bone mineral density and lower fracture risk? A systematic review and meta-analysis. Osteoporos. Int. 34 (11), 1867–1880. doi:10.1007/s00198-023-06829-0
Seeman, E. (2009). Bone modeling and remodeling. Crit. Reviews™ Eukaryot. Gene Expr. 19 (3), 219–233. doi:10.1615/critreveukargeneexpr.v19.i3.40
Slyfield, C. R., Tkachenko, E. V., Wilson, D. L., and Hernandez, C. J. (2012). Three-dimensional dynamic bone histomorphometry. J. Bone Mineral Res. 27 (2), 486–495. doi:10.1002/jbmr.553
Sun, D., Brodt, M. D., Zannit, H. M., Holguin, N., and Silva, M. J. (2018). Evaluation of loading parameters for murine axial tibial loading: stimulating cortical bone formation while reducing loading duration. J. Orthop. Res. 36 (2), 682–691. doi:10.1002/jor.23727
Tkachenko, E. V., Slyfield, C. R., Tomlinson, R. E., Daggett, J. R., Wilson, D. L., and Hernandez, C. J. (2009). Voxel size and measures of individual resorption cavities in three-dimensional images of cancellous bone. Bone 45 (3), 487–492. doi:10.1016/j.bone.2009.05.019
Tourolle Ne Betts, D. C., Wehrle, E., Paul, G. R., Kuhn, G. A., Christen, P., Hofmann, S., et al. (2020). The association between mineralised tissue formation and the mechanical local in vivo environment: time-lapsed quantification of a mouse defect healing model. Sci. Rep. 10 (1), 1100. doi:10.1038/s41598-020-57461-5
Troy, K. L., Mancuso, M. E., Johnson, J. E., Wu, Z., Schnitzer, T. J., and Butler, T. A. (2020). Bone adaptation in adult women is related to loading dose: a 12-month randomized controlled trial. J. Bone Mineral Res. 35 (7), 1300–1312. doi:10.1002/jbmr.3999
Turner, C. H., Akhter, M., Raab, D., Kimmel, D., and Recker, R. (1991). A noninvasive, in vivo model for studying strain adaptive bone modeling. Bone 12 (2), 73–79. doi:10.1016/8756-3282(91)90003-2
Umoh, J. U., Sampaio, A. V., Welch, I., Pitelka, V., Goldberg, H. A., Underhill, T. M., et al. (2009). In vivo micro-CT analysis of bone remodeling in a rat calvarial defect model. Phys. Med. Biol. 54 (7), 2147–2161. doi:10.1088/0031-9155/54/7/020
Vanderoost, J., and van Lenthe, G. H. (2014). From histology to micro-CT: measuring and modeling resorption cavities and their relation to bone competence. World J. Radiol. 6 (9), 643–656. doi:10.4329/wjr.v6.i9.643
van Gaalen, S. M., Kruyt, M. C., Geuze, R. E., de Bruijn, J. D., Alblas, J., and Dhert, W. J. (2010). Use of fluorochrome labels in in vivo bone tissue engineering research. Tissue Eng. Part B Rev. 16 (2), 209–217. doi:10.1089/ten.teb.2009.0503
van Rietbergen, B., Biver, E., Chevalley, T., Ito, K., Chapurlat, R., and Ferrari, S. (2021). A novel HR-pQCT image registration approach reveals sex-specific changes in cortical bone retraction with aging. J. Bone Mineral Res. 36 (7), 1351–1363. doi:10.1002/jbmr.4285
Waarsing, J. H., Day, J., van der Linden, J., Ederveen, A., Spanjers, C., De Clerck, N., et al. (2004). Detecting and tracking local changes in the tibiae of individual rats: a novel method to analyse longitudinal in vivo micro-CT data. Bone 34 (1), 163–169. doi:10.1016/j.bone.2003.08.012
Walle, M., Duseja, A., Whittier, D. E., Vilaca, T., Paggiosi, M., Eastell, R., et al. (2024). Bone remodeling and responsiveness to mechanical stimuli in individuals with type 1 diabetes mellitus. J. Bone Mineral Res. 39 (2), 85–94. doi:10.1093/jbmr/zjad014
Walle, M., Marques, F. C., Ohs, N., Blauth, M., Müller, R., and Collins, C. J. (2021). Bone mechanoregulation allows subject-specific load estimation based on time-lapsed micro-CT and HR-pQCT in vivo. Front. Bioeng. Biotechnol. 9, 677985. doi:10.3389/fbioe.2021.677985
Walle, M., Whittier, D. E., Schenk, D., Atkins, P. R., Blauth, M., Zysset, P., et al. (2023). Precision of bone mechanoregulation assessment in humans using longitudinal high-resolution peripheral quantitative computed tomography in vivo. Bone 172, 116780. doi:10.1016/j.bone.2023.116780
Wang, W., Azar, T., Tseng, W. J., Pei, S., Zhou, Y., Jiang, X., et al. (2022). Distinct responses of modeling- and remodeling-based bone formation to the discontinuation of intermittent parathyroid hormone treatment in ovariectomized rats. J. Bone Mineral Res. 37 (11), 2215–2225. doi:10.1002/jbmr.4704
Wang, W., Tseng, W. J., Zhao, H., Azar, T., Pei, S., Jiang, X., et al. (2021). Activation, development, and attenuation of modeling- and remodeling-based bone formation in adult rats. Biomaterials 276, 121015. doi:10.1016/j.biomaterials.2021.121015
Watson, S. L., Weeks, B. K., Weis, L. J., Harding, A. T., Horan, S. A., and Beck, B. R. (2018). High-intensity resistance and impact training improves bone mineral density and physical function in postmenopausal women with osteopenia and osteoporosis: the LIFTMOR randomized controlled trial. J. Bone Mineral Res. 33 (2), 211–220. doi:10.1002/jbmr.3284
Wehrle, E., Paul, G. R., Tourolle né Betts, D. C., Kuhn, G. A., and Müller, R. (2021). Individualized cyclic mechanical loading improves callus properties during the remodelling phase of fracture healing in mice as assessed from time-lapsed in vivo imaging. Sci. Rep. 11 (1), 23037. doi:10.1038/s41598-021-02368-y
Willey, J. S., Lloyd, S. A. J., Robbins, M. E., Bourland, J. D., Smith-Sielicki, H., Bowman, L. C., et al. (2008). Early increase in osteoclast number in mice after whole-body irradiation with 2 Gy X rays. Radiat. Res. 170 (3), 388–392. doi:10.1667/rr1388.1
Willie, B. M., Birkhold, A. I., Razi, H., Thiele, T., Aido, M., Kruck, B., et al. (2013). Diminished response to in vivo mechanical loading in trabecular and not cortical bone in adulthood of female C57Bl/6 mice coincides with a reduction in deformation to load. Bone 55 (2), 335–346. doi:10.1016/j.bone.2013.04.023
Wolff, J. (1893). Das Gesetz der Transformation der Knochen. Dtsch. Med. Wochenschr 19 (47), 1222–1224. doi:10.1055/s-0028-1144106
Wood, A. J. J., Riggs, B. L., and Melton, L. J. (1992). The prevention and treatment of osteoporosis. N. Engl. J. Med. 327 (9), 620–627. doi:10.1056/nejm199208273270908
Yang, H., Büttner, A., Albiol, L., Julien, C., Thiele, T., Figge, C., et al. (2020). Cortical bone adaptation to a moderate level of mechanical loading in male Sost deficient mice. Sci. Rep. 10 (1), 22299. doi:10.1038/s41598-020-79098-0
Young, S. A. E., Rummler, M., Taïeb, H. M., Garske, D. S., Ellinghaus, A., Duda, G. N., et al. (2022). In vivo microCT-based time-lapse morphometry reveals anatomical site-specific differences in bone (re)modeling serving as baseline parameters to detect early pathological events. Bone 161, 116432. doi:10.1016/j.bone.2022.116432
Zhang, J., Wang, Z., Wu, A., Nie, J., Pei, H., Hu, W., et al. (2017). Differences in responses to X-ray exposure between osteoclast and osteoblast cells. J. Radiat. Res. 58 (6), 791–802. doi:10.1093/jrr/rrx026
Keywords: in vivo microCT, bone remodeling, bone modeling, trabecular bone, cortical bone, mechanical loading
Citation: Shyu PT, Robinson ST and Guo XE (2025) In Vivo quantification of 4D modeling and remodeling in trabecular and cortical bone microstructure. Front. Med. Eng. 3:1547895. doi: 10.3389/fmede.2025.1547895
Received: 18 December 2024; Accepted: 28 February 2025;
Published: 21 March 2025.
Edited by:
David Putzer, Innsbruck Medical University, AustriaReviewed by:
Sourav Mandal, University of Liège, BelgiumChenguang Zhang, Sanofi Genzyme, United States
Copyright © 2025 Shyu, Robinson and Guo. This is an open-access article distributed under the terms of the Creative Commons Attribution License (CC BY). The use, distribution or reproduction in other forums is permitted, provided the original author(s) and the copyright owner(s) are credited and that the original publication in this journal is cited, in accordance with accepted academic practice. No use, distribution or reproduction is permitted which does not comply with these terms.
*Correspondence: X. Edward Guo, ZXhnMUBjb2x1bWJpYS5lZHU=