 Bhavsimran Singh Malhi
 Hyungseok Jang
 Manharjot Singh Malhi2
 Saeed Jerban
- 1Department of Radiology, University of California, San Diego, San Diego, CA, United States
- 2Department of Orthopedic Surgery, Indus Hospital, Mohali, India
- 3Department of Orthopaedic Surgery, University of California, San Diego, San Diego, CA, United States
Tendon disease ranks among the leading reasons patients consult their general practitioners, comprising approximately one-third of musculoskeletal appointments. Magnetic resonance imaging (MRI) is regarded as the gold standard for assessing tendons. Due to their short transverse relaxation time (T2), Tendons show up as a signal void in conventional MRI scans, which employ sequences with echo times (TEs) around several milliseconds. Ultrashort echo time (UTE) sequences utilize TEs that are 100–1,000 times shorter than those used in conventional sequences. This enables the direct visualization of tendons and assessment of their relaxation times, which is the basis for quantitative MRI. A systematic review was conducted on publications after 1990 in Google Scholar and PubMed databases. The search terms “ultrashort echo time,” “tendon,” and “UTE” were used to identify studies related to this investigation. This review discussed the current knowledge in quantitative UTE-MRI imaging of tendons. Quantitative UTE-T1, UTE-T2*, UTE-MT, and UTE-T1ρ techniques were described, and their reported applications in the literature were summarized in this review. We also discussed the advantages and challenges of these techniques and how these quantitative biomarkers may change in response to tendon pathology.
1 Introduction
Tendon disease ranks among the leading reasons patients consult their general practitioners, comprising approximately 30% of musculoskeletal appointments (1). Tendinopathy is more prevalent in athletes and affects various regions like the ankle, shoulder, elbow, and knee. Numerous studies on athletes have produced epidemiological findings indicating a prevalence range of 12%–25% for conditions such as patellar tendinopathy, Achilles tendinopathy, and rotator cuff tendinopathy (2–4). In both the general population and among workers, a 2%–4% prevalence has been noted for upper extremity tendinopathy, with higher rates observed in older adults (5–8).
Normal tendons are composed of fibroblasts, called tenocytes, and are surrounded by extracellular matrix (ECM) (9). ECM is predominantly made of tightly packed collagen fibers oriented along the primary loading direction (10). Collagen accounts for around 60%–85% of tendons’ dry weight (11). Approximately 1%–5% of the dry weight of tendons is composed of proteoglycans (12). Tendinopathy involves various biochemical alterations, including aberrations in the composition of the collagenous matrix and its elevated turnover rate (13–15). In the initial phase of tendon damage, the type III collagen is laid down in haphazard fashion, contributing to the inferior biomechanical strength and irregular alignment seen microscopically in damaged tendon (16, 17). In the healing tendons, with time, the type I collagen eventually replaces the type III collagen and resumes the normal linear structured pattern (18). However, in tendinopathic tendons, this repair mechanism is impaired with increased accumulation of the type III collagen (19). There is a reduction in total collagen content, an increase in ratio of type III to type I collagen, and a higher percentage of denatured collagen (20). Proteoglycans, despite being present in relatively small quantities, are likely to contribute significantly to the biomechanical and structural properties of the extracellular matrix of tendons. The proteoglycans found in tendons can be classified into two groups- the small leucine-rich proteoglycans (SLRPs) and the large aggregating proteoglycans (21). The SLRPs play crucial roles in regulating collagen fibrillogenesis and function, particularly in organizing collagen fibrils. The large aggregating proteoglycans have high number of glycosaminoglycan(GAG) chains which bind water and contribute to biomechanical properties of tissue and providing lubrication (22–24). In tendinopathic tendons, there's been an observed elevation in the levels of SLRPs, that might play a role in collagen network degeneration (15). Tendinopathic tendons are also associated with increased amounts of GAG content which lead to increased water binding leading to tissue swelling (25, 26). In excised patellar tendon sections obtained from human subjects, a 16% elevation in water content relative to the wet weight in tendinopathic tissue compared to corresponding sections of healthy tendons was observed (15). A similar increase in water content was also observed in pathological supraspinatus and subscapularis tendons (13).
To date, a reliable method for early tendinopathy detection remains elusive, and effective strategies to mitigate its progression are lacking. Tendinopathies inevitably lead to tendon rupture, and once rupture occurs, the natural healing of tendons is characterized by slow and often inadequate responsiveness to treatments, necessitating prolonged rehabilitation in the majority of cases (27). Regrettably, existing therapeutic options have not yielded satisfactory long-term solutions. Consequently, repaired tendons do not fully regain their original strength and functionality (28).
Magnetic resonance imaging (MRI) is widely regarded as the definitive imaging modality for assessing tendons, offering exceptional differentiation of soft tissues (29). Tendons are comprised of highly ordered collagen fiber structures, leading to strong dipole-dipole interactions and, thereby, short apparent transverse relaxation times (T2*s). As a result, tendons cannot be visualized directly using conventional MRI sequences (30). Specifically, conventional MRI sequences utilize echo times (TEs) of several milliseconds (ms), which is longer than tendons’ T2*. Although there is clinical value in seeing the outline of tendons, there is no possibility of quantification or detecting subtle changes in the structure of tendons using conventional sequences (31).
Ultrashort echo time (UTE) sequences are a class of clinically compatible sequences capable of providing TE values less than 0.1 ms (32). These sequences make it possible to image short T2 tissues, such as tendons, directly with a high signal. In UTE tendon imaging, various trajectories, a term describing how data is sampled in k-space, have been employed. Among these, radial and Cones trajectories are most utilized. These trajectories enable short (or ultrashort) echo times (TEs) and offer robustness to motion artifacts (33).
Qualitative analysis has been the primary approach for evaluating the musculoskeletal (MSK) system using conventional sequences in MRI for a considerable period. Quantifying the signal enhancement in tendons after intravenous administration of gadolinium has been suggested for detecting tendon diseases (34). However, contrast administration is associated with discomfort, health risks and cost (35). With increased research in MSK MRI, noninvasive quantitative imaging has become particularly interesting due to its potential to provide earlier disease detection, rigorous comparative investigations, and more robust monitoring tool for disease progress and treatment (36, 37). Figure 1 shows a representative Achilles tendon imaged at 3 T using conventional 3D T1-weighted fast spin echo (FSE) and three-dimensional (3D) UTE sequences. The tendon demonstrated no detectable signals on the conventional MR image (Figure 1A), while it showed a high signal when imaged with 3D-UTE (Figure 1B).
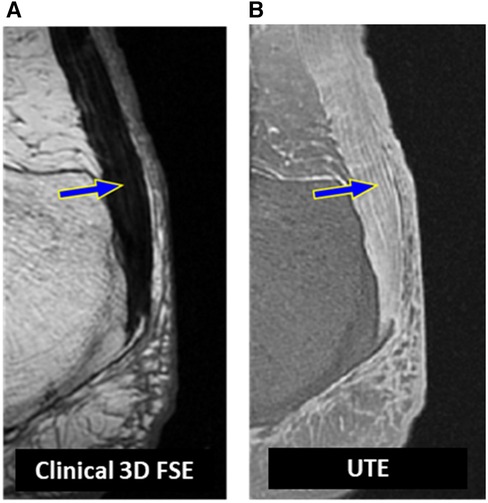
Figure 1. A representative achilles tendon imaged at 3 T (A) using a clinical T1-weighted 3D fast spin echo sequence (TR = 926 ms, TE = 18 ms) where the tendon (blue arrow) demonstrated no detectable signals and using (B) a UTE MRI (TR = 500 ms, TE = 0.032 ms) sequence where the tendon (blue arrow) demonstrated a high signal required for potential quantitative assessments.
In this review study, we summarize the quantitative studies conducted on tendons utilizing UTE sequences, including T2*, T1, magnetization transfer (MT), and T1ρ sequences. By examining the outcomes of these investigations, we aim to provide a summarized yet comprehensive overview of the current state of knowledge regarding the application of UTE sequences for assessing tendon health and pathology.
2 Materials and methods
This review conducted between April and June 2023 aimed to provide a thorough description of the current quantitative UTE applications on tendons. The literature search was performed in PubMed, Web of Science, and Google Scholar databases using the following keywords: “Ultrashort echo time”, “tendons”, and “UTE” published after the year 1990. The results were screened first automatically and then through title and abstract reading to exclude duplicated records, non-English written reports, non-quantitative studies, animal studies, and review articles. Study selection followed the PRISMA 2020 guidelines, as summarized in Figure 2.
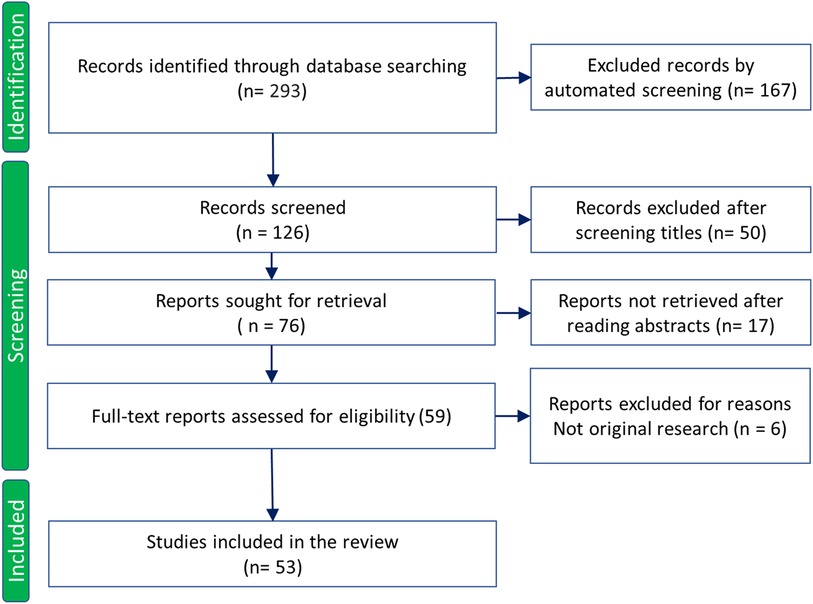
Figure 2. Study selection flowchart based on PRISMA 2020 guidelines. Adapted with permission from Page et al. (38), licensed under CC BY 4.0. http://prisma-statement.org/PRISMAStatement/CitingAndUsingPRISMA.
3 Results
All reviewed quantitative UTE-MRI-based investigations performed on tendons are summarized in Table 1. The reviewed studies were categorized based on the employed UTE-MRI technique including UTE-T2*, UTE-T1, UTE-MT, and UTE-T1ρ, which are described in detail in the following sections.
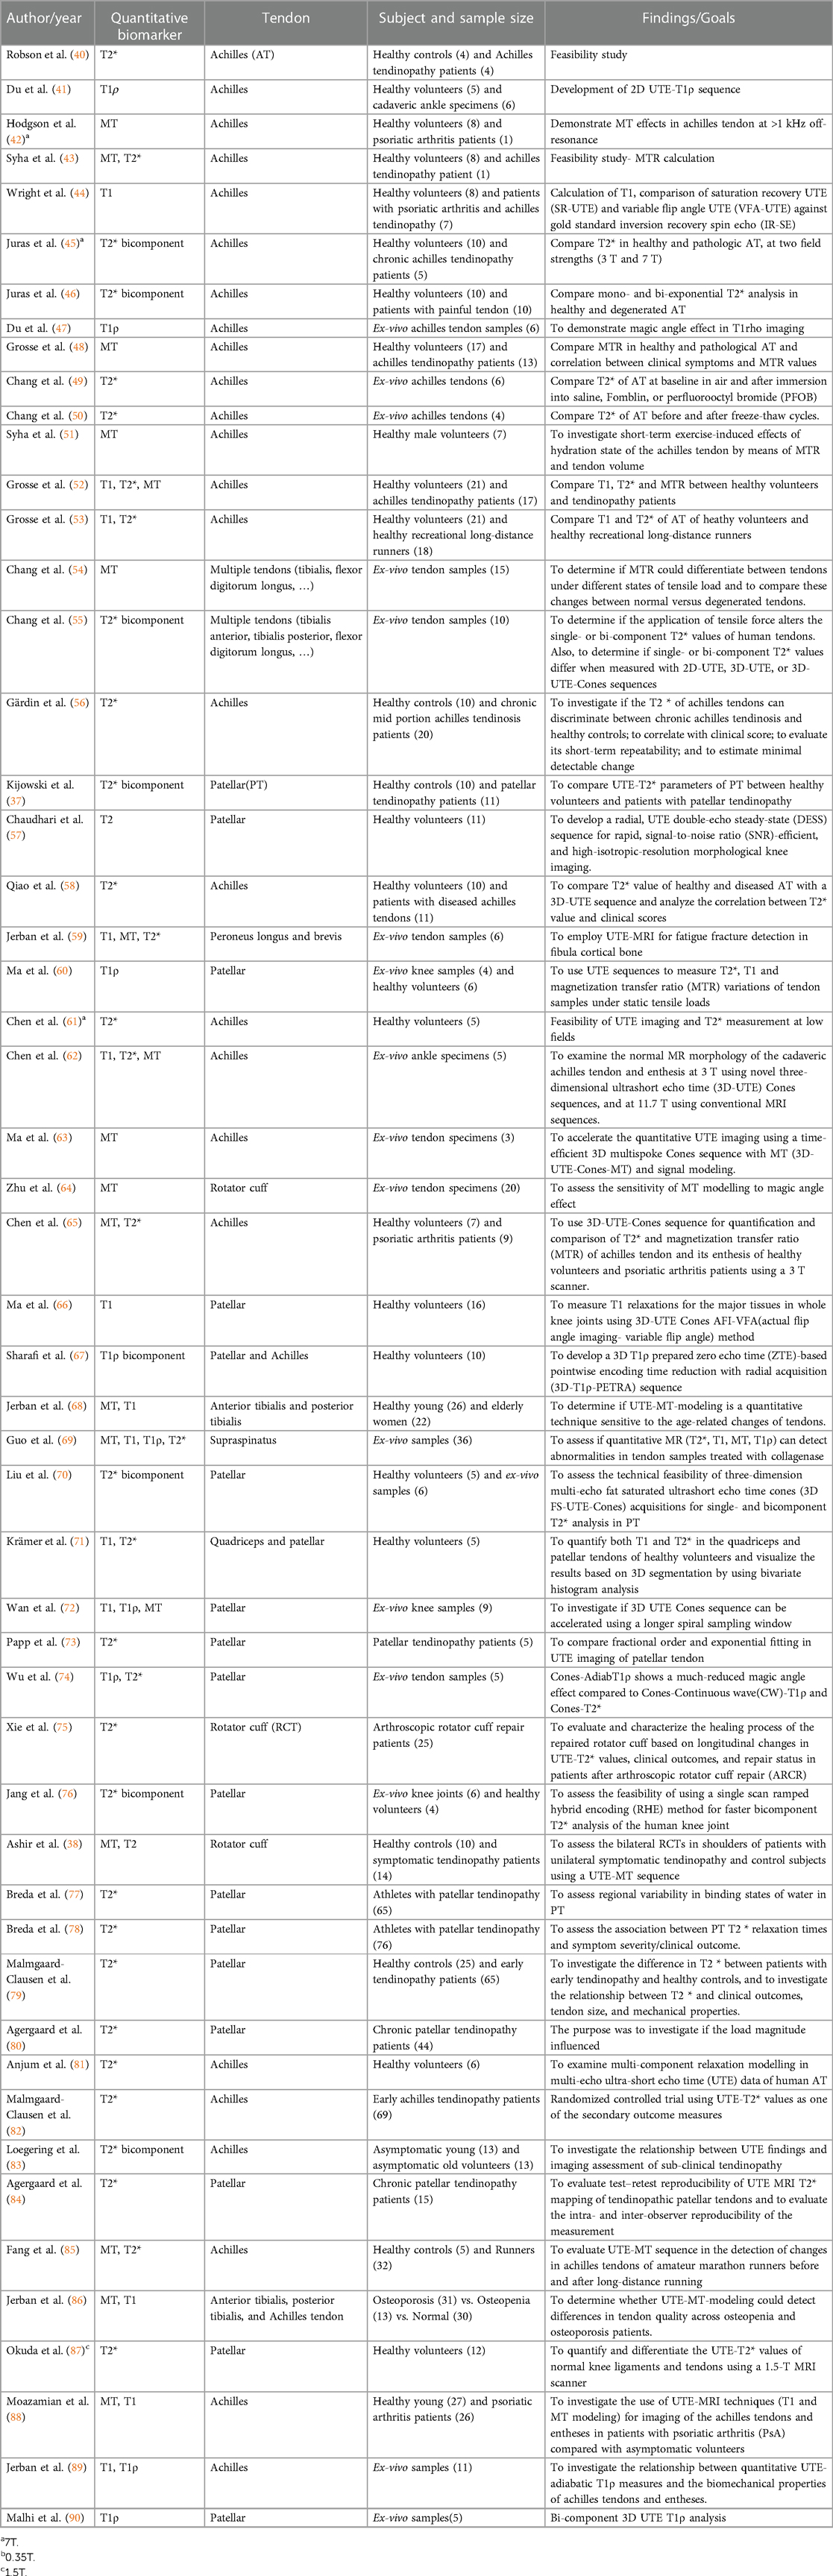
Table 1. Summarized UTE-MRI-based investigations performed on tendons.
3.1 UTE T2*
UTE T2* measurement of tendons has been widely investigated by acquiring UTE images at varying TEs. UTE T2* has been the most widely studied sequence for quantitative tendon imaging. Robson et al. were among the first to report T2* relaxation values using UTE sequences for Achilles tendons in vivo. They observed that two-dimensional (2D) UTE sequences provided anatomical detail which was not apparent with conventional sequences (40).
Tendinopathic tendons in general show elevated T2* values, as expected, due to the degeneration and inflammation related changes. In their respective studies, Gardin et al. (n = 20) (56) and Qiao et al. (n = 10) (58) found higher UTE-T2* values for diseased Achilles tendons when compared to healthy controls. A larger study by Malmgaard-Clausen et al. on 65 early tendinopathy patients (Achilles, patellar) found significantly higher UTE-T2* values in pathological tendons (79).
Juras et al. used a 3D-UTE sequence for bi-component T2* quantification of the Achilles tendon at 7 T (45) and 3 T (46) field strengths. They found that bi-component exponential analysis, specifically the short component was superior to single-component exponential analysis for diagnosing Achilles tendinopathy. Single-component T2* and the short-component T2* (from bi-component analysis) values for patients (n = 10) were significantly higher than those in controls. Kijowski et al. in their study on patellar tendinopathy patients (n = 11), found similar results and concluded that the fraction of short component and its relaxation time were more sensitive in detecting tendon disease (37). Liu et al. employed a fat-saturated (FS) multi-echo 3D-UTE-Cones sequence to assess the relaxation times and fractions of both short and long components within tendons. They demonstrated a predominance of short components in tendons, similar to previous studies (70). Jang et al. suggested using a rapid single scan ramped hybrid encoding for bi-component T2* mapping in knee joint which provided for shorter scan times (9 min). This technique captures all the required echoes in a single acquisition, reducing motion sensitivity (76). A recent study by Loegering et al. on 13 young and 13 old volunteers using 3D-UTE multi-echo with radial acquisition attempted to compare their slow and fast relaxing components. They found that older tendons exhibited a significantly higher short-component T2* and a smaller short-component fraction than young tendons, highlighting the sensitivity of the sequence for detecting early and sub-clinical tendinopathy (83).
Another area of interest in the study of tendons involves examining the effects of static and dynamic loading on tendons. Chang et al. conducted two distinct ex vivo experiments to explore the influence of tendon loading on T2* measurements. Results revealed that when subjected to lower loads (10 N), no significant alterations were detected in the T2* values (55). However, when higher loads ranging from 15 N to 30 N were applied, a notable load-dependent decrease in T2* was observed (59). T2* values of tendons in ex vivo experiments do not seem to be significantly affected by immersion in fluids such as saline or perfluoropolyether (e.g., Fomblin, Ausimont, NJ, USA) (49), as well as by repeated freeze-thaw cycles (50). Therefore, ex vivo findings are expected to apply to in vivo studies. Grosse et al. demonstrated the comparable impact of physical activity, specifically long-distance running, on UTE T2* values in the Achilles tendon of a group of long-distance runners (n = 18) (53).
Lately, follow-up studies utilizing UTE have been employed for tendon research. Xie et al. validated UTE T2* sequences against established clinical studies by following up on patients with rotator cuff repair (n = 25) longitudinally across 24 months. The clinical outcomes in patients showed significant correlations with UTE-T2* values at six months and 12 months, highlighting the potential of using UTE-T2* mapping to track the tendon-healing process noninvasively (75). They observed an increased T2* from 3 to 6 months and then a decreased T2* at 12 months post-injury, likely implying different healing phases. Agergaard demonstrated substantial/high intra and inter-observer reproducibility for UTE-T2* values in patellar tendons, further proving the feasibility of the use of UTE-T2* mapping in research and clinical practice (84).
In a relatively large longitudinal study by Breda et al.UTE-T2* relaxation times in patellar tendon decreased in 76 patients undergoing exercise therapy (78). The baseline higher T2* in the injured tendons could be explained by more free water and disrupted tendon fibers (91, 92), which might be restored by the exercise therapy. Figure 3 shows the UTE T2* pixel map and fitting curve in a representative cadaveric Achilles tendon imaged in the sagittal plane using UTE-T2* cones sequence.
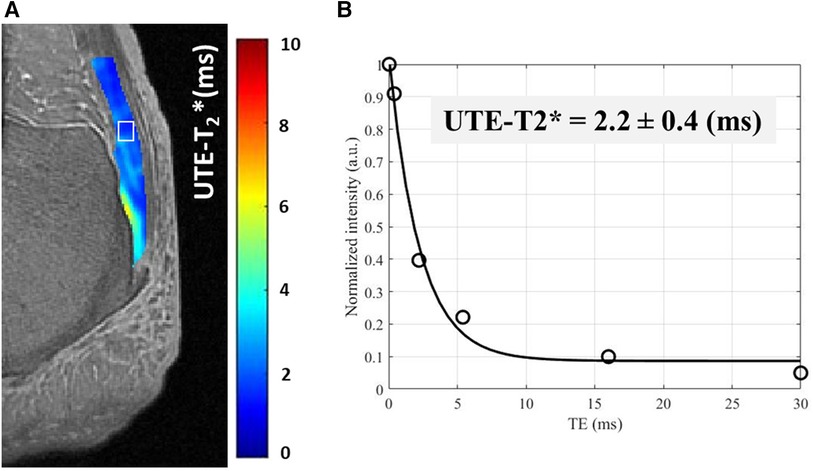
Figure 3. A UTE-T2* pixel map generated for achilles tendon from single component T2* decay fitting performed on each pixel. (B) UTE-T2* fitting curve using six different echo times (TEs = 0.032–30 ms) within an exemplary region of interest [indicated in white box in (A)].
3.2 UTE T1
Obtaining T1 measurements of tendons using UTE images can be accomplished by acquiring images with varying repetition time (TR) or flip angle (FA) to be fitted in exponential models. However, accurately determining the FA for tissues with short T2* can be challenging due to B1 field inhomogeneities. Estimating the actual flip angle (AFA) using a calculated B1 has been recommended for accurate T1 measurement (66).
T1 relaxation times are reported to be less sensitive to slight pathological tendon alterations compared to T2* and MTR values (52). In general, T1 of tendons is reported to be insignificantly affected by loading, age, and diseases like osteoporosis/osteopenia (59, 68, 86). Wright et al. observed that spondyloarthritis patients with Achilles tendinopathy exhibited elevated T1 values compared to healthy individuals (44). A histological and biochemically correlational study by Guo et al. found higher T1 values in rotator cuff tendon specimens treated with collagenase enzyme, which is known to degrade the collagen fibers (69). In a recent study, Moazamian et al. reported higher UTE-T1 values in Achilles tendon and its enthesis of patients with psoriatic arthritis (n = 26) compared with asymptomatic young subjects (n = 27) (88).
Figure 4 shows the UTE T1 pixel map and fitting curve in a representative cadaveric Achilles tendon imaged in the sagittal plane using UTE-T1 sequence.
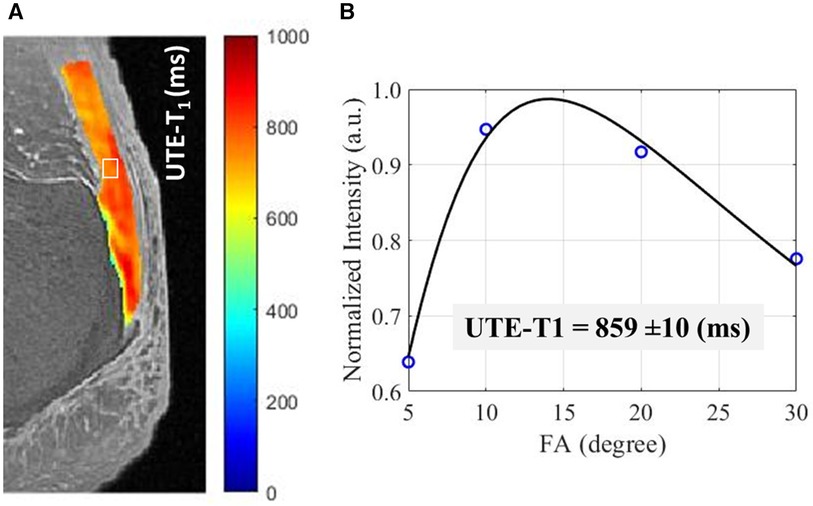
Figure 4. A UTE-T1 pixel map generated for achilles tendon from single component T1 recovery fitting performed on each pixel. (B) UTE-T1 measured for an exemplary region of the tendon, indicated in while box in (A), using VFA method using four different acquisitions with differing flip angles (FAs = 5°–30°).
3.3 UTE MT
Magnetization Transfer (MT) imaging in MRI involves selectively saturating the magnetization of bound protons or macromolecules using an off-resonance radiofrequency pulse. The macromolecular spins have a much broader absorption line shape in frequency domain than the liquid spins, making them much more sensitive to an appropriately placed off-resonance saturation pulse. This preferential saturation of the macromolecular spins can be transferred to the surroundings liquid spins. The transferred magnetization causes signal attenuation in the surrounding water protons, resulting in contrast differences and providing information about tissue composition and macromolecular content in MT images (93, 94).
UTE-MT ratio (UTE-MTR) is a common MT-related index in the literature, defined as MTR = (SOFF−SON)/SOFF. Where SOFF is the signal intensity in the image acquired without the magnetization transfer pulse preparation. SON is the signal intensity in the image acquired with the off-resonance magnetization transfer pulse preparation.
Syha et al. used MTR as a feasible method for quantifying interactions between bulk water and macromolecules in tendons. His study also found lower MTR values in a tendinopathic tendon compared with 16 healthy volunteers; however, only one pathological sample was studied (43). Further MRI research by the group found a lower mean MTR for pathological Achilles tendons (14 patients) compared with healthy controls (48). The MTR obtained from pulses at 2 kHz demonstrated the highest test performance (sensitivity and specificity) to distinguish the slightly- and severely pathologically altered tendons from the healthy ones (52).
MTR has been used to study the effects of loading on tendons. Syha et al. also examined the effect of ankle-straining activity like cross-country running on the Achilles tendon (n = 7) on the MTR. They found a significant increase in MTR in most tendon regions, which was attributed to the depletion of free water molecules after running (51). Reduction of the MTR values after long-distance running was observed in other investigations (85). In his experiment, Chang et al. used a 2D UTE MT sequence (MT power = 1,200, frequency offsets-1.5, 3, and 5 kHz) and a 3D-UTE-MT sequence (MT power 540, frequency offset 1.5 kHz) for comparing MTR before and under tensile loading of tendons. An increase in MTR was observed by all sequences on the application of tension (54). Later, the same group showed a non-significant increase in tendon MTR values under static tensile loads in another study when 3D-UTE-Cones was used (59). These studies indicate that UTE-MT sequences can detect changes in the hydration state of tendons (54, 59, 85).
Using MT pulses with higher power levels and larger frequency offsets may enhance the induced saturation on proton pools with extremely short T2, as found in macromolecules such as collagen. MTR values are functions of the MT pulse power level and the frequency offset, which makes MTR hardly reproducible between different studies. Hodgson et al. utilized MT modeling performed on 2D UTE MT sequences with four MT pulse powers (250, 500, 1,000, 1,400) and off-resonance frequencies ranging from 2 to 100 kHz to determine “bound proton fraction” which is assumed to represent the macromolecular fraction (MMF) of tissues. The tendon in the healthy subjects in this study demonstrated a consistent MMF higher than that of a psoriatic arthritis (42).
In recent years, UTE-MT modeling has been proposed to provide multiple parameters with much higher reproducibility levels, including MMF, macromolecular relaxation time (T2mm), and exchange rates. Ma et al. proposed a multi-spoke 3D-UTE Cones MT sequence and a modified rectangular pulse model to accelerate volumetric quantitative imaging of short T2 tissues like tendon and cortical bone (63). MMF obtained with the 3D-UTE Cones MT technique is less sensitive to the magic angle effect and more sensitive to rotator cuff tendon degeneration when compared to T2 using Carr-Purcell-Meiboom-Gill (CPMG) sequence (64). Employing the same approach, a comparison of tendons in healthy individuals (n = 7) and patients with psoriatic arthritis (n = 9) demonstrated considerably elevated MTR values in the latter group that were not discernible using the conventional GRE-MTR sequence (65). MT imaging has also been employed to distinguish variations between tendons and enthesis, whereby the latter exhibits lower MTR and MMF and higher Young’s modulus and stiffness (62).
MMF acts as a surrogate measure for collagen levels, as shown in an ex-vivo study conducted by Guo et al. The study involved the treatment of 36 supraspinatus tendons with collagenase, revealing a significant correlation between MMF values and collagen content (69).
Jerban et al. in his study observed lower MMF values for tibialis tendons in older women (n = 22) compared to the young cohort (n = 26) (68).
Ashir et al. also discovered that MMF was lower in tendons with rotator cuff tendinopathy (n = 14) compared with asymptomatic subjects. Figure 5 shows the UTE-based MMF pixel map and MT-modeling curves in the rotator cuff tendon of a representative healthy subject (first row) compared with a representative patient with rotator cuff tendinopathy (38). Notably, the contralateral asymptomatic tendons in patients also had a lower MMF than controls, which aligns with previous reports indicating a higher risk of tears in the opposite shoulder (38). Later, the MMF in lower leg tendons (Achilles, tibialis anterior, and tibialis posterior) of individuals with osteoporosis was compared to healthy controls, and it was found that the MMF was lower in the osteoporosis patients than in the healthy control group (68). In a recent study, Moazamian et al. reported lower MMF values in Achilles tendon and its enthesis of patients with psoriatic arthritis (n = 26) compared with asymptomatic young subjects (n = 27) (88).
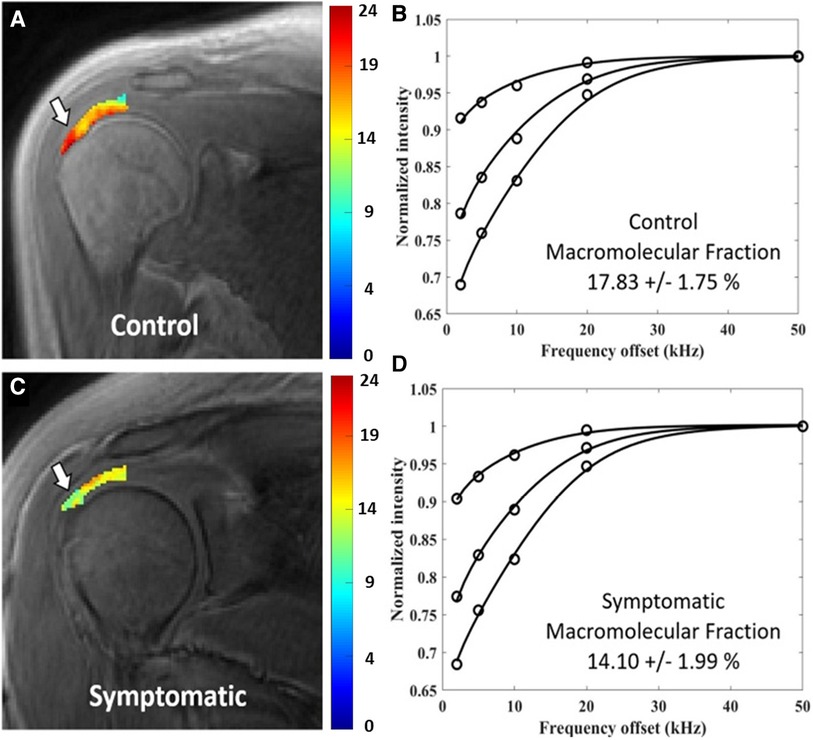
Figure 5. Generated macromolecular proton fraction (MMF) pixel maps and fitting curves for healthy control (first row) and symptomatic tendinopathy patient (second row) using 3 MT powers (300°, 550° and 750°) and five offset frequencies (2, 5, 10, 20, 50 kHz). Obviously, the symptomatic patient demonstrated lower MMF value. Reprinted with permission from Wiley (39), © 2020 International Society for Magnetic Resonance in Medicine.
3.4 UTE T1ρ
T1ρ relaxation occurs after the application of a long-duration on-resonance RF pulse to “spinlock” the longitudinal magnetization vector into a rotated frame. T1ρ is hypothesized to be sensitive to low-frequency motional interactions between macromolecules, like collagen and proteoglycan, and the associated water molecules, which makes it helpful in studying tissues like tendons and cartilage (95). UTE T1ρ sequences can visualize and quantify the T1ρ of tendons and, more recently have been used to quantify the slow and fast relaxing water components. T1ρ has a strong potential to be an early noninvasive biomarker of proteoglycan loss and early tissue degeneration (96). T1ρ is thought to be more sensitive than T2/T2* in identifying early tissue degeneration (97, 98).
Du et al. first used a 2D UTE-based T1ρ sequence to determine the T1ρ relaxation time and dispersion in the Achilles tendon. The mean T1ρ of the tendon increased by around four times when spin-lock frequency was increased from 250 to 1,000 Hz (41). Further experiments by the same group on tendons demonstrated a strong ‘magic angle’ effect on UTE-T1ρ values, which increased from 5.5 ± 2.2 ms at 0° to 40 ± 5 ms at 55° orientation angle relative to the main magnetic field (B0, parallel to the scanner bore (47). The magic angle sensitivity has been a concern when a continuous wave pulse sequence has been used. Ma et al. developed a sequence that used an adiabatic spin-locking pulse, which showed a much reduced magic angle effect in tendons compared to the previously used continuous wave T1ρ sequence (60, 74). The adiabatic UTE-T1ρ has been recently shown to be significantly correlated with the mechanical properties of Achilles tendon and its enthesis (89). Figure 6 shows the adiabatic UTE-T1ρ pixel map and fitting curve in a representative cadaveric Achilles tendon imaged in the sagittal plane using UTE-Adiab-T1ρ sequence. However, the in vivo adiabatic UTE-T1ρ application and its sensitivity to tendinopathy is yet to be investigated.
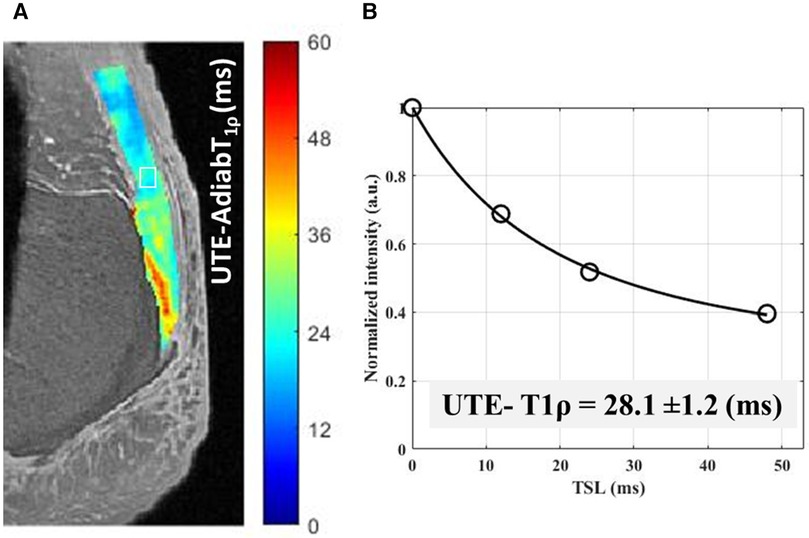
Figure 6. A UTE- adiabatic-T1ρ pixel map generated for achilles tendon from single component T1ρ decay fitting performed on each pixel. (B) UTE- Adiabatic-T1ρ measured using four different spin-lock time (TSL = 0–48 ms) within an exemplary region of interest [indicated in white box in (A)].
Sharafi et al. developed a 3D-T1ρ zero echo time (ZTE) based sequence with pointwise encoding time reduction with radial acquisition (PETRA) for biexponential relaxation mapping of knee tissues including patellar tendon and Achilles tendon. They were able to successfully demonstrate the feasibility of the sequence for bicomponent T1ρ assessment of these tissues (67).
4 Discussion
In this study, we reviewed various studies utilizing UTE sequences for tendon imaging, examining their results, advantages, and drawbacks. This review aimed to provide insights into the potential applications of quantitative UTE sequences in tendon imaging. Although most of the discussed quantitative UTE-MRI techniques are still in the validation phases, they showed significant potential to be translated into clinical investigations for compositional and ultrastructural assessment of tendons.
Table 2 summarizes the principle, acquisition protocol, potential sensitivity to compositional changes in tendons, and advantages and disadvantages of the reviewed UTE techniques. UTE-T2* and UTE-T1 can be considered as the least sophisticated techniques (no pulse preparation, shorter scan time, and simple exponential models) to be translated to clinical investigations. However, these techniques are not sensitive to a specific compositional change of the tendons. Nevertheless, tendon injuries are expected to lead to an increase in T1 (44, 69, 88) and T2* (37, 56, 58, 79) caused by inflammation, higher water content, and fiber disruption. UTE-T1ρ and UTE-MT usually need longer scan time and result in higher specific absorption rate (SAR) caused by the pulse preparation (spin-lock and off-resonance saturation) in these techniques. UTE-T1ρ and UTE-MT are likely sensitive to macromolecular changes in tendons (99–101). Tendon injuries are expected to lead to an increase in T1ρ while a decrease in MT (38, 69, 86) measures caused by inflammation, higher water content, and fiber disruption. It should be noted that all the reviewed MRI techniques in this study are highly likely correlated to each other. Therefore, recommending a unique technique for a specific tendon composition or condition is challenging and requires future well-designed experiments and comparisons with ground truth measures from histology and electron microscopy.
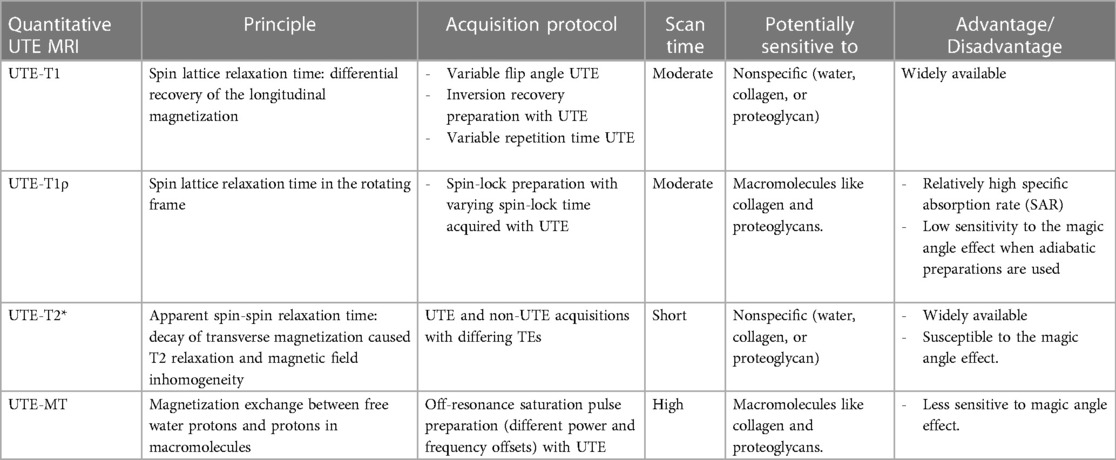
Table 2. UTE techniques principles and potentials.
Quantitative UTE biomarkers, like UTE T2* and continuous wave (CW) UTE T1ρ, exhibit a notable susceptibility to magic angle effects, especially in tendons, owing to their collagen fibers’ dense and parallel alignment. Figure 7 shows the variations in these values depending on the orientation angle of the tendons inside the scanner bore could be significant and surpass the alterations caused by the actual pathology. This figure was previously presented by We et al. (48). Among the discussed UTE techniques, UTE-Adiabatic T1ρ and MT modeling represent novel and promising techniques for addressing the magic angle effect in tendons. In the light of this fact, more tendon-specific studies are expected to use UTE-Adiab-T1ρ and UTE-MT modeling in future investigations. Various signal models- single-component, bi-component, and multi-component have been used to study tendons. A bicomponent signal model describes MRI signals originating from two distinct components, often associated with different tissue properties. In tendon bicomponent analysis, the signal is divided into fast (short) and slow (long) relaxing components based on their distinct relaxation times.
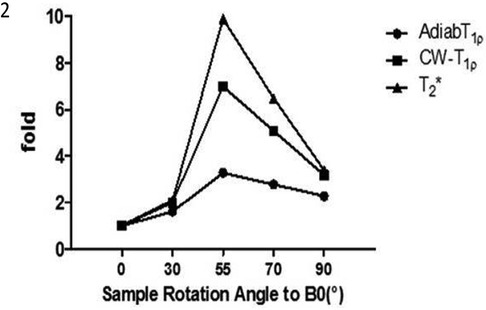
Figure 7. Angular dependency of UTE Cones Adiab T1ρ, CW- T1ρ and Cones-T2*. T1ρ is less sensitive to the magic angle effect than T2*. Among T1ρ sequences, Adiabatic-T1ρ exhibits a decreased magic angle impact compared to the previously employed CW-T1ρ. Reprinted with permission from Wiley (74) © 2020 John Wiley & Sons, Ltd.
In non-Cartesian UTE imaging, fat signals exhibit a radial shift due to off-resonance sampling of fat. Since many UTE sequences employ non-Cartesian trajectories such as radial or cones, it becomes crucial to employ fat suppression techniques to minimize the interference caused by fat signals. This is particularly important in regions such as the Achilles and patellar tendons, which are adjacent to fat pads and susceptible to fat signal contamination. Conventional fat saturation is still the most widely used fat suppression technique in UTE, but the fat sat pulse attenuates the short T2 tendon signals. In their research, Chen et al. investigated the impact of fat saturation on UTE T2*, T1ρ, and MT sequences (102). They tested fat-saturated and non-fat-saturated modules on whole knee cadaveric specimens at 3 T. The study revealed strong correlations and agreement between the two techniques, with only around a 10% difference observed for the relaxation times and MT values (MTR and MMF) of the quadriceps tendon.
A recent study by Ma et al. introduced a new approach utilizing a composite soft-hard RF pulse to effectively suppress fat signals in UTE imaging for tissues with short T2 values (103). The soft component of this composite pulse is characterized by a narrow bandwidth a small negative flip angle and is centered on the fat peak. On the other hand, the hard component is a short rectangular pulse with a small positive flip angle. By employing this composite pulse, the fat magnetization is tipped down and then back with the same flip angle, reaches a state of equilibrium, leaving only the excited water magnetization. In their feasibility study, Ma et al. compared a conventional fat saturation (FatSat) model with a novel technique using the signal suppression ratio (SSR) as an evaluation metric. The results demonstrated that the soft-hard composite pulse approach outperformed the FatSat method by exhibiting lower signal attenuation in water imaging, effective in vivo fat suppression, improved preservation of both long and short T2 signals, significantly higher SSR for short T2 signals, and enhanced contrast between water and fat. Jang et al. applied fat sat using a novel, single-point Dixon approach, allowing better UTE contrast for tissues with short T2 (104). This could help in much more efficient fat suppression and more accurate values. Additional research to explore the influence of quantitative UTE imaging with various fat suppression techniques would be highly valuable.
In addition to hydrogen proton MRI widely available in hospitals, Sodium MRI has emerged as a novel and intriguing MRI sequence in recent years. Tendinopathy is characterized by elevated levels of water and proteoglycan concentrations, leading to an associated rise in sodium content (105, 106). Sodium MRI has been used to measure and quantify SNR, apparent tissue sodium contrast, and sodium relaxation times in Achilles tendons. As expected, increased SNR has been found in Achilles tendinopathy patients, owing to the increased GAG content (107, 108). A significant drawback, however, of this technique is the low resolution of images, which makes them prone to partial volume effects.
Employing UTE-MRI biomarkers in clinical investigation encounters a few significant challenges. First, quantitative UTE MRI protocols, especially MT for MMF analysis and T2* and T1ρ for bicomponent analyses (90), require long scan times (>20 min), making them less useful for clinical implementation and increasing the risk of motion artefacts. Second, for such long MRI scans, motion registration becomes a crucial component of the protocol for in vivo quantitative imaging to mitigate the impact of patient movement during scans. Various accelerating techniques can be utilized to accelerate the quantitative UTE protocols and significantly reduce motion-related artifacts while maintaining minimal errors. These techniques include stretching the readout trajectory (72), compressed sensing (109), and integration of deep convolutional neural networks (CNNs) (110). Third, most quantitative MRI techniques may show site and vendor-dependent variation, which challenges future clinical adoption. Well-designed multi-site and multi-vendor investigations are required to promote such quantitative MRI-based techniques.
Data availability statement
The original contributions presented in the study are included in the article, further inquiries can be directed to the corresponding authors.
Author contributions
BM: Conceptualization, Data curation, Methodology, Writing – original draft, Writing – review & editing. HJ: Writing – review & editing. MM: Methodology, Writing – original draft, Writing – review & editing. DB: Writing – review & editing. SJ: Conceptualization, Data curation, Methodology, Supervision, Writing – original draft, Writing – review & editing.
Funding
The author(s) declare that financial support was received for the research, authorship, and/or publication of this article.
The authors appreciate the grant support from the National Institutes of Health (K01AR080257, R01AR078877, and R01AR070830).
Conflict of interest
The authors declare that the research was conducted in the absence of any commercial or financial relationships that could be construed as a potential conflict of interest.
Publisher's note
All claims expressed in this article are solely those of the authors and do not necessarily represent those of their affiliated organizations, or those of the publisher, the editors and the reviewers. Any product that may be evaluated in this article, or claim that may be made by its manufacturer, is not guaranteed or endorsed by the publisher.
References
1. Ahmad Z, Parkar A, Shepherd J, Rushton N. Revolving doors of tendinopathy: definition, pathogenesis and treatment. Postgrad Med J. (2020) 96(1132):94–101. doi: 10.1136/postgradmedj-2019-136786
2. Wang HK. A descriptive epidemiological study of shoulder injury in top level english male volleyball players. Int J Sports Med. (2001) 22(02):159–63. doi: 10.1055/s-2001-11346
3. Buda R, Caprio FD, Bedetti L, Mosca M, Giannini S. Foot overuse diseases in rock climbing. J Am Podiatr Med Assoc. (2013) 103(2):113–20. doi: 10.7547/15-099
4. Lian ØB, Engebretsen L, Bahr R. Prevalence of jumper’s knee among elite athletes from different sports: a cross-sectional study. Am J Sports Med. (2005) 33(4):561–7. doi: 10.1177/0363546504270454
5. Miranda H, Viikari-Juntura E, Heistaro S, Heliövaara M, Riihimäki H. A population study on differences in the determinants of a specific shoulder disorder versus nonspecific shoulder pain without clinical findings. Am J Epidemiol. (2005) 161(9):847–55. doi: 10.1093/aje/kwi112
6. Shiri R, Varonen H, Heliövaara M, Viikari-Juntura E. Hand dominance in upper extremity musculoskeletal disorders. J Rheumatol. (2007) 34(5):1076–82.17343320
7. Chard MD, Hazleman BL. Shoulder disorders in the elderly (a hospital study). Ann Rheum Dis. (1987) 46(9):684–7. doi: 10.1136/ard.46.9.684
8. Roquelaure Y, Ha C, Leclerc A, Touranchet A, Sauteron M, Melchior M, et al. Epidemiologic surveillance of upper-extremity musculoskeletal disorders in the working population. Arthritis Rheum. (2006) 55(5):765–78. doi: 10.1002/art.22222
9. Thorpe CT, Screen HR. Tendon structure and composition. Adv Exp Med Biol. (2016) 920:3–10. doi: 10.1007/978-3-319-33943-6_1
10. Thomopoulos S, Marquez JP, Weinberger B, Birman V, Genin GM. Collagen fiber orientation at the tendon to bone insertion and its influence on stress concentrations. J Biomech. (2006) 39(10):1842–51. doi: 10.1016/j.jbiomech.2005.05.021
11. Kjær M. Role of extracellular matrix in adaptation of tendon and skeletal muscle to mechanical loading. Physiol Rev. (2004) 84(2):649–98. doi: 10.1152/physrev.00031.2003
12. Lin TW, Cardenas L, Soslowsky LJ. Biomechanics of tendon injury and repair. J Biomech. (2004) 37(6):865–77. doi: 10.1016/j.jbiomech.2003.11.005
13. Riley GP, Goddard MJ, Hazleman BL. Histopathological assessment and pathological significance of matrix degeneration in supraspinatus tendons. Rheumatology. (2001) 40(2):229–30. doi: 10.1093/rheumatology/40.2.229
14. de Mos M, van El B, DeGroot J, Jahr H, van Schie HT, van Arkel ER, et al. Achilles tendinosis: changes in biochemical composition and collagen turnover rate. Am J Sports Med. (2007) 35(9):1549–56. doi: 10.1177/0363546507301885
15. Samiric T, Parkinson J, Ilic MZ, Cook J, Feller JA, Handley CJ. Changes in the composition of the extracellular matrix in patellar tendinopathy. Matrix Biol. (2009) 28(4):230–6. doi: 10.1016/j.matbio.2009.04.001
16. Maffulli N, Ewen SW, Waterston SW, Reaper J, Barrass V. Tenocytes from ruptured and tendinopathic achilles tendons produce greater quantities of type III collagen than tenocytes from normal achilles tendons. An in vitro model of human tendon healing. Am J Sports Med. (2000) 28(4):499–505. doi: 10.1177/03635465000280040901
17. Maffulli N, Barrass V, Ewen SW. Light microscopic histology of achilles tendon ruptures. A comparison with unruptured tendons. Am J Sports Med. (2000) 28(6):857–63. doi: 10.1177/03635465000280061401
18. Maeda E, Noguchi H, Tohyama H, Yasuda K, Hayashi K. The tensile properties of collagen fascicles harvested from regenerated and residual tissues in the patellar tendon after removal of the central third. Biomed Mater Eng. (2007) 17(2):77–85.17377216
19. Millar NL, Silbernagel KG, Thorborg K, Kirwan PD, Galatz LM, Abrams GD, et al. Tendinopathy. Nat Rev Dis Primers. (2021) 7(1):1–21. doi: 10.1038/s41572-020-00234-1
20. Xu Y, Murrell GAC. The basic science of tendinopathy. Clin Orthop Relat Res. (2008) 466(7):1528–38. doi: 10.1007/s11999-008-0286-4
21. Screen HRC, Birk DE, Kadler KE, Ramirez F, Young MF. Tendon functional extracellular matrix. J Orthop Res. (2015) 33(6):793–9. doi: 10.1002/jor.22818
22. Fu SC, Chan KM, Rolf CG. Increased deposition of sulfated glycosaminoglycans in human patellar tendinopathy. Clin J Sport Med. (2007) 17(2):129. doi: 10.1097/JSM.0b013e318037998f
23. Rees SG, Davies JR, Tudor D, Flannery CR, Hughes CE, Dent CM, et al. Immunolocalisation and expression of proteoglycan 4 (cartilage superficial zone proteoglycan) in tendon. Matrix Biol. (2002) 21(7):593–602. doi: 10.1016/s0945-053x(02)00056-2
24. Rhee DK, Marcelino J, Baker M, Gong Y, Smits P, Lefebvre V, et al. The secreted glycoprotein lubricin protects cartilage surfaces and inhibits synovial cell overgrowth. J Clin Invest. (2005) 115(3):622–31. doi: 10.1172/JCI22263
25. Parkinson J, Samiric T, Ilic MZ, Cook J, Handley CJ. Involvement of proteoglycans in tendinopathy. J Musculoskelet Neuronal Interact. (2011) 11(2):86–93.21625045
26. von Rickenbach KJ, Borgstrom H, Tenforde A, Borg-Stein J, McInnis KC. Achilles tendinopathy: evaluation, rehabilitation, and prevention. Curr Sports Med Rep. (2021) 20(6):327. doi: 10.1249/JSR.0000000000000855
27. Steinmann S, Pfeifer CG, Brochhausen C, Docheva D. Spectrum of tendon pathologies: triggers, trails and end-state. Int J Mol Sci. (2020) 21(3):844. doi: 10.3390/ijms21030844
28. Frankewycz B, Penz A, Weber J, da Silva NP, Freimoser F, Bell R, et al. Achilles tendon elastic properties remain decreased in long term after rupture. Knee Surg Sports Traumatol Arthrosc. (2018) 26(7):2080–7. doi: 10.1007/s00167-017-4791-4
29. Chang A, Miller TT. Imaging of tendons. Sports Health. (2009) 1(4):293–300. doi: 10.1177/1941738109338361
30. Filho GH, Du J, Pak BC, Statum S, Znamorowski R, Haghighi P, et al. Quantitative characterization of the achilles tendon in cadaveric specimens: T1 and T2* measurements using ultrashort-TE MRI at 3T. Am J Roentgenol. (2009) 192(3):W117–24. doi: 10.2214/AJR.07.3990
31. Chang EY, Du J, Chung CB. UTE imaging in the musculoskeletal system. J Magn Reson Imaging. (2015) 41(4):870–83. doi: 10.1002/jmri.24713
32. Robson MD, Gatehouse PD, Bydder M, Bydder GM. Magnetic resonance: an introduction to ultrashort TE (UTE) imaging. J Comput Assist Tomogr. (2003) 27(6):825. doi: 10.1097/00004728-200311000-00001
33. Gurney PT, Hargreaves BA, Nishimura DG. Design and analysis of a practical 3D cones trajectory. Magn Reson Med. (2006) 55(3):575–82. doi: 10.1002/mrm.20796
34. Marshall H, Howarth C, Larkman DJ, Herlihy AH, Oatridge A, Bydder GM. Contrast-enhanced magic-angle MR imaging of the achilles tendon. Am J Roentgenol. (2002) 179(1):187–92. doi: 10.2214/ajr.179.1.1790187
35. Prince MR, Zhang HL, Roditi GH, Leiner T, Kucharczyk W. Risk factors for NSF: a literature review. J Magn Reson Imaging. (2009) 30(6):1298–308. doi: 10.1002/jmri.21973
36. De Mello R, Ma Y, Ji Y, Du J, Chang EY. Quantitative MRI musculoskeletal techniques: an update. Am J Roentgenol. (2019) 213(3):524–33. doi: 10.2214/AJR.19.21143
37. Kijowski R, Wilson JJ, Liu F. Bicomponent ultrashort echo time T2* analysis for assessment of patients with patellar tendinopathy. J Magn Reson Imaging. (2017) 46(5):1441–7. doi: 10.1002/jmri.25689
38. Page MJ, McKenzie JE, Bossuyt PM, Boutron I, Hoffmann TC, Mulrow CD, et al. The PRISMA 2020 statement: an updated guideline for reporting systematic reviews. BMJ (2021) 372:n71. doi: 10.1136/bmj.n71
39. Ashir A, Ma Y, Jerban S, Jang H, Wei Z, Le N, et al. Rotator cuff tendon assessment in symptomatic and control groups using quantitative MRI. J Magn Reson Imaging. (2020) 52(3):864–72. doi: 10.1002/jmri.27115
40. Robson MD, Benjamin M, Gishen P, Bydder GM. Magnetic resonance imaging of the achilles tendon using ultrashort TE (UTE) pulse sequences. Clin Radiol. (2004) 59(8):727–35. doi: 10.1016/j.crad.2003.11.021
41. Du J, Carl M, Diaz E, Takahashi A, Han E, Szeverenyi NM, et al. Ultrashort TE T1rho (UTE T1rho) imaging of the achilles tendon and meniscus. Magn Reson Med. (2010) 64(3):834–42. doi: 10.1002/mrm.22474
42. Hodgson RJ, Evans R, Wright P, Grainger AJ, O'Connor PJ, Helliwell P, et al. Quantitative magnetization transfer ultrashort echo time imaging of the achilles tendon. Magn Reson Med. (2011) 65(5):1372–6. doi: 10.1002/mrm.22715
43. Syha R, Martirosian P, Ketelsen D, Grosse U, Claussen CD, Schick F, et al. Magnetization transfer in human achilles tendon assessed by a 3D ultrashort echo time sequence: quantitative examinations in healthy volunteers at 3T. Rofo. (2011) 183(11):1043–50. doi: 10.1055/s-0031-1281742
44. Wright P, Jellus V, McGonagle D, Robson M, Ridgeway J, Hodgson R. Comparison of two ultrashort echo time sequences for the quantification of T1 within phantom and human achilles tendon at 3T. Magn Reson Med. (2012) 68(4):1279–84. doi: 10.1002/mrm.24130
45. Juras V, Zbyn S, Pressl C, Valkovic L, Szomolanyi P, Frollo I, et al. Regional variations of T₂* in healthy and pathologic achilles tendon in vivo at 7 tesla: preliminary results. Magn Reson Med. (2012) 68(5):1607–13. doi: 10.1002/mrm.24136
46. Juras V, Apprich S, Szomolanyi P, Bieri O, Deligianni X, Trattnig S. Bi-exponential T2 analysis of healthy and diseased achilles tendons: an in vivo preliminary magnetic resonance study and correlation with clinical score. Eur Radiol. (2013) 23(10):2814–22. doi: 10.1007/s00330-013-2897-8
47. Du J, Statum S, Znamirowski R, Bydder GM, Chung CB. Ultrashort TE T1ρ magic angle imaging. Magn Reson Med. (2013) 69(3):682–7. doi: 10.1002/mrm.24296
48. Grosse U, Syha R, Martirosian P, Wuerslin C, Horger M, Grözinger G, et al. Ultrashort echo time MR imaging with off-resonance saturation for characterization of pathologically altered achilles tendons at 3T. Magn Reson Med. (2013) 70(1):184–92. doi: 10.1002/mrm.24435
49. Chang EY, Du J, Bae WC, Statum S, Chung CB. Effects of achilles tendon immersion in saline and perfluorochemicals on T2 and T2*. J Magn Reson Imaging. (2014) 40(2):496–500. doi: 10.1002/jmri.24360
50. Chang EY, Bae WC, Statum S, Du J, Chung CB. Effects of repetitive freeze-thawing cycles on T2 and T2 of the achilles tendon. Eur J Radiol. (2014) 83(2):349–53. doi: 10.1016/j.ejrad.2013.10.014
51. Syha R, Springer F, Grözinger G, Würslin C, Ipach I, Ketelsen D, et al. Short-term exercise-induced changes in hydration state of healthy achilles tendons can be visualized by effects of off-resonant radiofrequency saturation in a three-dimensional ultrashort echo time MRI sequence applied at 3 tesla. J Magn Reson Imaging. (2014) 40(6):1400–7. doi: 10.1002/jmri.24488
52. Grosse U, Syha R, Hein T, Gatidis S, Grözinger G, Schabel C, et al. Diagnostic value of T1 and T2 * relaxation times and off-resonance saturation effects in the evaluation of achilles tendinopathy by MRI at 3T. J Magn Reson Imaging. (2015) 41(4):964–73. doi: 10.1002/jmri.24657
53. Grosse U, Springer F, Hein T, Grözinger G, Schabel C, Martirosian P, et al. Influence of physical activity on T1 and T2* relaxation times of healthy achilles tendons at 3T. J Magn Reson Imaging. (2015) 41(1):193–201. doi: 10.1002/jmri.24525
54. Chang EY, Du J, Biswas R, Statum S, Pauli C, Bae WC, et al. Off-resonance saturation ratio obtained with ultrashort echo time-magnetization transfer techniques is sensitive to changes in static tensile loading of tendons and degeneration. J Magn Reson Imaging. (2015) 42(4):1064–71. doi: 10.1002/jmri.24881
55. Chang EY, Du J, Iwasaki K, Biswas R, Statum S, He Q, et al. Single- and bi-component T2* analysis of tendon before and during tensile loading, using UTE sequences. J Magn Reson Imaging. (2015) 42(1):114–20. doi: 10.1002/jmri.24758
56. Gärdin A, Rasinski P, Berglund J, Shalabi A, Schulte H, Brismar TB. T2* relaxation time in achilles tendinosis and controls and its correlation with clinical score. J Magn Reson Imaging. (2016) 43(6):1417–22. doi: 10.1002/jmri.25104
57. Chaudhari AS, Sveinsson B, Moran CJ, McWalter EJ, Johnson EM, Zhang T, et al. Imaging and T2 relaxometry of short-T2 connective tissues in the knee using ultrashort echo-time double-echo steady-state (UTEDESS). Magn Reson Med. (2017) 78(6):2136–48. doi: 10.1002/mrm.26577
58. Qiao Y, Tao HY, Ma K, Wu ZY, Qu JX, Chen S. UTE-T2* analysis of diseased and healthy achilles tendons and correlation with clinical score: an in vivo preliminary study. Biomed Res Int. (2017) 2017:2729807. doi: 10.1155/2017/2729807
59. Jerban S, Ma Y, Nazaran A, Dorthe EW, Cory E, Carl M, et al. Ultrashort echo time T2∗ values decrease in tendons with application of static tensile loads. J Biomech. (2017) 61:160–7. doi: 10.1016/j.jbiomech.2017.07.018
60. Ma YJ, Carl M, Searleman A, Lu X, Chang EY, Du J. 3D adiabatic T1ρ prepared ultrashort echo time cones sequence for whole knee imaging. Magn Reson Med. (2018) 80(4):1429–39. doi: 10.1002/mrm.27131
61. Chen X, Qiu B. A pilot study of short T2* measurements with ultrashort echo time imaging at 0.35T. Biomed Eng Online. (2018) 17(1):70. doi: 10.1186/s12938-018-0505-5
62. Chen B, Cheng X, Dorthe EW, Zhao Y, D'Lima D, Bydder GM, et al. Evaluation of normal cadaveric achilles tendon and enthesis with ultrashort echo time (UTE) magnetic resonance imaging and indentation testing. NMR Biomed. (2019) 32(1):e4034. doi: 10.1002/nbm.4034
63. Ma YJ, Chang EY, Carl M, Du J. Quantitative magnetization transfer ultrashort echo time imaging using a time-efficient 3D multispoke cones sequence. Magn Reson Med. (2018) 79(2):692–700. doi: 10.1002/mrm.26716
64. Zhu Y, Cheng X, Ma Y, Wong JH, Xie Y, Du J, et al. Rotator cuff tendon assessment using magic-angle insensitive 3D ultrashort echo time cones magnetization transfer (UTE-cones-MT) imaging and modeling with histological correlation. J Magn Reson Imaging. (2018) 48(1):160–8. doi: 10.1002/jmri.25914
65. Chen B, Zhao Y, Cheng X, Ma Y, Chang EY, Kavanaugh A, et al. Three-dimensional ultrashort echo time cones (3D UTE-cones) magnetic resonance imaging of entheses and tendons. Magn Reson Imaging. (2018) 49:4–9. doi: 10.1016/j.mri.2017.12.034
66. Ma YJ, Zhao W, Wan L, Guo T, Searleman A, Jang H, et al. Whole knee joint T1 values measured in vivo at 3T by combined 3D ultrashort echo time cones actual flip angle and variable flip angle methods. Magn Reson Med. (2019) 81(3):1634–44. doi: 10.1002/mrm.27510
67. Sharafi A, Baboli R, Chang G, Regatte RR. 3D-T1ρ prepared zero echo time-based PETRA sequence for in vivo biexponential relaxation mapping of semisolid short-T2 tissues at 3T. J Magn Reson Imaging. (2019) 50(4):1207–18. doi: 10.1002/jmri.26664
68. Jerban S, Ma Y, Namiranian B, Ashir A, Shirazian H, Wei Z, et al. Age-related decrease in collagen proton fraction in tibial tendons estimated by magnetization transfer modeling of ultrashort echo time magnetic resonance imaging (UTE-MRI). Sci Rep. (2019) 9(1):17974. doi: 10.1038/s41598-019-54559-3
69. Guo T, Ma YJ, High RA, Tang Q, Wong JH, Byra M, et al. Assessment of an in vitro model of rotator cuff degeneration using quantitative magnetic resonance and ultrasound imaging with biochemical and histological correlation. Eur J Radiol. (2019) 121:108706. doi: 10.1016/j.ejrad.2019.108706
70. Liu J, Nazaran A, Ma Y, Chen H, Zhu Y, Du J, et al. Single- and bicomponent analyses of T2* relaxation in knee tendon and ligament by using 3D ultrashort echo time cones (UTE cones) magnetic resonance imaging. Biomed Res Int. (2019) 2019:8597423. doi: 10.1155/2019/8597423
71. Krämer M, Maggioni MB, Brisson NM, Zachow S, Teichgräber U, Duda GN, et al. T1 and T2* mapping of the human quadriceps and patellar tendons using ultra-short echo-time (UTE) imaging and bivariate relaxation parameter-based volumetric visualization. Magn Reson Imaging. (2019) 63:29–36. doi: 10.1016/j.mri.2019.07.015
72. Wan L, Ma Y, Yang J, Jerban S, Searleman AC, Carl M, et al. Fast quantitative three-dimensional ultrashort echo time (UTE) cones magnetic resonance imaging of major tissues in the knee joint using extended sprial sampling. NMR Biomed. (2020) 33(10):e4376. doi: 10.1002/nbm.4376
73. Papp D, Breda SJ, Oei EHG, Poot DHJ, Kotek G, Hernandez-Tamames JA. Fractional order vs. exponential fitting in UTE MR imaging of the patellar tendon. Magn Reson Imaging. (2020) 70:91–7. doi: 10.1016/j.mri.2020.04.005
74. Wu M, Ma Y, Wan L, Jerban S, Jang H, Chang EY, et al. Magic angle effect on adiabatic T1ρ imaging of the achilles tendon using 3D ultrashort echo time cones trajectory. NMR Biomed. (2020) 33(8):e4322. doi: 10.1002/nbm.4322
75. Xie Y, Liu S, Qu J, Wu P, Tao H, Chen S. Quantitative magnetic resonance imaging UTE-T2* mapping of tendon healing after arthroscopic rotator cuff repair: a longitudinal study. Am J Sports Med. (2020) 48(11):2677–85. doi: 10.1177/0363546520946772
76. Jang H, McMillan AB, Ma Y, Jerban S, Chang EY, Du J, et al. Rapid single scan ramped hybrid-encoding for bicomponent T2* mapping in a human knee joint: a feasibility study. NMR Biomed. (2020) 33(11):e4391. doi: 10.1002/nbm.4391
77. Breda SJ, Poot DHJ, Papp D, de Vries BA, Kotek G, Krestin GP, et al. Tissue-specific T2* biomarkers in patellar tendinopathy by subregional quantification using 3D ultrashort echo time MRI. J Magn Reson Imaging. (2020) 52(2):420–30. doi: 10.1002/jmri.27108
78. Breda SJ, de Vos RJ, Poot DHJ, Krestin GP, Hernandez-Tamames JA, Oei EHG. Association between T2* relaxation times derived from ultrashort echo time MRI and symptoms during exercise therapy for patellar tendinopathy: a large prospective study. J Magn Reson Imaging. (2021) 54(5):1596–605. doi: 10.1002/jmri.27751
79. Malmgaard-Clausen NM, Tran P, Svensson RB, Hansen P, Nybing JD, Magnusson SP, et al. Magnetic resonance T2 * is increased in patients with early-stage achilles and patellar tendinopathy. J Magn Reson Imaging. (2021) 54(3):832–9. doi: 10.1002/jmri.27600
80. Agergaard AS, Svensson RB, Malmgaard-Clausen NM, Couppé C, Hjortshoej MH, Doessing S, et al. Clinical outcomes, structure, and function improve with both heavy and moderate loads in the treatment of patellar tendinopathy: a randomized clinical trial. Am J Sports Med. (2021) 49(4):982–93. doi: 10.1177/0363546520988741
81. Anjum MAR, Gonzalez FM, Swain A, Leisen J, Hosseini Z, Singer A, et al. Multi-component T2∗ relaxation modelling in human achilles tendon: quantifying chemical shift information in ultra-short echo time imaging. Magn Reson Med. (2021) 86(1):415–28. doi: 10.1002/mrm.28686
82. Malmgaard-Clausen NM, Jørgensen OH, Høffner R, Andersen PEB, Svensson RB, Hansen P, et al. No additive clinical or physiological effects of short-term anti-inflammatory treatment to physical rehabilitation in the early phase of human achilles tendinopathy: a randomized controlled trial. Am J Sports Med. (2021) 49(7):1711–20. doi: 10.1177/0363546521991903
83. Loegering IF, Denning SC, Johnson KM, Liu F, Lee KS, Thelen DG. Ultrashort echo time (UTE) imaging reveals a shift in bound water that is sensitive to sub-clinical tendinopathy in older adults. Skeletal Radiol. (2021) 50(1):107–13. doi: 10.1007/s00256-020-03538-1
84. Agergaard AS, Malmgaard-Clausen NM, Svensson RB, Nybing JD, Boesen M, Kjaer M, et al. UTE T2* mapping of tendinopathic patellar tendons: an MRI reproducibility study. Acta Radiol. (2021) 62(2):215–24. doi: 10.1177/0284185120918807
85. Fang Y, Zhu D, Wu W, Yu W, Li S, Ma YJ. Assessment of achilles tendon changes after long-distance running using ultrashort echo time magnetization transfer MR imaging. J Magn Reson Imaging. (2022) 56(3):814–23. doi: 10.1002/jmri.28072
86. Jerban S, Ma Y, Afsahi AM, Lombardi A, Wei Z, Shen M, et al. Lower macromolecular content in tendons of female patients with osteoporosis versus patients with osteopenia detected by ultrashort echo time (UTE) MRI. Diagnostics (Basel). (2022) 12(5):1061. doi: 10.3390/diagnostics12051061
87. Okuda M, Kobayashi S, Toyooka K, Yoshimizu R, Nakase J, Hayashi H, et al. Quantitative differentiation of tendon and ligament using magnetic resonance imaging ultrashort echo time T2* mapping of normal knee joint. Acta Radiol. (2022) 63(11):1489–96. doi: 10.1177/02841851211043834
88. Moazamian D, Athertya JS, Dwek S, Lombardi AF, Mohammadi HS, Sedaghat S, et al. Achilles tendon and enthesis assessment using ultrashort echo time magnetic resonance imaging (UTE-MRI) T1 and magnetization transfer (MT) modeling in psoriatic arthritis. NMR Biomed. (2024) 37(1):e5040. doi: 10.1002/nbm.5040
89. Jerban S, Afsahi AM, Ma Y, Moazamian D, Statum S, Lombardi AF, et al. Correlations between elastic modulus and ultrashort echo time (UTE) adiabatic T1ρ relaxation time (UTE-adiab-T1ρ) in achilles tendons and entheses. J Biomech. (2023) 160:111825. doi: 10.1016/j.jbiomech.2023.111825
90. Malhi BS, Moazamian D, Shin SH, Athertya JS, Silva L, Jerban S, et al. Bi-exponential 3D UTE-T1ρ relaxation mapping of ex vivo human knee patellar tendon at 3T. Bioengineering. (2024) 11(1):66. doi: 10.3390/bioengineering11010066
91. Cao G, Gao S, Xiong B. Application of quantitative T1, T2 and T2* mapping magnetic resonance imaging in cartilage degeneration of the shoulder joint. Sci Rep. (2023) 13(1):4558. doi: 10.1038/s41598-023-31644-2
92. Bittersohl B, Hosalkar HS, Miese FR, Schibensky J, König DP, Herten M, et al. Zonal T2* and T1Gd assessment of knee joint cartilage in various histological grades of cartilage degeneration: an observational in vitro study. BMJ Open. (2015) 5(2):e006895. doi: 10.1136/bmjopen-2014-006895
93. Henkelman RM, Stanisz GJ, Graham SJ. Magnetization transfer in MRI: a review. NMR Biomed. (2001) 14(2):57–64. doi: 10.1002/nbm.683
94. Santyr GE, Mulkern RV. Relaxometry and biophysics committee. Magnetization transfer in MR imaging. J Magn Reson Imaging. (1995) 5(1):121–4. doi: 10.1002/jmri.1880050121
95. Wáng YX, Zhang Q, Li X, Chen W, Ahuja A, Yuan J. T1ρ magnetic resonance: basic physics principles and applications in knee and intervertebral disc imaging. Quant Imaging Med Surg. (2015) 5(6):858–85. doi: 10.3978/j.issn.2223-4292.2015.12.06
96. Auerbach JD, Johannessen W, Borthakur A, Wheaton AJ, Dolinskas CA, Balderston RA, et al. In vivo quantification of human lumbar disc degeneration using T1ρ-weighted magnetic resonance imaging. Eur Spine J. (2006) 15(S3):338–44. doi: 10.1007/s00586-006-0083-2
97. Wang L, Regatte RR. Quantitative mapping of human cartilage at 3.0T. Acad Radiol. (2014) 21(4):463–71. doi: 10.1016/j.acra.2013.12.010
98. Regatte RR, Akella SVS, Lonner JH, Kneeland JB, Reddy R. T1ρ relaxation mapping in human osteoarthritis (OA) cartilage: comparison of T1ρ with T2. J Magn Reson Imaging. (2006) 23(4):547–53. doi: 10.1002/jmri.20536
99. Laurent D, Wasvary J, Yin J, Rudin M, Pellas TC, O’Byrne E. Quantitative and qualitative assessment of articular cartilage in the goat knee with magnetization transfer imaging. Magn Reson Imaging. (2001) 19(10):1279–86. doi: 10.1016/S0730-725X(01)00433-7
100. Laurent D, O’Byrne E, Wasvary J, Pellas TC. In vivo MRI of cartilage pathogenesis in surgical models of osteoarthritis. Skeletal Radiol. (2006) 35(8):555–64. doi: 10.1007/s00256-006-0133-1
101. Le J, Peng Q, Sperling K. Biochemical magnetic resonance imaging of knee articular cartilage: T1rho and T2 mapping as cartilage degeneration biomarkers. Ann N Y Acad Sci. (2016) 1383(1):34–42. doi: 10.1111/nyas.13189
102. Chen Y, Li L, Le N, Chang EY, Huang W, Ma Y. On the fat saturation effect in quantitative ultrashort TE MR imaging. Magnetic Resonance in Med. (2022) 87(5):2388–97. doi: 10.1002/mrm.29149
103. Ma Y, Jerban S, Jang H, Chang EY, Du J. Fat suppression for ultrashort echo time imaging using a novel soft-hard composite radiofrequency pulse. Magn Reson Med. (2019) 82(6):2178–87. doi: 10.1002/mrm.27885
104. Jang H, Carl M, Ma Y, Jerban S, Guo T, Zhao W, et al. Fat suppression for ultrashort echo time imaging using a single-point dixon method. NMR Biomed. (2019) 32(5):e4069. doi: 10.1002/nbm.4069
105. Shapiro EM, Borthakur A, Gougoutas A, Reddy R. 23Na MRI accurately measures fixed charge density in articular cartilage. Magn Reson Med. (2002) 47(2):284–91. doi: 10.1002/mrm.10054
106. Benazzo F, Stennardo G, Valli M. Achilles and patellar tendinopathies in athletes: pathogenesis and surgical treatment. Bull Hosp Jt Dis. (1996) 54(4):236–40.8731417
107. Kamp B, Frenken M, Klein-Schmeink L, Nagel AM, Wilms LM, Radke KL, et al. Evaluation of sodium relaxation times and concentrations in the achilles tendon using MRI. Int J Mol Sci. (2022) 23(18):10890. doi: 10.3390/ijms231810890
108. Juras V, Zbýn S, Pressl C, Domayer SE, Hofstaetter JG, Mayerhoefer ME, et al. Sodium MR imaging of achilles tendinopathy at 7T: preliminary results. Radiology. (2012) 262(1):199–205. doi: 10.1148/radiol.11110897
109. Athertya JS, Ma Y, Masoud Afsahi A, Lombardi AF, Moazamian D, Jerban S, et al. Accelerated quantitative 3D UTE-cones imaging using compressed sensing. Sensors. (2022) 22(19):7459. doi: 10.3390/s22197459
Keywords: tendon, quantitative imaging, MRI, ultrashort echo time, UTE
Citation: Malhi BS, Jang H, Malhi MS, Berry DB and Jerban S (2024) Tendon evaluation with ultrashort echo time (UTE) MRI: a systematic review. Front. Musculoskelet. Disord. 2:1324050. doi: 10.3389/fmscd.2024.1324050
Received: 18 October 2023; Accepted: 26 February 2024;
Published: 15 March 2024.
Edited by:
Florian Wiesinger, GE Global Research, GermanyReviewed by:
António Proença Caetano, NOVA University of Lisbon, PortugalŁukasz A. Poniatowski, Medical University of Warsaw, Poland
Laura Carretero, GE Healthcare, Germany
© 2024 Malhi, Jang, Malhi, Berry and Jerban. This is an open-access article distributed under the terms of the Creative Commons Attribution License (CC BY). The use, distribution or reproduction in other forums is permitted, provided the original author(s) and the copyright owner(s) are credited and that the original publication in this journal is cited, in accordance with accepted academic practice. No use, distribution or reproduction is permitted which does not comply with these terms.
*Correspondence: Bhavsimran Singh Malhi Ym1hbGhpQGhlYWx0aC51Y3NkLmVkdQ== Saeed Jerban c2plcmJhbkBoZWFsdGgudWNzZC5lZHU=