 Yufan Chen
 Zhiwei Wang1
- 1Department of Orthopedics, Fuzhou Second General Hospital, Fujian Provincial Clinical Medical Research Center for Trauma Orthopedics Emergency and Rehabilitation, Fuzhou, China
- 2Department of Computing, Hong Kong Polytechnic University, Hong Kong SAR, China
Objective: This study aims to analyze the global disease burden of knee osteoarthritis (KOA) among middle-aged and elderly populations (aged ≥45 years) from 1990 to 2021, project trends to 2035, and evaluate disparities across sociodemographic index (SDI) regions, age groups, and genders.
Methods: Data from GBD 2021 assessed KOA prevalence, incidence, years lived with disability (YLDs), and age-standardized rates (ASRs) across 204 countries (1990–2021). Age-period-cohort (APC) modeling to disentangle age/time/cohort effects. Joinpoint regression to quantify temporal trends (annual percent change, APC; average APC, AAPC). Bayesian forecasting for 2035 projections. Socioeconomic disparities assessed via slope index (SII) and concentration index (CI).
Results: From 1990 to 2021, global KOA incidence and prevalence increased by 1.3-fold [age-standardized incidence rate (ASIR): +7.3%, from 978.74 to 1,050.31/100,000] and 1.4-fold [age-standardized prevalence rate (ASPR): +8.4%, from 13,596.63 to 14,741.08/100,000], respectively. Females exhibited higher burdens than males [ASPR: +8.4%; age-standardized years lived with disability rate (ASYR): +8.3%]. High SDI regions reported the highest ASIR (1,162.95/100,000) and ASPR (16,029.60/100,000), whereas low SDI regions had the lowest rates (ASPR: 12,150.70/100,000). By 2035, global prevalence is projected to reach 482 million, with ASPR rising to 15,058.08/100,000. It is estimated that there will be 34,372,090 incidence cases globally, and YLDs are expected to reach 15,386,065 years by 2035.
Conclusion: The prevalence, incidence, YLDs, and ASRs of KOA have increased substantially in most countries and regions from 1990 to 2021. The burden of KOA appears to rise with increasing SDI and is higher in females than in males. Population aging has exacerbated the burden of KOA, whereas transnational inequalities have not improved significantly. Gender-specific interventions, SDI-tailored policies, and strengthened healthcare systems are essential to address this increasing public health challenge.
Introduction
Knee osteoarthritis (KOA) has emerged as a leading cause of disability worldwide, particularly among aging populations, with profound implications for healthcare systems and socioeconomic development. Globally, over 650 million individuals are affected by osteoarthritis, with KOA accounting for nearly 80% of this burden, disproportionately impacting middle-aged and elderly populations (1). The aging global population, coupled with rising obesity rates and sedentary lifestyles, has intensified the disease's prevalence. However, comprehensive analyses of its evolving epidemiology across socioeconomic strata remain limited. Although prior studies have documented national or regional trends (2, 3), systematic evaluations of age-sex disparities, sociodemographic gradients, and predictive trajectories are critically lacking—gaps that this study aims to address by leveraging the Global Burden of Disease (GBD) 2021 dataset. Prior epidemiological studies encompassing broad age ranges, though valuable for characterizing population-level trends, often lacked sufficient granularity to delineate age-specific burden patterns in older cohorts. For instance, several large-scale analyses (4–8) aggregated incidence and prevalence metrics across wide age spans (e.g., 1–95+ years), masking critical inflection points in disease progression unique to aging populations. The latest KOA disease burden study (8) reported peak incidence in the 55–59 age group and the highest case numbers in the 65–69 cohort. However, its lack of granular stratification for the critical 45–65 age window (a pivotal period for OA progression) obscured disability acceleration patterns during the middle-to-older-age transition. Another study (4) grouped 45–59 and 60–69 as a single “middle-aged” category, potentially diluting distinctions between 45 and 54 (a window for early intervention) and ≥55 (a high-risk progression phase). This methodological approach inadvertently diluted outcome statistics for middle-aged and elderly subgroups by: (1) Failing to stratify by narrow, clinically relevant age bands, thereby obscuring accelerating disability trends in later decades of life; (2) Overlooking cohort effects (e.g., birth-year-specific risk exposures) through period-centric models; (3) Underpowering socioeconomic disparity analyses within aging strata due to heterogeneous sampling. By focusing exclusively on adults aged ≥45 years, our study overcomes these limitations to uncover nuanced age-period-cohort dynamics and socioeconomic gradients—constituting a core methodological advance of this research.
The pathogenesis of KOA involves a complex interplay of biomechanical stress, genetic predisposition, and inflammatory pathways (6), with aging and female sex recognized as key risk factors (9–12). Recent advances in joint imaging and biomarker research have refined diagnostic criteria (13–15), but population-level trends remain understudied in low-resource settings. Furthermore, although the socioeconomic development index (SDI) has been associated with patterns of non-communicable diseases, its role in shaping KOA disparities—particularly among aging populations—remains poorly characterized (7, 16–19). This study aims to: quantify global and regional trends in KOA burden among middle-aged and elderly populations (1990–2021); decipher age-sex-specific epidemiological patterns; evaluate sociodemographic inequalities across SDI gradients; and forecast disease trajectories to 2035 to inform evidence-based policymaking.
By integrating age-period-cohort modeling and Bayesian forecasting, this analysis provides actionable insights for tailoring prevention strategies and optimizing resource allocation in an era of rapid demographic transition.
Methods
Data sources
The GBD 2021 study is a comprehensive, collaborative initiative designed to quantify health loss attributable to 371 diseases and injuries and 88 risk factors across 204 countries and territories from 1990 to 2021 (20, 21). The GBD 2021 study integrates diverse data sources, each assigned a unique identifier and cataloged in the Global Health Data Exchange (GHDx). To address data gaps, spatiotemporal Gaussian process regression was employed to smooth estimates across age, time, and geographic locations. Additionally, the Meta-Regression with Bayesian Priors, Regularization, and Trimming (MR-BRT) tool was used to adjust for data biases arising from variations in case definitions and study methodologies across countries. The GBD 2021 dataset is stratified by sex, age, region, and country and incorporates data from multiple sources, including vital registration systems, verbal autopsies, censuses, household surveys, disease-specific registries, health service contact data, and others. In this study, we extracted estimates and their 95% uncertainty intervals (UIs) for the incidence, prevalence, and years lived with disability (YLDs) of KOA from the GBD 2021 dataset. All rates are reported per 100,000 population (2).
Study population
Based on the age classification defined by the World Health Organization (WHO), middle-aged and elderly populations were defined as individuals aged 45 years and above. Participants were further stratified into the following age groups: middle-aged (45–59 years), young-old (60–74 years), old-age (75–89 years), and longevity or very old (≥90 years) (World Health Organization, 2011; available at: https://www.who.int/ageing/publications/global_health.pdf). To examine sex-specific differences in health outcomes, we constructed two-coordinate charts to compare the prevalence, incidence, and YLDs rates between males and females across these age groups.
Case definition
In the GBD 2021 study, KOA was defined as symptomatic osteoarthritis of the knee joint, confirmed radiologically as Kellgren-Lawrence (KL) grade II–IV (16). The diagnostic criteria for each grade are as follows: (1) Grade II: presence of at least one definite osteophyte in the knee joint, accompanied by pain for ≥1 month within the past 12 months; (2) Grade III–IV: presence of osteophytes and joint space narrowing in the affected knee joint; (3) Grade IV is characterized by joint deformity. Pain for ≥1 month within the past 12 months is required for both grades (4, 5, 22). The International Classification of Diseases, Tenth Revision (ICD-10) code for KOA is M17. For the Ninth Revision (ICD-9), osteoarthritis is coded as 715, which does not specify distinct anatomical sites (World Health Organization, 2019; available at: https://icd.who.int/browse10/2019/en#/M17). The KL grading system is mandated by GBD 2021 for radiographic KOA confirmation, ensuring global comparability (GBD 2021 Methods, Supplementary Material) (4, 7).
Ethical considerations
The use of de-identified data in the GBD study was granted a waiver of informed consent by the Institutional Review Board (IRB) of the University of Washington.
SDI and epidemiological indicators
The SDI is a composite measure that reflects the overall development status of a geographic region based on three key dimensions: income per capita, educational attainment, and fertility rate. SDI values range from 0 to 1, with higher values indicating greater socioeconomic development (Supplementary Table S1). In this study, countries and regions were classified into five SDI categories (low, low-middle, middle, high-middle, and high) to examine the association between the burden of KOA among middle-aged and elderly populations and socioeconomic development. The burden of KOA was quantified using YLDs. Age-standardized rates (ASR, per 100,000 population per year) were calculated using the world standard population from GBD 2021 to enable equitable comparisons across populations with varying age structures. This approach follows established WHO and GBD methodological frameworks, minimizing confounding from demographic differences and ensuring global comparability of burden metrics. To enable equitable comparisons across populations with differing age structures, we calculated the following ASR: age-standardized incidence rate (ASIR); age-standardized prevalence rate (ASPR); and age-standardized YLDs rate (ASYR) (16). These metrics were analyzed across 21 GBD regions and 204 countries and territories for middle-aged and elderly populations. The ASR was calculated using the following formula:
(: the age-specific rate in ith the age group; : the number of people in the corresponding ith age group among the standard population; : the number of age groups).
Age-period-cohort analysis
The APC analytical paradigm has been extensively validated for investigating temporal disease dynamics in population health research. As a multivariate decomposition method, it systematically partitions variance in disease occurrence into three orthogonal temporal dimensions: (1) age effects (reflecting biological aging processes), (2) period effects (capturing contemporaneous environmental influences), and (3) cohort effects (representing generation-specific risk exposures). This analytical rigor not only yields unbiased effect estimates for each temporal component but also permits comprehensive examination of long-term disease trends while controlling for confounding between temporal dimensions (17). Temporal changes in the prevalence of KOA among middle-aged and elderly populations (aged >45 years) from 1990 to 2021 were evaluated. The analysis assessed the independent effects of age, period, and cohort on KOA prevalence. Model fitting was performed using the Epi package in R, with model comparisons based on the Akaike information criterion (AIC) and Bayesian information criterion (BIC). The age distribution of prevalence reflects temporal changes in the relative proportions of KOA prevalence across different age groups from 1990 to 2021. Furthermore, the data were re-coded into consecutive 5-year age groups (45–49, 50–54, …, 90–94, 95+ years), consecutive 5-year periods from 1990 to 2021 (1990–1994, 1995–1999, …, 2015–2019, 2020–2021), and corresponding 5-year birth cohorts (1897–1901, 1902–1906, …, 1963–1967, 1968–1972) to estimate the net age, period, and birth cohort effects on KOA prevalence (23, 24). Local drift quantifies the annual percentage change (APC) in prevalence for each age group during this period. The age effect is represented by the fitted longitudinal age-specific prevalence, adjusted for period bias, across a defined range of birth cohorts. The period effect is illustrated by the period relative risk (RRs, prevalence ratio). The birth cohort effect is indicated by the cohort RRs (prevalence ratio), calculated as the ratio of age-specific prevalence between the 1897 cohort and the 1972 cohort. Results are presented as points (representing prevalence or ratios) and shaded areas (representing the corresponding 95% confidence intervals).
Cross-country inequality analysis
Health inequality monitoring serves as a critical foundation for evidence-based health planning, enabling the refinement of policies, programs, and practices to reduce disparities in health outcomes. In this study, we employed two standard metrics to assess absolute and relative gradient inequality in the burden of KOA among middle-aged and elderly populations across countries: the slope index of inequality (SII) and the concentration index (CI). The SII was calculated by regressing national YLDs rates across all age groups against a relative position scale associated with sociodemographic development. The CI was derived by numerically integrating the area under the Lorenz concentration curve, which was constructed by plotting the cumulative fraction of YLDs against the cumulative relative distribution of the population, ranked by the SDI (24).
Predictive analysis
The Bayesian Age-Period-Cohort (BAPC) model was applied to project future trends in the ASIR and incidence numbers, ASPR and death counts, as well as the ASYR and YLDs for KOA from 2022 to 2035. The model was developed using historical data up to 2021, capturing the underlying patterns and dynamics of disease burden indicators over time by considering the influences of age, period, and birth cohort. BAPC models offer a comprehensive framework for projections through integrated nested Laplace approximations (INLA) for complete Bayesian inference. Key features of BAPC models include: (1) generation of age-specific and age-standardized projected rates; and (2) automatic incorporation of Poisson noise when the focus is on the predictive distribution. BAPC is particularly beneficial for forecasting future rates based on historical data, rendering it an invaluable tool for public health planning and analysis (25). This approach enabled us to expect the evolving epidemiological landscape of KOA among middle-aged and elderly populations.
Statistical analysis
Statistical analyses were conducted using R software (Version 4.4.2). The ASIR, ASPR, and ASYR, along with their corresponding 95% CIs, were calculated for the period from 1990 to 2021 using the GBD 2021 dataset. The world standard population, obtained from the GBD 2021 analytical tool website, was used for age standardization (2). Temporal trends in the burden of KOA were analyzed using the Joinpoint regression model (Version 5.3.0.0). This model was employed to estimate the APC and average annual percentage change (AAPC), which quantify the magnitude and direction of trends over time. An AAPC > 0 indicates an increasing trend in ASRs during the study period, whereas an AAPC < 0 suggests a decreasing trend. All rates are reported per 100,000 population. Data visualization was performed using the “ggplot2” package in R and JD_GBDR (Version 2.36). A p-value < 0.05 was considered statistically significant.
Result
Global disease burden of KOA among middle-aged and elderly populations
In 2021, the global incidence of KOA among middle-aged and elderly populations increased approximately 1.3-fold compared with 1990. The global ASIR was 1,050.31 per 100,000 (95% UI, 760.82–1,408.44), an increase of 7.3% from 978.74 per 100,000 (95% UI, 709.17–1,315.98) in 1990 (Table 1). Additionally, the number of prevalent cases increased by about 1.4-fold compared with 1990. The ASPR was 14,741.08 per 100,000 (95% UI, 12,121.92–17,680.86), reflecting an increase of 8.4% from 13,596.63 per 100,000 (95% UI, 11,172.61–16,355.69) in 1990. YLDs also increased by approximately 1.4-fold compared with 1990, and the ASYR increased by 8.3%. The ASRs of prevalence, incidence, and YLDs were highest in high SDI regions and lowest in low SDI regions (Table 2).
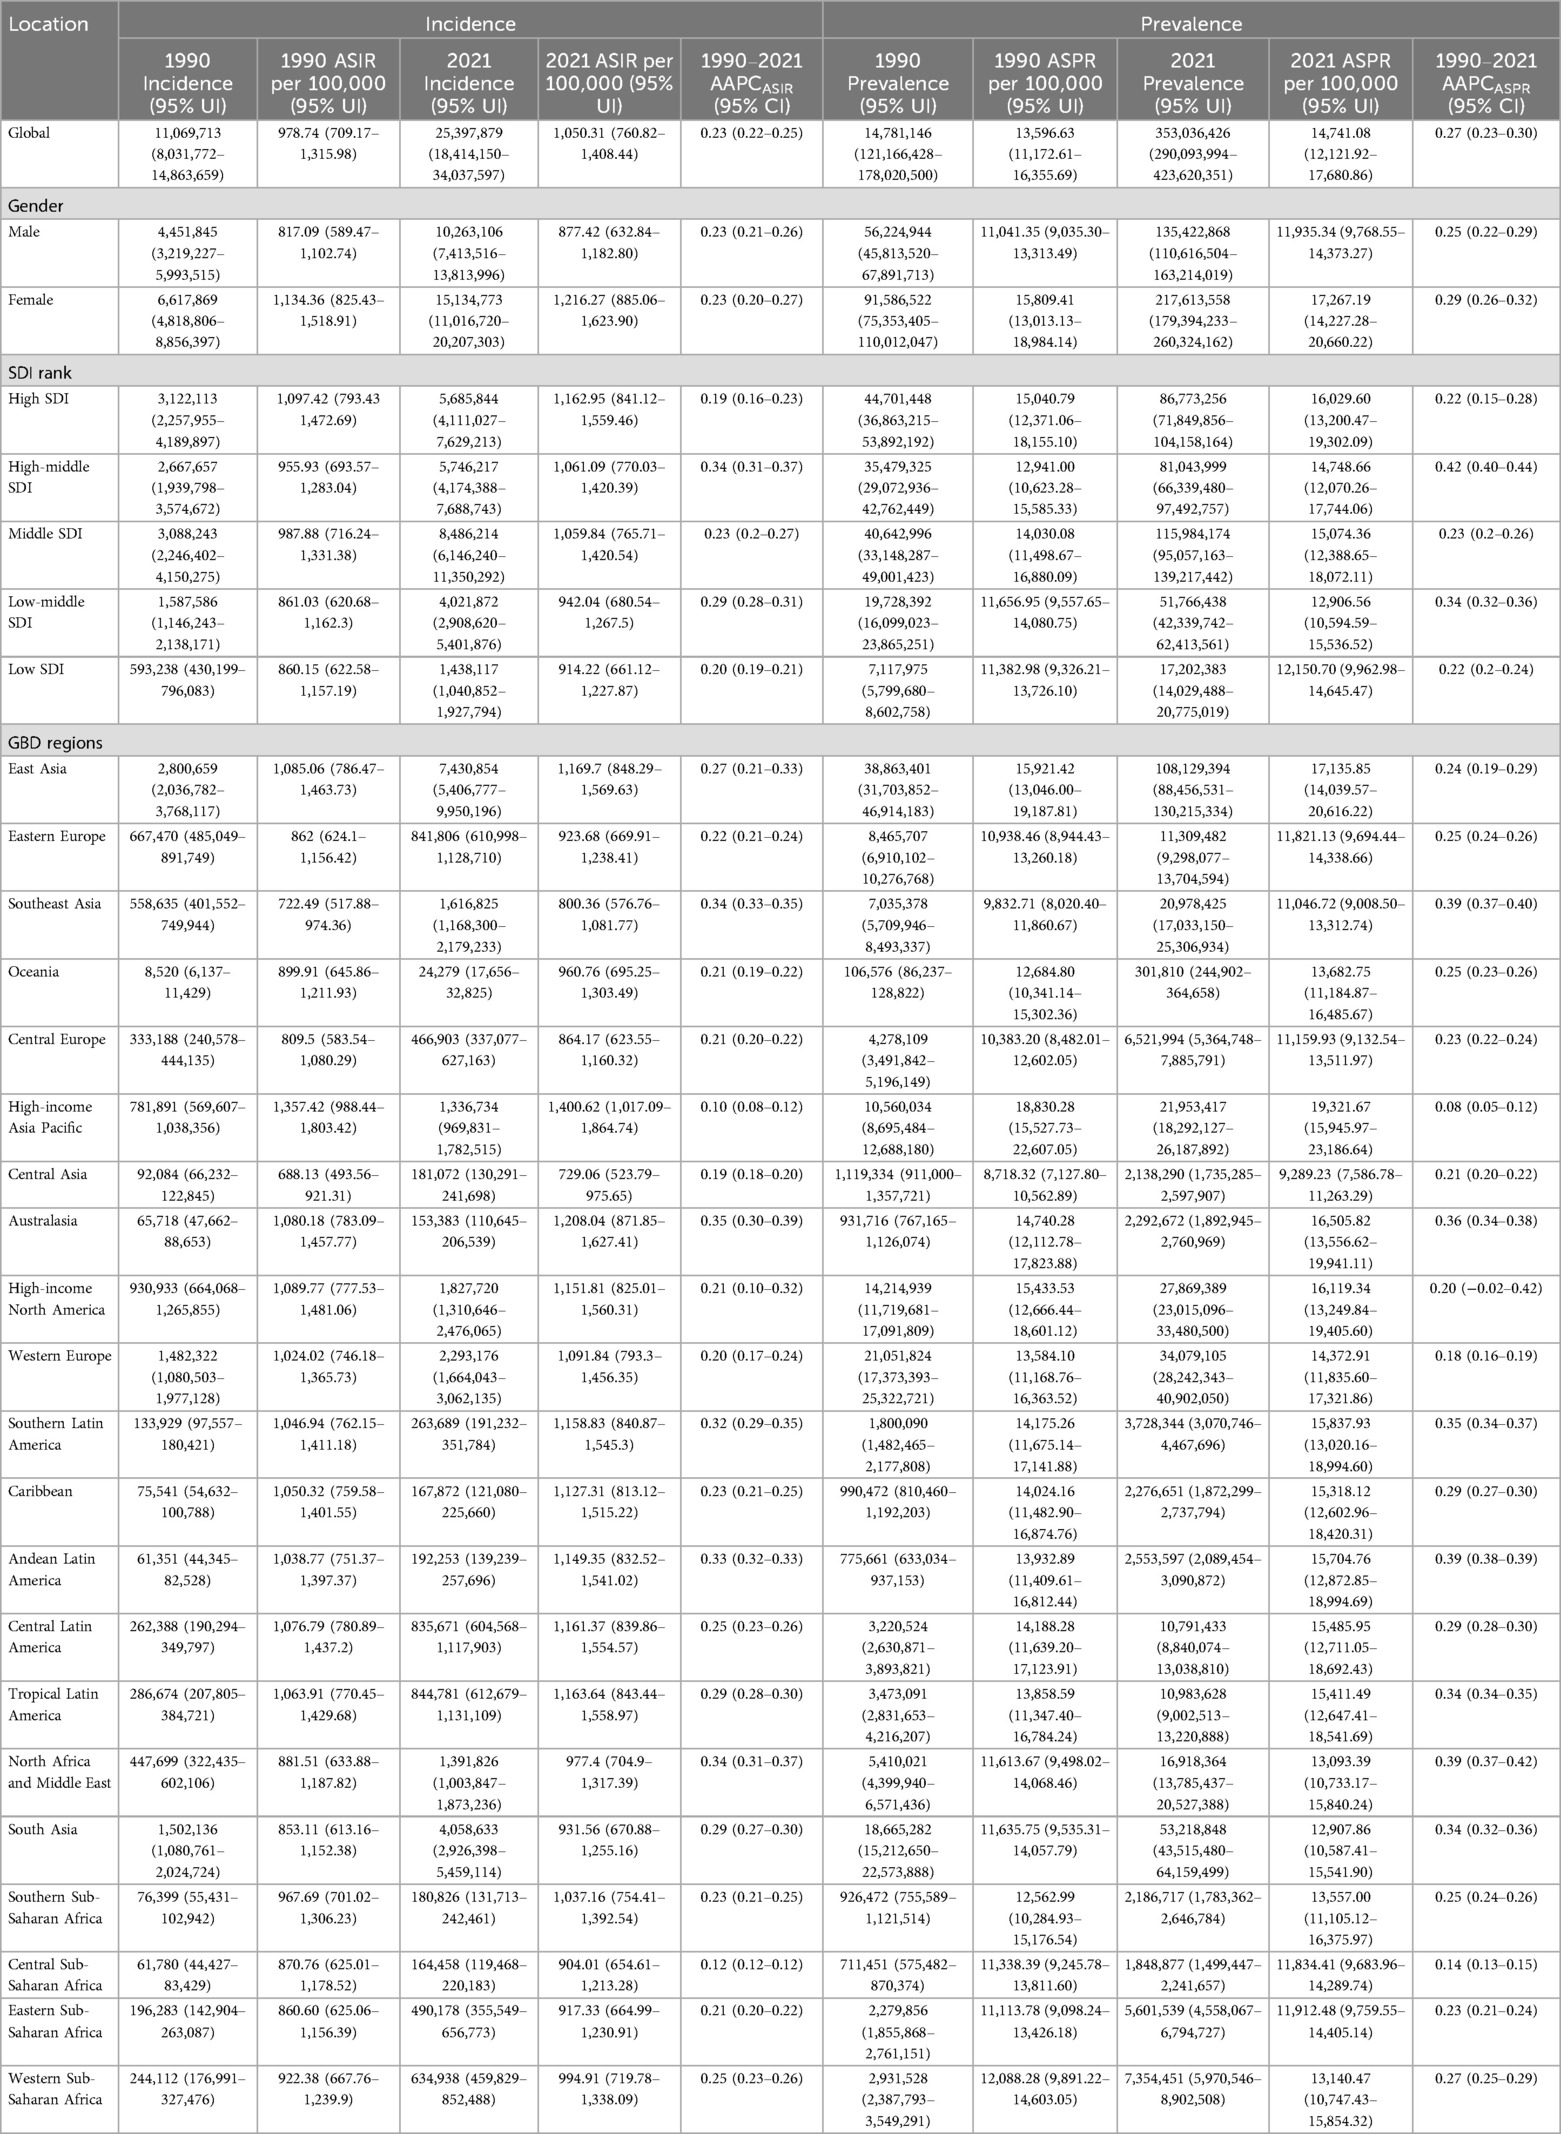
Table 1. Global incidence and prevalence of KOA among middle-aged and elderly populations and their AAPC by gender, SDI and region.
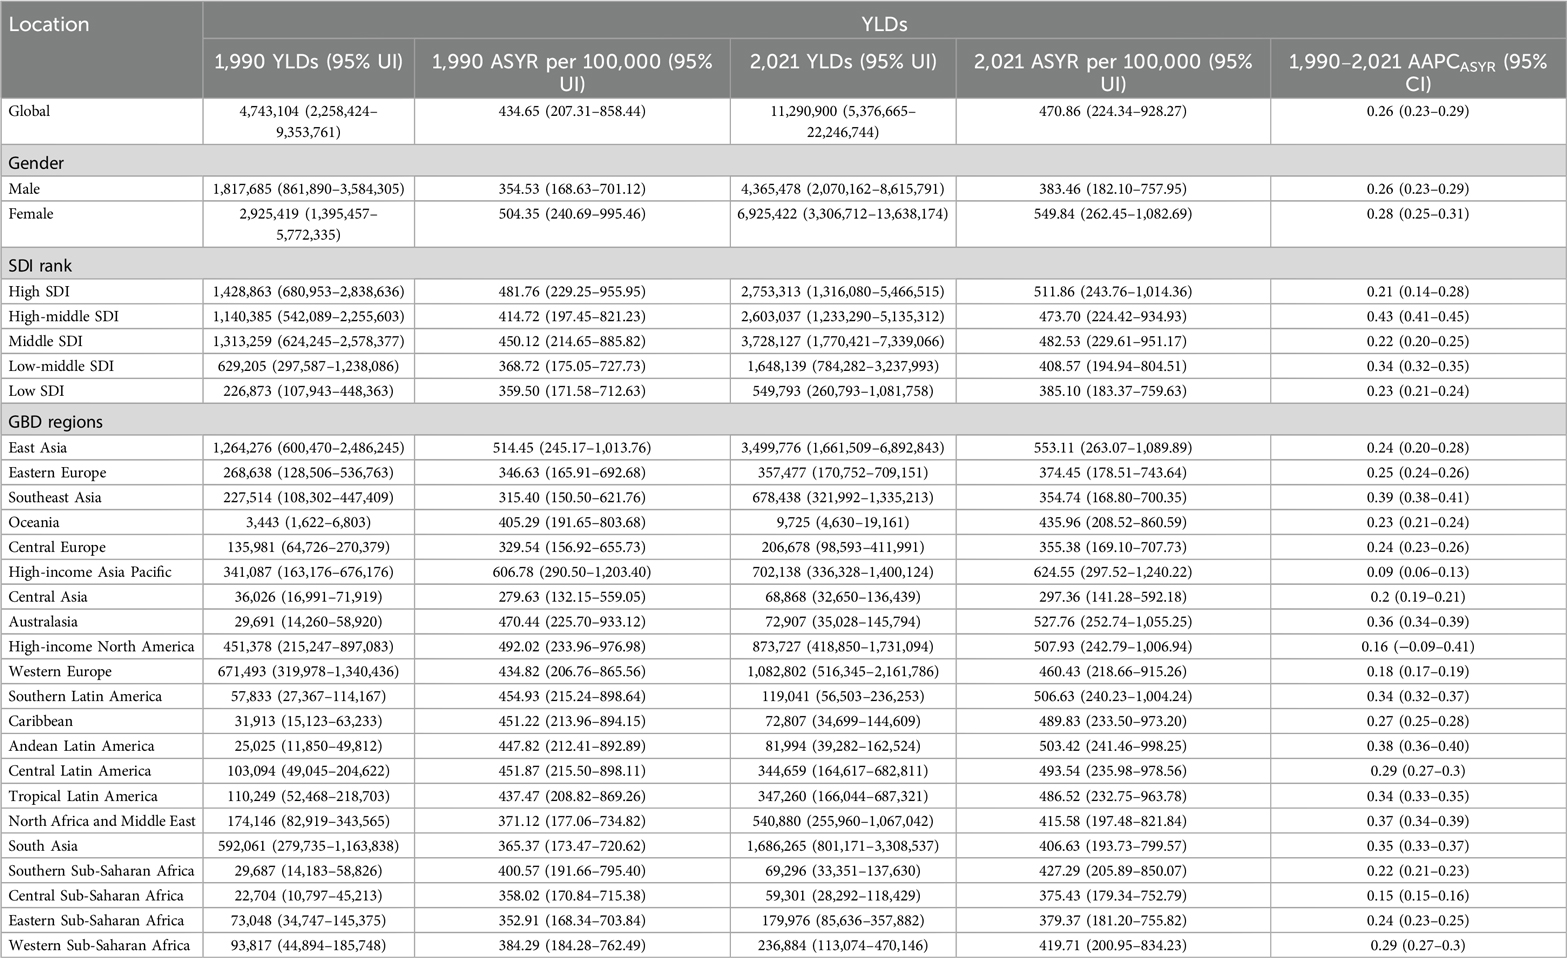
Table 2. Global YLDs of KOA among middle-aged and elderly populations and their AAPC by gender, SDI, and region.
Among the 21 regions, the top three regions in terms of prevalence, incidence, and YLDs were East Asia, South Asia, and Western Europe (Tables 1, 2). The highest ASRs for prevalence, incidence, and YLDs were observed in High-income Asia Pacific (ASIR: 1,400.62, 95% UI: 1,017.09–1,864.74; ASPR: 19,321.67, 95% UI: 15,945.97–23,186.64; ASYR: 624.55, 95% UI: 297.52–1,240.22), and the lowest in Central Asia (ASIR: 729.06, 95% UI: 523.79–975.65; ASPR: 9,289.23, 95% UI: 7,586.78–11,263.29; ASYR: 297.36, 95% UI: 141.28–592.18).
In 2021, among the 204 countries, China had the highest number of prevalence, incidence, and YLDs, whereas Tokelau had the lowest number. The ASPR ranged from 8,336.68 per 100,000 to 21,432.96 per 100,000, the ASIR ranged from 666.11 per 100,000 to 1,481.88 per 100,000, and the ASYR ranged from 268.02 per 100,000 to 688.99 per 100,000 (Figure 1). The lowest rates were observed in Tajikistan and the highest in the Republic of Korea among middle-aged and elderly populations (Supplementary Table S2).
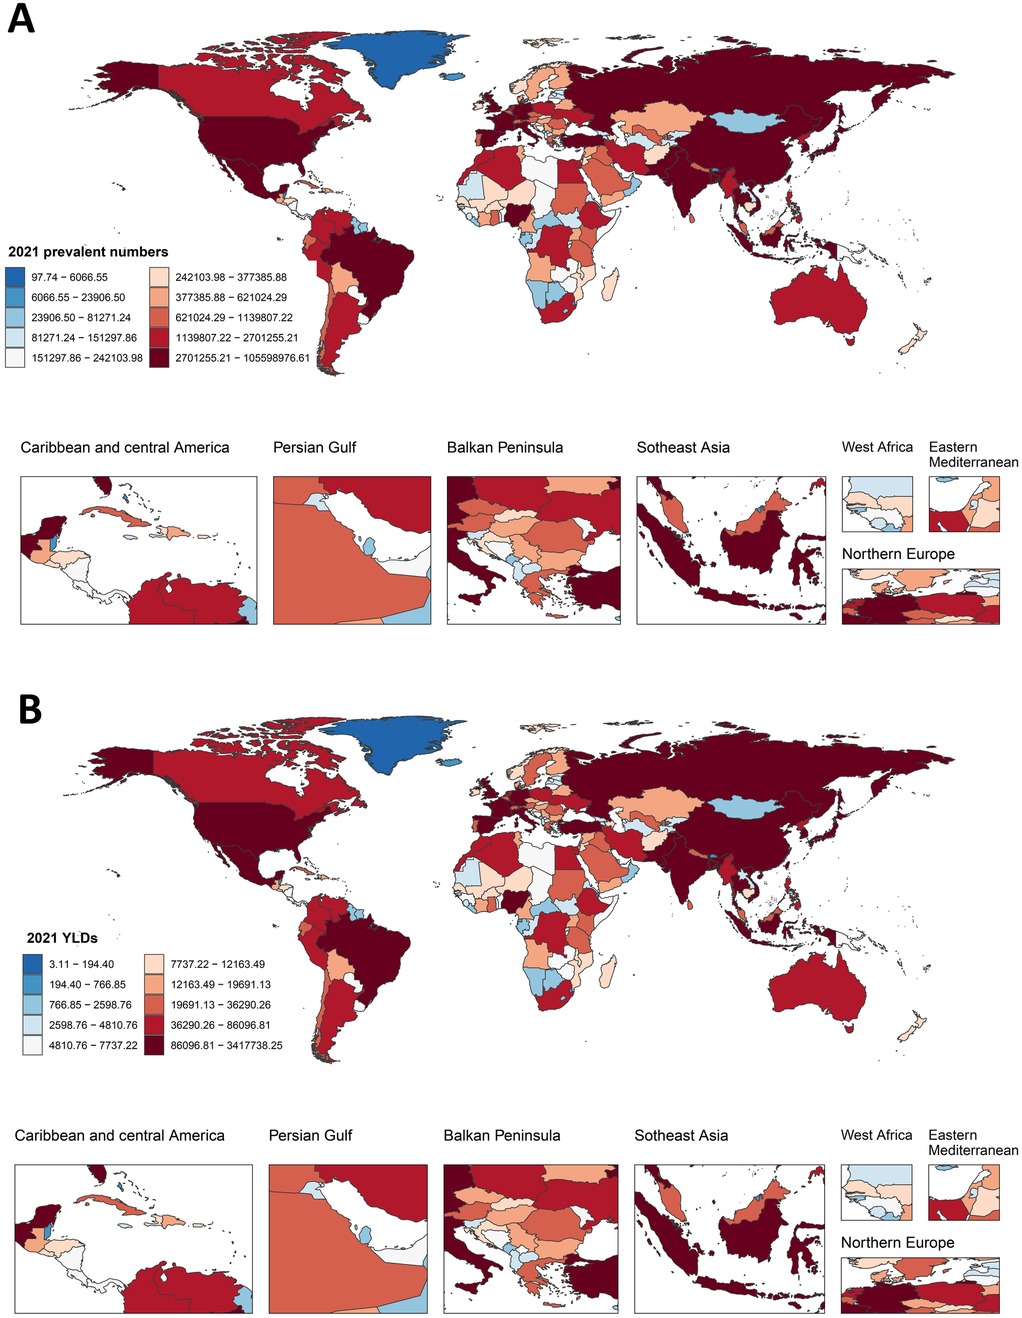
Figure 1. Global distribution of prevalence and YLDs for KOA among middle-aged and elderly populations. (A) The cases of prevalence in 2021; (B) YLDs of KOA among middle-aged and elderly populations in 2021.
AAPC of KOA among middle-aged and elderly populations at the global, regional, and nation level
From 1990 to 2021, the global burden of KOA among middle-aged and elderly populations showed an upward trend, particularly in ASPR, which increased the most, with an AAPC of 0.27 (95% CI, 0.23–0.30). The burden of disease has significantly increased over the past three decades for both males and females, with the overall burden being higher for females than males. The upward trend in ASPR and ASYR was more pronounced for females. Interestingly, the upward trend in incidence slowed after 2005, even declining briefly, particularly among men, but resumed from 2010 onwards (Figure 2). The KOA burden increased in all five SDI regions, with the highest increase observed in the high-middle SDI region. Similarly, the KOA burden increased across all 21 GBD regions, with Australasia showing the fastest growth in ASIR (AAPC: 0.35, 95% CI: 0.30–0.39), Southeast Asia showing the fastest growth in ASYR (AAPC: 0.39, 95% CI: 0.38–0.41) and Southeast Asia (AAPC: 0.39, 95% CI: 0.37–0.40), Andean Latin America (AAPC: 0.39, 95% CI: 0.38–0.39), North Africa, and the Middle East (AAPC: 0.39, 95% CI: 0.37–0.42) showing the fastest growth in ASPR (Tables 1, 2). Among the 204 countries and territories, the KOA burden increased year by year, with Oman (AAPCASIR: 0.53; AAPCASPR: 0.63; AAPCASYR: 0.63), Equatorial Guinea (AAPCASIR: 0.49; AAPCASPR: 0.58; AAPCASYR: 0.60) and Thailand (AAPCASIR: 0.49; AAPCASPR: 0.55; AAPCASYR: 0.56) showing the largest increase in disease burden. Republic of Korea (AAPCASIR: 0.05; AAPCASPR: 0.02; AAPCASYR: 0.03), Japan (AAPCASIR: 0.06; AAPCASPR: 0.02; AAPCASYR: 0.04) and Burundi (AAPCASIR: 0.05; AAPCASPR: 0.05; AAPCASYR: 0.06) exhibited the slowest growth trends over the past three decades (Supplementary Table S3).
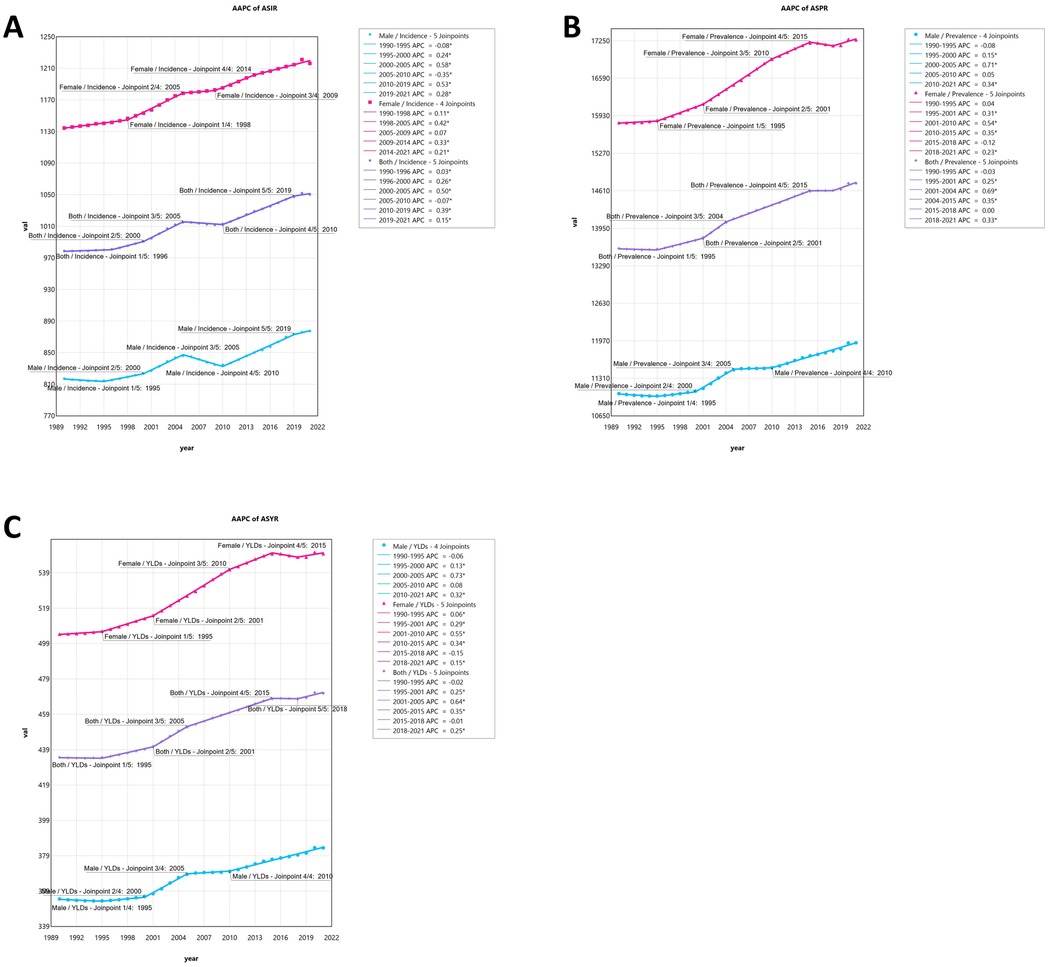
Figure 2. (A) The joinpoint regression analysis on the ASR of incidence; (B) the joinpoint regression analysis on the ASR of prevalence; (C) the joinpoint regression analysis on the ASR of YLDs; of KOA globally.
Age and sex composition of KOA burden among middle-aged and elderly populations
In 2021, globally, the incidence of KOA peaked in the 50–54 age group for both men and women. The number of prevalent cases and YLDs peaked in the 55–59 age group for both genders. As age advanced, the ASPR for both men and women increased steadily until reaching a peak in the 80–84 age group. The ASIR for females and males both peaked in the 50–54 and 60–64 age groups, respectively, before showing a declining trend. The ASYR for both females and males peaked in the 80–84 age group, followed by a downward trend. Among middle-aged and elderly populations in 2021, the ASPR and ASYR for females were higher than those for males. Among individuals aged 85 years and older, the ASIR for males began to exceed that of females (Supplementary Table S4; Figure 3).
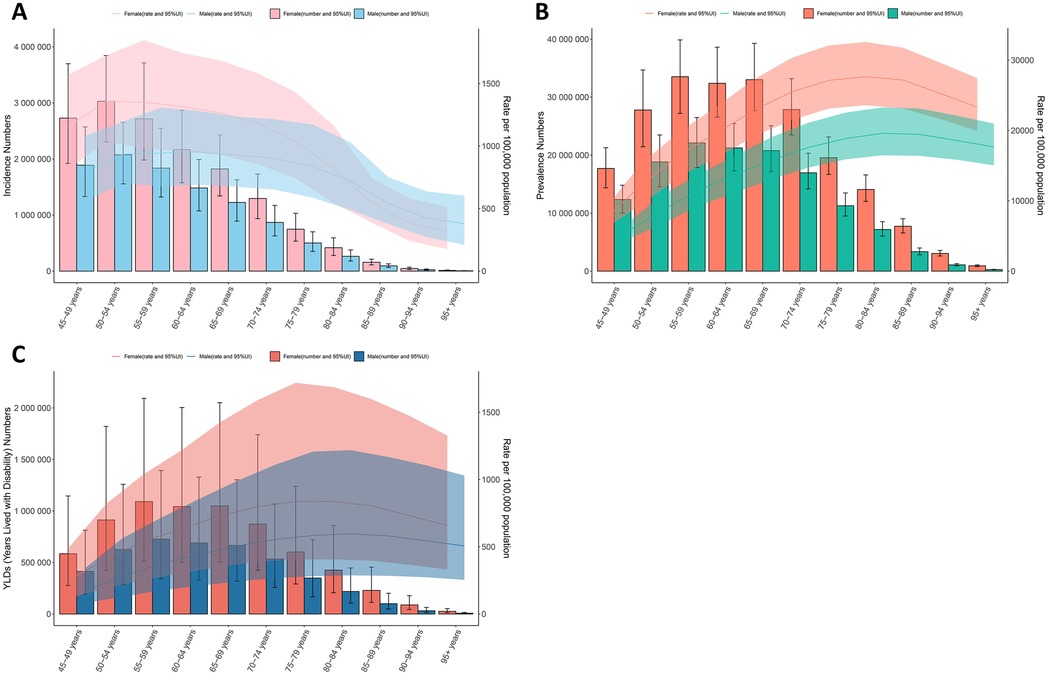
Figure 3. Global number of incident and prevalent cases, YLDs, and estimates per 100,000 population of KOA by age and sex in 2021, with 95% UI. (A) Incidence in 2021; (B) Prevalence in 2021; (C) YLDs in 2021.
Global trends by SDI
Considering various SDI factors, the incidence, prevalence, and YLDs rates of KOA among middle-aged and elderly populations have significantly increased across regions with varying SDI levels over the past three decades. Regions with high SDI exhibited significantly higher values in each index compared to regions with low SDI, with this trend gradually increasing over time. Similar patterns were observed across other SDI groups (Figure 4A). In 2021, there was a positive association between ASIR, ASPR, ASYR, and SDI in most GBD countries and regions, with values increasing as SDI increased. Globally, the index showed a consistent upward trend from 1990 to 2021, with a temporary decline around 2000 in high SDI regions. Regions with high SDI, especially those with an SDI greater than 0.7, such as high-income Asia Pacific and Australasia, consistently reported ASYR higher than the global average. In contrast, Central Asia, Southeast Asia, and Central Sub-Saharan Africa demonstrated slightly lower ASYR (Figure 4B).
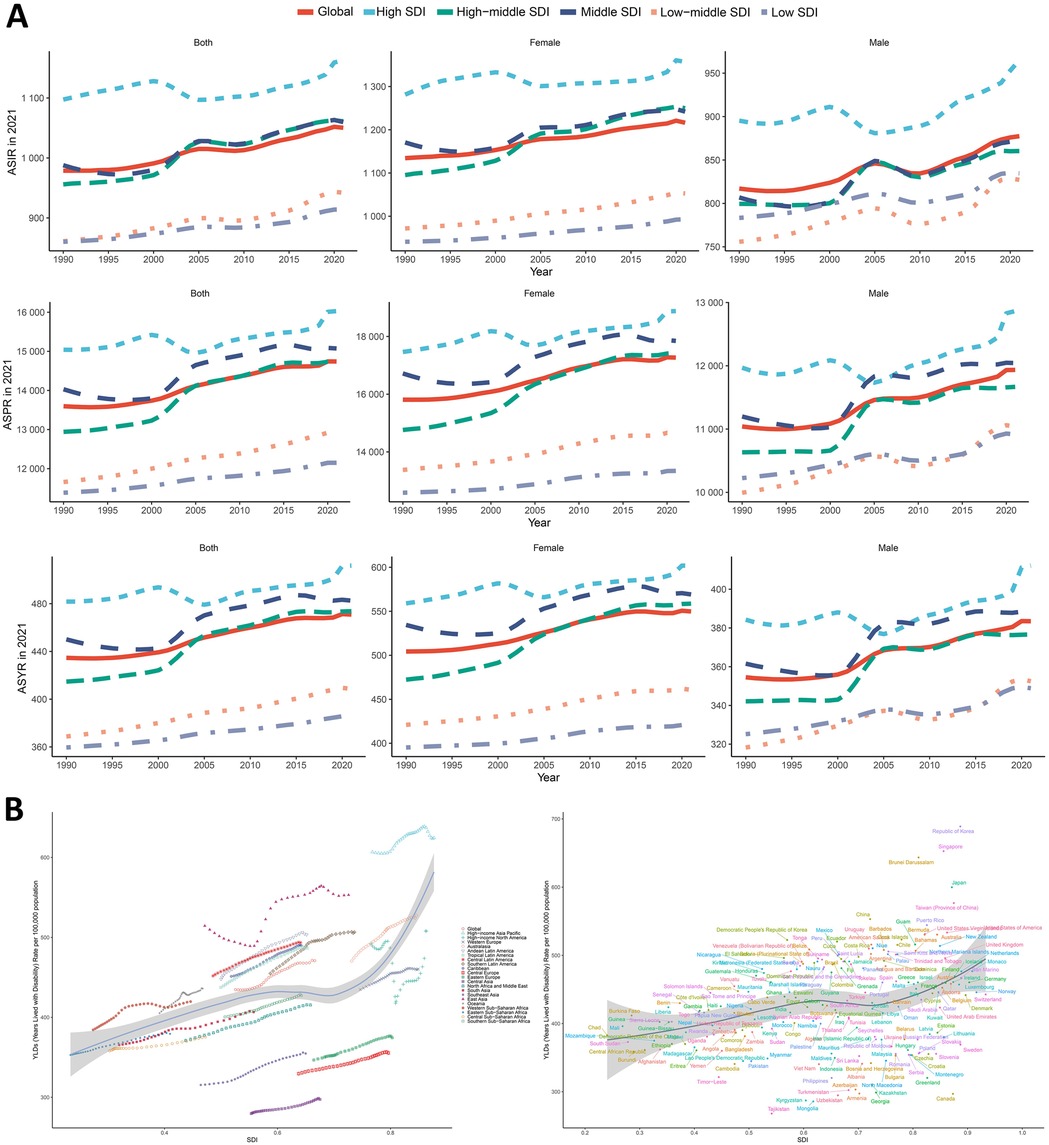
Figure 4. Global trends by SDI. (A) Gender and SDI-specific trends in age-standardized incidence, prevalence, and YLDs of KOA among middle-aged and elderly populations. (B) The trend in age-standardized YLDs and socio-demographic index associated with KOA among middle-aged and elderly populations in 21 GBD regions and 204 countries and territories, 1990–2021.
To better describe the prevalence of KOA among middle-aged and elderly populations globally and across the five SDI regions, we evaluated the corresponding age, period, and birth cohort effects. A significant increase in ASPR was observed with advancing age, peaking in the 80–89 age group, followed by a slight decline. Notable variations in ASPR were identified across different birth cohorts, with more recent cohorts exhibiting higher prevalence rates. The net drift indicated an overall increase in KOA prevalence over time, with local drifts showing varying trends across different age groups. Longitudinal analysis of KOA prevalence trends revealed age-dependent patterns across middle-aged and elderly populations. Globally, the net drift in KOA prevalence from 1990 to 2021 indicated a modest annualized increase of 0.30% (95% UI: 0.24%–0.36%), with localized drift in prevalence showing a mildly decreasing trend until age 80 years, then turning to an increasing trend thereafter. Interestingly, in middle SDI, low-middle SDI, and low SDI regions, the localized drift values remained relatively stable across middle-aged and elderly populations. The age effects graph confirmed a significant rise in prevalence with age, though a slight decline after age 85 was observed. There was an overall upward trend in the period effect of KOA prevalence, with RR values increasing from 0.96 to 1.03. In high SDI regions, however, the trend of RR value changes showed an N-shaped fluctuation, which differed from the trends observed in other SDI regions. Cohort effects on the risk of KOA showed an overall slow, monotonically increasing trend, with RR values rising from 0.89 in the 1897 birth cohort to 1.15 in the 1972 birth cohort, a trend consistent across all five SDI regions (Table 3 and Supplementary Table S5; Figure 5).
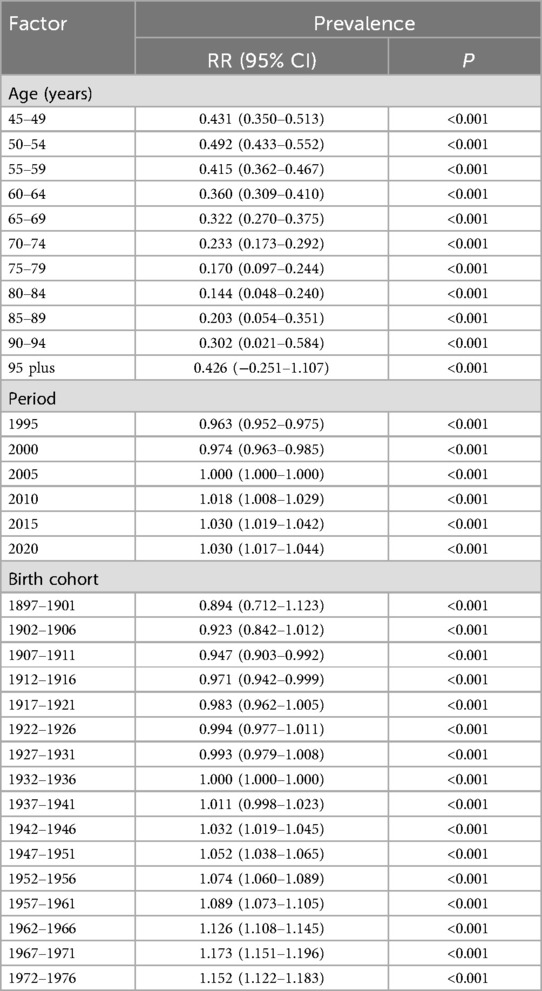
Table 3. RRs of KOA prevalence for both sexes due to age, period, and birth cohort effects.
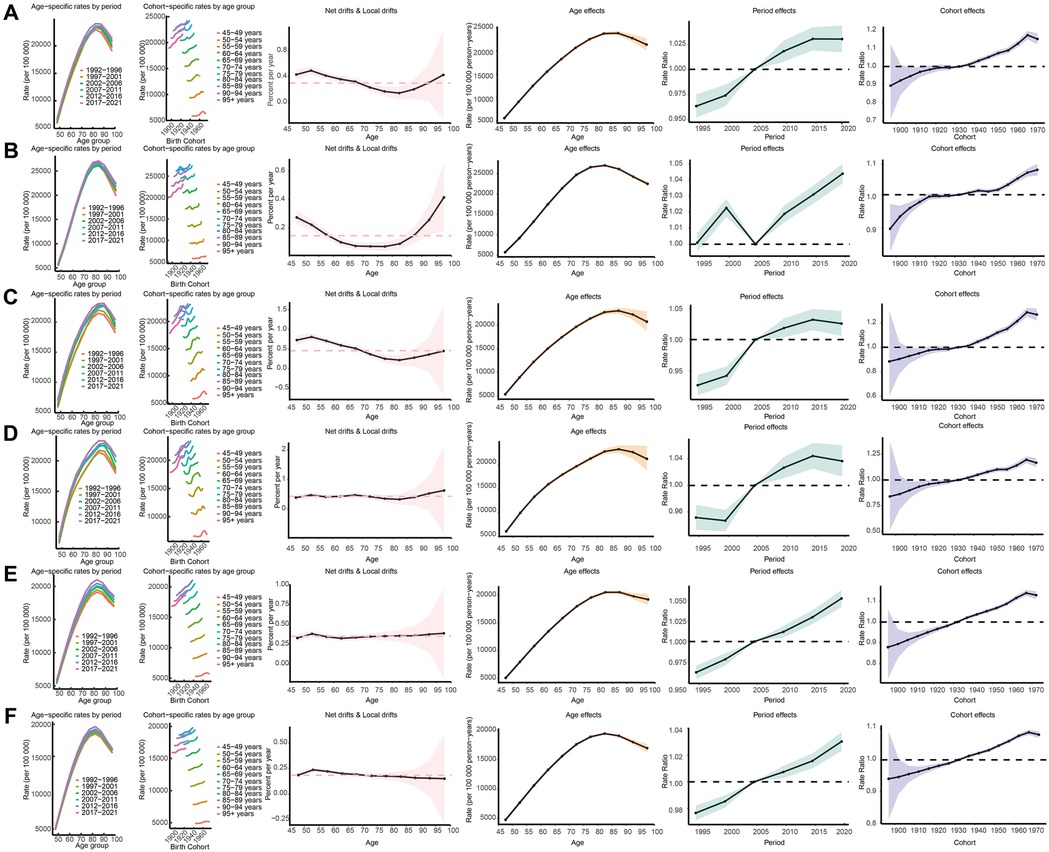
Figure 5. Age-period-cohort analysis on the prevalence of KOA among middle-aged and elderly populations across global socio-demographic Index quintiles. (A) represents global, (B) represents high-SDI, (C) represents high-middle SDI, (D) represents middle- SDI, (E) represents low-middle SDI, (F) represents low-SDI.
Cross-national inequalities in the burden of KOA among middle-aged and elderly populations
Significant absolute SDI-associated inequalities in the burden of KOA were observed, with little improvement over time (Figure 6). The scatter plot with trend lines shows a clear gradient of increasing YLDs with rising SDI, indicating higher health burdens in regions with higher SDI values. The data points, differentiated by population size, suggest that regions with larger populations tend to have higher YLDs, although this is not strictly correlated with SDI rank. The SII revealed an excess of 63.93 (95% CI: 40.01–87.86) YLDs per 100,000 between countries with the highest and lowest SDI in 1990, which declined to 58.25 (95% CI: 31.72–84.78) in 2021. Additionally, the concentration index, a measure of relative gradient inequality, was 0.03 (95% CI: 0.02–0.04) in 1990 and 0.03 (95% CI: 0.02–0.04) in 2021, indicating an imbalanced distribution of the burden among countries with varying SDI levels. The CIs for both years are narrow and overlap significantly, suggesting statistical precision in the estimates.
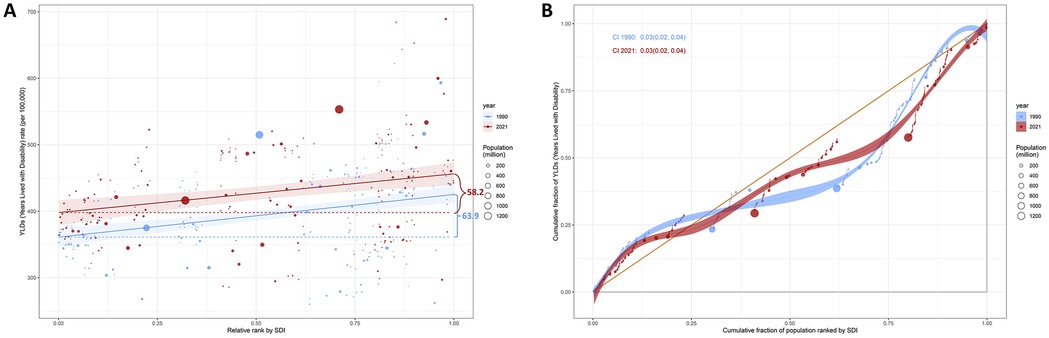
Figure 6. SDI-related health inequality regression (A) and concentration (B) curves for the YLDs of KOA among middle-aged and elderly populations, 1990 and 2021.
Forecasting KOA burden in middle-aged and elderly populations by 2035
The predicted case numbers and ASR of incidence, prevalence, and YLDs of KOA among middle-aged and elderly populations by 2035 are illustrated in Figure 7. Globally, the number of incidence, prevalence, and YLD cases is projected to increase, whereas the ASR of incidence, prevalence, and YLDs is expected to rise slowly and begin to taper off around 2030. Based on the projections, the ASIR is expected to reach 1,073.28/100,000 globally by 2035, up from 1,050.31/100,000 in 2021. The ASPR is projected to rise to 15,058.08/100,000 globally by 2035, up from 14,741.08/100,000 in 2021. The global ASYR is expected to reach 480.44/100,000 by 2035, up from 470.86/100,000 in 2021. By 2035, the global number of incidence cases is projected to reach 34,372,090, with 482,238,661 prevalence cases. Global YLDs are anticipated to reach 15,386,065 years in 2035, representing a significant increase from 11,290,900 years in 2021. Interestingly, a downward trend in ASIR, ASPR, and ASYR is projected for the 45–59 age group. Specifically, the ASIR, ASPR, and ASYR in the 45–49-year-old subgroup are expected to decline to levels similar to those observed in 1990. In contrast, the ASIR, ASPR, and ASYR in older age groups (e.g., ≥65 years) are projected to continue exhibiting a significant upward trend. The detailed values of the case numbers and ASRs of incidence, prevalence and YLDs are provided in Supplementary Table S6.
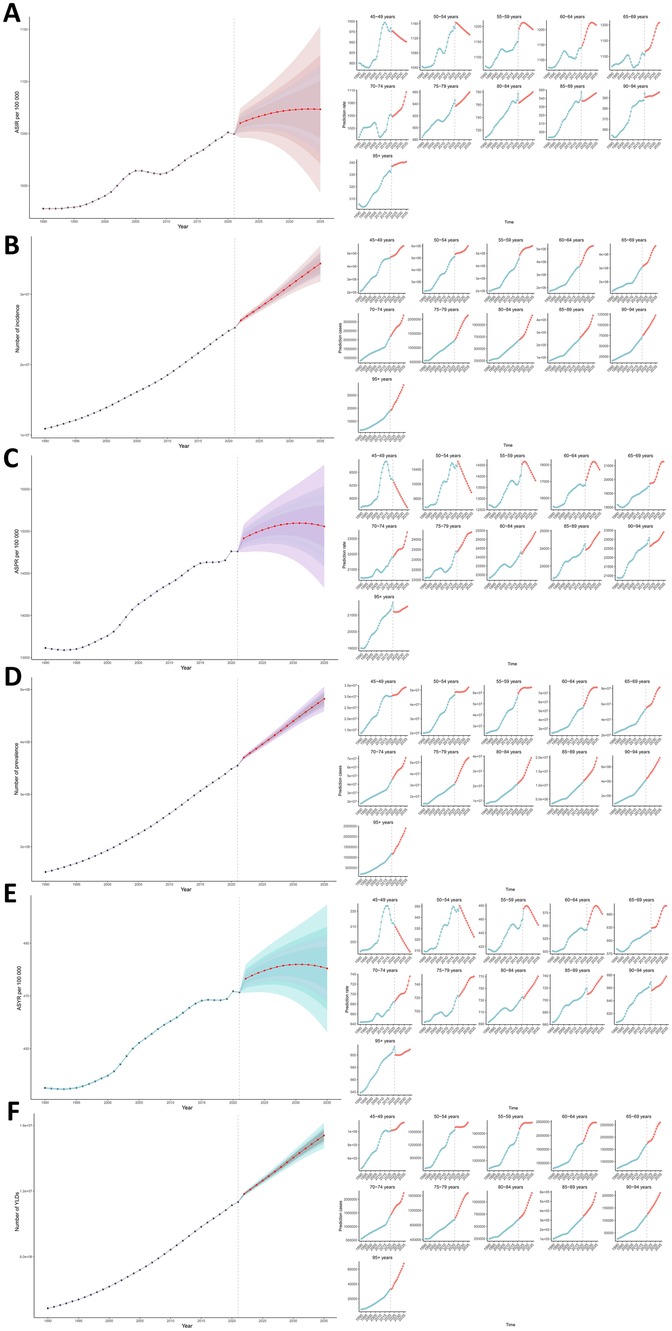
Figure 7. (A) The predicted ASIR to 2035; (B) the predicted case number of incidence to 2035; (C) the predicted ASPR to 2035; (D) the predicted case number of prevalence to 2035; (E) the predicted ASYR to 2035; (F) the predicted case number of YLDs to 2035; of KOA among middle-aged and elderly populations globally.
Discussion
Escalating global burden and demographic determinants
The results of this study demonstrate a significant increase in the global burden of KOA among middle-aged and elderly populations from 1990 to 2021. Both the ASIR and ASPR of KOA have shown upward trends, with a notable increase in YLDs (Figures 2,4). The GBD 2019 study reported that the global prevalence of KOA in 2019 was approximately 364.6 million across all age groups, with an age-standardized prevalence of 4,376.0 per 100,000, reflecting a 7.5% increase from 1990 to 2019 (4). The number of patients in all age groups aligns with our findings, although the ASPR in the 2021 study is much higher, indicating that middle-aged and elderly populations are still the most affected by KOA (19, 26). We posit that previous GBD studies encompassing all-age groups may have inadvertently diluted the outcome statistics for middle-aged and older adults by including data from younger populations, thereby underscoring the critical importance of this study's focus on the specific burden of KOA in aging demographics. The GBD study defined symptomatic knee pain and imaging-diagnosed or self-reported osteoarthritis in collecting KOA cases. Although previous studies are not fully comparable to the 2021 GBD study in methodology and data scope, together with the present study, they confirm the increasing trends in both KOA prevalence and absolute numbers (4–7, 24). Our findings show a 1.4-fold increase in KOA prevalence among middle-aged/elderly populations since 1990, outpacing global population growth (Table 1). This aligns with emerging evidence linking aging populations and the obesity epidemic to accelerated joint degeneration (27). These findings are consistent with prior research highlighting the growing impact of KOA on public health (4, 5, 18, 28–30). The rising burden of KOA can be attributed to various factors, including population aging, increasing obesity rates, and changes in lifestyle and occupational activities. As the global population continues to age, the number of individuals living with KOA is expected to rise further (Supplementary Table S6; Figure 7), emphasizing the need for proactive management strategies.
Gender differences
Our study confirms that females bear a higher burden of KOA compared to males, with higher ASIR, ASPR, and ASYR in most age groups (Supplementary Table S4; Figures 2–4). This gender disparity may be attributed to biological differences, such as hormonal influences and joint structure, as well as sociocultural factors, including occupational demands and physical activity patterns (11). For instance, women are more likely to engage in repetitive knee-stressing activities in both domestic and occupational settings, which may contribute to the higher prevalence of KOA. Additionally, hormonal changes during menopause have been implicated in the development and progression of KOA in women. Notably, the higher female predominance in ASPR (8.4% higher than males) corroborates hormonal and biomechanical vulnerabilities. Estrogen depletion post-menopause accelerates cartilage degradation, whereas a wider pelvic anatomy increases knee valgus stress (1, 6, 9, 19, 31). These findings highlight the importance of gender-specific interventions and research to address the unique needs of women with KOA.
Age-related differences
The age distribution of KOA burden shows that the incidence peaks in the 50–54 age group, and the prevalence peaks in the 55–59 age group, with a steady increase in ASPR and ASYR up to the 80–84 age group (Supplementary Table S4; Figure 3). Notably, our findings demonstrate some divergence from the age-related prevalence patterns reported by Tang et al. (32). While their study identified a plateau in KOA prevalence after age 70, our data suggest continued progression in older populations. These discrepancies may stem from methodological differences, including variations in database selection and case inclusion criteria. Unlike all-age studies (1), our focus on elderly populations revealed a U-shaped drift reversal in ≥80-year-olds (Figure 5). This age-related pattern reflects the cumulative effect of joint wear and tear over time, as well as increased susceptibility to KOA due to age-related physiological changes (16). The declining trend in ASIR and ASYR in the oldest age groups may be attributed to increased mortality and reduced physical activity, leading to underdiagnosis and underreporting of KOA in these populations (30). A closer examination of age-stratified localized drift revealed a biphasic trajectory (Supplementary Table S5; Figure 5): prevalence exhibited a gradual decline across younger age cohorts (peaking at age 80 years) followed by a distinct upward shift in individuals aged >80 years. This reversal suggests potential age-related biological mechanisms (e.g., cumulative joint degeneration) or differential diagnostic ascertainment in older age groups (33). Notably, socioeconomic disparities influenced these age-specific patterns. In middle, low-middle, and low SDI regions, localized drift values remained remarkably stable across all age groups within the middle-aged and elderly populations. This stability contrasts with the inverted U-shaped trend observed globally (Figure 5B), possibly reflecting limited healthcare access, delayed diagnosis, or differing population aging dynamics in resource-constrained settings (4, 7, 24). These findings highlight the need for age-specific approaches to KOA management, with a focus on early detection and intervention in middle-aged populations to prevent disease progression. Our findings support a life-course approach to OA management: early adulthood (15–45 years): mitigation of sports-related joint trauma; middle age (45–60 years): weight management and physical activity promotion; older adults (60–80 years): combating age-related muscle loss (17). Implementation of these stratified interventions, coupled with enhanced patient education and early diagnostic protocols, may significantly reduce OA-related disability and its socioeconomic impact. Personalized treatment regimens should be emphasized to optimize functional outcomes across all age groups (34).
Regional and national differences
This study reveals significant regional and national differences in the burden of KOA. East Asia, South Asia, and Western Europe have the highest number of KOA cases, whereas high-income Asia-Pacific countries (such as the Republic of Korea and Japan) exhibit the highest ASIR, ASPR, and ASYR. In contrast, Central Asia (e.g., Tajikistan) has the lowest ASIR, ASPR, and ASYR (Tables 1, 2). These differences can be attributed to several factors, including levels of economic development, access to healthcare, lifestyle, and genetic background (7, 9, 19, 24, 35).
In high-income countries, such as the United States and Germany, the high burden of KOA may be related to rising obesity rates, an aging population, and more frequent joint replacement surgeries in high SDI regions (Supplementary Table S2; Figure 1). Healthcare systems in these countries typically offer advanced diagnostic and treatment services, but this can also lead to overuse of medical resources and high medical costs (19, 24). For example, KOA patients in the United States have access to the latest joint replacement technologies, but this has also resulted in significant increases in medical costs, burdening patients and the healthcare system.
In middle-income countries, such as China and Brazil, the burden of KOA is also increasing, but disparities exist in the availability and quality of healthcare resources (Supplementary Table S2; Figure 1). Rapid economic development and urbanization in these countries have led to lifestyle changes, such as sedentary behaviors and unhealthy dietary habits, increasing the risk of KOA. Additionally, healthcare systems in these countries may struggle to meet the growing demand of KOA patients, resulting in delays in diagnosis and treatment (17, 18, 35). For instance, in China, the large number of KOA patients faces uneven distribution of medical resources, with many patients unable to receive timely and effective treatment (17, 35).
In low-income countries, such as Nigeria and India, the burden of KOA may be underestimated due to limited medical resources, meaning many patients do not receive accurate diagnoses and treatments (Supplementary Table S2; Figure 1). KOA patients in these countries often face greater socioeconomic challenges, such as poverty, lack of education, and limited healthcare access. Moreover, KOA patients in these countries may be more vulnerable to other health problems, such as malnutrition and infectious diseases, further exacerbating their health burden (16, 24).
Current research suggests that differences in the burden of osteoarthritis across regions may be influenced by genetic, metabolic, and behavioral factors (6, 9, 26). Although there is limited quantitative evidence to support a specific physiological causal mechanism, the literature suggests that the differences in osteoarthritis prevalence in thumb base and knee joints could be partially explained by geographical variations in occupational distribution, BMI, behaviors such as frequency of kneeling or squatting, joint anatomy, and genetic predisposition. For example, sitting in a squatting position might explain a higher prevalence of KOA in a cohort of Japanese females compared to U.S. females, even though the U.S. cohort had a higher average BMI (16).
Socioeconomic disparities: a double-edged sword
This study demonstrates a clear association between the burden of KOA and the SDI, with higher ASIR, ASPR, and ASYR in high SDI regions. Studies in high-SDI regions reveal that OA healthcare expenditures account for 1%–2.5% of GDP, with KOA representing approximately 85% of this burden (36).This trend can be attributed to better access to healthcare and diagnostic services in high SDI regions, which leads to higher detection rates of KOA. Additionally, lifestyle factors such as obesity, physical inactivity, and sedentary work environments are more prevalent in high-SDI regions, contributing to the elevated burden of KOA (29, 37). This paradoxical “development penalty” may stem from obesity-promoting environments (e.g., processed diets, sedentary occupations) and enhanced diagnostic sensitivity (26). Conversely, stable localized drift in low-SDI regions suggests underdiagnosis due to limited imaging infrastructure and competing health priorities—presenting a critical equity concern. Previous investigations have revealed that low-SDI regions typically suffer from inadequate medical resources and lack early diagnostic facilities, resulting in substantial treatment delays for numerous patients (38). These findings demonstrate marked disparities in KOA prevention awareness and knowledge levels across countries with varying SDI rankings. While biological risk factors (e.g., obesity prevalence) and aging populations contribute substantially, the 1.3-fold higher ASIR in high-SDI areas may be partially attributable to: (1) Data source heterogeneity: Previous GBD studies have identified systematic variations in osteoarthritis data sources across SDI strata. High-SDI regions predominantly utilize insurance claims and clinical studies (e.g., U.S. state-level insurance data constituting the majority of 624 data sources) (16), which may systematically overestimate burden due to greater healthcare access and advanced diagnostic capabilities. In contrast, low-income regions (e.g., Sub-Saharan Africa) primarily rely on non-clinical sources like COPCORD community surveys (8, 39), potentially underrepresenting true disease prevalence; (2) Diagnostic criteria disparities: Significant differences exist in case ascertainment methodologies. High-SDI regions routinely employ rigorous diagnostic standards combining radiographic evidence (e.g., Kellgren-Lawrence grading) with symptomatic criteria, while low-resource settings often depend solely on clinical presentation. Although >80% of non-reference data require adjustment to the reference standard (imaging + pain) (16, 29), residual biases may persist due to imperfect standardization methods; (3) Demographic and risk factor stratification: The GBD Osteoarthritis Collaboratives have previously demonstrated critical regional variations: high-SDI populations exhibit more pronounced aging (prevalence reaching 38,418.9/100,000 in ≥70 age groups) and greater BMI-attributable risk (e.g., 27.9% in Latin America). Conversely, case growth in Sub-Saharan Africa stems primarily from population expansion rather than increasing age-standardized rates - an observation supporting the hypothesis that diagnostic capacity amplifies reported burden in developed regions (8, 16, 18).Our SII (58.25 excess YLDs/100,000 in high vs. low SDI) emphasizes the urgent need for targeted interventions in underserved regions (Figure 6). High SDI regions' elevated ASPR may reflect overdiagnosis, while stable drift in low SDI areas suggests under detection. Research demonstrates that most KOA patients in high SDI regions present with mild symptoms, whereas those in low-SDI regions predominantly exhibit moderate-to-severe manifestations (40). This disparity likely reflects differences in healthcare resource allocation between high- and low-SDI regions. Addressing transnational disease inequalities requires targeted policies to optimize resource distribution. High-SDI regions must not only focus on pharmaceutical innovation and improved management protocols but also address challenges posed by aging populations. Conversely, low-SDI regions face distinct KOA prevention and treatment challenges, primarily stemming from population growth coupled with medical resource shortages. These disparities highlight the necessity for tailored interventions that address the specific needs of different socioeconomic groups, with a focus on improving healthcare access and promoting healthier lifestyles in low SDI regions (4, 7, 18, 24).
While the GBD framework enables unparalleled cross-national comparability, estimates may be influenced by regional disparities in diagnostic infrastructure. Underdiagnosis in low-resource settings (e.g., due to limited radiography access or inconsistent Kellgren-Lawrence grading) could underestimate true KOA burden, despite GBD's bias adjustments via MR-BRT. Our findings in low-SDI regions should be interpreted with caution, as limited healthcare access may lead to under-ascertainment of mild/moderate KOA cases, biasing burden estimates toward advanced disease. Similarly, regarding the paradox that the higher burden observed in high-SDI regions may reflect diagnostic capacity rather than true incidence increases, we acknowledge that while SDI stratification provides valuable socioeconomic context, it cannot fully disentangle actual disease occurrence from diagnostic ascertainment. The observed “development paradox”—where higher SDI correlates with greater measured burden—likely represents a confluence of both genuine risk factor exposure and surveillance advantages. Future studies should prioritize ground-truth validation in these settings.
Implications for public health policy
The findings of this study carry significant implications for public health policy. The increasing burden of KOA highlights the need for comprehensive strategies to prevent and manage the condition. Public health policies should focus on promoting healthy lifestyles, including regular physical activity and weight management, to reduce the risk of KOA among middle-aged and elderly populations (30).
Precision prevention: Community-based strength training and falls prevention programs should be prioritized for the aging population, given the substantial disease burden observed in this demographic. Gender-specific strategies are essential, particularly through the integration of KOA screening into postmenopausal health initiatives, complemented by evidence-based interventions such as hormonal therapy and weight management programs (41–43). Furthermore, research and development efforts should be supported to explore new treatment options and improve the management of KOA, with a focus on reducing disability and enhancing the quality of life for affected individuals.
SDI-Tailored Approaches: In high-income countries, policymakers should focus on controlling obesity rates and promoting healthy lifestyles to reduce the incidence of KOA. Moreover, the use of medical resources should be optimized to ensure that patients receive appropriate treatment whereas minimizing unnecessary medical costs (7, 16). In middle-income countries, policymakers should strengthen healthcare infrastructure and improve diagnostic and treatment capabilities for KOA. Additionally, public health education should raise awareness of KOA and encourage early detection and intervention. In low-income countries, policymakers should prioritize improving basic healthcare services to ensure KOA patients receive necessary diagnoses and treatments. Additionally, international cooperation and assistance should be leveraged to enhance the medical resources and capabilities of these countries (24). However, implementing these strategies requires acknowledging region-specific barriers. In low-SDI regions (e.g., Sub-Saharan Africa), infrastructure gaps and workforce shortages may limit diagnostic capacity (38). Scaling community-based screening using simplified clinical criteria could bypass radiographic dependencies while task-shifting to frontline health workers might alleviate specialist shortages. For middle-SDI regions (e.g., Southeast Asia), fragmented healthcare financing often restricts access to non-surgical interventions (8). Integrating KOA management into universal health coverage packages—prioritizing cost-effective therapies like structured exercise—could improve equity. In high-SDI regions, tele-rehabilitation proposals face technological literacy barriers among elderly populations. Hybrid models combining AI-assisted platforms with community health center support would enhance adoption. Furthermore, the intensifying population aging in high-SDI regions has exacerbated the tension between public health and socioeconomic development, with targeted policy solutions remaining under active exploration across nations.
Health System Readiness: By 2035, the projected 482 million prevalent cases will place a considerable strain on orthopedic services (Supplementary Table S6; Figure 7). Task-shifting to physiotherapists and AI-assisted tele-rehabilitation could help mitigate surgical backlogs. Addressing the predicted decline in middle-aged ASIR through workplace ergonomic reforms and youth obesity prevention will also be critical (2, 16, 26, 29). While AI-assisted tele-rehabilitation holds promise, its implementation requires addressing: device affordability and broadband access disparities; cultural preferences for in-person care among elderly cohorts; regulatory frameworks for cross-border data sharing. These pragmatic considerations complement our evidence-based recommendations, providing stakeholders with actionable pathways for context-adapted implementation.
Limitations and future directions
Data from GBD 2021 were used to estimate KOA prevalence, incidence, YLDs, and age-standardized rates across 204 countries (1990–2021). While the GBD framework provides unparalleled global comparability, we acknowledge inherent limitations in data harmonization across regions with disparate healthcare infrastructures. Variations in diagnostic criteria (e.g., inconsistent application of Kellgren-Lawrence grading), case ascertainment methods, and sparse primary data in resource-limited settings may affect cross-national comparability. APC modeling was employed to disentangle age, period, and birth cohort effects. This approach assumes temporal effects are additive and invariant across subgroups. Although this permits robust decomposition of variance components, it may oversimplify complex interactions (e.g., differential cohort effects by SDI level). Sensitivity analyses supported model stability, but future studies should explore machine-learning approaches for heterogeneous effects. Bayesian forecasting for 2035 projections incorporates historical trends but cannot account for unforeseen societal disruptions (e.g., pandemics or healthcare reforms). Despite these constraints, three measures mitigated potential biases: (1) GBD's spatiotemporal Gaussian smoothing and MR-BRT bias adjustment for methodological heterogeneity; (2) Sensitivity analyses confirming APC model stability (Supplementary Table S5); (3) Conservative uncertainty intervals in projections reflecting systemic variability. These methodological choices balance analytical rigor against the inherent complexities of real world data in global comparative studies—a challenge fundamental to large scale epidemiological research.
Although the GBD data standardizes global comparisons, underreporting in low-resource settings may underestimate the true burden of KOA. Our Bayesian projections assume linear SDI trends, yet climate change and geopolitical shifts could alter these trajectories. Future studies should explore molecular biomarkers (e.g., COMP, CTX-II) for pre-symptomatic detection and assess the cost-effectiveness of region-specific interventions (44, 45). This study focuses on the non-fatal burden of osteoarthritis; however, growing evidence suggests an association between KOA and excess mortality (16). Future research should further investigate this link. A key limitation in modeling the global burden of osteoarthritis is data sparsity, and high-quality data collection should be prioritized and funded.
Conclusion
This study provides valuable insights into the global trends and regional disparities in the burden of KOA among middle-aged and elderly populations. The prevalence, incidence, YLDs, and ASRs of KOA have increased substantially in most countries and regions from 1990 to 2021. The burden of KOA appears to rise with increasing SDI and is higher in females than in males. Population aging has exacerbated the burden of KOA, whereas transnational inequalities have not improved significantly. These findings highlight the need for targeted interventions and policies to address the growing burden of KOA and improve health outcomes for affected individuals. Future research should continue to monitor trends in KOA burden and evaluate the effectiveness of interventions to inform public health strategies.
Data availability statement
The original contributions presented in the study are included in the article/Supplementary Material, further inquiries can be directed to the corresponding author.
Ethics statement
Ethical approval was not required for the study involving humans in accordance with the local legislation and institutional requirements. Written informed consent to participate in this study was not required from the participants or the participants' legal guardians/next of kin in accordance with the national legislation and the institutional requirements.
Author contributions
YC: Resources, Conceptualization, Investigation, Validation, Writing – review & editing, Project administration, Data curation, Software, Funding acquisition, Writing – original draft, Methodology, Formal analysis, Supervision, Visualization. ZW: Data curation, Validation, Conceptualization, Writing – review & editing, Visualization. ZX: Visualization, Software, Writing – review & editing. LC: Data curation, Visualization, Validation, Conceptualization, Writing – review & editing, Investigation, Software.
Funding
The author(s) declare that financial support was received for the research and/or publication of this article. The research was supported by the Fujian Provincial Clinical Medical Research Center for First Aid and Rehabilitation in Orthopaedic Trauma (2020Y2014).
Acknowledgments
I would like to extend my deepest gratitude to my mother, who has lived with knee osteoarthritis for many years. Her resilience and firsthand experience with the condition have been a profound source of inspiration for this research. Her journey has not only motivated me to explore the global burden of this disease but also reinforced the importance of addressing the unique challenges faced by aging populations. This study is dedicated to her and to all individuals navigating the complexities of osteoarthritis.
Conflict of interest
The authors declare that the research was conducted in the absence of any commercial or financial relationships that could be construed as a potential conflict of interest.
Generative AI statement
The author(s) declare that no Generative AI was used in the creation of this manuscript.
Any alternative text (alt text) provided alongside figures in this article has been generated by Frontiers with the support of artificial intelligence and reasonable efforts have been made to ensure accuracy, including review by the authors wherever possible. If you identify any issues, please contact us.
Publisher's note
All claims expressed in this article are solely those of the authors and do not necessarily represent those of their affiliated organizations, or those of the publisher, the editors and the reviewers. Any product that may be evaluated in this article, or claim that may be made by its manufacturer, is not guaranteed or endorsed by the publisher.
Supplementary material
The Supplementary Material for this article can be found online at: https://www.frontiersin.org/articles/10.3389/fmscd.2025.1619798/full#supplementary-material
Abbreviations
GBD, global burden of diseases; SDI, socio-demographic index; KOA, knee osteoarthritis; ASIR, age-standardized incidence rate; ASPR, age-standardized prevalence rate; ASYR, age-standardized YLDs rate; BAPC, bayesian age-period-cohort; AAPC, average annual percent change; ASR, age-standardized rates; SII, slope index of inequality; CI, concentration index; RRs, relative risk.
References
1. Hunter DJ, Bierma-Zeinstra S. Osteoarthritis. Lancet. (2019) 393:1745–59. doi: 10.1016/S0140-6736(19)30417-9
2. GBD 2021 Diseases and Injuries Collaborators. Global incidence, prevalence, years lived with disability (YLDs), disability-adjusted life-years (DALYs), and healthy life expectancy (HALE) for 371 diseases and injuries in 204 countries and territories and 811 subnational locations, 1990–2021: a systematic analysis for the Global Burden of Disease Study 2021. Lancet. (2024) 403:2133–61. doi: 10.1016/S0140-6736(24)00757-8
3. Long H, Liu Q, Yin H, Wang K, Diao N, Zhang Y, et al. Prevalence trends of site-specific osteoarthritis from 1990 to 2019: findings from the Global Burden of Disease Study 2019. Arthritis Rheumatol. (2022) 74:1172–83. doi: 10.1002/art.42089
4. Yang G, Wang J, Liu Y, Lu H, He L, Ma C, et al. Burden of knee osteoarthritis in 204 countries and territories, 1990–2019: results from the Global Burden of Disease Study 2019. Arthritis Care Res. (2023) 75:2489–500. doi: 10.1002/acr.25158
5. Langworthy M, Dasa V, Spitzer AI. Knee osteoarthritis: disease burden, available treatments, and emerging options. Ther Adv Musculoskelet Dis. (2024) 16:1759720X241273009. doi: 10.1177/1759720X241273009
6. Giorgino R, Albano D, Fusco S, Peretti GM, Mangiavini L, Messina C. Knee osteoarthritis: epidemiology, pathogenesis, and mesenchymal stem cells: what else is new? An update. Int J Mol Sci. (2023) 24:6405. doi: 10.3390/ijms24076405
7. Kang Y, Liu C, Ji Y, Zhang H, Wang Y, Bi W, et al. The burden of knee osteoarthritis worldwide, regionally, and nationally from 1990 to 2019, along with an analysis of cross-national inequalities. Arch Orthop Trauma Surg. (2024) 144:2731–43. doi: 10.1007/s00402-024-05250-4
8. Chen J, Chen X, Wang T, Li M, Dai H, Shang S, et al. Global burden of knee osteoarthritis from 1990 to 2021: trends, inequalities, and projections to 2035. PLoS One. (2025) 20:e0320115. doi: 10.1371/journal.pone.0320115
9. Courties A, Kouki I, Soliman N, Mathieu S, Sellam J. Osteoarthritis year in review 2024: epidemiology and therapy. Osteoarthritis Cartilage. (2024) 32:1397–404. doi: 10.1016/j.joca.2024.07.014
10. Bijlsma JWJ, Berenbaum F, Lafeber FPJG. Osteoarthritis: an update with relevance for clinical practice. Lancet. (2011) 377:2115–26. doi: 10.1016/S0140-6736(11)60243-2
11. Curry ZA, Beling A, Borg-Stein J. Knee osteoarthritis in midlife women: unique considerations and comprehensive management. Menopause. (2022) 29:748–55. doi: 10.1097/GME.0000000000001966
12. Lee R, Kean WF. Obesity and knee osteoarthritis. Inflammopharmacology. (2012) 20:53–8. doi: 10.1007/s10787-011-0118-0
13. Serrano DV, Saseendar S, Shanmugasundaram S, Bidwai R, Gómez D, D’Ambrosi R. Spontaneous osteonecrosis of the knee: state of the art. J Clin Med. (2022) 11:6943. doi: 10.3390/jcm11236943
14. Roemer FW, Demehri S, Omoumi P, Link TM, Kijowski R, Saarakkala S, et al. State of the art: imaging of osteoarthritis-revisited 2020. Radiology. (2020) 296:5–21. doi: 10.1148/radiol.2020192498
15. Ibad HA, de Cesar Netto C, Shakoor D, Sisniega A, Liu SZ, Siewerdsen JH, et al. Computed tomography: state-of-the-art advancements in musculoskeletal imaging. Invest Radiol. (2023) 58:99–110. doi: 10.1097/RLI.0000000000000908
16. Steinmetz JD, Culbreth GT, Haile LM, Rafferty Q, Lo J, Fukutaki KG, et al. Global, regional, and national burden of osteoarthritis, 1990–2020 and projections to 2050: a systematic analysis for the Global Burden of Disease Study 2021. Lancet Rheumatol. (2023) 5:e508–22. doi: 10.1016/S2665-9913(23)00163-7
17. Liang J, Wang Y, Yu F, Jiang G, Zhang W, Tian K. Evaluation of the osteoarthritis disease burden in China from 1990 to 2021: based on the Global Burden of Disease Study 2021. Front Public Health. (2024) 12:1478710. doi: 10.3389/fpubh.2024.1478710
18. Li E, Tan J, Xu K, Pan Y, Xu P. Global burden and socioeconomic impact of knee osteoarthritis: a comprehensive analysis. Front Med. (2024) 11:1323091. doi: 10.3389/fmed.2024.1323091
19. Di J, Bai J, Zhang J, Chen J, Hao Y, Bai J, et al. Regional disparities, age-related changes and sex-related differences in knee osteoarthritis. BMC Musculoskelet Disord. (2024) 25:66. doi: 10.1186/s12891-024-07191-w
20. GBD 2021 Causes of Death Collaborators. Global burden of 288 causes of death and life expectancy decomposition in 204 countries and territories and 811 subnational locations, 1990–2021: a systematic analysis for the Global Burden of Disease Study 2021. Lancet. (2024) 403:2100–32. doi: 10.1016/S0140-6736(24)00367-2
21. GBD 2021 Risk Factors Collaborators. Global burden and strength of evidence for 88 risk factors in 204 countries and 811 subnational locations, 1990–2021: a systematic analysis for the Global Burden of Disease Study 2021. Lancet. (2024) 403:2162–203. doi: 10.1016/S0140-6736(24)00933-4
22. Kellgren JH, Lawrence JS. Radiological assessment of osteo-arthrosis. Ann Rheum Dis. (1957) 16:494–502. doi: 10.1136/ard.16.4.494
23. Yang E, Chen F, Yang Y, Zhang Y, Lin H, Zhang Y, et al. Global trends in depressive disorder prevalence and DALYs among young populations: a comprehensive analysis from 1990 to 2021. BMC Psychiatry. (2024) 24:943. doi: 10.1186/s12888-024-06419-2
24. Cao F, Xu Z, Li X-X, Fu Z-Y, Han R-Y, Zhang J-L, et al. Trends and cross-country inequalities in the global burden of osteoarthritis, 1990–2019: a population-based study. Ageing Res Rev. (2024) 99:102382. doi: 10.1016/j.arr.2024.102382
25. Riebler A, Held L. Projecting the future burden of cancer: Bayesian age–period–cohort analysis with integrated nested Laplace approximations. Biom J. (2017) 59:531–49. doi: 10.1002/bimj.201500263
26. Wallace IJ, Worthington S, Felson DT, Jurmain RD, Wren KT, Maijanen H, et al. Knee osteoarthritis has doubled in prevalence since the mid-20th century. Proc Natl Acad Sci U S A. (2017) 114:9332–6. doi: 10.1073/pnas.1703856114
27. Silverwood V, Blagojevic-Bucknall M, Jinks C, Jordan JL, Protheroe J, Jordan KP. Current evidence on risk factors for knee osteoarthritis in older adults: a systematic review and meta-analysis. Osteoarthritis Cartilage. (2015) 23:507–15. doi: 10.1016/j.joca.2014.11.019
28. Li X, Cao F, Zhao C, Ge M, Wei H, Tang J, et al. Global burden of osteoarthritis: prevalence and temporal trends from 1990 to 2019. Int J Rheum Dis. (2024) 27:e15285. doi: 10.1111/1756-185X.15285
29. Wang Z, Xiao Z, Sun C, Xu G, He J. Global, regional and national burden of osteoarthritis in 1990–2021: a systematic analysis of the global burden of disease study 2021. BMC Musculoskelet Disord. (2024) 25:1021. doi: 10.1186/s12891-024-08122-5
30. Ding Y, Liu X, Chen C, Yin C, Sun X. Global, regional, and national trends in osteoarthritis disability-adjusted life years (DALYs) from 1990 to 2019: a comprehensive analysis of the global burden of disease study. Public Health. (2024) 226:261–72. doi: 10.1016/j.puhe.2023.10.030
31. Srikanth VK, Fryer JL, Zhai G, Winzenberg TM, Hosmer D, Jones G. A meta-analysis of sex differences prevalence, incidence and severity of osteoarthritis. Osteoarthritis Cartilage. (2005) 13:769–81. doi: 10.1016/j.joca.2005.04.014
32. Tang X, Wang S, Zhan S, Niu J, Tao K, Zhang Y, et al. The prevalence of symptomatic knee osteoarthritis in China: results from the China health and retirement longitudinal study. Arthritis Rheumatol. (2016) 68:648–53. doi: 10.1002/art.39465
33. Dell’Isola A, Allan R, Smith SL, Marreiros SSP, Steultjens M. Identification of clinical phenotypes in knee osteoarthritis: a systematic review of the literature. BMC Musculoskelet Disord. (2016) 17:425. doi: 10.1186/s12891-016-1286-2
34. Whittaker JL, Runhaar J, Bierma-Zeinstra S, Roos EM. A lifespan approach to osteoarthritis prevention. Osteoarthritis Cartilage. (2021) 29:1638–53. doi: 10.1016/j.joca.2021.06.015
35. Wang Y, Chen B, Liu X, Zeng H, Chen B, Wang Z, et al. Temporal trends in the burden of musculoskeletal diseases in China from 1990 to 2021 and predictions for 2021 to 2030. Bone. (2025) 191:117332. doi: 10.1016/j.bone.2024.117332
36. GBD 2015 Disease and Injury Incidence and Prevalence Collaborators. Global, regional, and national incidence, prevalence, and years lived with disability for 310 diseases and injuries, 1990–2015: a systematic analysis for the Global Burden of Disease Study 2015. Lancet. (2016) 388:1545–602. doi: 10.1016/S0140-6736(16)31678-6
37. Li H-Z, Liang X-Z, Sun Y-Q, Jia H-F, Li J-C, Li G. Global, regional, and national burdens of osteoarthritis from 1990 to 2021: findings from the 2021 global burden of disease study. Front Med. (2024) 11:1476853. doi: 10.3389/fmed.2024.1476853
38. Yuan B, Li J, Zhao H, Zeng G. Global population aging, national development level, and vulnerability to the pandemic. Risk Manag Healthc Policy. (2021) 14:705–17. doi: 10.2147/RMHP.S292440
39. Jafarzadeh SR, Felson DT. Updated estimates suggest a much higher prevalence of arthritis in United States adults than previous ones. Arthritis Rheumatol. (2018) 70:185–92. doi: 10.1002/art.40355
40. Cross M, Smith E, Hoy D, Nolte S, Ackerman I, Fransen M, et al. The global burden of hip and knee osteoarthritis: estimates from the global burden of disease 2010 study. Ann Rheum Dis. (2014) 73:1323–30. doi: 10.1136/annrheumdis-2013-204763
41. Xing X, Wang Y, Pan F, Cai G. Osteoarthritis and risk of type 2 diabetes: a two-sample Mendelian randomization analysis. J Diabetes. (2023) 15:987–93. doi: 10.1111/1753-0407.13451
42. Arruda AL, Hartley A, Katsoula G, Smith GD, Morris AP, Zeggini E. Genetic underpinning of the comorbidity between type 2 diabetes and osteoarthritis. Am J Hum Genet. (2023) 110:1304–18. doi: 10.1016/j.ajhg.2023.06.010
43. Veronese N, Cooper C, Reginster J-Y, Hochberg M, Branco J, Bruyère O, et al. Type 2 diabetes mellitus and osteoarthritis. Semin Arthritis Rheum. (2019) 49:9–19. doi: 10.1016/j.semarthrit.2019.01.005
44. Hao HQ, Zhang JF, He QQ, Wang Z. Cartilage oligomeric matrix protein, C-terminal cross-linking telopeptide of type II collagen, and matrix metalloproteinase-3 as biomarkers for knee and hip osteoarthritis (OA) diagnosis: a systematic review and meta-analysis. Osteoarthritis Cartilage. (2019) 27:726–36. doi: 10.1016/j.joca.2018.10.009
Keywords: knee osteoarthritis, global burden of disease, incidence, prevalence, middle-aged, elderly
Citation: Chen Y, Wang Z, Xu Z and Chen L (2025) Rising tides of knee osteoarthritis: global trends and regional disparities among middle-aged and elderly populations from 1990 to 2021 and its prediction to 2035. Front. Musculoskelet. Disord. 3:1619798. doi: 10.3389/fmscd.2025.1619798
Received: 28 April 2025; Accepted: 11 August 2025;
Published: 21 August 2025.
Edited by:
Marios Kyriazis, National Gerontology Centre, CyprusReviewed by:
Emanuele Bizzi, Vita-Salute San Raffaele University, ItalyZheng Yongqiang, Jinjiang City Hospital, China
Copyright: © 2025 Chen, Wang, Xu and Chen. This is an open-access article distributed under the terms of the Creative Commons Attribution License (CC BY). The use, distribution or reproduction in other forums is permitted, provided the original author(s) and the copyright owner(s) are credited and that the original publication in this journal is cited, in accordance with accepted academic practice. No use, distribution or reproduction is permitted which does not comply with these terms.
*Correspondence: Yufan Chen, eXVmYW5jaGVuMjAyMkAxNjMuY29t
†ORCID:
Yufan Chen
orcid.org/0009-0002-2962-1006