 Akshit Soota1
 Angela C. Incollingo Rodriguez2
 Benjamin C. Nephew3*Paula Gardiner4Jean A. King3Natalia E. Morone5
 Carolina Ruiz1
- 1Department of Computer Science, Worcester Polytechnic Institute, Worcester, MA, United States
- 2Department of Social Sciences and Policy Studies, Worcester Polytechnic Institute, Worcester, MA, United States
- 3Department of Biology and Biotechnology, Worcester Polytechnic Institute, Worcester, MA, United States
- 4Center for Mindfulness and Compassion, Cambridge Health Alliance, Cambridge, MA, United States
- 5Boston University/Boston Medical Center, Boston, MA, United States
Background: Millions of people each year suffer from chronic low back pain (cLBP), which adversely affects their physical and mental health. While non-pharmacological interventions such as mindfulness are known to be effective in treating cLBP, not all patients experience the same benefit. Determining who these treatments might work best for is difficult, as there are no reliable predictors of the response to mindfulness for cLBP. The objective of the current study was to apply predictive machine learning to data collected from a completed clinical trial of mindfulness for cLBP to identify phenotypes characterizing those who did and did not respond to the intervention.
Methods: The analyses here focused on 132 participants in the intervention arm of the clinical trial of mindfulness for cLBP. The Random Forest machine learning technique was used to identify key characteristics of responders (49) and non-responders (83).
Results: The top three responder phenotypes were able to identify 26 out of the 49 responders with 92%–100% precision. The top three non-responder phenotypes were able to identify 36 out of 83 non-responders, all with 100% precision.
Conclusions: Results from this machine learning based phenotyping can guide clinician and patient decision-making to maximize clinical efficiency, patient outcomes, and resource use as well as inform research and development of mindfulness-based treatments for pain.
Introduction
Chronic low back pain (cLBP), defined as pain lasting three months or longer, affects approximately 9%–10% of adults worldwide, with prevalence increasing from early into late adulthood (1). Globally, over half a billion people reported LBP in 2020, and chronic cases are expected to increase by more than 36%—to over 843 million—by 2050 as populations age globally (2). As the leading cause of disability worldwide, cLBP is a substantial cause of lost productivity and imposes significant economic burdens, with individual costs reaching $10–20,000 per patient per year (3). Beyond the financial toll—estimated at hundreds of billions annually in many countries—affected individuals frequently experience reduced quality of life, higher rates of depression, early retirement, and increased mortality risk (4).
Standard treatment protocols for cLBP typically begin with nonpharmacologic interventions, which are favored due to their lower risk profiles and modest but consistent benefits. The American College of Physicians and related guidelines strongly recommend exercise programs (e.g., aerobic activity, motor-control/core strengthening), mind body interventions (mindfulness-based stress reduction, yoga, Tai chi), and multidisciplinary rehabilitation, each supported by moderate-quality evidence demonstrating small to moderate improvements in pain and function (5). If these nonpharmacologic methods are not effective, guidelines suggest progressing to oral NSAIDs as first-line medications, which are moderately effective for many patients. Second-line pharmacologic agents include SNRIs (notably duloxetine), tramadol, and tricyclic antidepressants, each offering small improvements in pain relief (6). However, while opioids may provide short-term pain reduction, they are not always advantageous. These medications carry considerable risk profile—withdrawals, adverse effects, and potential for misuse— and are thus reserved for cases where other therapies have failed and after careful consideration by patient and provider. The ongoing opioid epidemic (7), with over 54,000 opioid related overdose deaths in 2024 alone (8), has increased interest and efforts to maximize the application and effectiveness of nonpharmacologic interventions, including mindfulness.
Mindfulness-based interventions, particularly Mindfulness-Based Stress Reduction (MBSR) and related meditation practice, are often effective, low-risk treatments for cLBP. A comprehensive meta-analysis of 12 randomized controlled trials involving 1,153 patients found that meditation-based therapies modestly but significantly reduced pain intensity and bothersomeness while improving quality of life compared with non-meditation controls (9). Additional systematic reviews of MBSR have reported short-term reductions in pain intensity (mean difference ≈ 1 on a 0–10 scale) and modest gains in physical function, though long-term superiority to other active treatments is unclear (10). A large randomized trial (n = 342) comparing MBSR, Cognitive Behavioral Therapy (CBT), and usual care found that both MBSR and CBT yielded greater improvements in pain and functional limitations at 26 and 52 weeks—with MBSR effects persisting at one year—vs. usual care (11, 12). Overall, mindfulness programs for cLBP consistently yield small to moderate benefits in pain, function, and well-being, underscoring their role as a valuable component of nonpharmacologic, multimodal pain management strategies.
Various modeling methods have been used to quantify various musculoskeletal outcomes such as osteoporosis related variability in hip fractures (13) and declining hip fracture rates in a Norwegian population (14). Related work has established clinical tools for stratifying patients with musculoskeletal pain (15), predicting the risk of musculoskeletal disorders in the workplace (16), and predicting postsurgical pain (17). The prediction of pain outcomes is particularly challenging, and research in this area has benefited greatly from the use of machine learning (ML) modeling techniques.
ML has been used to effectively predict and evaluate pain outcomes across a spectrum of clinical scenarios. A 2021 review of 26 predictive ML studies of pain outcomes (diagnosis, pain intensity, managing pain) reported superior performance compared to traditional statistical methods (18). Similarly, a systematic review of 44 EEG-based ML studies reported that models could accurately predict pain intensity and treatment response (65%–100% accuracy) demonstrating substantial analytic potential depending on the method used (19). One 2024 study using high-dimensional clinical data from over 67,000 outpatient records found that ensemble ML methods such as Random Forest outperformed standard logistic regression and other machine learning methods in predicting chronic pain presence and treatment response—highlighting key predictors such as BMI and inflammatory markers (20). In summary, while there is consistent evidence of ML's effectiveness in predicting pain intensity and treatment outcomes, it has not been applied to predict the response to mindfulness-based interventions for pain.
The current secondary data analysis applied predictive ML to data collected from a completed randomized clinical trial of mindfulness for cLBP (the Aging Successfully with Pain study) (21). This parent clinical trial sought to determine the effectiveness of a mind-body program at increasing function and reducing pain in older adults with cLBP. Analyses focused on the intervention arm of the RCT and used Random Forest to identify phenotypes of responders and non-responders. The objective was to go beyond the phenotyping of chronic pain to identify clusters of participant features (hereafter termed “responder and non-responder phenotypes”) characterizing those who did and did not respond to the intervention.
Methods
Aging successfully with pain RCT overview
This experimental study was designed as a randomized, patient education-controlled clinical trial of a mind-body program for older adults with cLBP. Details of the study procedure have been published previously (21, 22). 282 independent, community-dwelling adults 65 years or older were recruited from metropolitan Pittsburgh, Pennsylvania. Participants in the mind-body (intervention) group received the group intervention of 8 weekly 90-minute mindfulness meditation sessions modeled on the Mindfulness-Based Stress Reduction program (23, 24). Controls received an 8-week group health education program based on the “10 Keys” to Healthy Aging. After completion of the 8-week program, participants in the intervention and control programs were asked to return for 6 monthly booster sessions. Measures were obtained at baseline, after the 8-week program, and 6 months after program completion. Recruitment occurred from February 14, 2011, to June 30, 2014. The final 6-month assessment was completed April 9, 2015. The study protocol was approved by the institutional review board of the University of Pittsburgh. All participants provided written informed consent.
RCT inclusion and exclusion criteria
Participants were included if they were 65 years or older, spoke English, had intact cognition (Mini-Mental State Examination score, ≥24) (25), had functional limitations owing to their chronic LBP (defined as a score of ≥11 on the Roland and Morris Disability Questionnaire [RMDQ] (26); range, 0–24, with higher scores indicating increased limitations), and had self-reported moderate chronic pain levels on a verbal descriptor scale (Pain Thermometer; measured on a visual scale as pain as bad as it could be, extreme, severe, moderate, mild, or no pain) occurring daily or almost every day for at least the previous 3 months (26). Participants were excluded if they had participated in a previous mindfulness meditation program, had serious underlying illness (such as malignant neoplasms, infection, unexplained fever, weight loss, or recent trauma) causing their pain, were nonambulatory, had severe impaired mobility, had visual or hearing impairment that interfered with assessments, had pain in other parts of the body more severe than their chronic LBP or acute back pain, had an acute or a terminal illness, or had moderate to severe depressive symptoms (Geriatric Depression Scale score, ≥ 21; range, 0–30) (27).
RCT assessments and outcome measures
The Roland-Morris Disability Questionnaire (RMDQ) was the primary outcome measure. It contains 24 questions specifically related to functional limitations as a result of LBP. A clinically meaningful change in the RMDQ ranges from a 2.5- to a 5.0-point improvement (reduction) from baseline (28).
Pain (present, average, and most severe during the past week) was measured by self-report with the 21 point Pain Numeric Rating Scale (PNRS; range, 0–20, with higher scores indicating worse pain) (29). Because pain is a complex phenomenon that affects quality of life, mood, and psychological function, a variety of established instruments were used to measure these different domains.
The Modifiable Activity Questionnaire (MAQ) was used to record the frequency and duration of various levels of physical activity (30). The MAQ assesses activities during occupational and leisure time, as well as inactivity due to disability. A total score is calculated by summing the scores from each domain, ranging from 3 to 15, where a higher score indicates a higher level of physical activity.
Quality of life was measured with the RAND-36 Health Status Inventory (SF-36, consisting of the physical functioning, mental, health, and general health perception scores, with higher scores indicating better health (31).
The Profile of Mood States (POMS) was used to measure transient and fluctuating feelings and enduring affect states. It's a 65 item self-report questionnaire that evaluates six mood states: tension-anxiety, depression, anger-hostility, vigor, fatigue, and confusion (32).
Given the strong association between chronic pain and depression, the 30 item Geriatric Depression Scale (GDS) was used to assess depression (33). It has a score range of 0–15, with higher scores indicating more severe depression. Scores are typically interpreted as follows: 0–4 = normal, 5–8 = mild depression, 9–11 = moderate depression, and 12–15 = severe depression. Self-efficacy has been shown to predict task performance (34). This construct was measured with the well-validated Chronic Pain Self-Efficacy Scale (CPSE, range, 0%-100%, with higher scores indicating improved self-efficacy) (35).
The Fear Avoidance Beliefs Questionnaire (FABQ) was used to assess how fear-avoidance beliefs about physical activity and work affect and contribute to low back pain (36). The FABQ consists of 16 items in which an individual rates their agreement with each statement on a 7-point Likert scale. There is a maximum score of 66, where a higher score indicates more strongly held fear avoidance beliefs.
Chronic pain acceptance was measured with the Chronic Pain Acceptance Questionnaire (CPAQ) (37), which assesses how individuals accept their chronic pain and its impact on their lives. The standard CPAQ has a range of 0–120, with higher scores indicating greater acceptance. The CPAQ has two subscales: Activity Engagement (score range 0–66) and Pain Willingness (score range 0–54). Each item is rated on a 7-point scale from 0 (never true) to 6 (always true). Pain catastrophizing was measured with the Catastrophizing Scale of the Coping Strategies Questionnaire (CSCS, range, 0–6, with higher scores indicating greater catastrophizing) (38).
Self-reported mindfulness was assessed with the Mindful Attention Awareness Scale (MAAS; range, 1–6, with higher scores indicating greater mindfulness) (39). Data on comorbidity were reported with the Cumulative Illness Rating Scale (range, 0–13, with higher scores indicating more comorbid conditions) (40).
The Multidimensional Scale of Perceived Social Support (MSPSS) is a 12 question measure used to measure perception of support from 3 sources: family, friends and a significant other (41). The total score ranges from 12 to 84, with higher scores indicating greater perceived social support. Each subscale (family, friends, and significant others) also has a score range of 4 to 28.
The Credibility Expectancy Questionnaire (CEQ) is a six-item scale which was used to assess participants' perceptions of treatment credibility and their expectancy of its effectiveness, with higher scores indicating greater credibility and stronger outcome expectations (42).
Objective measure
The Short Physical Performance Battery (PPB) (43–45) tests lower extremity function by measuring standing balance, gait speed and timed chair rise, tasks that are commonly encountered by older adults. The maximum score is 12 and higher scores indicate better function.
Intervention
The intervention was modeled on the 8-week Mindfulness-Based Stress Reduction (MBSR) program (23, 24). Four methods of mindfulness meditation were taught: the body scan, sitting practice, walking meditation, and mindful stretching. These techniques take regular activities such as sitting, walking, and lying down and transform them into a meditation through directed breathing and mindful awareness of thoughts and sensations. To encourage proficiency with the meditation method after completion of the intervention, monthly 60-minute booster sessions were held. Each session included time for a mindfulness meditation and time for discussion of the themes brought up during the 8-week program.
Machine learning modeling: dataset and data preprocessing
The final sample size for the intervention arm of the RCT was 140 participants. The intervention group was 34% male, had a mean age of 75, and was 70% white and 30% black. Given that the goal of our analysis was to determine factors predictive of response to MBSR (in contrast to determining efficacy of MBSR as a treatment for pain, which has already been established in the literature), we focus on 132 out of 140 intervention participants with data at baseline and 8-weeks. The main outcome was the Roland-Morris Disability Questionnaire (RMDQ), which measures functional limitations owing to low back pain. Other self-reported questionnaires were collected by the study at baseline and 8-weeks (end of treatment). Questionnaire subscores and total scores were all used for the ML analyses. No further pre-modeling feature selection was applied to allow the ML modeling access to all available features and to perform its own embedded feature selection. Missing values in predictive features were imputed using mean feature values.
Outcome attribute: clinically significant change in RMDQ
The machine learning modeling results in the present analyses focus on the Roland-Morris Score (RMscore). We used change in the Roland-Morris score as our predictive outcome, which we denote as ΔRMscore (“delta RMscore”) and compute by subtracting a subject's 8-week score from their baseline score: Δrmscore = RMscorebaseline - RMscore8−week.
A positive ΔRMscore indicates that the subject saw an improvement in the self-reported disability measure. A within-patient change of at least 4 or 5 points in the Roland-Morris score is recognized as the threshold for a clinically important. Hence, in the current study our main outcome is a binary treatment response outcome, where ΔRMscore > 4 is considered clinically significant improvement (outcome class 1) and ΔRMscore ≤ 4 is not considered clinically significant improvement (outcome class 0). The number of participants with ΔRMscore > 4 is 49; and with ΔRMscore ≤ 4 is 83.
Machine learning modeling technique: random forests
The modeling goal was to identify markers that predict clinically significant response (or lack of it) to treatment. The current analyses present markers and combinations of markers that our Random Forest based ML modeling has identified as predictive of treatment response. The Random Forest is an ensemble method that constructs a collection of decision trees by including randomness in the tree construction process to allow the creation of different decision trees over the same dataset; this reduces overfitting (46).
The Random Forest (RF) algorithm and the underlying Decision Tree (DT) algorithm are ML methods of choice for their high accuracy, descriptiveness, and fast training and prediction time. Given a dataset and an input hyperparameter for the desired number of decision trees, the RF algorithm builds the specified number of decision trees, each one over a different random subsample of data features and a random subsample of data instances. Each decision tree is a hierarchical representation of the predictive data variables in the subsample in the order in which they should be tested to maximize predictive performance. The algorithm determines the most predictive data variable (take for example “gait speed”) together with an optimal threshold to split the variable values (take for example “0.6″) using an optimization entropy-like metric (e.g., gini). The algorithm then creates a root node that contains this most predictive variable (gait speed) and creates two children of the node: the left child is for participants whose variable value is less than or equal to the threshold (gait speed ≤ 0.6) and the right child corresponds to the remaining participants (gait speed > 0.6). Each branch of the tree continues to be expanded in a similar way: the next node on the leftmost branch is the variable that is the best outcome predictor (take for example, fatigue) for participants on that branch (participants with gait speed ≤ 0.6) according to the optimization metric. The expansion of a branch terminates on a “leaf” node when there is sufficient certainty (as measured by a confidence metric) to make a prediction for participants who satisfy all variable “tests” on the branch. Here, that prediction (“class”) is a yes/no answer to whether a cLBP participant who matches all variable tests on the branch will respond to MBSR.
Machine learning experiments were conducted using the scikit-learn machine learning Python package. Hyperparameter tuning was performed with the GridSearchCV function using 5-fold cross-validation to select combinations of hyperparameter values that maximize prediction accuracy. Based on this optimization, the number of decision trees to include in the random forest (i.e., the number of estimators) was set to 25 and the maximum depth of the tree branches was set to 5; the resulting random forest was used for the construction of phenotypes described below. Given that the random forest technique provides embedded feature selection, no pre-modeling feature selection was employed.
Predictive patterns: “phenotypes”
We extracted the most predictive tree branches from the Random Forest obtained by our ML modeling. Each of these tree branches consists of a combination of baseline markers (such as participant features or study variables) that is highly predictive of response to treatment at 8-weeks. We call these patterns “phenotypes”. Each of these phenotypes can be represented as an IF-THEN rule of the following type:
IF [set of conditions] THEN [response prediction].
where “set of conditions” consists of one or more conditions on participant features (e.g., Gait Speed > 0.6); and the response prediction is either “yes” (i.e., clinically significant response to treatment) or “no” (i.e., no clinically significant response to treatment). The order in which these conditions appear in the phenotype corresponds to the predictive importance of the conditions, with the first condition being the most important in the prediction.
Metrics used to measure individual phenotype predictive performance: precision and sensitivity
Each IF-THEN phenotype makes only one type of prediction, either “yes” (i.e., clinically significant response) or “no” (i.e., not clinically significant response) for all the participants who satisfy the set of conditions in the phenotype. For example, the fake rule: IF Gait Speed > 0.6 THEN predict clinically significant improvement predicts clinically significant improvement for all participants whose gait speed is greater than 0.6, but it remains silent about the outcome of participants with gait speed ≤ 0.6. Hence, metrics such as accuracy, area under the Receiver Operating Characteristic (ROC) curve, AUC, and specificity are not appropriate to measure the predictive performance of an IF-THEN phenotype. We consider instead two performance metrics, precision and recall, that best describe the predictive performance of these phenotypes:
Precision: Percentage of correct predictions among all predictions made by the phenotype. In our case, this is the percentage of participants with the same outcome as the THEN-part of phenotype among participants who satisfy the condition(s) on the IF-part of the phenotype.
Sensitivity (also called “Recall”): Percentage of correct predictions made by the phenotype among those whose outcome is the same as that on the THEN-part of the phenotype. In our case, this is the percentage of participants who satisfy the conditions on the IF-part of the phenotype among all participants with the same outcome as the THEN-part of phenotype.
Precision is our main metric to measure the predictive performance of single phenotypes. We ranked decision tree branches in the random forest in descending order of precision, breaking ties using length of the branch (shorter branches are preferable) and sensitivity.
Results
Markers predictive of response: feature importance
This section presents individual features that were deemed important by the Random Forest models in the prediction of the binarized intervention response. Figure 1 depicts the top 10 features identified by Random Forests as significant for predicting the RMDQ response to the mindfulness intervention. Each of these features appears frequently in the decision trees of the Random Forest model. Each of these features is not a good predictor of outcome by itself but is instead a significant contributor to combinations of features that together predict outcome. The following sections focus on analyzing the tree branches in the Random Forest to identify combinations of features that together have high predictive power.
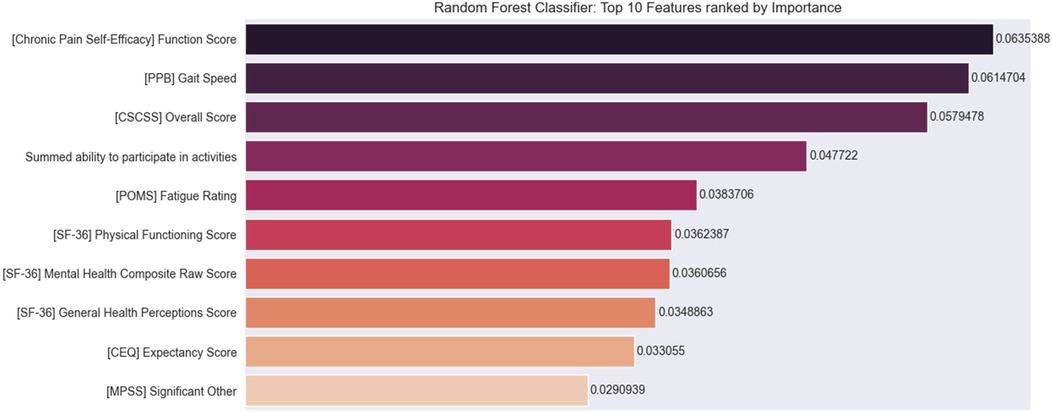
Figure 1. Top 10 features for predicting binary response to intervention. Chronic Pain Self-Efficacy (CPSE) function score; PPB (Short Physical Performance Battery) gait speed score; CSCSS (Catastrophizing Scale of the Cognitive Strategies Questionnaire) overall score; summed ability to participate in activities; POMS (Profile of Mood States) fatigue rating score; SF 36 (Short-Form Health Survey) physical functioning score; mental health composite score, and general health perception score; CEQ (Credibility Expectancy Questionnaire) expectancy score; and MPSS (Multidimensional Scale of Perceived Social Support) significant other score.
Combinations of markers predictive of response: phenotypes
This section presents the top ranking IF-THEN phenotypes identified with Random Forests to predict whether the change in Roland-Morris score from baseline to 8-weeks was a clinically significant improvement (i.e., Δrmscore > 4 for responders) or not (i.e., Δrmscore ≤ 4 for non-responders).
Top 3 responder phenotypes
Responder phenotype 1 improvement in Roland Morris with MBSR
IF ([POMS Profile of Mood States] Fatigue Subscore) ≤ 1.2 and ([CPSE Chronic Pain Self-Efficacy] Function Subscore) > 75 and ([SF-36 Quality of Life] General Health Perception Subscore)> 45.5 and ([MPSS Multidimensional Scale of Perceived Social Support] Total Score) ≤ 6 and ([FABQ Fear Avoidance and Beliefs Questionnaire] Total Score) > 1.5 THEN predict clinically significant improvement (see Figures 2, 3).
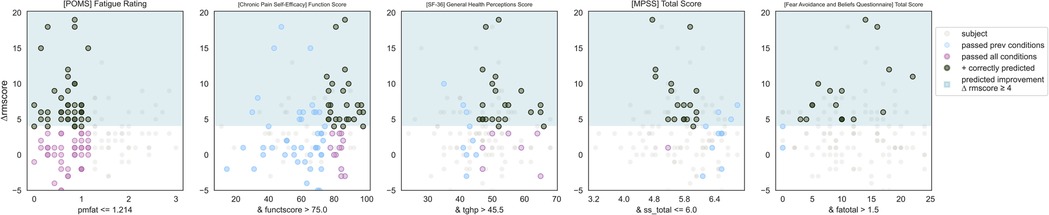
Figure 2. Responder phenotype 1 scatter plots. Each scatter plot corresponds to one phenotype condition and depicts the phenotype condition values on the x-axis vs. the outcome (ΔRMscore) values on the y-axis. Scatter plots are presented in the same order of condition importance within a phenotype from left to right. Data points represent all intervention participants in the dataset.
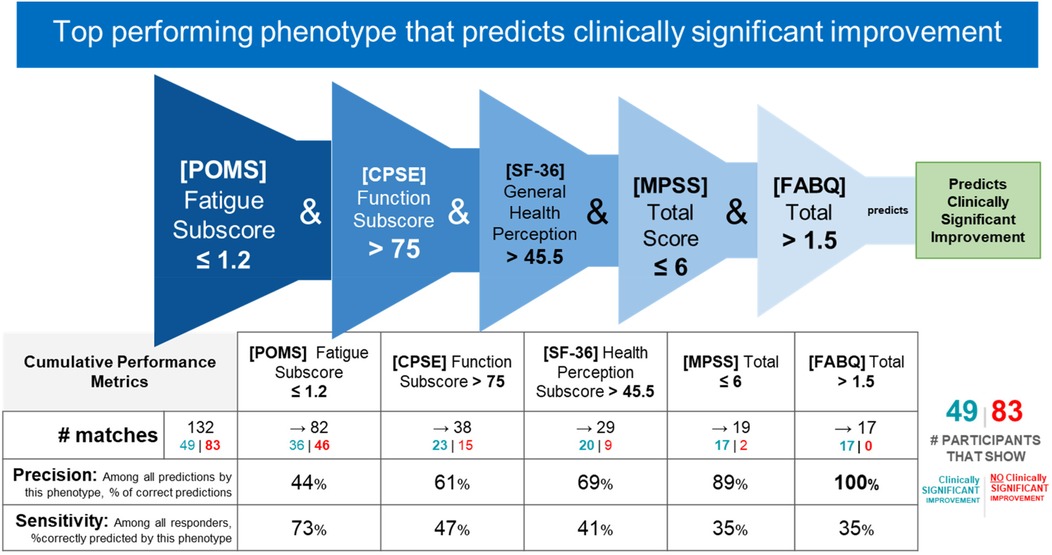
Figure 3. Responder phenotype 1 conditions and performance metrics. The 2nd column shows the precision and sensitivity values of the 1st phenotype condition; each subsequent column shows the precision and sensitivity values of the combined conditions from the 1st condition to that of the current column. Hence, the last column presents the total precision and sensitivity of the phenotype.
Prediction performance metrics
Counts of participants who satisfy the phenotype conditions: 17 split as 17 with clinically significant response + 0 with no clinically significant response.
• Precision = 17/17 (100%)
• Sensitivity = 17/49 (35%)
Responder phenotype 1 summary
This phenotype predicts with 100% precision that a study participant with low back pain with the following characteristics will respond to MBSR: having low fatigue, having high self-efficacy around performing daily activities despite chronic pain (function), perceiving their general health as relatively good, having any except for the highest level of social support, and greater than minimal fear and avoidance of physical activity and work.
Responder phenotype 2 improvement in Roland Morris with MBSR
IF ([PPB Short Physical Performance Battery] Gait Speed) > 0.6 and ([POMS Profile of Mood States] Vigor Score) ≤ 3.25 and ([MPSS Multidimensional Scale of Perceived Social Support] Significant Other score) ≤ 6.9 and ([CSCSS Catastrophizing Scale of the Cognitive Strategies Questionnaire] Overall Score) ≤ 0.6 and ([PNRS Pain Numeric Rating] Best Recent Pain Level) > 10.5 THEN predict clinically significant improvement (see Figures 4, 5).
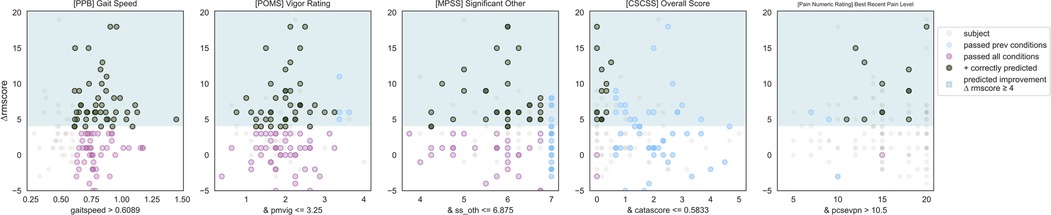
Figure 4. Responder phenotype 2 scatter plots. Each scatter plot corresponds to one phenotype condition and depicts the phenotype condition values on the x-axis vs. the outcome (ΔRMscore) values on the y-axis. Scatter plots are presented in the same order of condition importance within a phenotype from left to right. Data points represent all intervention participants in the dataset.
![Flowchart illustrating the second top-performing phenotype predicting clinically significant improvement. It involves five criteria: [PPB] Gait Speed > 0.6, [POMS] Vigor Score ≤ 3.25, [MPSS] Significant Other Subscore ≤ 6.9, [CSCSS] Overall Score ≤ 0.6, and [PNR] Best Recent Pain Level > 10.5. The outcome is clinically significant improvement. A table shows performance metrics, including 132 matches with 43% precision and 82% sensitivity. Of these, 49 participants showed improvement, while 83 did not.](https://www.frontiersin.org/files/Articles/1679570/fmscd-03-1679570-HTML/image_m/fmscd-03-1679570-g005.jpg)
Figure 5. Responder phenotype 2 conditions and performance metrics. The 2nd column shows the precision and sensitivity values of the 1st phenotype condition; each subsequent column shows the precision and sensitivity values of the combined conditions from the 1st condition to that of the current column. Hence, the last column presents the total precision and sensitivity of the phenotype.
Prediction performance metrics
Counts of participants who satisfy the phenotype conditions: 13 split as 12 with clinically significant response + 1 with no clinically significant response.
• Precision = 12/13 (92%)
• Sensitivity = 12/49 (24%)
Responder phenotype 2 summary
This phenotype predicts with 92% precision that an individual with the following characteristics will respond to MBSR: normal or slower gait speed, having a moderate or less vigor score, having any except for the highest value of social support from their significant other, extremely low to no catastrophizing, experiencing moderate or greater levels of pain.
Responder phenotype 3 in Roland Morris with MBSR
IF ([SF-36 Quality of Life] Mental Health Composite Raw Score) ≤ 50.5 and ([MPSS Multidimensional Scale of Perceived Social Support] Total Score) ≤ 6 and ([CPSE Chronic Pain Self-Efficacy] Function Score) > 75.6 and ([CEQ Credibility Expectancy Questionnaire] Credibility Expectancy Score) ≤ 1.6 and ([SF-36 Quality of Life] General Health Perception Subscore)> 45 THEN predict clinically significant improvement (see Figures 6, 7).
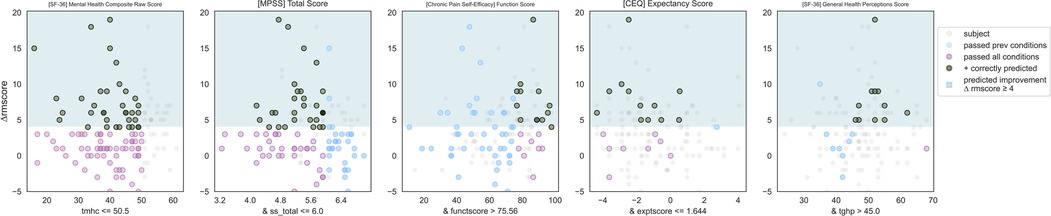
Figure 6. Responder phenotype 3 scatter plots. Each scatter plot corresponds to one phenotype condition and depicts the phenotype condition values on the x-axis vs. the outcome (ΔRMscore) values on the y-axis. Scatter plots are presented in the same order of condition importance within a phenotype from left to right. Data points represent all intervention participants in the dataset.
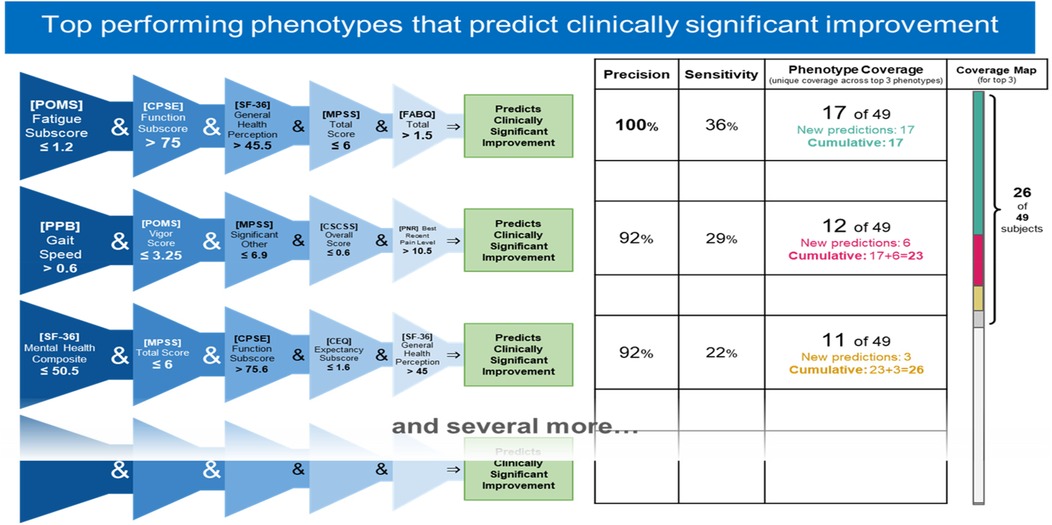
Figure 7. Top 3 performing responder phenotypes. The rightmost column shows the coverage of each phenotype (the number of responders correctly identified by the phenotype) as well as the cumulative phenotype coverage (the number of single responders identified by the 1st phenotype, by the 1st and 2nd phenotypes, and by the 1st, 2nd, and 3rd phenotypes).
Prediction performance metrics
Counts of participants who satisfy the phenotype conditions: 12 split as 11 with clinically significant response + 1 with no clinically significant response.
• Precision = 11/12 (92%)
• Sensitivity = 11/49 (22%)
Responder phenotype 3 summary
This phenotype predicts with 92% precision that an individual with the following characteristics will respond to MBSR: having less than average self-perceived mental health, having any except for the highest level of social support, having high self-efficacy about the ability to function through chronic pain, having moderate or lower expectancy around treatment outcomes, and perceiving their general health as relatively good.
Top non-responder phenotypes
Phenotype 1 predicting no clinically significant improvement in Roland Morris with MBSR
IF ([CPSE Chronic Pain Self-Efficacy] Function Subscore) ≤ 57.2 and ([SF-36 Quality of Life] Global Health Composite Raw Score) ≤ 45.5 and ([PPB Short Physical Performance Battery] Gait Speed) ≤ 0.8 and ([SF-36 Quality of Life] Energy/Fatigue Subscore) > 31.5 and ([CPAQ Chronic Pain Acceptance Questionnaire] Total Score)≤ 85.5 THEN predict no clinically significant improvement (see Figures 8, 9).
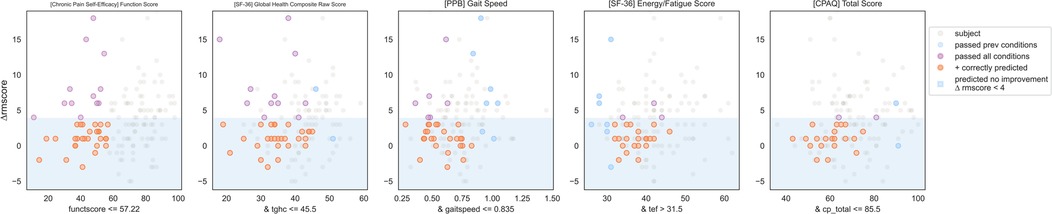
Figure 8. Non-responder phenotype 1 scatter plots. Each scatter plot corresponds to one phenotype condition and depicts the phenotype condition values on the x-axis vs. the outcome (ΔRMscore) values on the y-axis. Scatter plots are presented in the same order of condition importance within a phenotype from left to right. Data points represent all intervention participants in the dataset.
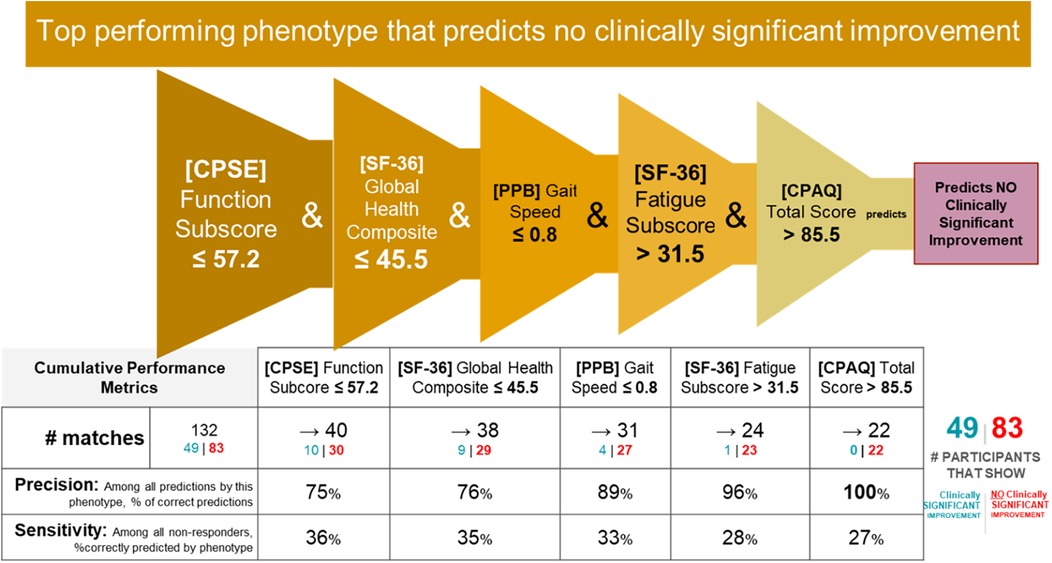
Figure 9. Non-responder phenotype 1 conditions and performance metrics. The 2nd column shows the precision and sensitivity values of the 1st phenotype condition; each subsequent column shows the precision and sensitivity values of the combined conditions from the 1st condition to that of the current column. Hence, the last table column presents the total precision and sensitivity of the phenotype.
Prediction performance metrics
Counts of participants who satisfy the phenotype conditions: 22 split as 0 with clinically significant response + 22 with no clinically significant response.
• Precision = 22/22 (100%)
• Sensitivity = 22/83 (27%)
Non-responder phenotype 1 summary
This phenotype predicts with 100% precision that an individual with the following characteristics will not response to MBSR: having moderate or lower self-efficacy around performing daily activities despite chronic pain (function), moderate or lower self-perception of physical and mental health, having a gait speed that limits their ambulation in the community setting, having clinically meaningful fatigue with moderate impairment, and moderate or lower pain acceptance.
Phenotype 2 predicting no clinically significant improvement in Roland Morris with MBSR
IF ([POMS Profile of Mood States] Vigor Score) ≤ 3.2 and ([SF-36 Quality of Life] Global Health Composite Raw Score) ≤ 45.5 and ([CPSE Chronic Pain Self-Efficacy] Pain Score) > 39 and ([MPSS Multidimensional Scale of Perceived Social Support] Family Subscore) > 6.4 THEN predict no clinically significant improvement (see Figures 10, 11).
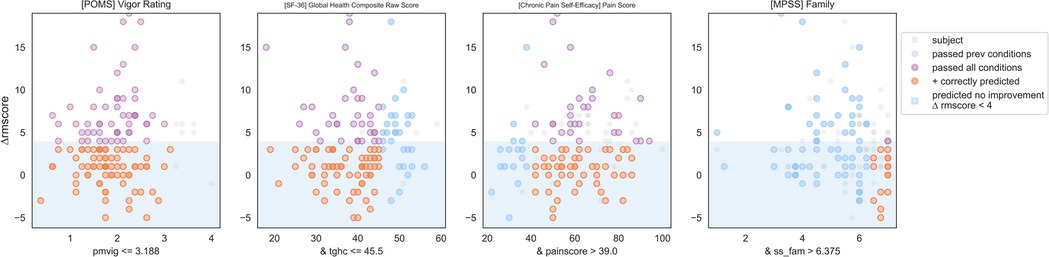
Figure 10. Non-responder phenotype 2 scatter plots. Each scatter plot corresponds to one phenotype condition and depicts the phenotype condition values on the x-axis vs. the outcome (ΔRMscore) values on the y-axis. Scatter plots are presented in the same order of condition importance within a phenotype from left to right. Data points represent all intervention participants in the dataset.
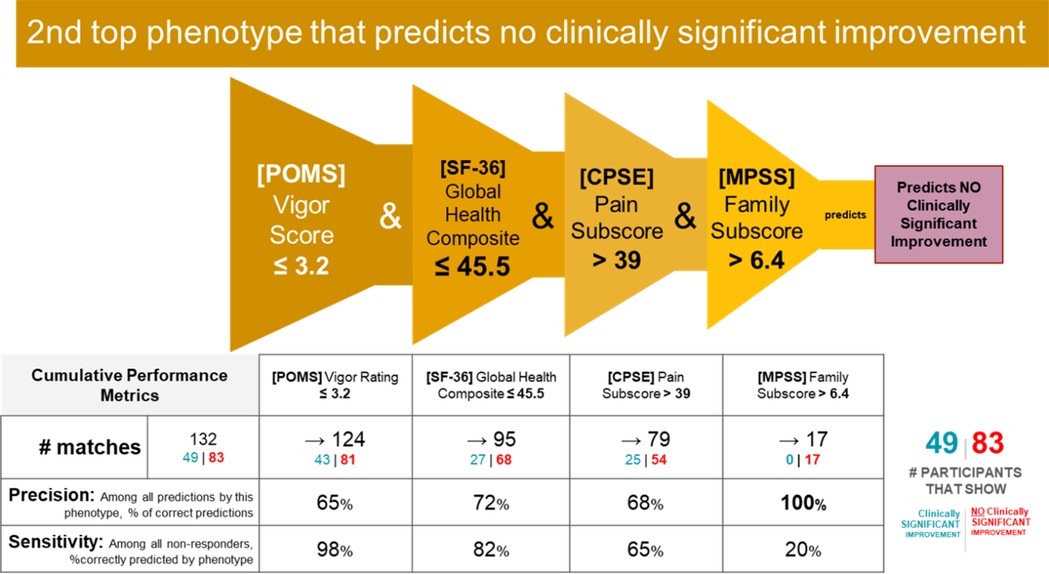
Figure 11. Non-responder phenotype 2 conditions and performance metrics. The 2nd column shows the precision and sensitivity values of the 1st phenotype condition; each subsequent column shows the precision and sensitivity values of the combined conditions from the 1st condition to that of the current column. Hence, the last column presents the total precision and sensitivity of the phenotype.
Prediction performance metrics
Counts of participants who satisfy the phenotype conditions: 17 split as 0 with clinically significant response + 17 with no clinically significant response.
• Precision = 17/17 (100%)
• Sensitivity = 17/83 (20%)
Non-response phenotype 2 summary
This phenotype predicts with 100% precision that an individual with the following characteristics will not response to MBSR: having moderate or lower vigor, having average or lower physical and mental health, having moderate or higher self-efficacy around living with chronic pain, and having a high degree of social support from family.
Phenotype 3 predicting not clinically significant improvement in Roland Morris with MBSR
IF ([MPSS Multidimensional Scale of Perceived Social Support] Family Subscore) > 6.6 and ([SF-36 Quality of Life] General Health Perceptions Score)> 30.5 and ([CPSE Chronic Pain Self-Efficacy] Function Score) ≤ 86.7 and ([SF-36 Quality of Life] Global Health Composite Raw Score) ≤ 45.5 THEN predict no clinically significant improvement (see Figures 12, 13).
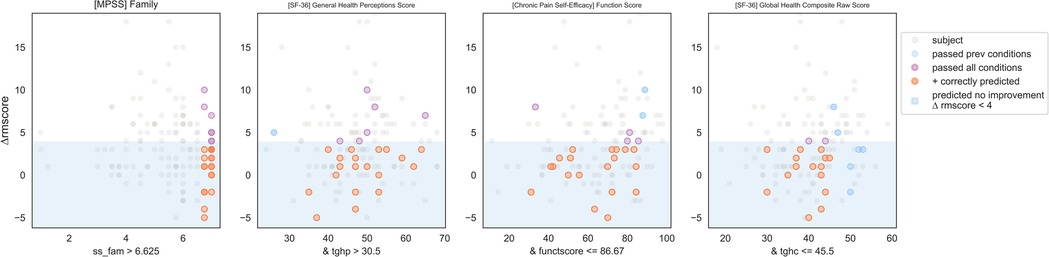
Figure 12. Non-responder phenotype 1 scatter plots. Each scatter plot corresponds to one phenotype condition and depicts the phenotype condition values on the x-axis vs. the outcome (ΔRMscore) values on the y-axis. Scatter plots are presented in the same order of condition importance within a phenotype from left to right. Data points represent all intervention participants in the dataset.
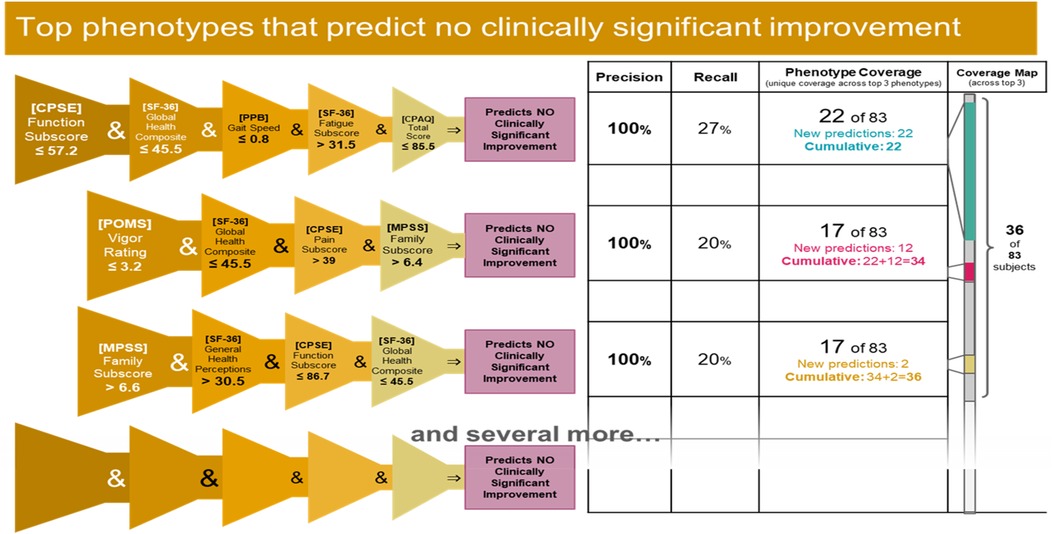
Figure 13. Top 3 performing Non-responder phenotypes. The rightmost column shows the coverage of each phenotype (the number of non-responders correctly identified by the phenotype) as well as the cumulative phenotype coverage (the number of single non-responders identified by the 1st phenotype, by the 1st and 2nd phenotypes, and by the 1st, 2nd, and 3rd phenotypes).
Prediction performance metrics
Counts of participants who satisfy the phenotype conditions: 17 split as 0 with clinically significant response + 17 with no clinically significant response.
• Precision = 17/17 (100%)
• Sensitivity = 17/83 (20%)
Non-response phenotype 3 summary
This phenotype predicts with 100% precision that an individual with the following characteristics will not response to MBSR: having a high degree of social support from family, self-perceiving their general health as moderate or high, having a wide range except for the highest level of self-efficacy around functioning with pain, and having a moderate or lower perception of physical and mental health.
Discussion
Overall summary and performance
The present analyses demonstrate the utility of machine learning approaches for accurately identifying responders and non-responders to mindfulness for cLBP. This was achieved through constructing predictive phenotypes encompassing clusters of relevant characteristics. Three responder phenotypes covered over 50% of the responders with 92%–100% precision, and three non-responder phenotypes covered 43% of non-responders with 100% precision. This required only four-to-five variables, where precision was still 80%–100% with four variables. Our results can be used to inform future related studies and patient and clinician decision making on mindfulness interventions for chronic pain to maximize clinical efficacy, patient outcomes, and resource use.
It is important to emphasize that the goal of this analysis was to uncover combinations of factors that are predictive of response or non-response to MBSR treatment. We have presented here only the top 3 phenotypes for each case, as they suffice to illustrate our approach. In general, each tree branch in the Random Forest represents a phenotype (with its own precision and sensitivity) and although each branch is likely to have small coverage, it is possible to select a sufficiently large collection (ensemble) of tree branches that collectively cover all data instances.
Contributions to predictive ML studies of chronic pain
While there is robust literature on the use of ML to predict pain levels in general, studies predicting the response to interventions for pain reduction, especially complementary interventions, are limited. Furthermore, most investigations focus on identifying individual or groups of predictive factors rather than specific phenotypes. Phenotypes add granularity around not only specific clusters of features, but also thresholds above or below which a particular feature becomes meaningful. The current phenotype development therefore provides enhancements in both specificity and accuracy compared to many earlier studies, increasing reliability and confidence in related clinician and/or patient decision making. In clinical settings, if a patient closely matches a certain highly-predictive phenotype, this could be a strong indicator that mindfulness is a favorable option for that individual. Similarly, if a patient matches multiple phenotypes, this would additionally increase confidence in likelihood of response. The presented methods can also be easily applied to other populations and/or types of interventions to derive similar specificity and accuracy and integrated into automated algorithms to guide decision-making.
Responder phenotypes
Common responder attributes found in multiple phenotypes consisted of high chronic pain self-efficacy, moderate to high perceptions of overall health, any except for the highest level of social support, and low treatment expectancy. Other attributes included low fatigue and catastrophizing, low to moderate perceived mental health, and moderate or greater recent pain level. Taken together, this suggests that individuals who respond to mindfulness are, at baseline, more confident in their ability to manage their own pain, perceive themselves to be in good health, have some social support, and do not have high expectations of the mindfulness intervention.
The high self-efficacy and perception of overall health may indicate that responders have the motivation and optimism necessary for a behavioral intervention such as mindfulness to work (47). Although treatment expectancy plays a significant role in how individuals respond to mindfulness-based interventions (MBIs) for pain relief, where positive expectations about the effectiveness of mindfulness can contribute to greater pain reduction (48, 49), the lack of high expectations in the present responder phenotypes may make it less likely they will be disappointed in the treatment outcome. In some phenotypes, this is associated with low fatigue and catastrophizing, not surprising given the internal motivation and optimism necessary for mindfulness-based interventions to have significant effects (50). Furthermore, the relationship between mindfulness and back pain-associated disability may be mediated by catastrophizing (51).
An enhanced ability to identify responders to mindfulness interventions for cLBP has clinical implications for patients and providers. This is because by identifying a patient's phenotype the provider can advise a mindfulness treatment to those patients most likely to benefit from it. This would potentially accelerate rate of symptom improvement and lower chances of progression to higher risk interventions since patients are most likely to respond to mindfulness based on their phenotype. For example, it could mean reduced need for surgery and/or opioids. Additionally, a general increased awareness of predictors of a positive response to mindfulness interventions among providers may increase referrals to these effective, low-risk treatments. The phenotypes could potentially be disseminated to clinicians via a checklist.
Non-responder phenotypes
Common non-responder attributes identified in multiple phenotypes consisted of moderate to low chronic pain self-efficacy, moderate to low perception of overall health, and the highest level of social support from family. Other attributes included slow gait, low vigor, and moderate or lower chronic pain acceptance. The low pain self-efficacy may be indicative of an inability to take advantage of beneficial aspects of mindfulness related to improved self-care (52, 53). Lower perception of overall health and low pain acceptance in the non-responder phenotypes could indicate general health related pessimism and inability to benefit from the acceptance elements of mindfulness for chronic pain (54, 55). Self-efficacy and pain acceptance are associated with mindfulness attributes, and self-efficacy may mediate the relationship between mindfulness and emotion regulation (56). The common presence of social support from family in the non-responder phenotypes could indicate that individuals with social support from relatives (possibly beyond that of a significant other) may not benefit from social support aspects of mindfulness interventions.
The ability to accurately identify non-responders to mindfulness for cLBP presents multiple distinct benefits. In addition to directing treatment away from those least likely to benefit from these often time- and resource-intensive interventions, it can be used to identify non-responder populations and to inform adjunct interventions or tailor the mindfulness programming to potentially address the causes, moderators, and/or mediators of non-responsiveness. In this vein, if a patient closely matches one or more non-response phenotypes, then the clinical goal might shift toward first addressing any modifiable factors that predict non-response to improve the patient's suitability for mindfulness treatment. For example, if it is determined that low pain self-efficacy inhibits a positive response to mindfulness, the intervention could be modified to increase the emphasis on improving self-efficacy, either before or in parallel with the mindfulness.
Strengths, limitations, and future work
These results make a novel contribution to the field and forward the goal of achieving a personalized and precise understanding of response to mindfulness for chronic pain. Nonetheless, while the present analyses successfully and accurately identified predictive phenotypes with high precision and good sensitivity, the intervention sample was still modest in size and comprised of older adults. Further comparative and validation work is needed to determine how well these and similar phenotypes can predict response or non-response in other relevant at-risk clinical populations. An increased emphasis on the trajectory of predictors (change over time in addition to baseline values) would provide further insight into how to address the lack of response to mindfulness for chronic pain, including through identifying potential pre-intervention targets for intervention. That is, modifying certain features that are predictive of non-response may increase someone's likelihood that mindfulness would subsequently be effective for reducing pain. We also did not have access to various other types of data, such as physical activity, neural activity or blood-based biomarkers, which could improve precision and/or sensitivity. Ongoing and future work should capitalize on other data modalities including activity and sleep sensors, omics, and neuroimaging as well as train models with larger clinical datasets. These additions would augment the robustness of machine learning approaches for identifying useful clusters of predictive characteristics.
Conclusions
Results from this machine learning based phenotyping provide an integrated portrait of responders and non-responders. These phenotypes—and those that may emerge from using machine learning in other datasets, can meaningfully inform clinician and patient decision making to ultimately promote better pain outcomes for patients with chronic pain. Clinical support tools can be imbedded in many types of clinical workflows such as through screening tools, and electronic health record algorithms to flag patients. If clinicians can identify specific patient characteristics, they can better predict who responds to MBSR and who has increased risk of treatment for their cLBP with MBSR. Among these preliminary phenotypes, three variables appear in 5 out of 6 of our top phenotypes and that could be candidates in a decision-making clinical tool (chronic pain self-efficacy, perceived quality of life, social support). This work can also more broadly inform research and development of mindfulness-based treatments for pain and advance the central goal of personalized, complementary pain management.
Data availability statement
The data analyzed in this study is subject to the following licenses/restrictions: the present data were provided to WPI through a data use agreement. Requests to access these datasets should be directed toTmF0YWxpYS5Nb3JvbmVAYm1jLm9yZw==.
Ethics statement
The studies involving humans were approved by Worcester Polytechnic Institute IRB board. The studies were conducted in accordance with the local legislation and institutional requirements. Written informed consent for participation was not required from the participants or the participants' legal guardians/next of kin in accordance with the national legislation and institutional requirements.
Author contributions
AS: Data curation, Formal analysis, Methodology, Validation, Visualization, Writing – original draft, Writing – review & editing. AI: Conceptualization, Writing – original draft, Writing – review & editing, Investigation. BN: Conceptualization, Writing – original draft, Writing – review & editing, Funding acquisition, Project administration, Supervision. PG: Funding acquisition, Investigation, Methodology, Validation, Writing – original draft, Writing – review & editing. JK: Conceptualization, Funding acquisition, Supervision, Writing – original draft, Writing – review & editing. NM: Data curation, Funding acquisition, Project administration, Supervision, Writing – original draft, Writing – review & editing. CR: Conceptualization, Data curation, Formal analysis, Funding acquisition, Investigation, Methodology, Project administration, Validation, Writing – original draft, Writing – review & editing.
Funding
The author(s) declare that financial that support was received for the research and/or publication of this article. This study was funded by NIH NINDS grant UG3NS135168 Impact: Integrative Mindfulness-Based Predictive Approach for Chronic Low Back Pain Treatment and NIH NIA grant R01 AG034078-01.
Conflict of interest
The authors declare that the research was conducted in the absence of any commercial or financial relationships that could be construed as a potential conflict of interest.
The author(s) declared that they were an editorial board member of Frontiers, at the time of submission. This had no impact on the peer review process and the final decision.
Generative AI statement
The author(s) declare that no Generative AI was used in the creation of this manuscript.
Any alternative text (alt text) provided alongside figures in this article has been generated by Frontiers with the support of artificial intelligence and reasonable efforts have been made to ensure accuracy, including review by the authors wherever possible. If you identify any issues, please contact us.
Publisher's note
All claims expressed in this article are solely those of the authors and do not necessarily represent those of their affiliated organizations, or those of the publisher, the editors and the reviewers. Any product that may be evaluated in this article, or claim that may be made by its manufacturer, is not guaranteed or endorsed by the publisher.
References
1. Meucci RD, Fassa AG, Faria NM. Prevalence of chronic low back pain: systematic review. Rev Saude Publica. (2015) 49:1. doi: 10.1590/S0034-8910.2015049005874
2. Ferreira ML, De Luca K, Haile LM, Steinmetz JD, Culbreth GT, Cross M, et al. Global, regional, and national burden of low back pain, 1990–2020, its attributable risk factors, and projections to 2050: a systematic analysis of the global burden of disease study 2021. The Lancet Rheumatology. (2023) 5:e316–29. doi: 10.1016/S2665-9913(23)00098-X
3. Fullen B, Morlion B, Linton SJ, Roomes D, Van Griensven J, Abraham L, et al. Management of chronic low back pain and the impact on patients’ personal and professional lives: results from an international patient survey. Pain Pract. (2022) 22:463–77. doi: 10.1111/papr.13103
4. The Lancet R. The global epidemic of low back pain. Lancet Rheumatology. (2023) 5:e305. doi: 10.1016/S2665-9913(23)00133-9
5. Hauk L. Low back pain: american college of physicians practice guideline on noninvasive treatments. Am Fam Physician. (2017) 96:407–8.28925633
6. Korownyk CS, Montgomery L, Young J, Moore S, Singer AG, Macdougall P, et al. PEER Simplified chronic pain guideline: management of chronic low back, osteoarthritic, and neuropathic pain in primary care. Can Fam Physician. (2022) 68:179–90. doi: 10.46747/cfp.6803179
7. Volkow ND, Blanco C. The changing opioid crisis: development, challenges and opportunities. Mol Psychiatry. (2021) 26:218–33. doi: 10.1038/s41380-020-0661-4
8. Post LA, Ciccarone D, Unick GJ, D’onofrio G, Kwon S, Lundberg AL, et al. Decline in US drug overdose deaths by region, substance, and demographics. JAMA Network Open. (2025) 8:e2514997–e2514997. doi: 10.1001/jamanetworkopen.2025.14997
9. Lin TH, Tam KW, Yang YL, Liou TH, Hsu TH, Rau CL. Meditation-Based therapy for chronic low back pain management: a systematic review and meta-analysis of randomized controlled trials. Pain Med. (2022) 23:1800–11. doi: 10.1093/pm/pnac037
10. Anheyer D, Haller H, Barth J, Lauche R, Dobos G, Cramer H. Mindfulness-Based stress reduction for treating low back pain: a systematic review and meta-analysis. Ann Intern Med. (2017) 166:799–807. doi: 10.7326/M16-1997
11. Cherkin DC, Sherman KJ, Balderson BH, Cook AJ, Anderson ML, Hawkes RJ, et al. Effect of mindfulness-based stress reduction vs cognitive behavioral therapy or usual care on back pain and functional limitations in adults with chronic low back pain: a randomized clinical trial. JAMA. (2016) 315:1240–9. doi: 10.1001/jama.2016.2323
12. Cherkin DC, Anderson ML, Sherman KJ, Balderson BH, Cook AJ, Hansen KE, et al. Two-Year follow-up of a randomized clinical trial of mindfulness-based stress reduction vs cognitive behavioral therapy or usual care for chronic low back pain. JAMA. (2017) 317:642–4. doi: 10.1001/jama.2016.17814
13. Moldovan F, Moldovan L. A modeling study for hip fracture rates in Romania. J Clin Med. (2025) 14:31–62. doi: 10.3390/jcm14093162
14. Kjeldgaard HK, Holvik K, Abrahamsen B, Tell GS, Meyer HE, O'flaherty M. Explaining declining hip fracture rates in Norway: a population-based modelling study. Lancet Reg Health Eur. (2023) 30:100643. doi: 10.1016/j.lanepe.2023.100643
15. Dunn KM, Campbell P, Lewis M, Hill JC, Van Der Windt DA, Afolabi E, et al. Refinement and validation of a tool for stratifying patients with musculoskeletal pain. Eur J Pain. (2021) 25:2081–93. doi: 10.1002/ejp.1821
16. Yazdanirad S, Pourtaghi G, Raei M, Ghasemi M. Development of modified rapid entire body assessment (MOREBA) method for predicting the risk of musculoskeletal disorders in the workplaces. BMC Musculoskelet Disord. (2022) 23:82. doi: 10.1186/s12891-022-05011-7
17. Papadomanolakis-Pakis N, Uhrbrand P, Haroutounian S, Nikolajsen L. Prognostic prediction models for chronic postsurgical pain in adults: a systematic review. Pain. (2021) 162:2644–57. doi: 10.1097/j.pain.0000000000002261
18. Matsangidou M, Liampas A, Pittara M, Pattichi CS, Zis P. Machine learning in pain medicine: an up-to-date systematic review. Pain Ther. (2021) 10:1067–84. doi: 10.1007/s40122-021-00324-2
19. Mari T, Henderson J, Maden M, Nevitt S, Duarte R, Fallon N. Systematic review of the effectiveness of machine learning algorithms for classifying pain intensity, phenotype or treatment outcomes using electroencephalogram data. J Pain. (2022) 23:349–69. doi: 10.1016/j.jpain.2021.07.011
20. Wu H, Chen Z, Gu J, Jiang Y, Gao S, Chen W, et al. Predicting chronic pain and treatment outcomes using machine learning models based on high-dimensional clinical data from a large retrospective cohort. Clin Ther. (2024) 46:490–8. doi: 10.1016/j.clinthera.2024.04.012
21. Morone NE, Greco CM, Moore CG, Rollman BL, Lane B, Morrow LA, et al. A mind-body program for older adults with chronic low back pain: a randomized clinical trial. JAMA Intern Med. (2016) 176:329–37. doi: 10.1001/jamainternmed.2015.8033
22. Morone NE, Greco CM, Rollman BL, Moore CG, Lane B, Morrow L, et al. The design and methods of the aging successfully with pain study. J Contemporary Clinical Trials. (2012) 33:417–25. doi: 10.1016/j.cct.2011.11.012
23. Kabat-Zinn J. Mindfulness-Based interventions in context: past, present, and future. Clinical Psychology: Science and Practice. (2003) 10:144–56. doi: 10.1093/clipsy.bpg016
24. Kabat-Zinn J, Hanh TN. Full catastrophe living: Using the wisdom of your body and mind to face stress, pain, and illness, Delta (2009).
25. Folstein MF, Folstein SE, Mchugh PR. Mini-mental state”: a practical method for grading the cognitive state of patients for the clinician. J Psychiatr Res. (1975) 12:189–98. doi: 10.1016/0022-3956(75)90026-6
26. Roland M, Morris R. A study of the natural history of back pain: part I: development of a reliable and sensitive measure of disability in low-back pain. Spine. (1983) 8:141–4. doi: 10.1097/00007632-198303000-00004
27. Yesavage JA, Brink TL, Rose TL, Lum O, Huang V, Adey M, et al. Development and validation of a geriatric depression screening scale: a preliminary report. J Psych Res. (1982) 17:37–49. doi: 10.1016/0022-3956(82)90033-4
28. Kovacs FM, Abraira V, Royuela A, Corcoll J, Alegre L, Cano A, et al. Minimal clinically important change for pain intensity and disability in patients with nonspecific low back pain. Spine. (2007) 32:2915–20. doi: 10.1097/BRS.0b013e31815b75ae
29. Herr KA, Spratt K, Mobily PR, Richardson G. Pain intensity assessment in older adults: use of experimental pain to compare psychometric properties and usability of selected pain scales with younger adults. Clin J Pain. (2004) 20:207–19. doi: 10.1097/00002508-200407000-00002
30. Kriska AM, Knowler WC, Laporte RE, Drash AL, Wing RR, Blair SN, et al. Development of questionnaire to examine relationship of physical activity and diabetes in pima Indians. Diabetes Care. (1990) 13:401–11. doi: 10.2337/diacare.13.4.401
31. Hays RD, Morales LS. The RAND-36 measure of health-related quality of life. Ann Med. (2001) 33:350–7. doi: 10.3109/07853890109002089
33. Magni G, Caldieron C, Rigatti-Luchini S, Merskey H. Chronic musculoskeletal pain and depressive symptoms in the general population. An analysis of the 1st national health and nutrition examination survey data. J Pain. (1990) 43:299–307. doi: 10.1016/0304-3959(90)90027-B
34. Bandura A. Recycling misconceptions of perceived self-efficacy. Cognit Ther Res. (1984) 8:231–55. doi: 10.1007/BF01172995
35. Anderson KO, Dowds BN, Pelletz RE, Edwards WT, Peeters-Asdourian C. Development and initial validation of a scale to measure self-efficacy beliefs in patients with chronic pain. J Pain. (1995) 63:77–83. doi: 10.1016/0304-3959(95)00021-J
36. Waddell G, Newton M, Henderson I, Somerville D, Main CJ. A fear-avoidance beliefs questionnaire (FABQ) and the role of fear-avoidance beliefs in chronic low back pain and disability. J Pain. (1993) 52:157–68. doi: 10.1016/0304-3959(93)90127-B
37. Mccracken LM, Vowles KE, Eccleston C. Acceptance of chronic pain: component analysis and a revised assessment method. J Pain. (2004) 107:159–66. doi: 10.1016/j.pain.2003.10.012
38. Rosenstiel AK, Keefe FJ. The use of coping strategies in chronic low back pain patients: relationship to patient characteristics and current adjustment. J Pain. (1983) 17:33–44. doi: 10.1016/0304-3959(83)90125-2
39. Brown KW, Ryan RM. The benefits of being present: mindfulness and its role in psychological well-being. J Pers Soc Psychol. (2003) 84:822. doi: 10.1037/0022-3514.84.4.822
40. Linn BS, Linn MW, Gurel L. Cumulative illness rating scale. J Am Geriatr Soc. (1968) 16:622–6. doi: 10.1111/j.1532-5415.1968.tb02103.x
41. Zimet GD, Dahlem NW, Zimet SG, Farley GK. The multidimensional scale of perceived social support. J Personality Assessment. (1988) 52:30–41. doi: 10.1207/s15327752jpa5201_2
42. Devilly GJ, Borkovec TD. Psychometric properties of the credibility/expectancy questionnaire. J Behav Ther Exp Psychiatry. (2000) 31:73–86. doi: 10.1016/S0005-7916(00)00012-4
43. Guralnik JM, Ferrucci L, Pieper CF, Leveille SG, Markides KS, Ostir GV, et al. Lower extremity function and subsequent disability: consistency across studies, predictive models, and value of gait speed alone compared with the short physical performance battery. J Gerontol A Biol Sci. (2000) 55:M221–31. doi: 10.1093/gerona/55.4.M221
44. Guralnik JM, Ferrucci L, Simonsick EM, Salive ME, Wallace RB. Lower-extremity function in persons over the age of 70 years as a predictor of subsequent disability. N Engl J Med. (1995) 332:556–62. doi: 10.1056/NEJM199503023320902
45. Guralnik JM, Simonsick EM, Ferrucci L, Glynn RJ, Berkman LF, Blazer DG, et al. A short physical performance battery assessing lower extremity function: association with self-reported disability and prediction of mortality and nursing home admission. J Gerontol. (1994) 49:M85–94. doi: 10.1093/geronj/49.2.M85
46. Rokach L. Ensemble-based classifiers. Artif Intell Rev. (2010) 33:1–39. doi: 10.1007/s10462-009-9124-7
47. Wright CJ, Schutte NS. The relationship between greater mindfulness and less subjective experience of chronic pain: mediating functions of pain management self-efficacy and emotional intelligence. Aust J Psychol. (2014) 66:181–6. doi: 10.1111/ajpy.12041
48. Peerdeman KJ, Van Laarhoven AI, Peters ML, Evers AW. An integrative review of the influence of expectancies on pain. Front Psychol. (2016) 7:1270. doi: 10.3389/fpsyg.2016.01270
49. Lopes A, Sampaio R, Tavares I. Pain, mindfulness, and placebo: a systematic review. Front Integr Neurosci. (2024) 18:1432270. doi: 10.3389/fnint.2024.1432270
50. Finan PH, Garland EL. The role of positive affect in pain and its treatment. Clin J Pain. (2015) 31:177–87. doi: 10.1097/AJP.0000000000000092
51. Cassidy EL, Atherton RJ, Robertson N, Walsh DA, Gillett R. Mindfulness, functioning and catastrophizing after multidisciplinary pain management for chronic low back pain. PAIN. (2012) 153:644–50. doi: 10.1016/j.pain.2011.11.027
52. Zeidan F, Vago DR. Mindfulness meditation-based pain relief: a mechanistic account. Ann N Y Acad Sci. (2016) 1373:114–27. doi: 10.1111/nyas.13153
53. Sawyer H. Mindfulness: strategies to implement targeted self-care. J Interprof Educ Pract. (2023) 31:100614. doi: 10.1016/j.xjep.2023.100614
54. Ploesser M, Martin D. Mechanism of action of mindfulness-based interventions for pain relief—a systematic review. J Integr Complement Med. (2024) 30:1162–78. doi: 10.1089/jicm.2023.0328
55. Kober H, Buhle J, Weber J, Ochsner KN, Wager TD. Let it be: mindful acceptance down-regulates pain and negative emotion. Soc Cogn Affect Neurosci. (2020) 14:1147–58. doi: 10.1093/scan/nsz104
56. Turner JA, Anderson ML, Balderson BH, Cook AJ, Sherman KJ, Cherkin DC. Mindfulness-based stress reduction and cognitive behavioral therapy for chronic low back pain: similar effects on mindfulness, catastrophizing, self-efficacy, and acceptance in a randomized controlled trial. Pain. (2016) 157:2434–44. doi: 10.1097/j.pain.0000000000000635
Keywords: machine learning, chronic low back pain, phenotyping, mindfulness, predictive modeling, precision medicine, non-pharmacological pain treatment
Citation: Soota A, Incollingo Rodriguez AC, Nephew BC, Gardiner P, King JA, Morone NE and Ruiz C (2025) Machine learning based phenotyping of the response to mindfulness for chronic low back pain. Front. Musculoskelet. Disord. 3:1679570. doi: 10.3389/fmscd.2025.1679570
Received: 4 August 2025; Accepted: 9 October 2025;
Published: 5 November 2025.
Edited by:
Maryse Fortin, Concordia University, CanadaReviewed by:
Jan Kubicek, VSB-Technical University of Ostrava, CzechiaLiviu Moldovan, George Emil Palade University of Medicine, Pharmacy, Sciences and Technology of Târgu Mureş, Romania
Benjamin Johnston, Mass General Brigham, United States
Copyright: © 2025 Soota, Incollingo Rodriguez, Nephew, Gardiner, King, Morone and Ruiz. This is an open-access article distributed under the terms of the Creative Commons Attribution License (CC BY). The use, distribution or reproduction in other forums is permitted, provided the original author(s) and the copyright owner(s) are credited and that the original publication in this journal is cited, in accordance with accepted academic practice. No use, distribution or reproduction is permitted which does not comply with these terms.
*Correspondence: Benjamin C. Nephew, YmNuZXBoZXdAYW9sLmNvbQ==