 Konstantinos Spiliotis
 Rüdiger Köhling
 Wolfram Just
 Jens Starke
- 1Institute of Mathematics, University of Rostock, Rostock, Germany
- 2Laboratory of Mathematics and Informatics (ISCE), Department of Civil Engineering, Democritus University of Thrace, Xanthi, Greece
- 3Oscar-Langendorff-Institute of Physiology, Rostock University Medical Center, Rostock, Germany
The striatum as part of the basal ganglia is central to both motor, and cognitive functions. Here, we propose a large-scale biophysical network for this part of the brain, using modified Hodgkin-Huxley dynamics to model neurons, and a connectivity informed by a detailed human atlas. The model shows different spatio-temporal activity patterns corresponding to lower (presumably normal) and increased cortico-striatal activation (as found in, e.g., obsessive-compulsive disorder), depending on the intensity of the cortical inputs. By applying equation-free methods, we are able to perform a macroscopic network analysis directly from microscale simulations. We identify the mean synaptic activity as the macroscopic variable of the system, which shows similarity with local field potentials. The equation-free approach results in a numerical bifurcation and stability analysis of the macroscopic dynamics of the striatal network. The different macroscopic states can be assigned to normal/healthy and pathological conditions, as known from neurological disorders. Finally, guided by the equation-free bifurcation analysis, we propose a therapeutic close loop control scheme for the striatal network.
1 Introduction and context
Complex dynamical systems of interacting units appear in nature across several disciplines. Examples of these systems are networks of coupled neurons in the brain, epidemiological networks of interacting individuals during a virus spreading, and social or economic networks of human action and perception. A common characteristic of these networks is the existence of well-defined rules for each individual entity, the so-called microscopic description, while the emergent network behaviour evolves on a different level, the macroscopic scale.
The macroscopic description, say, in the form of ordinary or partial differential equations, governs the time evolution of few macroscopic variables, which are often given by low order statistics such as densities or correlation functions. It is however very challenging, if possible at all, to derive such a macroscopic description from a microscopic model, without making assumptions about the connectivity of the system, see, e.g., (Kevrekidis and Samaey, 2009; Montbrió et al., 2015). In neuroscience, and specifically for brain networks, the microscopic description is based on the electrochemical activity of individual cells which is frequently modelled by Hodgkin-Huxley equations (Hodgkin and Huxley, 1952; Terman et al., 2002; Spiliotis et al., 2022b). These cell-neurons interact through synaptic connections, and the mathematical description results in large systems of coupled nonlinear differential equations. The heterogeneous connectivity, the nonlinear behaviour of each cell, and the stochastic environment are factors which increase the complexity of the emergent network behaviour. Existence of multiple stationary states, sustained oscillations (Deco et al., 2008; Spiliotis and Siettos, 2011; Deco et al., 2013), as well as travelling waves and spatio-temporal chaos (Laing and Chow, 2002; Bhattacharya et al., 2022; Palkar et al., 2023), are signatures of the rich nonlinear behaviour of neural networks at the macroscopic level (Deco et al., 2008; Spiliotis and Siettos, 2011; Crowell et al., 2012; Deco et al., 2013; de Santos-Sierra et al., 2014; Siettos and Starke, 2016; Spiliotis et al., 2022b).
In previous studies (Spiliotis et al., 2022a; Spiliotis et al., 2022b; Spiliotis et al., 2024) we developed a large-scale computational model of the basal ganglia network and thalamus to describe movement disorders and treatment effects of deep brain stimulation. The model of this complex network covers three areas of the basal ganglia region: the subthalamic nucleus, the globus pallidus, both pars externa and pars interna, and the thalamus and motor and pre-motor cortex. Macroscopic analysis of the network dynamics allowed us to study the differences in neural activation patterns that will emerge within the brain’s structural network when simulating different medical conditions. For example, our computational model suggests that spatio-temporal activity in the basal ganglia network shows travelling wave solutions with more varying structures in the normal state as compared to the Parkinsonian state, see (Spiliotis et al., 2022b). In addition, the macroscopic analysis yields optimal frequency ranges for deep brain stimulation as well as optimal positions for the electrodes (Spiliotis et al., 2022a).
In this work, we focus on the striatum, an essential intermediate area of the brain that connects cortical to deep brain regions. The striatum belongs to the basal ganglia area and orchestrates activities for controlling movement, decision-making, choosing actions, and those maximising reward and other psychological behaviours (Calabresi et al., 2007; Crittenden and Graybiel, 2011; Calabresi et al., 2014). The striatum integrates cortical signals to create motor activities based on experience and forthcoming selections. The significance of striatum functionality is also accentuated by its involvement in a vast number of neurological diseases ranging from Parkinson’s disease, Huntington’s disease, and dystonia to psychological disorders such as obsessive-compulsive disorder, depression, impulsivity, and attention-deficit hyperactivity disorder (Remijnse et al., 2006; Crittenden and Graybiel, 2011).
Our main aim is the development of a mathematical-computational framework to analyse the macroscopic network behaviour of the striatum area, using data from microscopic simulations of a modified Hodgkin-Huxley network of neurons. We achieve our goal by an equation-free approach (Gear et al., 2005; Kevrekidis and Samaey, 2009; Marschler et al., 2014a; Laing, 2018). We identify the mean synaptic activity as the appropriate macroscopic variable that captures the network dynamics. This is also justified from other computational and medical-clinical studies Popovych and Tass (2019); Buzsáki (2004); Parasuram et al. (2016) since neural network activity like synchronisation, is also reflected by the amplitude of the local field potential (LFP) which is modelled as an ensemble-averaged synaptic activity of neurons. The equation-free method allows to perform a numerical bifurcation and stability analysis for the macroscopic dynamics. Our analysis will reveal an interesting property which is not accessible by straightforward simulations of the network, namely, the existence of two macroscopic network states, a high activation state and an unstable low activation state. The different macroscopic states can be related to healthy and pathological conditions existing in neurological disorders. During obsessive-compulsive disorder there is an increased cortico-striatal activity (Maltby et al., 2005; Marsh et al., 2014). Our computational model also predicts this high activation solution. Additionally the model shows a second solution which provides a low activation state, leading the striatum activity to a less pathological activation. Such a state is a potential healthy target for deep brain stimulation and may result in strategies for an efficient treatment. In fact, based on our analysis we propose a closed loop macroscopic control scheme which provides better performance compared to a straightforward deep brain stimulation approach.
2 Construction of the striatum model
We extract the surface of the striatum using magnetic resonance medical data taken from a previously published atlas (Iacono et al., 2015) and transform into the MNI (Montreal Neurological Institute) coordinate system. We place neurons randomly inside this area, see Figure 1A.
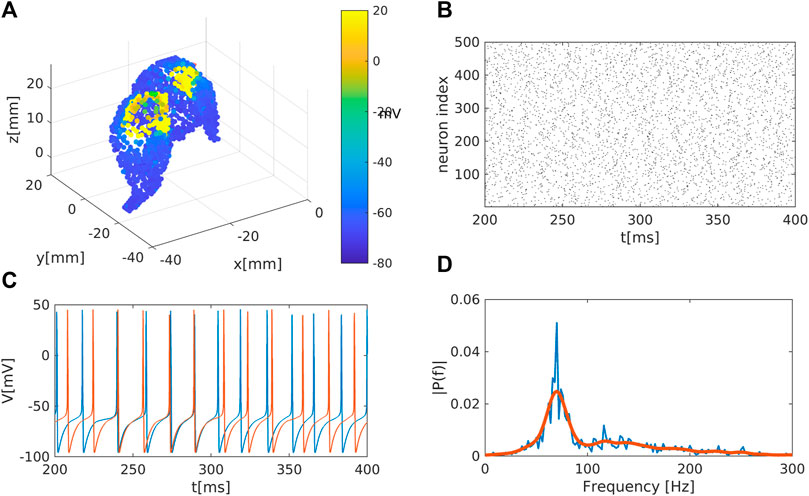
Figure 1. Representation of the striatal network: (A) Schematic representation of the striatum area as obtained in a MNI coordinate space. Colour code represents the membrane electrical activity in mV. (B) Raster plot representation of the network activity in time (in ms) and space (index of neuron of the nucleus). Black dots represent activated neurons (i.e., time dependent action potentials passing through
2.1 Modelling the striatum network by small word connectivity
We place in total 1995 neurons as network nodes in the striatum area. In line with medical studies (Yager et al., 2015) we assume that the vast majority of nodes (i.e., 95% of nodes) represent medium spiny neurons (MSN) while the remaining 5% of nodes are interneurons. The actual connectivity of the striatum is constructed following the idea of the small-world algorithm (Watts and Strogatz, 1998; Bassett and Bullmore, 2006; Stam and Reijneveld, 2007; Bullmore and Sporns, 2009; Spiliotis and Siettos, 2011). Small-world structures suitably model physiological networks (Netoff et al., 2004; Bassett and Bullmore, 2006; Bassett and Bullmore, 2017; de Santos-Sierra et al., 2014; Berman et al., 2016; She et al., 2016; Fang et al., 2017) since those networks are highly clustered and typically show short path lengths, enhancing in this way signal or rhythm propagation within the network and support synchronisation. Initially, each MSN is connected with
2.2 Modelling of the neuron dynamics
Our striatum network contains two types of neurons, the medium spiny neurons (MSN) representing 95% of all neurons and fast spiking neurons (FSI) which are the remaining ones. For the equations of motion of the neuron dynamics we follow (Chartove et al., 2020). It is reported therein, using models as well as experimental works, that striatal projection neurons (MSN) are capable of generating
An MSN or FS neuron at node
where
The potassium current has the form
and the leak current reads
Finally, the M- and D-current which enter the MSN and the FS neurons, respectively, are given by
The gating variables
where
and
The coefficients of the activation gating for the potassium current read
and for those of the M-current we have
The fast spiking neurons (FS) follow similar equations (Chartove et al., 2020), where instead of the M-current we use fast-activating, slowly inactivating D-current
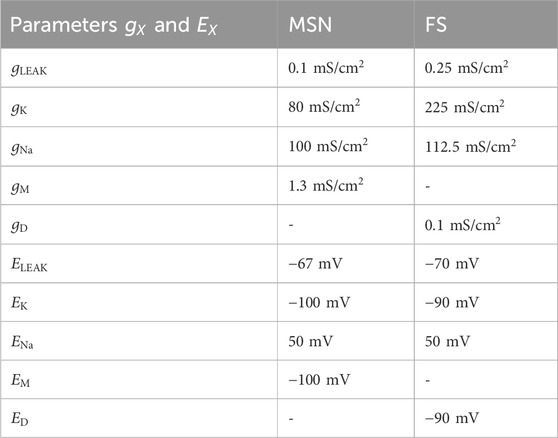
Table 1. Values for the conductance
The current
2.3 Description of the network inhibitory synaptic activity
We model the activation of a synapse using the activation variable
where
with activation rates
with activation rates
where
The synaptic current for the MSNs consists of two parts, first the sum of synaptic currents over medium spiny neurons (describing the inhibition between MSN-MSN neurons) and second, the sum over interneurons (interneurons inhibition of MSN), so that Eq. 8 yields
Similarly for an interneuron the synaptic current is given by
Here the first sum represents the rare case of FS-FS inhibition, while the second term governs the feedback inhibitory loop of MSN to interneurons. For the conductivity values we use
In summary, Eqs 1, 2, 3, 4, 6, 7, 9, and 10 constitute a high dimensional heterogeneous set of coupled nonlinear differential equations defined on a graph with adjacency matrix
3 Equation-free method for analysing macroscopic network behaviour
To describe the main idea in basic terms, consider a high-dimensional dynamical system, for instance the dynamics of the neural network presented in the previous section. The network model evolves in time under specified known microscopic rules, e.g., the equations of motion for each node described above. Denote by
where the so-called flow
We are interested in analysing the network behaviour on a different macroscopic scale. Assume there exists a suitable low-dimensional macroscopic variable
The main assumption of the Equation-Free approach (Gear et al., 2003; Kevrekidis and Samaey, 2009; Marschler et al., 2014a; Sieber et al., 2018) is that a macroscopic description in the form of closed equations of motion for the collective coordinate
gives for each macrostate
and the equations of motion, i.e.,
4 Equation-free analysis of the striatum model
In this section, we apply the theoretical framework of an equation-free approach (Gear et al., 2005; Kevrekidis and Samaey, 2009; Marschler et al., 2014a) to analyse the emergent network dynamics macroscopically. Initially, we describe the lifting and restriction operator as well as the timestepper construction. Then, we discuss the consequences of the resulting one-dimensional evolution equation.
4.1 Lifting and restriction operator
The mean synaptic activity of MSNs turns out to be a suitable macroscopic variable
While such a choice looks appealing, and can be justified with hindsight, one can also support this choice by a more subtle data analysis using for instance diffusion maps, a data-driven method for dimensional reduction and manifold learning (Coifman and Lafon, 2006; Nadler et al., 2006; Laing et al., 2010; Marschler et al., 2014a; Dsilva et al., 2018). Here we skip those technical details and take Eq. 11 as our reduction map.
The crucial step to build the timestepper is the lifting operator. The construction of the lifting operator is based on two steps. First, we record a microscopic realisation of the system from a previous simulation, i.e., we store all the microscopic variables after a short period of 20 ms. Then, in the second step, we assign synaptic variables to the 1856 MSNs in the following way: Given a mean synaptic activity
Finally, we apply the restriction operator to the new network microstate
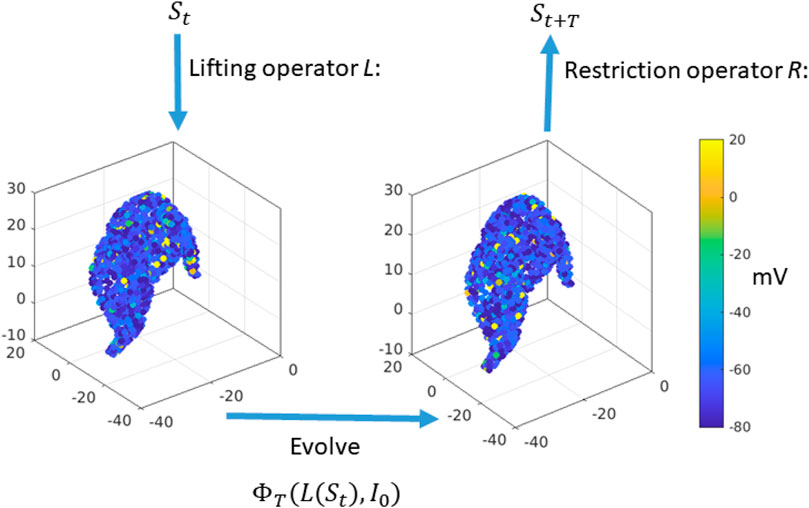
Figure 2. Equation-free construction of the timestepper: Start with the macroscopic variable
Since the macroscopic variable
where the right hand side
4.2 Data-driven system identification, stability and bifurcation analysis
Using Eq. 12 we can construct the right hand side
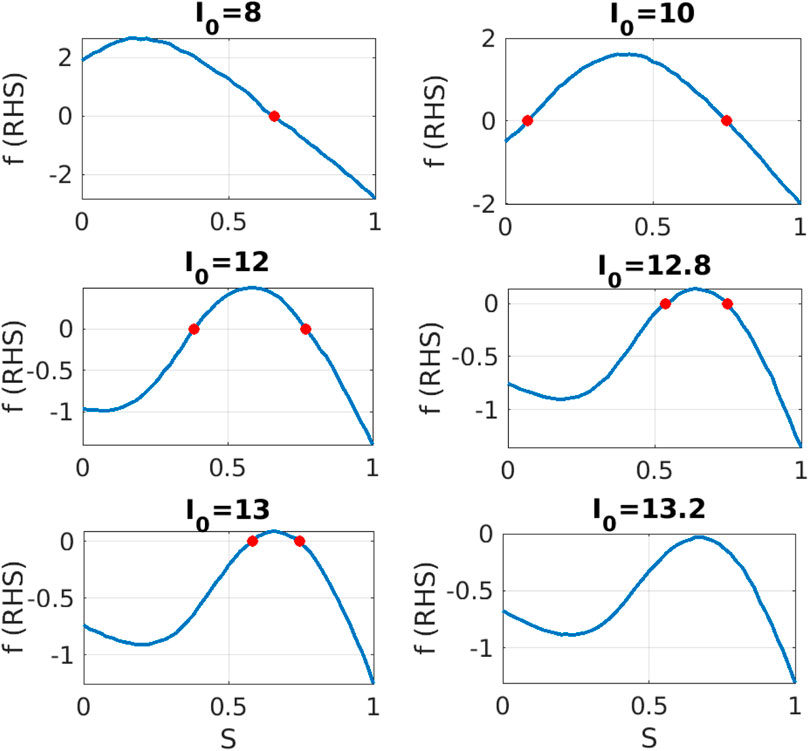
Figure 3. Equation-free system identification: For different values of parameter
We observe that the shape of right hand side
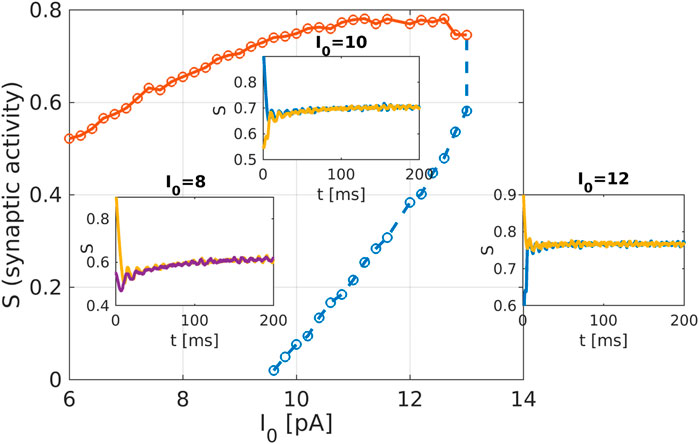
Figure 4. Macroscopic system analysis of the striatum network: Bifurcation diagram as obtained from the equation-free analysis of the striatum network. The network activation current
5 Discussion
The recently invented field of network physiology aims at inferring dynamical interactions in complex biological or medical systems from observed data. With its inherently interdisciplinary intention this field aims to understand, based on data analysis, modelling approaches, or clinical practice, how diverse biological or physiological sub-systems interact from the cellular microscopic to the phenomenological macroscopic level, to explain diverse physiological phenomena, such as healthy or unhealthy states (see, e.g., (Schöll, 2022) for a recent editorial). Looking at the emerging field of network physiology from an equation free perspective has the potential to add an additional facet to this area of research. An equation free approach aims at uncovering the complex dynamical behaviour at a macroscopic level without the need to reconstruct the complex underlying microscopic dynamical network, thus addressing a main goal of network physiology from the outset. We have showcased a computational framework to analyse biophysical neuronal network models, and we applied the method to the striatum area. Based on a realistic mathematical model for the microscopic dynamics of the striatum we have been able to detect relevant macrostates and their dynamical features using an equation-free approach. One major contribution of this research work is that the method bridges the different levels of spatio-temporal scales, the microscopic ones where the physics of neurons is known and the macroscopic ones where the analysis is performed. The activity of neurons and the individual synaptic activity is given using the Hodgkin-Huxley formalism, which constitutes the microscopic description of the model. The network connects these neurons and produces a macroscopic or emergent behaviour with different spatio-temporal properties. Importantly, our equation-free approach allows us to study this emergent behaviour in detail, i.e., to perform stability and bifurcation analysis. The synaptic activity shows steady behaviour, which corresponds to the high network activity, the upper branch of solution in Figure 4, while the corresponding spectrum of the mean membrane activity shows a characteristic peak at the gamma band (see as well Figure 1D). Several other studies also analyse the macroscopic network activity or the emergent network behaviour (Fesce, 2024; Kromer and Tass, 2024; Venkadesh et al., 2024). Additionally, in (Kromer and Tass, 2024), a detailed study of mean synaptic activity, including synaptic plasticity, is performed. The proposed equation-free approach can be applied to these works containing multiple spatio-temporal scales. For example, by studying synaptic plasticity, one can extract critical values of synaptic strength, which contribute to phase transition in the macroscopic network dynamics (Marschler et al., 2014a).
Our realistic microscopic model was based on an FDA-approved state-of-the-art human atlas (Iacono et al., 2015) extracting coordinates for the striatal neurons, on modified Hodgkin-Huxley equations for medium spiny neurons (MSN) and fast-spiking neurons (FSN) (Hodgkin and Huxley, 1952; Chartove et al., 2020), and on complex network structures for neuronal connectivity (Netoff et al., 2004; Bassett and Bullmore, 2006; Bassett and Bullmore, 2017; de Santos-Sierra et al., 2014; Berman et al., 2016; She et al., 2016; Fang et al., 2017). Depending on the parameters, the network model produces patterns which can be associated with healthy or pathological conditions, reflected by low or high synaptic activity. In clinical studies of obsessive-compulsive disorder (Maltby et al., 2005; Marsh et al., 2014) a dysfunctional hyperactivity of the frontal-striatal circuits is observed similarly to the high activation state we obtain in our model for increasing the intensity of the cortico-striatal current
Within an equation-free approach we were able to investigate the crucial macroscopic behaviour for the mean synaptic activity. Such an analysis not just reproduces the dynamically stable high activity branch, but also shows an unstable low activity state which is inaccessible by direct simulations of the model. Such unstable dynamical states could be promising targets for treating pathological conditions.
Deep brain stimulation (DBS) of the striatum has evolved as a promising therapy for patients with severe and resistant forms of obsessive compulsive disorders (OCD) and mental impairments (Rodriguez-Romaguera et al., 2012; Blomstedt et al., 2013; Widge et al., 2019; Wu et al., 2021). While there exist different computational approaches modelling DBS for OCD, see for instance (Szalisznyó and Silverstein, 2021), we can utilise our realistic large scale dynamical system to obtain insights about pathological neural activity during OCD. Since our model has been based on the realistic spatial structures of the striatum each neuron, labelled by an index
This quantity enters the equation for the
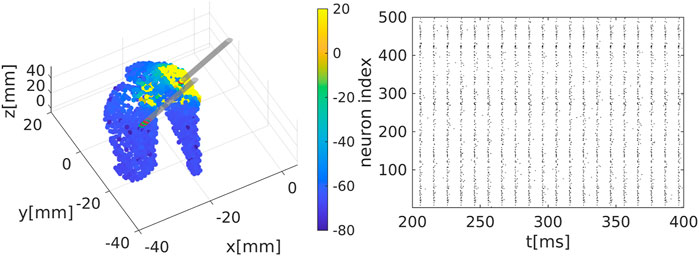
Figure 5. Deep brain stimulation (DBS) on the striatum model: Simulation of the network model with the current Eq. 13 added to the network equations.
Thanks to the equation-free framework we are now able to design a macroscopic proportional feedback controller for DBS. For instance, for
where
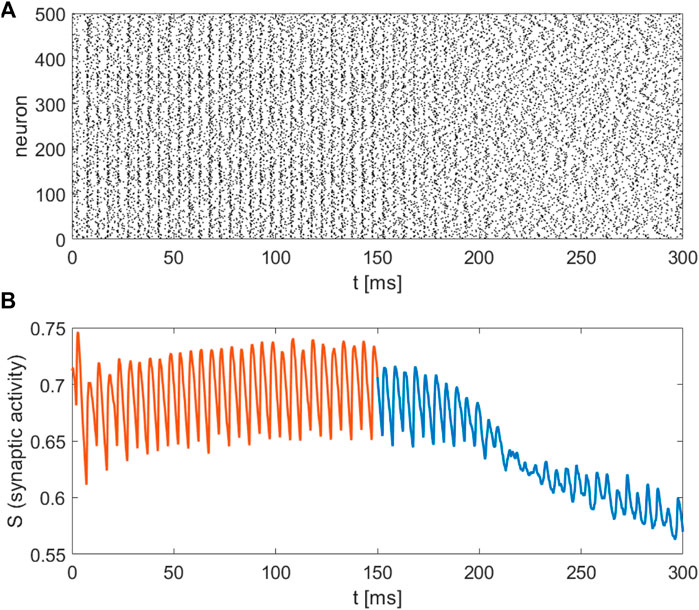
Figure 6. Closed loop control scheme for DBS on the striatum network: Application of DBS with constant amplitude along the line of Eq. 13 for
There are still considerable unknowns for a successful application of DBS such as the anatomical targets of stimulation, optimal stimulation parameters like amplitude and frequency of stimulation, as well as long-term effects of stimulation. In obsessive compulsive disorders hyperactive frontal-striatal activity has been reported (Maltby et al., 2005; Marsh et al., 2014). We conjecture that this hyperactivity is qualitatively similar to the stable upper branch solution as depicted in the bifurcation diagram Figure 4. Since our network model allows for properly modelling the network activation current a corresponding equation-free analysis of the model may then provide some answers to the open questions raised above. Our successful simple showcase provides evidence that such an ambitious program may succeed.
Data availability statement
The original contributions presented in the study are included in the article/supplementary material, further inquiries can be directed to the corresponding authors.
Author contributions
KS: Formal Analysis, Investigation, Methodology, Software, Writing–original draft, Writing–review and editing. RK: Conceptualization, Investigation, Methodology, Writing–review and editing. WJ: Methodology, Writing–review and editing. JS: Conceptualization, Funding acquisition, Methodology, Supervision, Writing–original draft, Writing–review and editing.
Funding
The author(s) declare that financial support was received for the research, authorship, and/or publication of this article. This work was funded by the Deutsche Forschungsgemeinschaft (DFG, German Research Foundation) - SFB 1270/2 - 299150580 - Collaborative Research Centre ELAINE.
Conflict of interest
The authors declare that the research was conducted in the absence of any commercial or financial relationships that could be construed as a potential conflict of interest.
Publisher’s note
All claims expressed in this article are solely those of the authors and do not necessarily represent those of their affiliated organizations, or those of the publisher, the editors and the reviewers. Any product that may be evaluated in this article, or claim that may be made by its manufacturer, is not guaranteed or endorsed by the publisher.
References
Bassett, D., and Bullmore, E. (2006). Small-world brain networks. Neuroscientist 12, 512–523. doi:10.1177/1073858406293182
Bassett, D. S., and Bullmore, E. T. (2017). Small-world brain networks revisited. Neurosci. 23, 499–516. PMID: 27655008. doi:10.1177/1073858416667720
Berman, B., Smucny, J., Wylie, K., Shelton, E., Kronberg, E., Leehey, M., et al. (2016). Levodopa modulates small-world architecture of functional brain networks in Parkinson’s disease. Mov. Disord. 31, 1676–1684. doi:10.1002/mds.26713
Bhattacharya, S., Brincat, S. L., Lundqvist, M., and Miller, E. K. (2022). Traveling waves in the prefrontal cortex during working memory. PLOS Comput. Biol. 18, e1009827. doi:10.1371/journal.pcbi.1009827
Blomstedt, P., Sjöberg, R. L., Hansson, M., Bodlund, O., and Hariz, M. I. (2013). Deep brain stimulation in the treatment of obsessive-compulsive disorder. World Neurosurg. 80, e245–e253. doi:10.1016/j.wneu.2012.10.006
Bullmore, E., and Sporns, O. (2009). Complex brain networks: graph theoretical analysis of structural and functional systems. Nat. Rev. Neurosci. 10, 186–198. doi:10.1038/nrn2575
Buzsáki, G. (2004). Large-scale recording of neuronal ensembles. Nat. Neurosci. 7, 446–451. doi:10.1038/nn1233
Calabresi, P., Picconi, B., Tozzi, A., and Di Filippo, M. (2007). Dopamine-mediated regulation of corticostriatal synaptic plasticity. Trends Neurosci. 30, 211–219. Fifty years of dopamine research. doi:10.1016/j.tins.2007.03.001
Calabresi, P., Picconi, B., Tozzi, A., Ghiglieri, V., and Di Filippo, M. (2014). Direct and indirect pathways of basal ganglia: a critical reappraisal. Nat. Neurosci. 17, 1022–1030. doi:10.1038/nn.3743
Chartove, J. A. K., McCarthy, M. M., Pittman-Polletta, B. R., and Kopell, N. J. (2020). A biophysical model of striatal microcircuits suggests gamma and beta oscillations interleaved at delta/theta frequencies mediate periodicity in motor control. PLOS Comput. Biol. 16, e1007300–e1007330. doi:10.1371/journal.pcbi.1007300
Coifman, R. R., and Lafon, S. (2006). Diffusion maps. Appl. Comput. Harmon. Analysis 21, 5–30. Special Issue: Diffusion Maps and Wavelets. doi:10.1016/j.acha.2006.04.006
Compte, A., Brunel, N., Goldman-Rakic, P., and Wang, X.-J. (2000). Synaptic mechanisms and network dynamics underlying spatial working memory in a cortical network model. Cereb. Cortex 10, 910–923. doi:10.1093/cercor/10.9.910
Crittenden, J., and Graybiel, A. (2011). Basal ganglia disorders associated with imbalances in the striatal striosome and matrix compartments. Front. Neuroanat. 5, 59. doi:10.3389/fnana.2011.00059
Crowell, A., Ryapolova-Webb, E., Ostrem, J., Galifianakis, N., Shimamoto, S., Lim, D., et al. (2012). Oscillations in sensorimotor cortex in movement disorders: an electrocorticography study. Brain 135, 615–630. doi:10.1093/brain/awr332
Deco, G., Jirsa, V., Robinson, P., Breakspear, M., and Friston, K. (2008). The dynamic brain: from spiking neurons to neural masses and cortical fields. PLoS Comput. Biol. 4, e1000092. doi:10.1371/journal.pcbi.1000092
Deco, G., Ponce-Alvarez, A., Mantini, D., Romani, G. L., Hagmann, P., and Corbetta, M. (2013). Resting-state functional connectivity emerges from structurally and dynamically shaped slow linear fluctuations. J. Neurosci. 33, 11239–11252. doi:10.1523/JNEUROSCI.1091-13.2013
de Santos-Sierra, D., Sendiña-Nadal, I., Leyva, I., Almendral, J. A., Anava, S., Ayali, A., et al. (2014). Emergence of small-world anatomical networks in self-organizing clustered neuronal cultures. Plos One 9, 1–8. doi:10.1371/journal.pone.0085828
Dsilva, C. J., Talmon, R., Coifman, R. R., and Kevrekidis, I. G. (2018). Parsimonious representation of nonlinear dynamical systems through manifold learning: a chemotaxis case study. Appl. Comput. Harmon. Analysis 44, 759–773. doi:10.1016/j.acha.2015.06.008
Ermentrout, B., and Terman, D. (2012). Neural networks as spatio-temporal pattern-forming systems. New York: Springer.
Fang, J., Chen, H., Cao, Z., Jiang, Y., Ma, L., Ma, H., et al. (2017). Impaired brain network architecture in newly diagnosed Parkinson’s disease based on graph theoretical analysis. Neurosci. Lett. 657, 151–158. doi:10.1016/j.neulet.2017.08.002
Fesce, R. (2024). The emergence of identity, agency and consciousness from the temporal dynamics of neural elaboration. Front. Netw. Physiology 4, 1292388. doi:10.3389/fnetp.2024.1292388
Gear, C., Kaper, T., Kevrekidis, I., and Zagaris, A. (2005). Projecting to a slow manifold: singularly perturbed systems and legacy codes. SIAM J. Appl. Dyn. Syst. 4, 711–732. doi:10.1137/040608295
Gear, C. W., Hyman, J. M., Kevrekidid, P. G., Kevrekidis, I. G., Runborg, O., and Theodoropoulos, C. (2003). Equation-free, coarse-grained multiscale computation: enabling mocroscopic simulators to perform system-level analysis. Commun. Math. Sci. 1, 715–762. doi:10.4310/cms.2003.v1.n4.a5
Golomb, D., Donner, K., Shacham, L., Shlosberg, D., Amitai, Y., and Hansel, D. (2007). Mechanisms of firing patterns in fast-spiking cortical interneurons. PLOS Comput. Biol. 3, e156. doi:10.1371/journal.pcbi.0030156
Hodgkin, A. L., and Huxley, A. F. (1952). A quantitative description of membrane current and its application to conduction and excitation in nerve. J. Physiology 117, 500–544. doi:10.1113/jphysiol.1952.sp004764
Iacono, M. I., Neufeld, E., Akinnagbe, E., Bower, K., Wolf, J., Vogiatzis Oikonomidis, I., et al. (2015). Mida: a multimodal imaging-based detailed anatomical model of the human head and neck. PLOS ONE 10, e0124126. doi:10.1371/journal.pone.0124126
Kalenscher, T., Lansink, C. S., Lankelma, J. V., and Pennartz, C. M. A. (2010). Reward-associated gamma oscillations in ventral striatum are regionally differentiated and modulate local firing activity. J. Neurophysiol. 103, 1658–1672. doi:10.1152/jn.00432.2009
Kevrekidis, I., and Samaey, G. (2009). Equation-free multiscale computation: algorithms and applications. Annu. Rev. Phys. Chem. 60, 321–344. doi:10.1146/annurev.physchem.59.032607.093610
Kozma, R., Puljic, M., Balister, P., Bollobás, B., and Freeman, W. J. (2005). Phase transitions in the neuropercolation model of neural populations with mixed local and non-local interactions. Neurocomputing 92, 367–379. doi:10.1007/s00422-005-0565-z
Kromer, J. A., and Tass, P. A. (2024). Coordinated reset stimulation of plastic neural networks with spatially dependent synaptic connections. Front. Netw. Physiology 4, 1351815. doi:10.3389/fnetp.2024.1351815
Laing, C., and Chow, C. (2002). A spiking neuron model for binocular rivalry. J. Comput. Neurosci. 12, 39–53. doi:10.1023/a:1014942129705
Laing, C. R. (2018). On the application of “equation-free modelling” to neural systems. J. Comput. Neurosci. 20, 5–23. doi:10.1007/s10827-006-3843-z
Laing, C. R., Frewen, T., and Kevrekidis, I. G. (2010). Reduced models for binocular rivalry. J. Comput. Neurosci. 28, 459–476. doi:10.1007/s10827-010-0227-6
Maltby, N., Tolin, D. F., Worhunsky, P., O’Keefe, T. M., and Kiehl, K. A. (2005). Dysfunctional action monitoring hyperactivates frontal-striatal circuits in obsessive-compulsive disorder: an event-related fmri study. NeuroImage 24, 495–503. doi:10.1016/j.neuroimage.2004.08.041
Marschler, C., Faust-Ellsässer, C., Starke, J., and Van Hemmen, J. (2014a). Bifurcation of learning and structure formation in neuronal maps. EPL 108, 48005. doi:10.1209/0295-5075/108/48005
Marschler, C., Sieber, J., Berkemer, R., Kawamoto, A., and Starke, J. (2014b). Implicit methods for equation-free analysis: convergence results and analysis of emergent waves in microscopic traffic models. SIAM J. Appl. Dyn. Syst. 13, 1202–1238. doi:10.1137/130913961
Marsh, R., Horga, G., Parashar, N., Wang, Z., Peterson, B. S., and Simpson, H. B. (2014). Altered activation in fronto-striatal circuits during sequential processing of conflict in unmedicated adults with obsessive-compulsive disorder. Biol. Psychiatry 75, 615–622. Obsessive-Compulsive Disorder and the Connectome. doi:10.1016/j.biopsych.2013.02.004
Melzer, S., Gil, M., Koser, D. E., Michael, M., Huang, K. W., and Monyer, H. (2017). Distinct corticostriatal gabaergic neurons modulate striatal output neurons and motor activity. Cell Rep. 19, 1045–1055. doi:10.1016/j.celrep.2017.04.024
Montbrió, E., Pazó, D., and Roxin, A. (2015). Macroscopic description for networks of spiking neurons. Phys. Rev. X 5, 021028. doi:10.1103/PhysRevX.5.021028
Montgomery, E. B., and Gale, J. T. (2008). Mechanisms of action of deep brain stimulation (dbs). Neurosci. Biobehav. Rev. 32, 388–407. Special section: Neurobiology of Deep Brain Stimulation: Innovations in Treatment and Basal Ganglia Function. doi:10.1016/j.neubiorev.2007.06.003
Muñoz-Manchado, A., Foldi, C., Szydlowski, S., Sjulson, L., Farries, M., Wilson, C., et al. (2016). Novel striatal gabaergic interneuron populations labeled in the 5ht3a(egfp) mouse. Cereb. Cortex 26, 96–105. doi:10.1093/cercor/bhu179
Nadler, B., Lafon, S., Coifman, R. R., and Kevrekidis, I. G. (2006). Diffusion maps, spectral clustering and reaction coordinates of dynamical systems. Appl. Comput. Harmon. Analysis 21, 113–127. Special Issue: Diffusion Maps and Wavelets. doi:10.1016/j.acha.2005.07.004
Netoff, T., Clewley, R., Arno, S., Keck, T., and White, J. (2004). Epilepsy in small-world networks. J. Neurosci. 24, 8075–8083. doi:10.1523/JNEUROSCI.1509-04.2004
Palkar, G., Wu, J.-y., and Ermentrout, B. (2023). The inhibitory control of traveling waves in cortical networks. PLOS Comput. Biol. 19, e1010697. doi:10.1371/journal.pcbi.1010697
Parasuram, H., Nair, B., D’Angelo, E., Hines, M., Naldi, G., and Diwakar, S. (2016). Computational modeling of single neuron extracellular electric potentials and network local field potentials using lfpsim. Front. Comput. Neurosci. 10, 65. doi:10.3389/fncom.2016.00065
Popovych, O., and Tass, P. (2019). Adaptive delivery of continuous and delayed feedback deep brain stimulation - a computational study. Sci. Rep. 9, 10585. doi:10.1038/s41598-019-47036-4
Remijnse, P. L., Nielen, M. M. A., van Balkom, A. J. L. M., Cath, D. C., van Oppen, P., Uylings, H. B. M., et al. (2006). Reduced orbitofrontal-striatal activity on a reversal learning task in obsessive-compulsive disorder. Archives General Psychiatry 63, 1225–1236. doi:10.1001/archpsyc.63.11.1225
Rodriguez-Romaguera, J., Monte, F. H. M. D., and Quirk, G. J. (2012). Deep brain stimulation of the ventral striatum enhances extinction of conditioned fear. Proc. Natl. Acad. Sci. 109, 8764–8769. doi:10.1073/pnas.1200782109
Rubin, J., and Terman, D. (2004). High frequency stimulation of the subthalamic nucleus eliminates pathological thalamic rhythmicity in a computational model. J. Comput. Neurosci. 16, 211–235. doi:10.1023/B:JCNS.0000025686.47117.67
Schöll, E. (2022). Network physiology, insights in dynamical systems: 2021. Front. Netw. Physiol. 2, 1–3. doi:10.3389/fnetp.2022.961339
She, Q., Chen, G., and Chan, R. (2016). Evaluating the small-world-ness of a sampled network: functional connectivity of entorhinal-hippocampal circuitry. Sci. Rep. 6, 21468. doi:10.1038/srep21468
Sieber, J., Marschler, C., and Starke, J. (2018). Convergence of equation-free methods in the case of finite time scale separation with application to deterministic and stochastic systems. SIAM J. Appl. Dyn. Syst. 17, 2574–2614. doi:10.1137/17M1126084
Siettos, C., and Starke, J. (2016). Multiscale modeling of brain dynamics: from single neurons and networks to mathematical tools. Wiley Interdiscip. Rev. Syst. Biol. Med. 8, 438–458. doi:10.1002/wsbm.1348
Siettos, C. I. (2011). Equation-free multiscale computational analysis of individual-based epidemic dynamics on networks. Appl. Math. Comput. 218, 324–336. doi:10.1016/j.amc.2011.05.067
Spiliotis, K., Butenko, K., Starke, J., van Rienen, U., and Köhling, R. (2024). Towards an optimised deep brain stimulation using a large-scale computational network and realistic volume conductor model. J. Neural Eng. 20, 066045. doi:10.1088/1741-2552/ad0e7c
Spiliotis, K., Butenko, K., van Rienen, U., Starke, J., and Köhling, R. (2022a). Complex network measures reveal optimal targets for deep brain stimulation and identify clusters of collective brain dynamics. Front. Phys. 10. doi:10.3389/fphy.2022.951724
Spiliotis, K., and Siettos, C. (2011). A timestepper-based approach for the coarse-grained analysis of microscopic neuronal simulators on networks: bifurcation and rare-events micro-to macro-computations. Neurocomputing 74, 3576–3589. doi:10.1016/j.neucom.2011.06.018
Spiliotis, K., Starke, J., Franz, D., Richter, A., and Köhling, R. (2022b). Deep brain stimulation for movement disorder treatment: exploring frequency-dependent efficacy in a computational network model. Biol. Cybern. 116, 93–116. doi:10.1007/s00422-021-00909-2
Stam, C., and Reijneveld, J. (2007). Graph theoretical analysis of complex networks in the brain. Nonlinear Biomed. Phys. 1, 3. doi:10.1186/1753-4631-1-3
Szalisznyó, K., and Silverstein, D. N. (2021). Computational predictions for ocd pathophysiology and treatment: a review. Front. Psychiatry 12, 687062. doi:10.3389/fpsyt.2021.687062
Tepper, J. M., Tecuapetla, F., Koós, T., and Ibáñez-Sandoval, O. (2010). Heterogeneity and diversity of striatal gabaergic interneurons. Front. Neuroanat. 4 (150), 1–18. doi:10.3389/fnana.2010.00150
Terman, D., Rubin, J., Yew, A., and Wilson, C. (2002). Activity patterns in a model for the subthalamopallidal network of the basal ganglia. J. Neurosci. 22, 2963–2976. doi:10.1523/JNEUROSCI.22-07-02963.2002
Venkadesh, S., Shaikh, A., Shakeri, H., Barreto, E., and Van Horn, J. D. (2024). Biophysical modulation and robustness of itinerant complexity in neuronal networks. Front. Netw. Physiology 4, 1302499. doi:10.3389/fnetp.2024.1302499
Watts, D., and Strogatz, S. (1998). Collective dynamics of 'small-world' networks. Nature 393, 440–442. doi:10.1038/30918
Widge, A. S., Zorowitz, S., Basu, I., Paulk, A. C., Cash, S. S., Eskandar, E. N., et al. (2019). Deep brain stimulation of the internal capsule enhances human cognitive control and prefrontal cortex function. Nat. Commun. 10, 1536. doi:10.1038/s41467-019-09557-4
Wu, H., Hariz, M., Visser-Vandewalle, V., Zrinzo, L., Coenen, V. A., Sheth, S. A., et al. (2021). Deep brain stimulation for refractory obsessive-compulsive disorder (ocd): emerging or established therapy? Mol. psychiatry 26, 60–65. doi:10.1038/s41380-020-00933-x
Yager, L., Garcia, A., Wunsch, A., and Ferguson, S. (2015). The ins and outs of the striatum: role in drug addiction. Neuroscience 301, 529–541. doi:10.1016/j.neuroscience.2015.06.033
Keywords: network physiology, equation free method, complex network dynamics, obsessive compulsive disorders, control of neurological disorders
Citation: Spiliotis K, Köhling R, Just W and Starke J (2024) Data-driven and equation-free methods for neurological disorders: analysis and control of the striatum network. Front. Netw. Physiol. 4:1399347. doi: 10.3389/fnetp.2024.1399347
Received: 11 March 2024; Accepted: 16 July 2024;
Published: 07 August 2024.
Edited by:
Eckehard Schöll, Technical University of Berlin, GermanyReviewed by:
Oleksandr Popovych, Helmholtz Association of German Research Centres (HZ), GermanyAli Foroutannia, University of Canberra, Australia
Rossella Rizzo, University of Palermo, Italy
Copyright © 2024 Spiliotis, Köhling, Just and Starke. This is an open-access article distributed under the terms of the Creative Commons Attribution License (CC BY). The use, distribution or reproduction in other forums is permitted, provided the original author(s) and the copyright owner(s) are credited and that the original publication in this journal is cited, in accordance with accepted academic practice. No use, distribution or reproduction is permitted which does not comply with these terms.
*Correspondence: Konstantinos Spiliotis, a29uc3RhbnRpbm9zLnNwaWxpb3Rpc0B1bmktcm9zdG9jay5kZQ==; Wolfram Just, d29sZnJhbS5qdXN0QHVuaS1yb3N0b2NrLmRl