 Aurora Rosato
 Emanuele Perra
 Eric Rullman
 Seraina A. Dual
- 1Intelligent Heart Technology Lab, Department of Biomedical Engineering and Health Systems, KTH Royal Institute of Technology, Stockholm, Sweden
- 2Division of Clinical Physiology, Department of Laboratory Medicine, Karolinska Institute, Stockholm, Sweden
Introduction: During exercise, the cardiovascular, respiratory, and locomotor systems interplay dynamically, yet the specific mechanisms of cardiovascular and locomotor interaction during simple rhythmic exercise like walking remain unclear. Computational models constitute a powerful tool to investigate the interplay of networked physiological systems, but while gravitational and postural effects on circulation have been explored, the influence of inertial forces from body motion on hemodynamics has not been addressed.
Methods: Here, we present a closed-loop cardiovascular model that incorporates inertial effects during walking. The lumped parameter model includes 25 vascular compartments, a four-chamber heart with valves, pericardial and intrathoracic pressures, interventricular septal dynamics, and a baroreflex mechanism. Inertial effects are modeled as additional hydrodynamic pressure sources in each vascular segment, equivalent to the acceleration of blood mass, caused by gravity and motion. Three protocols are used: a head-up tilt test to validate baroreflex and gravity effects; a synthetic walking simulation with controlled heart rate (HR) and step rate (SR); and a human walking experiment (n=2) linking beat-wise simulated aortic pressure to measured brachial pressure using recorded HR and body acceleration. Beat-wise morphology similarity (K-stat) between experimental and simulated hemodynamic waveforms is quantified with a two-sample Kolmogorov-Smirnov test.
Results: The model reproduces expected physiological responses to head-up tilt. During synthetic walking, inertial effects result in pressure augmentation, increasing systolic or diastolic pressure depending on the phase between HR and SR. With SR > HR, phase variability produces a low-frequency “beating” in the pressure waveforms and mean arterial pressure, corresponding to the difference between SR and HR. In the human subject experiment, the model accurately replicates beat-wise pressure changes at varying phase shifts between HR and SR. Quantitative comparison shows a substantial increase in similarity of waveform when hydrodynamic pressure is included (K-stat: 0.123 vs. 0.029 for P1; 0.164 vs. 0.059 for P2).
Conclusion: Introducing contributions of body acceleration as an additional hydrodynamic pressure source in the vascular compartments seems a valid way to capture walking-induced inertial effects. This work contributes to the broader effort to characterize physiological network adaptations to exercise and offers a foundation for future research studying and optimizing cardiac-locomotor interaction.
1 Introduction
Exercise functions as a perturbation that challenges the body’s interconnected physiological systems, especially the cardiovascular, respiratory, musculoskeletal, and neural. Analyzing exercise such as walking provides insights into how adaptive responses, including fatigue, recovery, and performance, emerge from systems interactions rather than isolated organ behavior (Balagué et al., 2020). Network physiology represents a recent framework utilizing statistical modeling of topological networks to characterize nonlinear feedback mechanisms and their resulting complex transient dynamics (Ivanov, 2021; Bashan et al., 2012). Complementary is the study of the biomechanical relationships of interacting physiological systems.
During rhythmic exercise such as locomotion, there is a functional interplay between the cardiovascular, respiratory and musculoskeletal systems. Recently, the study of the interaction of cardiovascular and respiratory system has seen a lot of scientific progress Fisher et al. (2022), specifically in the context of exercise and cardiorespiratory coordination (Garcia-Retortillo et al., 2019a; Garcia-Retortillo et al., 2019b). In parallel, also our understanding of the interaction between the locomotor and cardiovascular systems has advanced significantly. Recent evidence uncovers how autonomic regulation and cardiac function synchronize with muscle activation during exercise (Garcia-Retortillo and Ch Ivanov, 2024), and that beneficial metabolic effects occur when precise coordination between walking and heart relaxation is achieved (Constantini et al., 2018; Wakeham et al., 2023; Niizeki et al., 1993). Despite these advancements, the biomechanical effects resulting from the coupling between the locomotor and cardiovascular systems (cardiac-locomotor coupling) remain poorly understood. It remains unclear to what extent cardiac locomotor coupling modulates hemodynamics via inertial effects (O’Rourke and Avolio, 1992), venous muscle pumping (Zhang, 2002), and ejection of blood from intramuscular arteries during muscle activation (Walløe and Wesche, 1988; Niizeki, 2005). In turn, these hemodynamic effects drive alterations in cardiac afterload and preload (Langan, 2025; Wakeham et al., 2023), and coronary perfusion (mechanoenergetics) (Malliaras et al., 2014) as well as potentially a complex cascade of autoregulatory feedback mechanisms (Garcia-Retortillo and Ch Ivanov, 2024).
This lack of understanding currently limits our ability to propose health-effective physical exercise and rehabilitation strategies, but also poses challenges in designing cardiac support devices which work safely during daily activities.
Computational models of physiological networks are uniquely suited to explore underlying relationships. They have become a useful tool for the design and early feasibility assessment of cardiovascular devices, offering predictive insights that can reduce the extensive physical prototyping and in vivo studies. In clinical practice, such models are being used to assist decision-making processes and predict patient outcomes in response to therapeutic or interventional treatments (Fumagalli et al., 2024). However, their application in scenarios involving physical activity, particularly to inform cardiovascular rehabilitation strategies, remains limited. Addressing this gap, recent studies have developed models that simulate dynamic adaptation to exercise by incorporating cardio-respiratory and metabolic control mechanisms dependent on total workload (Fresiello et al., 2016). Other studies have also investigated the autoregulatory effects under gravitational stress, opening the door to studying the dynamic inertial effects of bodily acceleration during walking.
Among the first models to account for gravitational effects in cardiovascular simulations is Heldt (2004), who implemented a 0D lumped parameter multi-compartmental model in conjunction with baroreflex control dynamics to reproduce transient and steady hemodynamic responses to changes in head-up tilt angle. Similarly, Peterson et al. (2002) employed a 0D model of the cardiovascular system to quantify the influence of intrathoracic and hydrostatic pressure contributions on cardiac function across different body postures and gravitational levels, ranging from 0 to 1.8 G. More recent work has combined a 1D (Fois et al., 2022; Zhang et al., 2017) or 3D (Lau and Figueroa, 2015) arterial tree with a 0D systemic network to capture hemodynamic changes during passive head-up tilt, validating the simulation results against experimental data (Fois et al., 2022). Although gravity-induced hydrostatic effects are incorporated in many models (Diaz Artiles et al., 2016; Lau and Figueroa, 2015; Gallo et al., 2020; Fitzjerrell et al., 1983); Rafik (2021), little research addresses the inertial forces arising from dynamic body motion (Belardinelli et al., 1989; O’Rourke and Avolio, 1992) in closed-loop 0D cardiovascular models, leaving walking-induced hemodynamics insufficiently characterized.
In walking, the cardiac and locomotor systems interact in several distinct ways. During locomotion, cardiac activity supplies oxygenated blood to the working muscles, while the skeletal muscle pump, particularly the calf, enhances venous return via intermittent increases in intramuscular pressure, causing blood ejection from intramuscular veins and venous sinuses (Tauraginskii et al., 2023). Moreover, locomotion induces cyclical acceleration and deceleration of the body’s center of mass, generating inertial forces that dynamically redistribute blood volume. The body vertical motion gives rise to positive and negative pressure waves in the aorta (Nichols et al., 2022), that can constructively or destructively interfere with existing blood pressure patterns.
To date, three studies attempted to model the hemodynamics impact of accessory wave generated at each foot strike. In the first study from Palatini et al. (1989b), a chest-mounted saline-filled container was used to externally capture inertial pressure changes during running. These pressure fluctuations were synchronized and later integrated with intra-arterial pressure recordings obtained during cycling. The resulting pressure tracing closely resembled the pattern observed during overground running, showing that running gives origin to a wave of varying amplitude, whose frequency is related to the runner’s pace. In a successive study, O’Rourke and Avolio (1992) used a single tube model of uniform stiffness representing the aortic trunk and lower limb arteries. Two sinusoidal pumps were incorporated into the model to represent left ventricular ejection and leg muscle contraction and they interacted linearly at varying frequencies. The results showed that when the two pumps were entrained at the same frequency, the resulting sinusoidal waveform exhibited a peak-to-peak pressure amplitude ranging from 140 mmHg when the waves were in phase to 20 mmHg when they were 180° out of phase. Additionally, a beating phenomenon was observed when the two pumps operated at different frequencies. Finally, a model of the cardiovascular system during running has been developed to study the optimal interaction between heart contraction and muscle activity by Zhang (2002). Two key physiological mechanisms were integrated into the model: modulation of peripheral resistance due to transient blood flow obstruction during muscle contraction, and modulation of venous unstressed volume to simulate the impact of the feet on the ground. The study was able to show that stroke volume (SV) oscillates when step rate (SR) differs from heart rate (HR), and become stable when SR equal HR. Highest SV and consequent optimal interaction, was obtained when stepping happens during filling phase of the cardiac cycle. Experimental data, also revailed that under constant cardiac output (CO) conditions (same workload and oxygen consumption), HR varied with the phase, with minimal HR, and consequent higher SV, when the steps aligned with the heart’s filling phase.
In this study, we present a closed-loop cardiovascular model featuring inertial effects of body acceleration during walking. Utilizing this model, we explore how the cardiovascular and the locomotor system interplay at high similarity of HR and SR. Heart-paced walking is realistic and conveniently allows for a very controlled study of hemodynamic effects on the cardiovascular system and exhibits some interesting frequency phenomena. Finally, we validate the aortic pressure waveform including inertial effects of walking with experimentally measured hemodynamics. Importantly, the implementation of gravity is validated against state-of-the-art models during a head up tilt.
2 Methods
2.1 Closed loop model of the cardiovascular system
A closed-loop lumped parameter model was developed to simulate the cardiovascular system dynamics, based on the model by Broomé et al. (2013) (Figure 1). The model consists of 25 vascular compartments representing major segments of the systemic and pulmonary circulations. Each segment is described using a four-element Windkessel model, incorporating resistance, compliance, and inertance to capture hemodynamic behavior. All Windkessel parameters are derived based on first principles from geometric vascular parameters, such as length and radius, representative of vessels in each compartment.
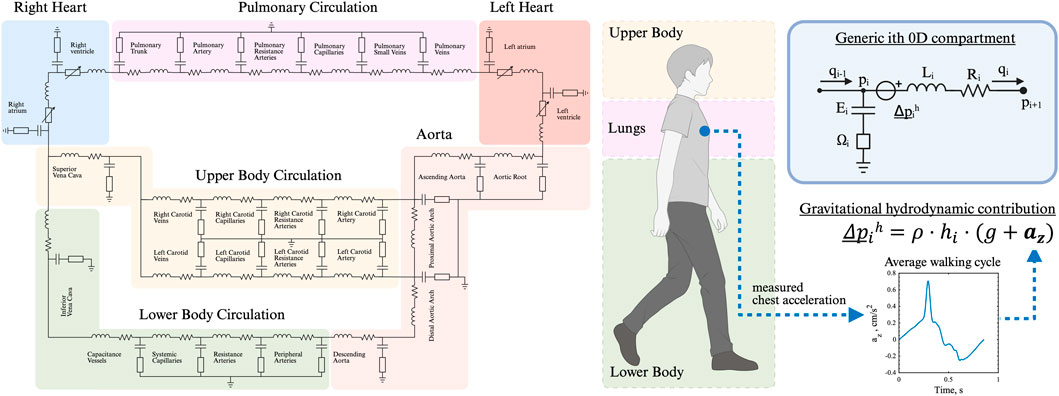
Figure 1. Closed-loop, multi-compartmental lumped parameter model of the cardiovascular system. Simulation of right and left heart, as well as pulmonary, upper and lower body circulation. The chest acceleration is modeled as an additional pressure source in all vertically orientated vessels.
The heart is represented as a four-chamber pump, with active and passive myocardial mechanics modeled using a periodic double-Hill function (Stergiopulos et al., 1996). Cardiac valves are implemented with a combination of Bernoulli resistance and inertial effects, allowing smooth transitions in the valve area from open to closed states in response to transvalvular pressure gradients (Mynard et al., 2012). The model takes into account additional mechanisms such as pericardial and intrathoracic pressures (Sun et al., 1997), and interventricular septal interaction (Maughan et al., 1987).
All parameters used in the model for the heart chamber, cardiac valve, and cardiovascular compartments (resistance, compliance) are chosen based on physiological values from Broomé et al. (2013).
The model was implemented in MATLAB Simulink (MathWorks Inc., Natick, MA, USA) and numerically integrated using a fourth-order Runge–Kutta solver at a sampling frequency of 2 kHz.
2.1.1 Time-varying elastance function
The time-varying elastance of each cardiac chamber,
where
In Equation 2,
In Equation 3, the maximum elastance,
The minimum elastance,
Parameters related to the cardiac function are reported for each chamber in Table 1.
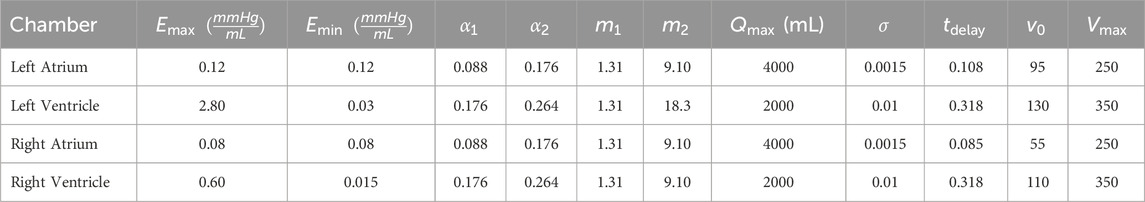
Table 1. Parameters for the cardiac chambers model.
2.1.2 Interventricular septum interaction
Interventricular interaction is modeled through a septal elastance,
where
2.1.3 Pericardial pressure
The pericardium is modeled using an exponential pressure–volume relationship (Equation 7) to represent the mechanical constraint it imposes on cardiac filling:
where
2.1.4 Cardiac valves
The pressure drop across a cardiac valve is governed by Equation 8, a nonlinear inertial-resistive model (Mynard et al., 2012):
where the resistive and inertial coefficients are defined by Equation 9:
where
The dynamics of
where
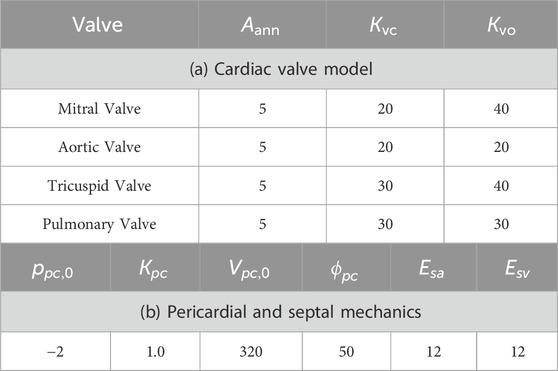
Table 2. Model parameters for cardiac valves and pericardial/septal mechanics.
2.1.5 Vascular compartments
Vascular dynamics of the venous and arterial compartments are modeled using a four-element Windkessel model. The flow update at the generic
where
where
where
Geometric and vessel material properties define the resistance (Equation 15), inertia (Equation 16), and elastance (Equation 17) of each compartment:
where
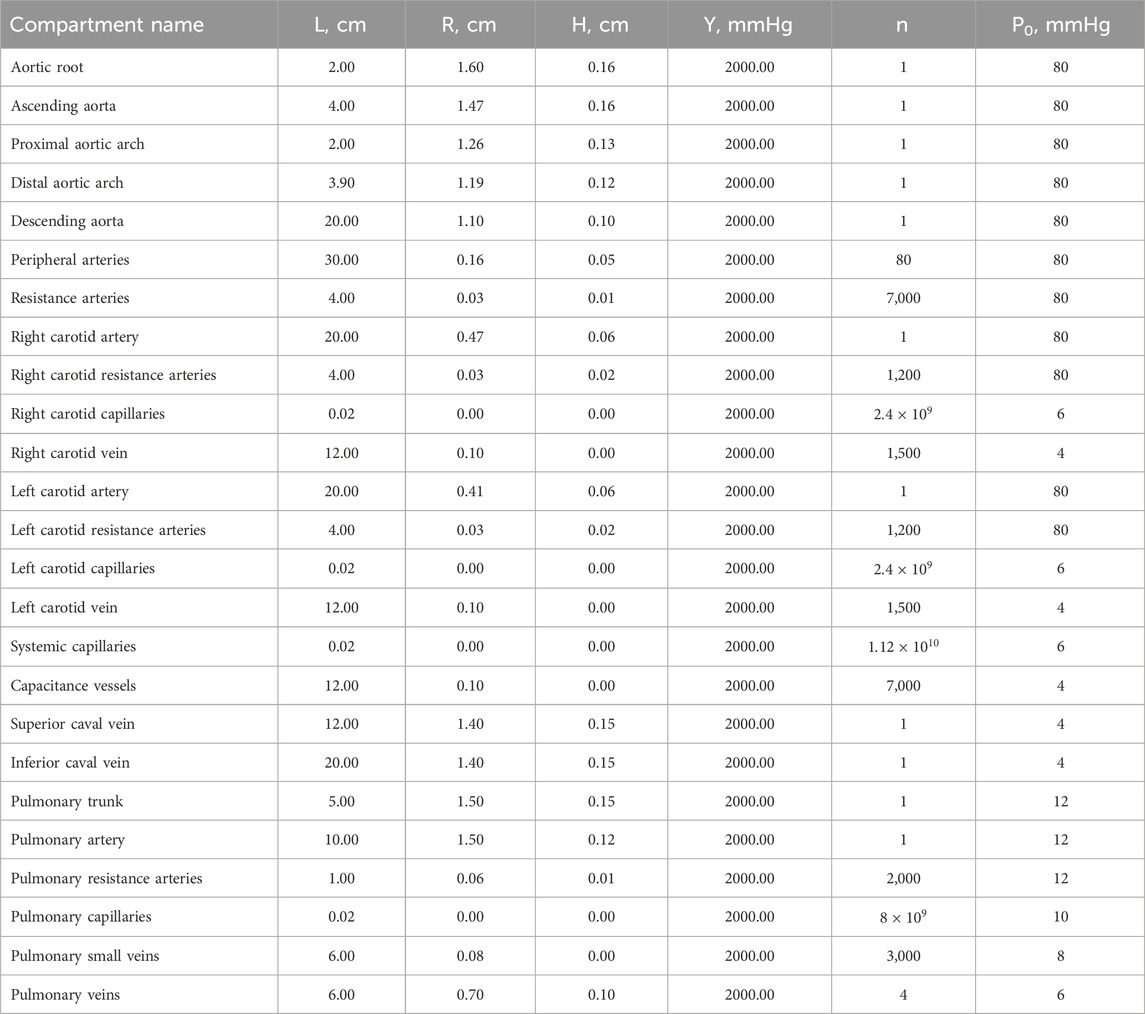
Table 3. Geometric and mechanical properties of cardiovascular compartments.
2.1.6 Autoregulation (baroreflex)
The time-averaged aortic pressure
where
where
Cardiopulmonary regulation of the time-averaged right atrial pressure
Baroreflex gains were empirically selected to match the cardiovascular blood pressure response as reported in previous work (Fois et al., 2022), which is based on in-vivo data (Coonan and Hope, 1983; Smith et al., 1994; Blomqvist and Stone, 1991). The relative contributions of HR, SV, CO, TPR and LVemax were also controlled via the baroreflex gain. Parameters related to the baroreflex model are reported in Table 4.
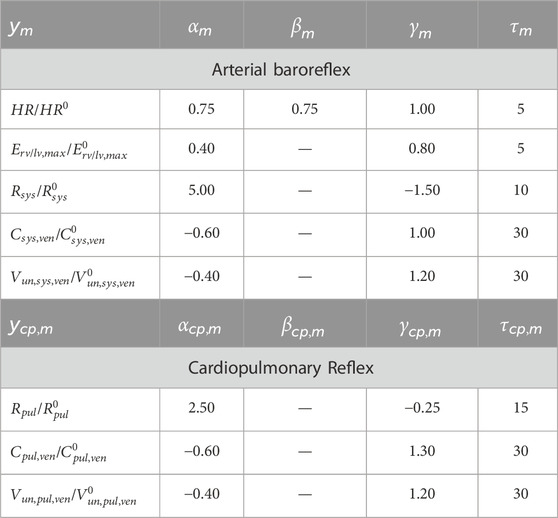
Table 4. Arterial Baroreflex and Cardiopulmonary Reflex Parameters adopted from Fois et al (2022).
2.2 Walking-induced inertial effects of the locomotor system
Inertial effects arise from the mass of blood stored in each vascular compartment, when it is subjected to accelerations. Accelerations acting along the same direction as the vasculature will result in positive or negative blood flow. In supine positions, accelerating blood flow is driven mostly by the pumping of the heart. However, external accelerations such as gravity or body acceleration contribute to these complex blood flow dynamics. External accelerations can be conveniently modeled as local hydrodynamic pressure sources.
2.2.1 Hydrodynamic pressure contribution
In walking, two accelerations act on the vascular system: gravity and body acceleration. The effect of hydrostatic pressure induced by gravity and the hydrodynamic pressure induced by body acceleration is modeled as an additional pressure head in each vascular segment:
where
2.2.1.1 Gravity contribution
The effect of gravity is implemented as a constant vertical acceleration contribution in Equation 20 as in Equation 21:
where
The vertical distance from the heart to the capillaries in the right and left carotid arteries, representing the head circulation, is 24 cm. The vertical height from the heart to the systemic capillaries is given by
2.2.1.2 Body acceleration contribution
An additional acceleration term complements the implementation of gravity with the body acceleration. In Equation 21
2.2.2 Intra-thoracic pressure
Intra-thoracic pressure
where
2.3 Experimental human-subject data
Highly controlled experimental human-subject data served as qualitative validation for the walking induced-inertial effects as simulated in the cardiovascular model.
Two subjects were included in the study (P1: male, 31 years old, height 177 cm, weight 63 kg, P2: male, 26 years old, height 168 cm, weight 65 kg). Subjects were chosen from a larger cohort 1) to have a similar height as our cardiovascular closed-loop model implementation and 2) to depict a distinctly different degree of hemodynamic response to synchronized exercise. Ethical approval was obtained from the Swedish Ethical Review Authority (2023-00426-01), and the participant provided written informed consent. Continuous finger arterial pressure was obtained via Finapres (Finapres Medical Systems B.V., Netherlands), with height correction unit enabled and reconstruction of the brachial arterial pressure signal. Simultaneously, electrocardiogram (ECG) was acquired from a chest sensor, equipped with inertial measurement units (IMU) and pressure insoles were used for step timing detection (Cometa Srl., Italy). All data were wirelessly transmitted for acquisition at 2 kHz.
To guide heart-paced walking, the subjects wore a chest strap (Pulson, USA) equipped with ECG and IMU sensors. The device played auditory tones timed to coincide with the R wave (systole) or at 45% of the R-R interval (diastole). The experimental protocol consisted of a 15-min treadmill walking. The initial 3 min served as a warm-up, followed by two 3-min bouts each of systolic and diastolic stepping, totaling 12 min of heart-paced walking.
2.4 Protocols
Three sets of protocols were run in this study. First, a tilt test involving a head-up tilt of 90° from lying down to standing was performed to validate the implementation of baroreflex and gravity into the cardiovascular model. Second, a synthetic walking waveform protocol at controlled HR and SRs. In this setup, the inertial effects on hemodynamics were studied by controlling both HR and SR. The walking pattern was reconstructed as a time-averaged cyclic waveform based on subject measurements and applied as a periodic acceleration input at the specified SR frequency. Third, a human-subject walking protocol to capture a real-world scenario of heart-paced walking. We compared hemodynamic features arising from the effects of heart-paced walking in the simulated descending aortic pressure with finger-measured brachial blood pressure. As input, the simulation used real-world HR and chest acceleration data from the subjects.
In both walking protocols, the baroreflex control acting on the HR was deactivated. This was done either because the HR was imposed as fixed (in synthetic walking) or was measured from the human-subject. All other baroreflex controls remained active.
2.4.1 Tilt test
We conducted a tilt test simulation to validate our integrated baroreflex and gravitational model against published physiological data (Fois et al., 2022). For this purpose, mean values of main pressures, including MAP, systolic arterial pressure (SAP), diastolic arteral pressure (DAP) and central venous pressure (CVP) were compared against mean values from experimental literature and computational data from Fois et al. (2022). Percentage change in HR, SV, CO, total peripheral resistance (TPR), and
Postural transition was modeled as a 90° head-up tilt from the supine position, following the methodology described in Heldt (2004).
The postural angle
where
2.4.2 Synthetic walking
Synthetic acceleration signals were computed by repeating one vertical acceleration cycle and were provided as input to the model. In all simulations, the HR was fixed at 70 bpm. The pressure in the descending aorta was selected for this analysis.
Initially, the SR was set equal to the HR, with five distinct phase shifts to the cardiac cycle. The first phase shift occurred when the peak acceleration coincided with mitral valve closure, the third phase shift corresponded to the alignment of peak acceleration with ventricular filling, marked by maximal mitral valve opening, and the last phase shift when the peak acceleration occurred just before the mitral valve closure of the subsequent heart beat. The second and fourth shifts occurred during the transitions between systole and diastole and diastole and systole.
Subsequently, the SR was increased beyond HR by 10%, 20%, and 30%. The difference in frequency, naturally iterates through the different phase shifts of the two physiological systems. Fast Fourier Transform (FFT) was performed to compare the frequency content of the pressure signals between the standing and walking conditions. FFT resolution was set as 0.02 Hz.
2.4.3 Human-subject walking
The experimentally measured chest acceleration and HR data from the subjects were used as inputs to the computational model. The simulated pressure in the descending aorta was then compared to the brachial arterial pressure.
To determine the phase synchronization between step events and the cardiac cycle, the phase of each step was calculated as the percentage of the RR interval at which the heel strike occurred. Heel strike timing was identified from insole data as the point at which average pressure reached a certain threshold, calculated with Cometa proprietary software. Cardiac contraction was defined as the R-peak in the ECG for experimental data and as the mitral valve closure in the simulated data. A phase of 0% corresponds to a step occurring simultaneously with cardiac contraction, while 100% indicates a step coinciding with the subsequent contraction.
Pulse waveforms were segmented to each phase, starting from heart contraction to 35%RR after the subsequent contraction. The mean waveform for each phase was then computed for further analysis. The experimental waveform was shifted 670 samples for alignment purposes.
2.5 Statistical and waveform analysis
A two-sample Kolmogorov-Smirnov (K-S) was performed to compare beat-wise experimental and simulated waveforms with and without hydrodynamic pressure contribution in the cardiovascular model. The K-S test was chosen, as it emphasizes pressure level distribution over one cardiac cycle and de-emphasizes waveform timing when compared to correlation analyses. Each hemodynamic time-series was segmented into waveforms from one pressure onset to the subsequent one and then concatenated. Pressure onset was identified as the projection on the signal of the intersection between a horizontal line passing through the minimum before the start of the systolic upstroke, and the tangent to the point of maximum first derivative (Chiu et al., 1991). The K-S test statistic served as a similarity index (K-stat), quantifying the maximum absolute difference between the empirical cumulative distribution functions of the experimental and simulated hemodynamic waveform for each subject and condition.
3 Results
3.1 Gravity and baroreflex autoregulation
The implementation of gravity and baroreflex autoregulation was validated with pre-published experimental and simulation data from literature. A head-up tilt served as the validation experiment. Figure 2B illustrates the physiological aortic pressure response of the computational model to standing up with the baroreflex on versus baroreflex off. Upon standing up, blood pools in the lower extremities, leading to a reduction in venous return, SV, and CO. As a result, aortic pressure drops. This gravitational effect on hemodynamics is noticeable about 10 s after the start of the tilt (see Figure 2B), a realistic scenario given previously published data. We conclude that the hydrodynamic pressure source is correctly implemented.
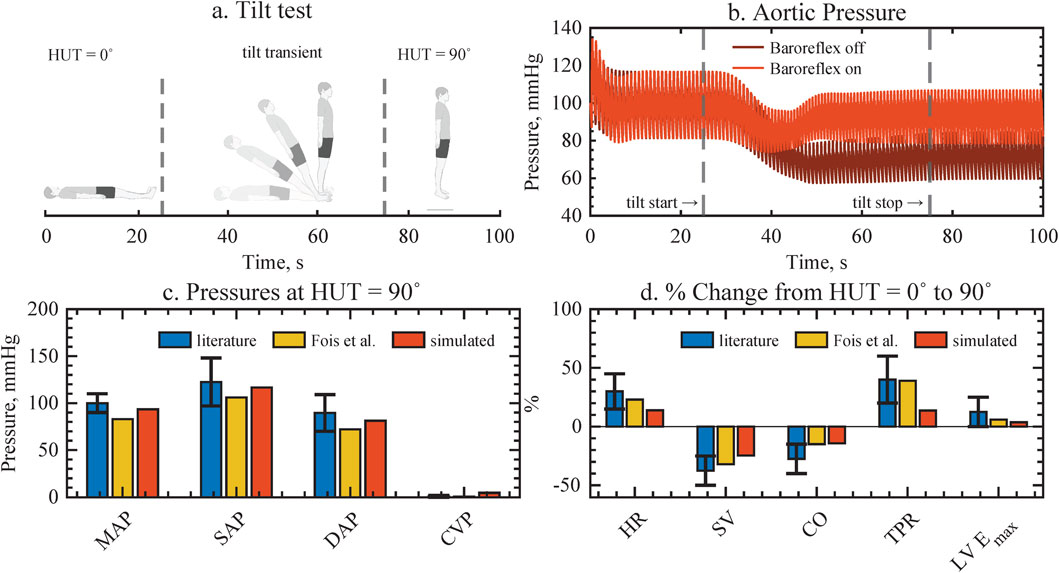
Figure 2. Validation of gravity and baroreflex autoregulation against assembled experimental data from literature and previous computational model implementations, resulting in good agreement for all cardiovascular variables. (a) Head-up tilt protocol. (b) The aortic pressure response with and without baroreflex, depicting how pressure is restored when the baroriflex is active. (c,d) Pressure values and physiological changes upon tilting, compared to literature and previous computational model. MAP, mean arterial pressure; SAP, systolic arterial pressure; DAP, diastolic arterial pressure; CVP, central venous pressure; HR, heart rate; SV, stroke volume; CO, cardiac output; TPR, total peripheral resistance; LVEmax, left ventricular contractility.
As a physiological response, the drop in aortic pressure is registered by the stretch-sensitive barorecepters, which trigger compensatory autoregulatory mechanisms. Autoregulation increases HR, total vascular resistance, and cardiac contractility in order to maintain arterial pressures. Consequently, the baroreflex control of our computational model increases all arterial pressure similarly to previously reported levels when the baroreflex is on (see Figure 2C). In contrast, in the absence of baroreflex control, there is a noticeable and sustained decrease in pressure. Additionally, a physiological decrease in pulsatility can be noticed in both cases. Furthermore, the global hemodynamic changes in HR, SV, CO, total peripheral resistance, and left ventricular contractility to achieve arterial pressure control agree with aggregated experimental data and previous computational model results (Fois et al., 2022). While the relative magnitude of the changes is smaller in our model compared to literature, it accurately reproduces the dynamics of the hemodynamic transient of a head up tilt.
3.2 Walking-induced hemodynamics in steady state
3.2.1 Equivalence of SR and HR
At rate-equivalence, inertial effects associated with walking are evident in the normalized pressure waveforms of the descending aorta, as illustrated in Figure 3. The Figure shows increasing phase shifts (arrows) between the heart contraction (red) and the maximum body acceleration (blue). Compared to the baseline waveform while standing (Figure 3A), walking introduces an additional hydrodynamic pressure component (Figure 3B), resembling the waveform shape of the chest acceleration. As the acceleration peak shifts with respect to the cardiac contraction, the resulting inertia-induced pressure augmentation also shifts towards the diastolic part of the waveform to the right. Depending on the phase shift between cardiovascular and locomotor activity, and thus on the timing of this interaction, the increase is observed either in systolic or diastolic pressure, (Figure 3C).
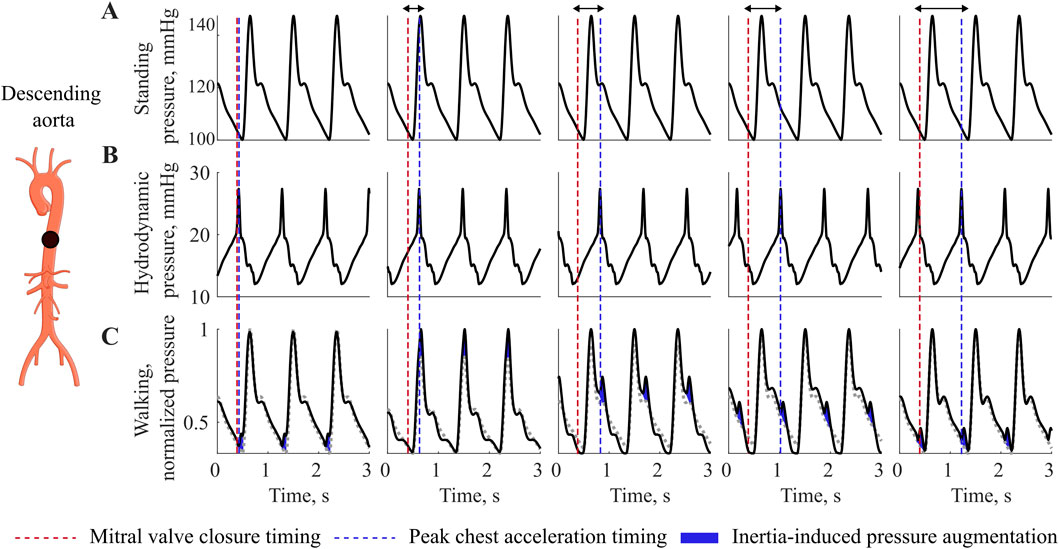
Figure 3. Interaction at equivalence of HR and SR. Pressure variations during walking at different phase relationship between heart contraction and maximal acceleration, showing pressure augmentation during walking compared to resting. (A) Standing pressure, (B) Walking hydrodynamic pressure, (C) Walking pressure. Red dotted line depicts the mitral valve closure timing, while the blu dotted line depicts the timing of chest acceleration peak related to the walking movement. Blue, inertia-induces pressure augmentation.
3.2.2 SR higher then HR
When the SR exceeds the HR, the phase is no longer constant and we expect higher order system interactions between two systems of similar frequency. In the time-series signal, we observe a low frequency component in the pressure waveform, characterized by a frequency lower than both HR and SR, Figure 4A. The MAP also reflects this interaction, exhibiting a sinusoidal pattern, with low frequency.
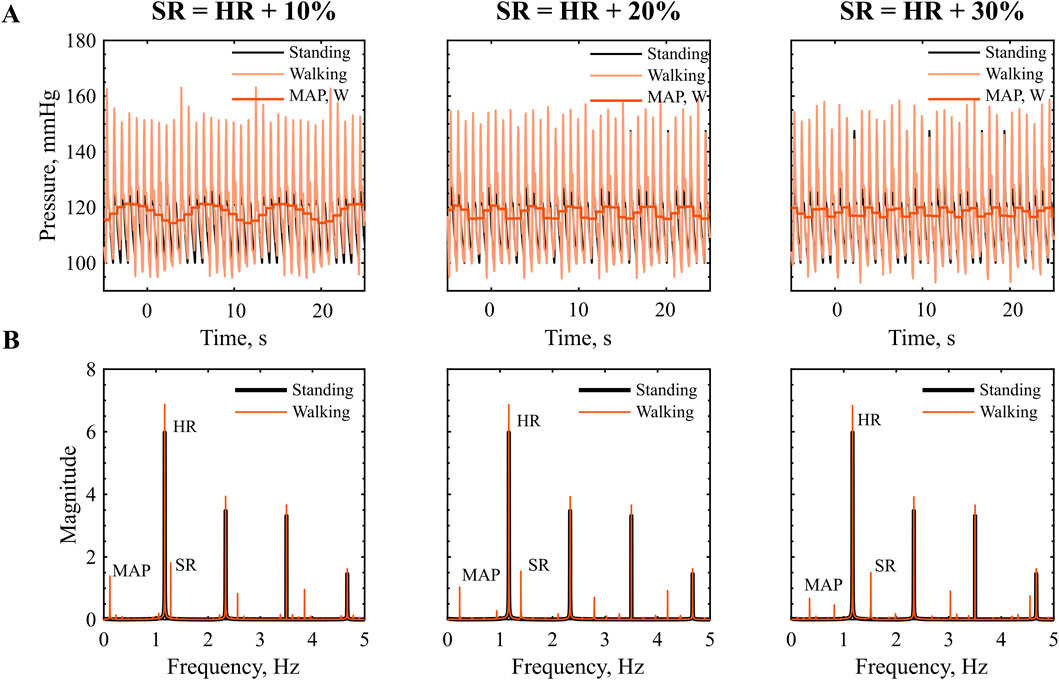
Figure 4. Interaction at SR higher then HR: (A) Time series of pressure in the descending aorta during walking, red, vs. standing, black. (B) Frequency amplitude spectra, prominent peaks indicate the dominant frequency components in the signal. HR = 70 bpm, SR = 77, 84, 93 steps/min.
The frequency spectrum in Figure 4B reveals distinct peaks at the SR the HR and their higher order harmonics. As presented in Table 5, we can link most frequency peaks to the imposed HR and SR. The dominant low frequency is associated with the lower frequency observed in the MAP. The value is equal to the difference between SR and HR across all conditions tested, which suggests that the signal results from a ‘beating’ interaction between the HR and SR. However, the addition of the two frequencies does not result in a frequency peak. Additional low-frequency components emerge in the range between the ‘beating’ frequency and the HR. The low magnitude of these components (f
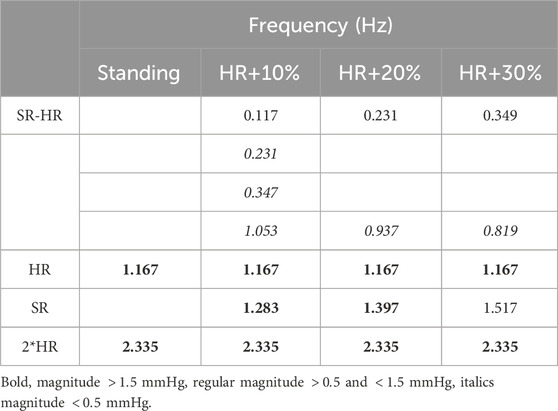
Table 5. Frequency content of the pressure waveform in the descending aorta in standing and different walking frequency. HR = 70 bpm, SR = 77, 84, 93 steps/min.
3.3 Experimental validation with heart-paced walking
The experimental validation methodology and collected data are presented in Figure 5. The model receives time series inputs of HR, derived from the ECG, and vertical chest acceleration, and generates an estimate of arterial pressure. This simulated pressure is then compared against experimentally measured brachial pressure. As illustrated in the 30-s snapshots in Figure 5, the simulated pressure accurately captures the amplitude modulations associated with walking activity, exhibiting consistent narrowing and elevation of both systolic and diastolic pressure peaks. Heel strike events, identified from pressure insole data, are used to determine the precise timing of each step and to characterize the phase relationship between the cardiac and gait cycles.
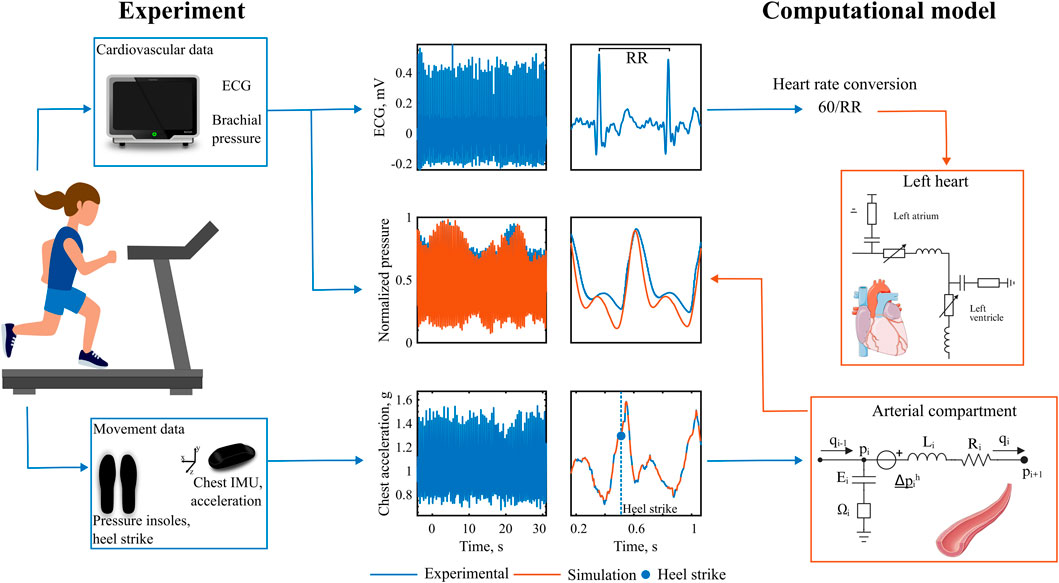
Figure 5. Experimental validation with heart-paced walking. Data recorded during heart-paced treadmill walking. The experimental chest acceleration and heart rate data are fed into the computational model, which output the simulated pressure. Experimental recorded brachial pressure is then compared with the simulated pressures.
A more detailed analysis of pressure amplitude modulations induced by inertial effects at varying phase shifts reveals distinct patterns in the pressure waveform. These patterns become evident when the data are grouped according to the phase relationship between cardiac contraction and peak body acceleration, as shown in Figure 6. We observe two distinct pressure responses to synchronized walking in the two subjects. In P1, during early phases (0%–10%), a small pressure elevation appears just before the onset of the main systolic upstroke. As the phase between the two signals increases, the timing of the pressure augmentation shifts within the cardiac cycle. In mid-phase intervals (40%–50%), it manifests as an augmented systolic peak, while in later phases (60%–90%), it contributes to an elevated diastolic peak pressure. Notably, in the final phase (90%–100%), the pressure waveform adopts a distinct bi-phasic shape, similar to the pattern observed in the initial phases (0%–10%). In addition to the variability in waveform shape, we further observe a variable pressure pulsatility depending on the phase. In P2, instead, the waveform morphology does not show visible changes across all phases. However, the small variability present is captured well in the simulated waveform.
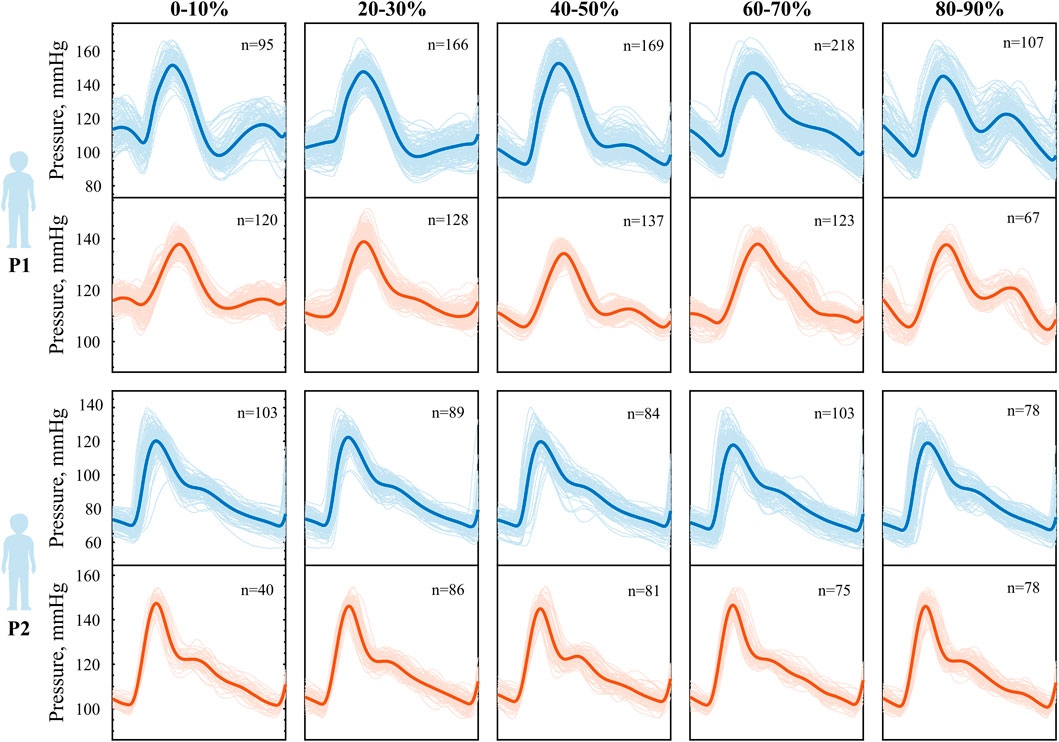
Figure 6. Phase-modulation during heart-paced walking in P1 above and P2 below. Averaged pressure waveform for different phase relationship between step and cardiac contraction, experimental (blue) vs. simulated (orange). Phase 0% indicates heel strike coinciding with cardiac contraction, while phase 100% indicated heel strike coinciding with the subsequent cardiac contraction.
The waveforms were constructed as an average over a significant number of beats (40
The computational model of walking accurately reproduces the extent of pressure amplitude modulation induced by variable amplitude of the inertial effects, as noticeable in Figure 7, P1. In the reported example, peak body accelerations are slightly different between right and left-sided stepping, such that the amplitude of the walking-induced body acceleration influences the diastolic peak amplitude. It can be qualitatively observed that both the experimental and simulated pressure waveform closely follow this alternating pattern: a lower systolic peak when peak body acceleration is low, and a reduced dicrotic notch together with an elevated diastolic peak when the acceleration trough, corresponding to the toe-off phase of the walking cycle, becomes more pronounced. The cyclic alternation of this behavior could be due to different push-off intensity of the two legs.
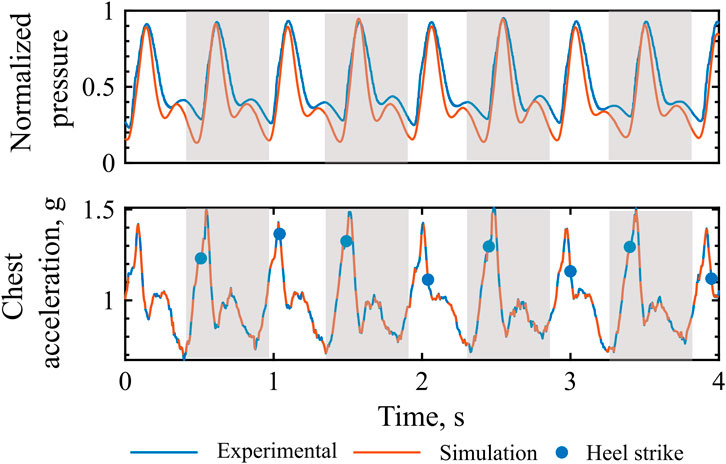
Figure 7. Extent of pressure augmentation: Experimental vs. simulated pressure waveform and chest acceleration. Grey, left leg step.
3.3.1 Waveform morphology
A total of 1.120 waveforms for P1 and 750 for P2 were included in this analysis. The similarity index and cumulative distribution function are shown in Figure 8 for both participants. The morphology results indicate an increase in similarity index when hydrodynamic pressure is incorporated in the model for both subjects (K-stat 0.123 vs. 0.029, P1 and 0.164 vs. 0.059, P2). The distributions are closely aligned for the two extremes 0 and 1, representing pressure onset and systolic peaks. Larger difference is instead observed for pressure values between 0.4 and 0.6, most likely to occur at the diastolic phase of cardiac cycle. It is further noted that all pairwise comparisons between simulation and experiment still indicate that the distributions remain significantly different (p
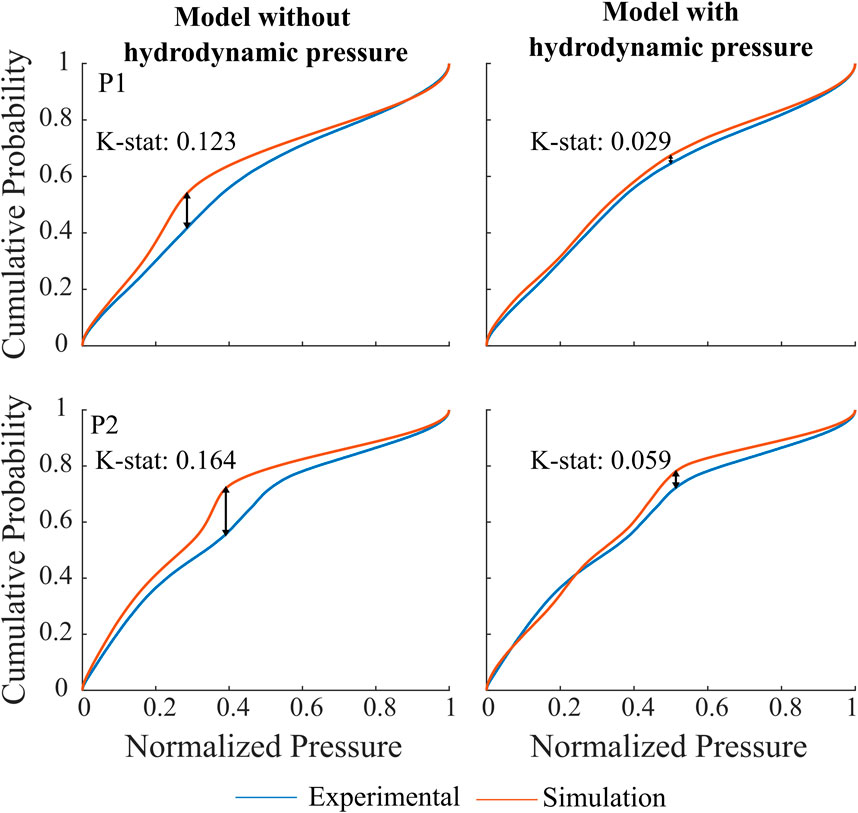
Figure 8. Cumulative distribution function and K-stat for P1 and P2 when hydrodynamic pressure is not implemented, left vs. when hydrodynamic pressure is implemented in the model, right. The arrows represent the maximum difference between the experimental and simulated time series.
4 Discussion
We have demonstrated the ability to computationally model walking-induced inertial effects on the blood pressure waveforms of the cardiovascular system. The motion-induced inertial component of the blood re-acting to body acceleration, alters waveform morphology from the commonly known resting blood pressure waveforms.
Our model reproduces pressure waveform morphology in standing and during walking, which was validated with illustrative high quality experimental time-series data in two subjects. The implementation of gravity and baroreflex autoregulation has been validated against literature. Although the autoregulation response is slightly smaller in our model, possibly due to different gain of the feedback loop, it accurately captures all of the known cardiovascular responses in a physiological way. More importantly, comparison of pressure waveforms during walking between model and experimental data exhibited high similarity in both morphology, with an emphasis of timing of the augmentation peak and relative amplitude. Furthermore, the extent of pressure augmentation was seen to be related with peak body acceleration amplitude in both experiment and simulation. Hydrodynamic pressure contribution improves the degree of similarity of the resulting waveform morphology. We conclude that introducing contributions of body acceleration as an additional dynamic component of the pressure source in the vascular compartments, seems a valid way to capture walking induced inertial effects.
Locomotor and cardiovascular function are linked via a variety of mechanism including the venous muscle pump, body acceleration induced inertial effects as well as potentially altered peripheral wave reflection timing during rhythmic muscle contraction. Our results indicate that inertia-induced effects play a major role in this interaction. Previous studies reported observations of ‘beating’ of the arterial pressure waveform during running but not during cycling (Palatini et al., 1989a; Palatini et al., 1989b), which was unrelated with respiration. Their results further support the hypothesis that the effect is driven by gravity-induced inertial forces. Interestingly, their study quantified the hydrodynamic pressure component using a saline-filled container, reporting values ranging from approximately 10–65 mmHg. In our simulations, the hydrodynamic pressure contribution was estimated to be in the range from 15 to 25 mmHg, consistent with the values observed experimentally. During running, we anticipate more pronounced body accelerations, which would lead to greater inertial forces and correspondingly higher hydrodynamic pressure components.
In a separate study, researchers (O’Rourke et al., 1993) recorded pressure variations induced by running during both systolic and diastolic phases and compared them to pressure waveforms generated by an intra-aortic balloon pump. They found that running with diastolic phase acts as a counterpulsation, closely resembling the effect of the intraortic balloon pump, timed to reduce systolic and increase diastolic pressure. The characteristic shapes observed in O’Rourke recordings closely resemble those found in our study. Specifically, higher pulse pressure have monophasic shape, while lower pulse pressure biphasic.
Our study was designed with a high degree of synchronization between movement and heart rate. This allowed us to stratify the pressure waveforms into a wide range of phases and observe subtle, beat-to-beat hemodynamic effects. The model was able to follow these phase-related pressure changes and showed good agreement with experimental patterns. However, despite the qualitative similarity in waveform shape, the magnitude of changes differed between experimental and simulated data. This discrepancy is likely due to differences in the lengths and properties of cardiovascular compartments that have not been accounted for. Additionally, other mechanisms, such as variation in skeletal muscle activation, not currently represented in the model may also play a role in pressure modulation. Longer time-scale regulatory mechanisms, such as metabolic perturbations and hormonal control, are also not implemented in the model. As a result, slower compensatory adaptations are not captured.
Our simulation’s results with synthetic acceleration allowed for detailed study of possible physiological interactions between the cardiovascular and locomotion system dynamics. Low frequency ‘beating’ effects were identifiable in the resulting spectrum when the SR exceeded the HR. Consistent with previous findings by Palatini et al. (1989b), the beating frequency corresponds to the difference between HR and SR. In their experiments, MAP remained stable; in contrast, our simulations revealed a reduction in MAP with an increased difference between SR and HR, resulting in lower-frequency oscillations in the pressure waveform. These results are considered exploratory and will require further experimental validation. The physiological implications of such lower frequency behavior remain an open topic for investigation.
Limitations of the study include a small number of subjects against which the model was validated. We mitigate some of this limitation, by closely controlling the experimental condition, allowing for a beat-to-beat analysis and by analysing over a significant number of beats and steps. The observations made in this study regarding pulse waveform characteristics require further validation through additional quantitative measurements, for example, analyzing the timing and magnitude of the pressure augmentation in relation to specific features of the acceleration signal in a representative population. The inertial effects identified are primarily expressed as pressure augmentation or reduction within the major aortic arteries. However, it is likely that walking also influences other key cardiovascular parameters, including preload, cardiac filling and afterload. The potential physiological effects of optimizing the phase relationship between walking and cardiac function remain an open question that deserves further investigation. This study actively refrains from drawing too many conclusions about the closed-loop cardiovascular effects of walking on the cardiovascular system, as the limited amount of subjects would render this highly speculative. Additionally, in real-world walking, CLC emerges from bidirectional interactions, where both cardiac and locomotor rhythms influence one another in real time. As we are not modeling bidirectional interactions, the findings derived from heart-paced walking may not fully reflect the dynamics of cardio-muscular coordination in free movement.
5 Conclusion
In conclusion, we present here a closed-loop cardiovascular model, which allows the study of dynamic pressure phenomena induced by bodily acceleration in hemodynamic waveforms.
Data availability statement
The raw data supporting the conclusions of this article will be made available by the authors, upon reasonable request.
Ethics statement
The studies involving humans were approved by Swedish authorities (2023-00426-01). The studies were conducted in accordance with the local legislation and institutional requirements. The participants provided their written informed consent to participate in this study. Written informed consent was obtained from the individual(s) for the publication of any potentially identifiable images or data included in this article.
Author contributions
AR: Methodology, Data curation, Formal Analysis, Validation, Conceptualization, Investigation, Software, Visualization, Writing – original draft, Writing – review and editing. EP: Visualization, Conceptualization, Methodology, Validation, Formal Analysis, Writing – original draft, Software, Data curation, Writing – review and editing, Investigation. ER: Writing – review and editing, Formal Analysis, Supervision, Visualization. SD: Writing – original draft, Supervision, Writing – review and editing, Methodology, Visualization, Formal Analysis, Project administration, Funding acquisition, Validation, Resources, Conceptualization.
Funding
The author(s) declare that financial support was received for the research and/or publication of this article. We acknowledge support from Promobilia Stiftelse (A23042) and Åke Wiberg Foundation (M23-0018).
Conflict of interest
The authors declare that the research was conducted in the absence of any commercial or financial relationships that could be construed as a potential conflict of interest.
Generative AI statement
The author(s) declare that no Generative AI was used in the creation of this manuscript.
Any alternative text (alt text) provided alongside figures in this article has been generated by Frontiers with the support of artificial intelligence and reasonable efforts have been made to ensure accuracy, including review by the authors wherever possible. If you identify any issues, please contact us.
Publisher’s note
All claims expressed in this article are solely those of the authors and do not necessarily represent those of their affiliated organizations, or those of the publisher, the editors and the reviewers. Any product that may be evaluated in this article, or claim that may be made by its manufacturer, is not guaranteed or endorsed by the publisher.
References
Balagué, N., Hristovski, R., Almarcha, M. d. C., Garcia-Retortillo, S., and Ivanov, P. C. (2020). Network physiology of exercise: vision and perspectives. Front. Physiology 11, 611550. doi:10.3389/fphys.2020.611550
Bashan, A., Bartsch, R. P., Kantelhardt, J. W., Havlin, S., and Ivanov, P. C. (2012). Network physiology reveals relations between network topology and physiological function. Nat. Commun. 3, 702. doi:10.1038/ncomms1705
Belardinelli, E., Ursino, M., and Iemmi, E. (1989). A preliminary theoretical study of arterial pressure perturbations under shock acceleration. J. Biomechanical Eng. 111, 233–240. doi:10.1115/1.3168372
Blomqvist, C. G., and Stone, H. L. (1991). Cardiovascular adjustments to gravitational stress. Handbook Of Physiology - The Cardiovascular System 111. USA. Available online at: https://ntrs.nasa.gov/citations/19910016260.
Broomé, M., Maksuti, E., Bjällmark, A., Frenckner, B., and Janerot-Sjöberg, B. (2013). Closed-loop real-time simulation model of hemodynamics and oxygen transport in the cardiovascular system. Biomed. Eng. OnLine 12, 69. doi:10.1186/1475-925X-12-69
Chiu, Y. C., Arand, P. W., Shroff, S. G., Feldman, T., and Carroll, J. D. (1991). Determination of pulse wave velocities with computerized algorithms. Am. Heart J. 121, 1460–1470. doi:10.1016/0002-8703(91)90153-9
Chung, D. C., Niranjan, S. C., Clark, J. W., Bidani, A., Johnston, W. E., Zwischenberger, J. B., et al. (1997). A dynamic model of ventricular interaction and pericardial influence. Am. J. Physiology-Heart Circulatory Physiology 272, H2942–H2962. doi:10.1152/ajpheart.1997.272.6.H2942
Constantini, K., Stickford, A. S. L., Bleich, J. L., Mannheimer, P. D., Levine, B. D., and Chapman, R. F. (2018). Synchronizing gait with cardiac cycle phase alters heart rate response during running. Med. and Sci. Sports and Exerc. 50, 1046–1053. doi:10.1249/MSS.0000000000001515
Coonan, T. J., and Hope, C. E. (1983). Cardio-respiratory effects of change of body position. Can. Anaesthetists’ Soc. J. 30, 424–438. doi:10.1007/BF03007869
Dahn, I., Jonson, B., and Nilsen, R. (1970). Plethysmographic in vivo determinations of elastic properties of arteries in man. J. Appl. Physiology 28, 328–332. doi:10.1152/jappl.1970.28.3.328
Diaz Artiles, A., Heldt, T., and Young, L. R. (2016). Effects of artificial gravity on the cardiovascular system: computational approach. Acta Astronaut. 126, 395–410. doi:10.1016/j.actaastro.2016.05.005
Fisher, J. P., Zera, T., and Paton, J. F. R. (2022). “Chapter 10 - respiratory–cardiovascular interactions,” in Handbook of clinical neurology. Editors R. Chen, and P. G. Guyenet (Elsevier), 279–308. doi:10.1016/B978-0-323-91534-2.00006-0
Fitzjerrell, D., White, R., and Croston, R. (1983). Cardiovascular modelling: simulating the human response to exercise, lower body negative pressure, zero gravity and clinical conditions. vol. 5. 195–229.
Fois, M., Maule, S. V., Giudici, M., Valente, M., Ridolfi, L., and Scarsoglio, S. (2022). Cardiovascular response to posture changes: Multiscale modeling and in vivo validation during Head-Up tilt. Front. Physiology 13, 826989. doi:10.3389/fphys.2022.826989
Fresiello, L., Meyns, B., Di Molfetta, A., and Ferrari, G. (2016). A model of the cardiorespiratory response to aerobic exercise in healthy and heart failure conditions. Front. Physiology 7, 189. doi:10.3389/fphys.2016.00189
Fumagalli, I., Pagani, S., Vergara, C., Dede’, L., Adebo, D. A., Del Greco, M., et al. (2024). The role of computational methods in cardiovascular medicine: a narrative review. Transl. Pediatr. 13, 146–163. doi:10.21037/tp-23-184
Gallo, C., Ridolfi, L., and Scarsoglio, S. (2020). Cardiovascular deconditioning during long-term spaceflight through multiscale modeling. Microgravity 6, 27–14. doi:10.1038/s41526-020-00117-5
Garcia-Retortillo, S., and Ch Ivanov, P. (2024). Dynamics of cardio-muscular networks in exercise and fatigue. J. Physiology. Available online at: https://physoc.onlinelibrary.wiley.com/doi/pdf/10.1113/JP286963.doi:10.1113/JP286963
Garcia-Retortillo, S., Gacto, M., O’Leary, T. J., Noon, M., Hristovski, R., Balagué, N., et al. (2019a). Cardiorespiratory coordination reveals training-specific physiological adaptations. Eur. J. Appl. Physiology 119, 1701–1709. doi:10.1007/s00421-019-04160-3
Garcia-Retortillo, S., Javierre, C., Hristovski, R., Ventura, J. L., and Balagué, N. (2019b). Principal component analysis as a novel approach for cardiorespiratory exercise testing evaluation. Physiol. Meas. 40, 084002. doi:10.1088/1361-6579/ab2ca0
Heldt, T. (2004). Computational models of cardiovascular response to orthostatic stress. Thesis: Massachusetts Institute of Technology.
Ivanov, P. C. (2021). The new field of network physiology: building the human physiolome. Front. Netw. Physiology 1, 711778. doi:10.3389/fnetp.2021.711778
Langan, S. (2025). Timing is everything: complex (A)synchrony of heart–muscle interactions during exercise. J. Physiology. doi:10.1113/JP287967
Lau, K. D., and Figueroa, C. A. (2015). Simulation of short-term pressure regulation during the tilt test in a coupled 3D–0D closed-loop model of the circulation. Biomechanics Model. Mechanobiol. 14, 915–929. doi:10.1007/s10237-014-0645-x
Malliaras, K., Charitos, E., Diakos, N., Pozios, I., Papalois, A., Terrovitis, J., et al. (2014). Effects of intra-aortic balloon pump counterpulsation on left ventricular mechanoenergetics in a porcine model of acute ischemic heart failure. J. Cardiovasc. Transl. Res. 7, 810–820. doi:10.1007/s12265-014-9600-6
Maughan, W. L., Sunagawa, K., and Sagawa, K. (1987). Ventricular systolic interdependence: volume elastance model in isolated canine hearts. Am. J. Physiol. Heart Circ. Physiol. 253, H1381–H1390. doi:10.1152/ajpheart.1987.253.6.H1381
Mynard, J. P., Davidson, M. R., Penny, D. J., and Smolich, J. J. (2012). A simple, versatile valve model for use in lumped parameter and one-dimensional cardiovascular models: a simple, versatile valve model for cardiovascular models. Int. J. Numer. Methods Biomed. Eng. 28, 626–641. doi:10.1002/cnm.1466
W. W. Nichols, M. O’Rourke, E. R. Edelman, and C. Vlachopoulos (2022). McDonald’s blood flow in arteries: theoretical, experimental and clinical principles. 7 edn (Boca Raton: CRC Press). doi:10.1201/9781351253765
Niizeki, K. (2005). Intramuscular pressure-induced inhibition of cardiac contraction: implications for cardiac-locomotor synchronization. Am. J. Physiology-Regulatory, Integr. Comp. Physiology 288, R645–R650. doi:10.1152/ajpregu.00491.2004
Niizeki, K., Kawahara, K., and Miyamoto, Y. (1993). Interaction among cardiac, respiratory, and locomotor rhythms during cardiolocomotor synchronization. J. Appl. Physiology 75, 1815–1821. doi:10.1152/jappl.1993.75.4.1815
O’Rourke, M., and Avolio, A. (1992). Improved cardiovascular performance with optimal entrainment between heart rate and step rate during running in humans. Coron. Artery Dis. 3, 863–869. doi:10.1097/00019501-199209000-00014
O’Rourke, M., Avolio, A., Stelliou, V., Young, J., and Gallagher, D. (1993). The rhythm of running: can the heart join in? Aust. N. Z. J. Med. 23, 708–710. doi:10.1111/j.1445-5994.1993.tb04732.x
Palatini, P., Mos, L., Mormino, P., Di Marco, A., Munari, L., Fazio, G., et al. (1989a). Blood pressure changes during running in humans: the “beat” phenomenon. J. Appl. Physiology 67, 52–59. doi:10.1152/jappl.1989.67.1.52
Palatini, P., Mos, L., Munari, L., Mormino, P., Torre, M. D., Valle, F., et al. (1989b). Beats modulate blood pressure during running. Am. J. Hypertens. 2, 872–874. doi:10.1093/ajh/2.11.872
Peterson, K., Ozawa, E. T., Pantalos, G. M., and Sharp, M. K. (2002). Numerical simulation of the influence of gravity and posture on cardiac performance. Ann. Biomed. Eng. 30, 247–259. doi:10.1114/1.1451075
Rafik, G. (2021). Several theoretical and applied problems of human extreme physiology: mathematical modeling. J. Hum. Physio. 3 (Number: 2), 57–70. doi:10.30564/jhp.v3i2.4175
Smith, J. J., Porth, C. M., and Erickson, M. (1994). Hemodynamic response to the upright posture. J. Clin. Pharmacol. 34, 375–386. doi:10.1002/j.1552-4604.1994.tb04977.x
Stergiopulos, N., Meister, J. J., and Westerhof, N. (1996). Determinants of stroke volume and systolic and diastolic aortic pressure. Am. J. Physiol. Heart Circ. Physiol. 270, H2050–H2059. doi:10.1152/ajpheart.1996.270.6.H2050
Sun, Y., Sjoberg, B. J., Ask, P., Loyd, D., and Wranne, B. (1995). Mathematical model that characterizes transmitral and pulmonary venous flow velocity patterns. Am. J. Physiology-Heart Circulatory Physiology 268, H476–H489. doi:10.1152/ajpheart.1995.268.1.H476
Sun, Y., Beshara, M., Lucariello, R. J., and Chiaramida, S. A. (1997). A comprehensive model for right-left heart interaction under the influence of pericardium and baroreflex. Am. J. Physiology-Heart Circulatory Physiology 272, H1499–H1515. doi:10.1152/ajpheart.1997.272.3.H1499
Tauraginskii, R. A., Lurie, F., Simakov, S., Agalarov, R., Borsuk, D., and Khramtsov, P. (2023). Calf muscle pump pressure-flow cycle during ambulation. J. Vasc. Surg. Venous Lymphatic Disord. 11, 783–792.e7. doi:10.1016/j.jvsv.2023.04.002
Wakeham, D. J., Ivey, E., Saland, S. A., Lewis, J. S., Palmer, D., Morris, M., et al. (2023). Effects of synchronizing foot strike and cardiac phase on exercise hemodynamics in patients with cardiac resynchronization therapy: a within-subjects pilot study to fine-tune cardio-locomotor coupling for heart failure. Circulation 148, 2008–2016. doi:10.1161/CIRCULATIONAHA.123.066170
Walløe, L., and Wesche, J. (1988). Time course and magnitude of blood flow changes in the human quadriceps muscles during and following rhythmic exercise. J. Physiology 405, 257–273. doi:10.1113/jphysiol.1988.sp017332
Zhang, D. (2002). An experimental and modelling study of the relationship between step rate and heart rate during running exercise. University of New South Wales. doi:10.26190/unsworks/4473
Keywords: lumped parameter modeling, cardiovascular modeling, walking, baroreflex, physiological network, cardiac locomotor coupling, network physiology, hemodynamic
Citation: Rosato A, Perra E, Rullman E and Dual SA (2025) Walking-induced inertial effects on the cardiovascular system. Front. Netw. Physiol. 5:1637551. doi: 10.3389/fnetp.2025.1637551
Received: 29 May 2025; Accepted: 11 August 2025;
Published: 25 September 2025.
Edited by:
Ginés Viscor, University of Barcelona, SpainReviewed by:
Sergi Garcia-Retortillo, University of Central Florida, United StatesÓscar Abenza Ortega, University of Barcelona, Spain
Copyright © 2025 Rosato, Perra, Rullman and Dual. This is an open-access article distributed under the terms of the Creative Commons Attribution License (CC BY). The use, distribution or reproduction in other forums is permitted, provided the original author(s) and the copyright owner(s) are credited and that the original publication in this journal is cited, in accordance with accepted academic practice. No use, distribution or reproduction is permitted which does not comply with these terms.
*Correspondence: Aurora Rosato, cm9zYXRvQGt0aC5zZQ==; Seraina A. Dual, c2VyYWluYUBrdGguc2U=