Your new experience awaits. Try the new design now and help us make it even better

BRIEF RESEARCH REPORT article

Front. Netw. Physiol., 19 September 2025

Sec. Networks of Dynamical Systems

Volume 5 - 2025 | https://doi.org/10.3389/fnetp.2025.1657313

This article is part of the Research TopicSelf-Organization of Complex Physiological Networks: Synergetic Principles and Applications — In Memory of Hermann HakenView all 9 articles

Analysis of a model for bacteriophage infections and bacteria defense: a synergetics perspective

  • 1Department of Psychological Sciences, University of Connecticut, Storrs, CT, United States
  • 2Department of Physics, University of Connecticut, Storrs, CT, United States

A model for bacteriophage infections and bacteria defense is analyzed using the concepts of synergetics. The model order parameter is determined and the corresponding amplitude equations are derived. Within this framework it is shown how the order parameter defines a multi-species building block that captures the organization of infection outbreaks and the initial defense reaction and how the order parameter amplitude determines the corresponding temporal characteristics. Two approximative models with different domains of application are derived as well. In doing so, a supplementary perspective of bacteriophage infections that provides insights beyond the classical state space perspective is provided.

1 Introduction

In general, epidemiological systems are given by complex networks of interacting populations of different species (Pastor-Satorras et al., 1998). While the isolated populations typically exhibit a relatively simple dynamics, a challenge in the field of network physiology is to understand how the interactions between the different types of species shape the overall network dynamics. In this context, an important first step is to consider mean field approximations in terms of ODE and coupled differential equation models (Pastor-Satorras et al., 1998; Granger et al., 2024), which due to their relative simplicity frequently allow for analytical solution methods. For virus infections the ODE three-species TIV model captures the basic dynamics of interacting target cells, infected cells, and virus particles (Nowak and May 2000). Likewise, in the context of bacteriophage infections, we are dealing with target bacteria, infected bacteria, and bacteriophages–the latter act as viruses. Studying bacterial infections and the role of bacteriophages is an important task (Bloch and Wegrzyn, 2024; Geng et al., 2022; Zborowsky et al., 2025) and is an indispensable step when attempting to use phages in modern medicine to cure certain diseases in humans (Li et al., 2021; Zborowsky et al., 2025). To this end, both simplified and generalized three-species models have been studied in the literature (Li et al., 2021; Weitz et al., 2005; Zborowsky et al., 2025). In particular, as part of their comprehensive study, Skanata and Kussell (2021) considered bacteria that can exist as resistant and non-resistant phenotypes with respect to a given invading phage. Increasing the concentration of resistant phenotypes is a defense mechanism against phage attack because this mechanism decreases the effective contact rate between phage and non-resistant bacteria such that under appropriate conditions the infection dies out. While the dynamics systems perspective, in general, is an indispensable tool to analyze bacteriophage infection models, little attention has been paid to utilize the more specific dynamical systems concepts of synergetics (Haken, 2004; Hutt and Haken, 2020; Uhl, 1999; Wunner and Pelster, 2016) in this regard. However, in the wake of the COVID-19 pandemic it has been shown that synergetics can supplement existing dynamic systems approaches to understand epidemiological and virus dynamic models (Frank, 2022). In this Brief Report a parsimonious four-species model for bacteriophage infection and bacteria defense will be considered that involves resistant phenotypes as in Skanata and Kussell (2021). The relative simplicity of the model will allow for an analytical approach. The aim of the study is to derive explicitly the order parameter of the model and to show how it determines the initial organization of a phage attack and the corresponding defense reaction. Moreover, the aim is to derive the amplitude equations that determine the evolution of the system along the order parameter and the remaining directions. Two approximative models for the system dynamics in this context will be derived as well. An exemplary simulation will illustrate some of the analytical results.

2 Materials and methods

As reviewed above, our starting point is the three-species model that involves susceptible (S) and infected (I) bacteria and phage load (P). In line with the TIV model of virus dynamics (Frank, 2022) the model equations read

ddtS=k0PS+μS1SK,ddtI=k0PSk1I,ddtP=qIk2P,(1)

with k1,k2,q>0, where t denotes time, k0 describes the P-dependent transition rate of SI transitions, k1 and k2 denote the decay rates of infected cells and phages, respectively, and q describes the production rate of phages per infected bacteria. The evolution equation for S involves a logistic growth term with the growth rate μ and the capacity K>0. Below we will consider both the case μ=0 when the growth term can be neglected and the more general case μ>0. By comparing these two cases, we will see that the bacterial growth dynamics actually has no effect on the initial outbreaks dynamics captured by the order parameter. Therefore, the growth term may be neglected when (i) changes in S are primarily due to SI transitions capture by the k0S-term or (ii) the focus is on the initial phase of the outbreak dynamics. The transition rate k0(P) in Equation 1 depends on the infecting species like k0=β0P, where β0>0 denotes the effective contact rate (Frank, 2022). In order to take the active defense mechanism mentioned in the introduction into account, the model (1) was modified in two ways. First, it was assumed that when infected bacteria I emerge in the bacteria population then resistant bacteria mutations (R) are grown like

ddtR=αI1RRm,(2)

where α0 and Rm>0 denote the growth rate and the maximal concentration of resistant bacteria, respectively. From a mechanistic point of view, Equation 2 captures the adaptive defense mechanism of bacteria via the so-called CRISPR system (Abedon, 2012; Skanata and Kussell, 2021). The CRISPR system allows bacteria to memorize attacking phages such that they become immune against future attacks. In doing so, in the presence of invading phages phage-resistant bacteria emerge. Second, in general, there are several mechanism with which resistant bacteria R may slow down or stop a bacteriophage infection (Skanata and Kussell, 2021). Again, for sake of brevity, only the effect of R on the SI transition rate was considered. By doing so, the transition rate k0 becomes a function of Rand P and reads (Skanata and Kussell, 2021)

k0P,R=β01+γRP,(3)

where γ0 measures the effectivity of the active defense mechanism. Basically, Equation 3 states that the presence of resistant cells lowers the chance of an effective contact between phages and susceptible bacteria, such that the R-dependent effective contact rate reads β=β0/(1+γR).

Taking a synergetics perspective (Haken, 2004; Frank, 2022), for the model (1–3) the order parameter and the amplitude equations were derived. To this end, using the state vector X=(S,I,P,R), bacteriophage infections were considered that start close to an initial fixed point Xst,0=(Sst,0,Ist,0,Pst,0,Rst,0) (see Results and Discussions section) of the model. Subsequently, with the help of the eigenvectors vj obtained from a linear stability analysis the amplitudes Aj were implicitly defined by

X=Xst,0+j=14Ajvj.(4)

By constructing a bi-orthogonal basis (Haken, 2004; Frank, 2022) spanned by the vectors wj with wivk=δik (Kronecker symbol), the amplitudes were explicitly expressed like

Aj=wju=wjXXst,0,(5)

where u denotes the difference vector u=XXst,0. From the model Equations 13 and Equation 5, eventually the model amplitude equations of the form

ddtAj=λjAj+NjA(6)

were derived for j=1,2,3,4 with A constituting the amplitude vector A=(A1,A2,A3,A4). In Equation 6 λj denote the eigenvalues of the system and Nj are nonlinear functions in the amplitudes. The order parameter and its order parameter amplitude were identified as the eigenvector vj and its amplitude Aj corresponding to the potentially positive eigenvalue λj of the model (Haken, 2004; Frank, 2022).

3 Results and discussions

3.1 Amplitude equation perspective

The fixed-point analysis showed that the model (1–3) exhibits the phage-free fixed points defined by

Sst0,Ist=0,Pst=0,Rst0,Rm(7)

for μ=0. For μ>0 Equation 7 holds with Sst=K. As mentioned in the Methods section, it is assumed that at time t<0, i.e., before the infection takes place, the system stays in a fixed point (7). The fixed point is referred to as initial fixed point and denoted by Xst,0. At time t=0 the bacteria population is infected by phages of concentration P(0)>0 such that the state is shifted out of its fixed point. Consequently, the model describes infection outbreaks that begin with an initial phage infection of P(0)>0 at time t=0 and end in a phage-free state defined by Equation 7 or an endemic state if it exists (see below).

The linear stability analysis at Xst,0 showed that the model for μ0 exhibits the eigenvalues λ1=μ, λ4=0, as well as

λ2,3=k1+k22±k1+k224k1k2+qβ0fst,0Sst,0(8)

with fst,0=1/[1+γRst,0], where the upper (lower) sign holds for λ2 (λ3). For μ>0 in Equation 8 and in what follows we must substitute Sst,0=K. It can be shown that for arbitrary model parameters λ3<0 holds. In contrast, λ2 can assume positive or negative values. In this context, note that using the next-generation method, the basic reproduction number R0 of the model (Frank, 2022) can be obtained as R0=qβ0fst,0Sst,0/(k1k2). Case I is defined by qβ0fst,0Sst,0<k1k2λ2<0, which is equivalent to R0<1, such that the fixed point Xst, is a neutrally stable/asymptotically stable fixed point for μ=0 and μ>0, respectively. There is no infection outbreak. Tn contrast case II is characterized by qβ0fst,0Sst,0>k1k2λ2>0, which is tantamount to say that R0>1 holds. The fixed point is unstable. The infection dynamics describes an infection outbreak. The inequality means that the infection outbreak scenario, i.e., case II, occurs when the system parameters q and β0 are relatively large, the initial value Sst,0 is relatively large, while the initial concentration Rst,0 is relatively small. For μ=0 the model exhibits only phage-free fixed points. A detailed calculation shows that for μ>0 an endemic fixed point exists if the defense mechanism via the R dynamics cannot stabilized the phage-free fixed point with Sst,0=K. Mathematically speaking, if λ2>0 holds for Sst,0=K,Rst,0=Rm, which is equivalent to say that k1k2<qβ0fst,R(max)K holds (where fst,R(max)=1/(1+γRm)), then an endemic fixed point with Ist(0,K) and Pst>0 exists. Having said that since the objective of the study is examine initial infection outbreaks from the phage-free state, we will not dwell on the endemic state.

The linear stability analysis of the phage-free fixed point produced the eigenvectors v1=(1,0,0,0) and v4=(0,0,0,1) associated with the zero eigenvalues λ1 and λ4. For j=2,3 the eigenvectors read as shown in Equation 9

vj=1ZjF0λj+k1λjλj+μF0λjλj+k1λjF0α1Rst,0/Rm(9)

with F0=β0fst,0Sst,0, where Zj is a normalization constant such that |vj|=1. It was found that the bi-orthogonal vectors w2,3 of the model exhibit the well-known structure from other epidemiological models (Frank, 2022): w2=B1(0,v3,P,v3,I,0) and w3=B1(0,v2,P,v2,I,0), where vj,I and vj,P denote the I and P coordinates of the eigenvectors vj, respectively. Here B=v2,Iv3,Pv2,Pv3,I. A detailed calculation showed that w1 and w4 associated with v1=(1,0,0,0) and v4=(0,0,0,1), respectively, read as shown in Equation 10

w1=1λ3λ2λ3λ2λ2+k1λ3+k11λ2+μ1λ3+μF0λ2+k1λ2+μλ3+k1λ3+μ0,w4=1λ2λ30α*λ2+λ3+k1α*F0λ2λ3(10)

with α*=α(1Rst,0/Rm). As in other virus dynamics models (Frank, 2022), the nonlinear functions Nj occurring in the amplitude Equation 6 can be expressed as projections of a nonlinear vector-valued function G on the biorthogonal vectors wj like

NjA=wjGδA,IA,PA,ωA(11)

with ω=RRst,0. That is, δ,I,P,ω are the coordinates of the difference vector u introduced in the Methods section. A detailed calculation showed the results shown in Equations 12, 13 that

G=GIμKδ2,GI,0,GR(12)

and

GI=β0PSst,0+δ1+γRst,0+ωSst,01+γRst,0,GR=αIωRm(13)

As indicated in Equation 11, the variables δ,I,P,ω are expressed in terms of Aj. Explicitly, we have u=(δ,I,P,ω)=jAjvj, see Equation 4. Consequently, the amplitude equations defined by Equation 6 and (11–13) form a closed set of coupled differential equations.

3.2 Implications

3.2.1 Order parameter: essential building-block and initial organization

The model exhibits maximally one positive eigenvalue. Consequently, under the case II scenario with λ2>0(R0>1) the system exhibits an order parameter given by v2 and the order parameter amplitude A2 (Haken, 2004; Frank, 2022). Let us split the state dynamics into two parts X=Xout+Xs, where Xs=A3(t)v3for μ=0 and Xs=A1(t)v1+A3(t)v3 for μ>0 describes the dynamics along the stable direction(s) and Xout captures the remaining dynamics. Initially, i.e., for t0, we have

XoutK+v2A20expλ2t(14)

with K= constant and K=Xst,0+A1(0)v1+A4(0)v4=for μ=0, whereas K=Xst,0+A4(0)v4= for μ>0. Equation 14 describes the dynamics along the unstable direction away from the initial fixed point (i.e., the outwards dynamics). In contrast, Xs describes the dynamics towards the unstable direction, i.e., towards the order parameter. Consequently, the order parameter v2 describes the emergent organization of the multi-species physiological network and its amplitude A2 describes how this organization evolves over time.

Since Xs initially decays in magnitude over time, when considering the initial infection dynamics we may neglect its contribution to the state dynamics. If so, then any state change defined by ΔX=X(t)Xst,0 approximately is given by

ΔXv2ΔA2v2expλ2t1.(15)

Equation 15 illustrates again that the order parameter describes the essential building-block that shapes an infection outbreak in the multi-species network under consideration including the defense reaction (see component v2,R).

3.2.2 Stopping mechanisms

The exponential increase along v2 as described by Equation 15 is slowed down and eventually stopped at some point in time. In line with the stability analysis let us assume that δ,I,P,ω are small quantities of the order ϵ. Then N2 when interpreting N2 as a function of the difference variables can be expanded such that the amplitude equation for A2 reads

ddtA2=λ2A2v3,pβ0fst,0>0γSst,0fst,0PωPδ0+Oϵ3.(16)

Note that δ<0 for any t>0. Consequently, the network physiology produces two mechanisms that slow down the exponential increase of A2: the decay in susceptibles in the presence of phages as measured by the interaction term Pδ>0 and the increase of the number of resistant bacteria again in the presence of phages as measured by the interaction term Pω>0. The former mechanism is a passive mechanism that simply states that the exponential infection outbreak slows down due to a decay of the resources (i.e., susceptible bacteria). The latter mechanism is an active mechanism that states that the introduction of resistant bacteria mutations into the bacteria colony has the desired effect of slowing down the phages invasion.

3.2.3 Linear predictor equations

Equation 15 implies that all species initially satisfy linear regression equations of the form as shown in Equation 17

Xiai,j+ri,jXj,rij=v2,i/v2,j.(17)

Accordingly, any species of the network can be used to predict any other network species (assuming rij0 for all i,j). The network components are coupled by linear order parameter links. For example, the bacteriophage population size P may be used to construct regression models like

S=aS,PF0λ2P,I=F0λ2+k1P,R=aR,P+αF0λ2+k1λ2P,(18)

where aX(i),X(j) are intercept parameters depending on Xst,0. As indicated in Equation 18, aI,P=0 because of Ist,0=Pst,0=0.

3.2.4 Limited impact of bacterial growth term

Clearly, the bacterial growth term may affect the S dynamics. However, it does not affect the order parameter eigenvalue λ2 and it does not affect the orientation of the order parameter v2 in the 3D space (I,P,R), which is of primary concern. Consequently, the initial outbreak dynamics in the (I,P,R) space as determined by the order parameter dynamics (see Section 3.2.1) is completely unaffected by the bacterial growth term.

3.3 2D infected/infectious species dynamics and double exponential dynamics approximation

The dynamics of the infected and infectious species I and P is completely described by the amplitudes A2 and A3. The reason for this is that the eigenvectors v1 and v4 do not exhibit components in the IP subspace. The mapping from A2 and A3 to I and P reads

IP=v2A2+v3A3,(19)

where v2 and v3 denote the projections of v2 and v3 into the I-P subspace. From Equation 19 it follows that the initial evolution of I and P satisfies a double-exponential function as shown in Equation 20

IPv2A20expλ2t+v3A30expλ3t,(20)

3.4 Scaled model

Using the variable transformations s=S/Sst,0, i=I/Sst,0, p=k1P/(qSst,0), r=R/Rm, the model (1–3) becomes

ddts=k0s+μs1s,ddti=k0sk1i,ddtp=k1ik2p,ddtr=αI1r(21)

with

k0r,p=β01+γrp(22)

and β0=β0Sst,0q/k1, γ=γRm, and α=αSst,0/Rm. Among other things, the scaled model exhibits the following two properties. First, the variables s,i,p,r are dimensionless. Second, the variable transformation Pp turns the phage variable P into a bacteria-like variable (Frank, 2022). That is, just as the model describes that a susceptible bacteria turns into an infected bacteria, the scaled model describes that an infected bacteria turns into a phage unit in a 1:1 manner when expressing phages in the variable p (rather than in P). Mathematically speaking, from Equation 21 it follows that p increases due to the term k1I at the same rate as the number of infected bacteria decays due to the term k1I, which means that the model describes the aforementioned 1:1 transition.

3.5 Simulation

An Euler forward simulation scheme was used to solve Equations 21 and 22. In a first simulation, see Figure 1, only the passive defense mechanism was considered with α=0 and γ=0. In a second simulation, see Figure 2, the active defense mechanism was taken into account with α=1 and γ=5. The remaining parameters and initial conditions were k1=0.2/days (Li et al., 2021), k2=1/day, β0=5/day, s0,st=1,ist,0=0,pst,0=0,rst,0=0.01, and p(t=0)=0.001. For sake of brevity, only the most relevant phase curves will be presented and only the first week of the initial outbreak stage will be considered. In this context note that in line with our discussion in Section 3.2.4. In both simulations μ=0 was used.

Figure 1
Graphs a) and c) plot parameter s against p, ranging from 0.95 to 1, showing a downward trend with increasing p. Graphs b) and d) plot parameter i against p, ranging from 0 to 0.03, showing an upward trend with increasing p. Both axes are marked with p labeled as cell-like and scaled by ten to the power of negative three (10^-3).

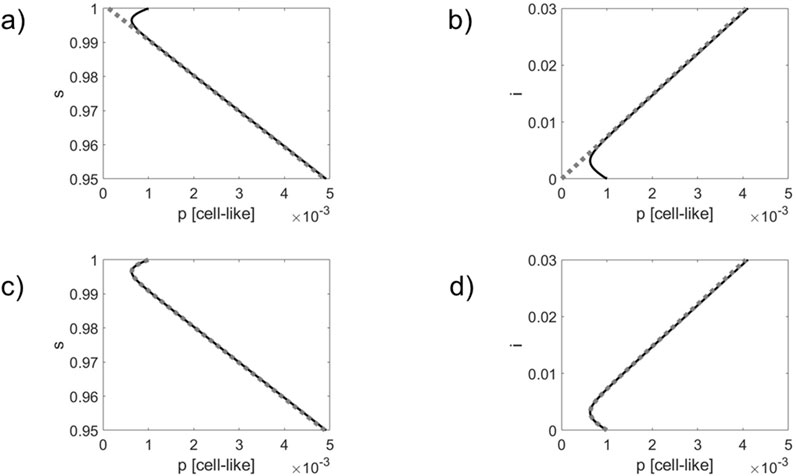
Figure 1. Comparison of simulated infection dynamics (solid black lines) with the order parameter dynamics (panels) (a,b) and the double exponential approximation (panels) (c,d) shown as gray dotted lines. Phase curves in 2D sp state spaces (panels (a,c) and ip state spaces (panels) (b,d) are shown.

Figure 2
Four graphs labeled a, b, c, and d. Graphs a and c plot s versus p, showing a downward trend. Graphs b and d plot i versus p, showing an upward trend. All graphs feature a black line and gray dashed line.

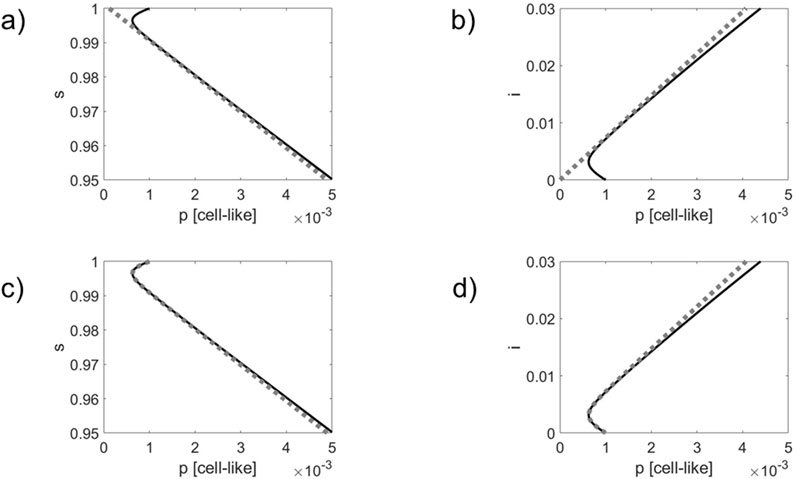
Figure 2. As for Figure 1 but for a simulation that takes the active defense mechanism via resistant bacteria into account. Comparison of simulated infection dynamics (solid black lines) with the order parameter dynamics (panels) (a,b) and the double exponential approximation (panels) (c,d) shown as gray dotted lines. Phase curves in 2D s – p state spaces (panels (a,c) and i – p state spaces (panels) (b,d) are shown.

As can be seen in panels (a) and (b) of Figures 1, 2, the phase curves quickly converge towards the order parameter v2 and, subsequently, evolve along v2. By definition, the order parameter v2 does not capture the dynamics along the stable direction v3. As can be seen in panels (c) and (d) of Figures 1, 2, the double exponential approximations can describe the transient initial dynamics towards the order parameter (i.e., the dynamics along v3) as well as the subsequent dynamics along the order parameter v2.

Comparing Figures 1, 2, it can be seen that due to the impact of the phage resistant bacteria the actual dynamics differs from the order parameter dynamics to a greater extent. Likewise, the actual dynamics departs earlier from the double exponential approximations. These observations do not come as a surprise since the active defense mechanism slows down and eventually stops the infection outbreak, see Equation 16. Therefore, the actual dynamics will deviate earlier from the order parameter dynamics, on the one hand, and the double exponential dynamics, on the other hand. Roughly speaking, the active mechanisms weakens the linear order parameter link between the network components.

4 Conclusions and limitations

We conclude that under appropriate conditions as specified in the Methods and Simulation sections the order parameter and its amplitude characterize the (self-)organization of a bacteriophage infection and the corresponding bacterial defense. In physics various experiments have been conducted to test specifically predictions of the theory of self-organization (and synergetics) as presented above. Therefore, just as in physics, the results presented above may serve as a basis for conducting laboratory experiments on bacteriophage infections to test the order parameter hypothesis. Moreover, we conclude that linear regression models as derived above may be used to estimate species that are difficult to observe on the basis of species that can be measured more conveniently. For sake of brevity, in the current study, properties of the endemic fixed point as studied, e.g., by Li et al. (2021) have not been examined in detail. Likewise, the current study was limited to consider one possible defense mechanism while alternative mechanisms (Skanata and Kussell, 2021; Weitz et al., 2005) were ignored. A more comprehensive study (which is beyond the scope of this Brief Report) may overcome such limitations by generalizing the results presented above.

Data availability statement

The raw data supporting the conclusions of this article will be made available by the authors, without undue reservation.

Author contributions

TF: Writing – original draft, Writing – review and editing.

Funding

The author(s) declare that no financial support was received for the research and/or publication of this article.

Conflict of interest

The author declares that the research was conducted in the absence of any commercial or financial relationships that could be construed as a potential conflict of interest.

Generative AI statement

The author(s) declare that no Generative AI was used in the creation of this manuscript.

Any alternative text (alt text) provided alongside figures in this article has been generated by Frontiers with the support of artificial intelligence and reasonable efforts have been made to ensure accuracy, including review by the authors wherever possible. If you identify any issues, please contact us.

Publisher’s note

All claims expressed in this article are solely those of the authors and do not necessarily represent those of their affiliated organizations, or those of the publisher, the editors and the reviewers. Any product that may be evaluated in this article, or claim that may be made by its manufacturer, is not guaranteed or endorsed by the publisher.

References

Abedon, S. T. (2012). Bacterial immunity against bacteriophages. Bacteriophage 2, 50–54. doi:10.4161/bact.18609

PubMed Abstract | CrossRef Full Text | Google Scholar

Bloch, S., and Wegrzyn, A. (2024). Editorial: bacteriophage and host interactions. Front. Microbiol. 15, 1422076. doi:10.3389/fmicb.2024.1422076

PubMed Abstract | CrossRef Full Text | Google Scholar

Frank, T. D. (2022). COVID-19 epidemiology and virus dynamics: nonlinear physics and mathematical modeling. Berlin: Springer. doi:10.1007/978-3-030-97178-6

CrossRef Full Text | Google Scholar

Geng, P., Flint, E., and Bernsmeier, C. (2022). Plasticity of monocytes and macrophages in cirrhosis of the liver. Front. Netw. Physiol. 2, 937739. doi:10.3389/fnetp.2022.937739

PubMed Abstract | CrossRef Full Text | Google Scholar

Granger, T., Michelitsch, T. M., Bestehorn, M., Riascos, A. P., and Collet, B. A. (2024). Stochastic compartment model with mortality and its application to epidemic spreading in complex networks. Entropy 26, 362. doi:10.3390/e26050362

PubMed Abstract | CrossRef Full Text | Google Scholar

Haken, H. (2004). Synergetics: introduction and advanced topics. Berlin: Springer. doi:10.1007/978-3-662-10184-1

CrossRef Full Text | Google Scholar

Hutt, A., and Haken, H. (2020). Synergetics. New York: Springer. doi:10.1007/978-1-0716-0421-2

CrossRef Full Text | Google Scholar

Li, X., Huang, R., and He, M. (2021). Dynamics model analysis of bacteriophage infection of bacteria. Adv. Differ. Equations 2021, 488. doi:10.1186/s13662-021-03466-x

CrossRef Full Text | Google Scholar

Nowak, M. A., and May, R. M. (2000). Viral dynamics: mathematical principles of immunology and virology. New York: Oxford University Press.

Google Scholar

Pastor-Satorras, R., Castellano, C., Van Mieghem, P., and Vespignani, A. (1998). Epidemic processes in complex networks. Rev. Mod. Phys. 87, 925–979. doi:10.1103/RevModPhys.87.925

CrossRef Full Text | Google Scholar

Skanata, A., and Kussell, E. (2021). Ecological memory preserves phage resistance mechanisms in bacteria. Nat. Commun. 12, 6817. doi:10.1038/s41467-021-26609-w

PubMed Abstract | CrossRef Full Text | Google Scholar

Uhl, C. (1999). Analysis of neurophysiological brain functioning. Berlin: Springer. doi:10.1007/978-3-642-60007-4

CrossRef Full Text | Google Scholar

Weitz, J. S., Hartman, H., and Levin, S. A. (2005). Coevolutionary arms races between bacteria and bacteriophage. Proc. Natl. Acad. Sci. U. S. A. 102, 9535–9540. doi:10.1073/pnas.0504062102

PubMed Abstract | CrossRef Full Text | Google Scholar

Wunner, G., and Pelster, A. (2016). Self-organization in complex systems: the past, present, and future of synergetics. Berlin: Springer. doi:10.1007/978-3-319-27635-9

CrossRef Full Text | Google Scholar

Zborowsky, S., Seurat, J., Balacheff, Q., Ecomard, S., Mulet, C., Minh, C. N. N., et al. (2025). Macrophage-induced reduction of bacteriophage density limits the efficacy of in vivo pulmonary phage therapy. Nat. Commun. 16, 5725. doi:10.1038/s41467-025-61268-1

PubMed Abstract | CrossRef Full Text | Google Scholar

Keywords: network physiology, bacteriophages, infection dynamics, order parameters, synergetics

Citation: Frank TD (2025) Analysis of a model for bacteriophage infections and bacteria defense: a synergetics perspective. Front. Netw. Physiol. 5:1657313. doi: 10.3389/fnetp.2025.1657313

Received: 01 July 2025; Accepted: 08 September 2025;
Published: 19 September 2025.

Edited by:

Eckehard Schöll, Technical University of Berlin, Germany

Reviewed by:

Christian Uhl, Ansbach University of Applied Sciences, Germany
Marwa Ali, Purdue University, United States

Copyright © 2025 Frank. This is an open-access article distributed under the terms of the Creative Commons Attribution License (CC BY). The use, distribution or reproduction in other forums is permitted, provided the original author(s) and the copyright owner(s) are credited and that the original publication in this journal is cited, in accordance with accepted academic practice. No use, distribution or reproduction is permitted which does not comply with these terms.

*Correspondence: T. D. Frank, dGlsbC5mcmFua0B1Y29ubi5lZHU=

Disclaimer: All claims expressed in this article are solely those of the authors and do not necessarily represent those of their affiliated organizations, or those of the publisher, the editors and the reviewers. Any product that may be evaluated in this article or claim that may be made by its manufacturer is not guaranteed or endorsed by the publisher.