


- 1 Bioinformatics Graduate Program, University of British Columbia, Vancouver, BC, Canada
- 2 Centre for High-Throughput Biology, University of British Columbia, Vancouver, BC, Canada
- 3 Department of Psychiatry, University of British Columbia, Vancouver, BC, Canada
Recent research in C. elegans and the rodent has identified correlations between gene expression and connectivity. Here we extend this type of approach to examine complex patterns of gene expression in the rodent brain in the context of regional brain connectivity and differences in cellular populations. Using multiple large-scale data sets obtained from public sources, we identified two novel patterns of mouse brain gene expression showing a strong degree of anti-correlation, and relate this to multiple data modalities including macroscale connectivity. We found that these signatures are associated with differences in expression of neuronal and oligodendrocyte markers, suggesting they reflect regional differences in cellular populations. We also find that the expression level of these genes is correlated with connectivity degree, with regions expressing the neuron-enriched pattern having more incoming and outgoing connections with other regions. Our results exemplify what is possible when increasingly detailed large-scale cell- and gene-level data sets are integrated with connectivity data.
Introduction
Understanding gene function requires the analysis of interactions among them, and ultimately unraveling the function of the genome will require comprehending how all of the parts interoperate in complex networks. An analogous situation exists for the brain and its regional connectome (Bota et al., 2003; Sporns et al., 2005; Lichtman and Sanes, 2008; Biswal et al., 2010; Sporns, 2011). Given the relationships between these two systems (genome and connectome), as well as the fact they are both complex networks, it is natural to ask how analysis of one can inform understanding of the other. Indeed, the integrated analyses of the connectome with other modalities will be critical to understanding brain function. In this paper our modality of interest is gene expression, for which extensive information exists.
It is obvious that the connectome is related to the genome. Axon pathfinding, target recognition, synapse formation, and plasticity are tightly controlled by gene expression (Ressler et al., 2002; Polleux et al., 2007). The function of synapses requires the coordinated expression of genes directing the synthesis of neurotransmitters in the presynaptic cell and of receptors in the post-synaptic cell. Because high throughput experimental technologies for studying the genome are well developed, in many ways our understanding of gene expression and gene networks is better than for the connectome (though this situation is changing rapidly). This allows the collection of large data sets describing gene expression patterns at high levels of resolution. It is increasingly feasible to use this molecular level information to elucidate neuroanatomy.
Analysis of connectomes with transcription data began with the nematode C. elegans because neuron-level connectivity and gene expression levels are known. (White et al., 1986; Harris et al., 2010). Neuron-level gene expression data in C. elegans is not available for all genes, but there is enough to perform reasonably large-scale analyses. The earliest study integrated the connection and expression profiles of 280 neurons and 292 genes (Varadan et al., 2006). Varadan and colleagues employed a systems-based approach to discover logical gene expression-based rules that predict connectivity. Within the resulting gene modules they found high levels of “multivariate synergy,” suggesting statistically interacting genes were more important than single genes. The authors extracted several gene sets that correlate expression in pre- and post-synaptic neurons to presence of gap and chemical synapses. Interestingly, gene sets which contained the most information about the formation of synapses included cell adhesion molecules, transcription factors and axon guidance cues.
Kaufman et al. (2006) performed a similar analysis. They found a more general statistical relationship between gene expression and connectivity. Their analysis employed a co-variation correlation assay, also known as a Mantel test. The Mantel test correlates similarity or distance measures across common objects (in this case, neurons). The Mantel correlations found by Kaufman et al. (2006) were up to 0.18. This signal, while statistically significant, is not strong enough to allow prediction of connectivity from gene expression. Using an optimization method, Kaufman et al. (2006) identified a set of 15 genes whose expression patterns carried the most information about connectivity. Similar to the results of Varadan et al. (2006), they found that a statistically significant number of these were previously linked to synaptogenesis, neuron type, axon guidance, and development.
A third C. elegans study, by Baruch et al. (2008) focused on finding relationships between gene expression and certain aspects of synapse formation (Baruch et al., 2008). They used expression profiles to model the type of synapse (e.g., electrical or chemical) between connected neurons. Like Varadan et al. (2006) they employed a machine learning method to find gene expression-based logical rules, and the genes found to be most predictive of connection type often had known functional roles in neural development.
Similar analyses are starting to appear for the mammalian brain, though in terms of data the situation is the opposite of that for the worm: gene expression is more fully described than connectivity. Dong et al. (2009) provided a fascinating glimpse into the relationships between brain wiring and gene expression in the mammalian brain (Dong et al., 2009). They studied the Allen Mouse Brain Atlas (ABA) for spatial gene expression profiles that segmented the hippocampal field CA1 along its longitudinal axis. Nine of the genes that segmented the CA1 field had concordant expression patterns in the lateral septal nucleus, apparently reflecting the patterns of projections between the respective dorsal and ventral aspects of the two regions. Dong et al. (2009) were able to interpret the CA1 segmentation from the perspective of brain function and connectivity. They noted that the ventral half is linked to goal-oriented and autonomic response while the dorsal half plays roles in navigation.
Recently we contributed a larger-scale analysis of gene expression and connectivity, considering 142 rodent brain regions (French and Pavlidis, 2011). While the connectivity data we used is not a complete connectome, extensive expression data is available for 17,530 genes. Using methods similar to those of Kaufman et al. (2006), we found a Mantel correlation of 0.25 between connectivity and gene expression. An important aspect of our analysis was to account for the fact that connectivity and gene expression are spatially correlated (nearby brain regions are more likely to share connections and expression patterns). Explicit control for this spatial autocorrelation allowed us to identify a signal attributable to connectivity (Mantel correlation of 0.13). A reduced set of genes with a higher Mantel test score was obtained by using the same greedy optimization procedure as Kaufman and colleagues. This reduced set of genes was enriched for axon guidance genes and contained a few of the genes noted in the CA1 study (Dong et al., 2009). This set was also enriched for genes previously linked to autism. While the forebrain and interbrain divisions showed the strongest signals, the interpretation of the results was focused on properties of the genes instead of the connections or brain regions. Recently, a second study replicating the finding of correlations between gene expression and connectivity appeared (Wolf et al., 2011). Wolf and colleagues showed that machine learning methods could be used to predict connectivity from gene expression patterns in a statistically significant manner, for approximately one half of tested brain regions. They showed that genes known to be associated with schizophrenia, autism, and attention deficit disorder are enriched in their gene sets that predict connectivity. Although the authors did not perform correction for the effect of spatial autocorrelation, they tested the robustness of the connectivity data and the quality of the expression images from the Allen Brain Atlas.
A limitation of previous studies integrating gene expression and connectivity is the challenge of interpreting the patterns observed in terms of other parameters such as cellular composition of different brain regions. In the current paper, we extend our earlier work, starting with a directed search for expression patterns of interest. We hypothesized that expression patterns that strongly distinguish brain regions from each other might be functionally relevant and potentially related to connectivity. We were specifically interested in gene pairs with expression patterns showing strong negative correlations across multiple brain regions. We then use connectivity data as well as information on cell-type-specific gene expression to further dissect and ascribe biological meaning to the patterns we identified. In addition to identifying a novel pattern of gene expression in the mouse brain, our analysis serves as a demonstration of how a complex gene expression pattern can be dissected using multiple data types including connectivity.
Materials and Methods
Data and methods were based on that used in our previous study (French and Pavlidis, 2011). Briefly, mouse brain gene expression data is from high-resolution colorimetric in situ hybridization observations in the Allen Mouse Brain Atlas (ABA; Lein et al., 2007). To obtain brain region connection degree we counted the number of incoming or outgoing connections from the up-propagated rat brain connectivity data we previously extracted from the Brain Architecture Management System (BAMS; Bota et al., 2005). For neuroanatomical matching and selecting we again used non-overlapping regions and included virtual regions that better mapped between the ABA and BAMS brain region names. The region mappings are accessible as Supplementary Table S1 in French and Pavlidis (2011). Supplementary data and software are available at http://www.chibi.ubc.ca/NEOE.
Gene Expression Data
We employed the expression energy quantifications of the ABA images. For each image set the expression energy of every voxel is defined as the product of expression area and expression intensity (Ng et al., 2009). Pixels are averaged within voxels and brain regions to provide a single expression energy value for each brain region. To reduce computation time and filter genes of low and constant expression values we restricted our analysis to genes for which ABA has expression patterns in coronal sections. This set of 4261 image series (3976 genes) were assayed by ABA in the coronal plane because they showed marked regional expression patterns in the sagittal plane (Ng et al., 2009). Most “housekeeping” genes which tend to have widespread expression are not present in the set. Some genes were represented by more than one imageseries (that is, there are replicate data sets in the Allen Atlas), which were kept separate in our analysis. To create a single expression profile for a set of genes we averaged the expression values per region.
For analysis of expression data alone, we used 150 non-overlapping ABA regions. When connectivity data was used the regions were limited to those for which we had connectivity data: 112 regions for outgoing, 141 for incoming connectivity, and 142 resulting from joining the two.
Statistical Analysis
To compare expression energy to spatial location and connectivity degree we compute Spearman rank correlation coefficients (ρ). Statistical significance was established by resampling 1000 gene sets of the same size to generate empirical null distributions. This provides the probability that an equally sized gene set randomly chosen from the set of all genes scores a higher correlation. We used linear regression for computing partial correlation coefficients. Principal component analysis (PCA) was performed after rescaling the gene profiles to a common mean and variance. We employed the complete-linkage agglomeration method for hierarchical clustering with the Euclidean distance function.
Cell-Type Enriched Gene Lists
Cell-type enriched gene sets were extracted from the “The Transcriptome Database for Astrocytes, Neurons, and Oligodendrocytes” (Cahoy et al., 2008). The database contains gene expression profiles of cell-type purified mature mouse forebrain samples. Mouse gene symbols were extracted from Supplementary Tables S4–S6 of Cahoy et al. (2008). These tables provide lists of astrocyte, neuron, and oligodendrocyte enriched genes. After removing genes that are not in the ABA coronal gene set, 716 astrocyte, 831 neuron, and 571 oligodendrocyte enriched genes remain.
Gene Ontology Enrichment
We used the ErmineJ software to extract overrepresented Gene Ontology (GO) groups (Ashburner et al., 2000; Gillis et al., 2010). The set of 3976 coronal genes formed the background gene list for the over-representation analysis. GO groups were limited to the biological process division and required 5–300 annotated genes.
Ortholog Assignment
For each gene we extracted its homologous sequences from the HomoloGene database (build version 64; Wheeler et al., 2007). HomoloGene groups were used to convert the mouse gene identifiers to genes from S. cerevisiae (yeast), C. elegans (worm), and D. melanogaster (fly).
Results
To identify genes showing strong negatively correlated expression patterns with other genes, we ranked all pairs of genes in the data set by their Spearman correlations across 150 ABA brain regions, and considered pairs with the strongest negative correlations. By filtering gene–gene correlations at a maximum Spearman’s rank correlation coefficient (ρ) of −0.72 we selected the 912 most anti-correlated gene pairs. We choose this stringent but arbitrary threshold because we wanted a small list that could be manually examined for interesting relationships, though our findings proved to hold for other reasonable selection thresholds.
Our first observation was that this list of 912 pairs includes only 102 different genes, indicating there would be strong positive correlations present within this set, rather than numerous distinct patterns. Hierarchical clustering and visualization of the expression patterns of these genes (Figure 1) shows that the original 912 inversely correlated patterns are essentially one inverse relationship corresponding to two gene expression profiles. Visualization of all gene–gene correlations within the set demonstrates this relationship with a clear bimodal distribution with peaks at −0.6 and 0.7 (Figure A1 in Appendix). To further examine the inverse relationship we use clustering to divide the data into two sets: pattern NE (43 image series, 40 genes, Table 1) and pattern OE (68 image series, 62 genes, Table 2). This choice of names will be clarified later in our results. Supplemental Data sheets 1 and 2 list NCBI and Allen image series identifiers. Figure 2 shows expression energy images in the sagittal plane for a pattern NE (CamK2a) and OE gene (S100b). The average profiles of these patterns are strongly negatively correlated (Spearman’s rank correlation (ρ) = −0.88). Given the strength of this pattern, although it only includes a small fraction of the genes studied, we asked if it might correspond to patterns uncovered by PCA. We found the pattern NE and OE genes are strongly separable in PC2 (Figure 3) and the mean loadings in PC1 differ significantly (p-value < 0.001). Thus these patterns correspond to major trends in the data.
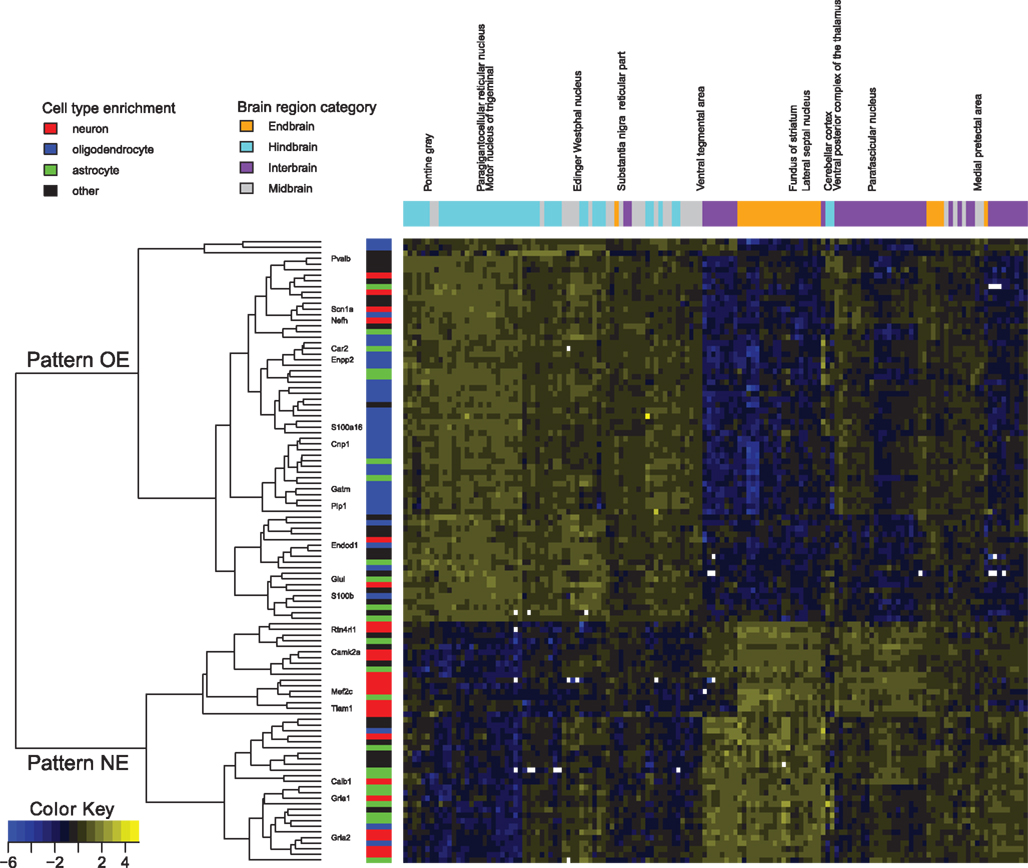
Figure 1. Expression patterns of genes involved in the top 912 negative expression correlations. Normalized expression is color coded, ranging from blue (low) to yellow (high) and in white for missing values. Genes mentioned in the article are labeled. Gene membership in the transcriptome database for astrocytes (green), neurons (red), and oligodendrocytes (blue) is marked (Cahoy et al., 2008). The dendrogram shows the split between pattern NE and pattern OE. Brain regions are colored as orange for endbrain, cyan for hindbrain, purple for interbrain, and gray for midbrain. Expression data for each gene was normalized to mean zero and variance one for contrast.
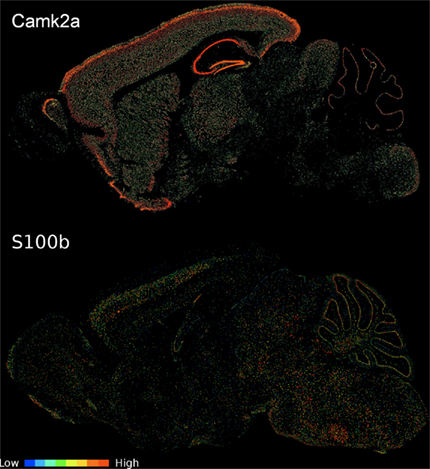
Figure 2. Sagittal expression energy images of a pattern NE and OE gene. CamK2a displays pattern NE (image series 79360274) and S100b shows pattern OE (image series 924). Images were downloaded from the ABA web site (http://www.brain-map.org). While all expression information for the analysis is from coronal assays, we selected a sagittal view to better show interregional variability in a single section.
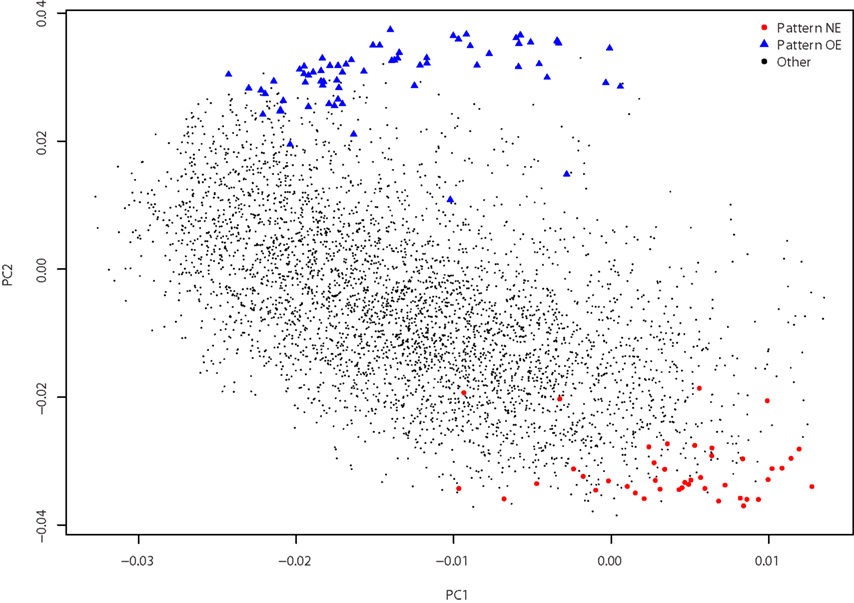
Figure 3. Principal components analysis. Gene loadings for pattern NE (red circles), pattern OE (blue triangles), and all other genes (small black circles) are plotted. The first two principal components, PC1 (16.4% of the variance) and PC2 (11.8% of the variance), separate the two patterns.
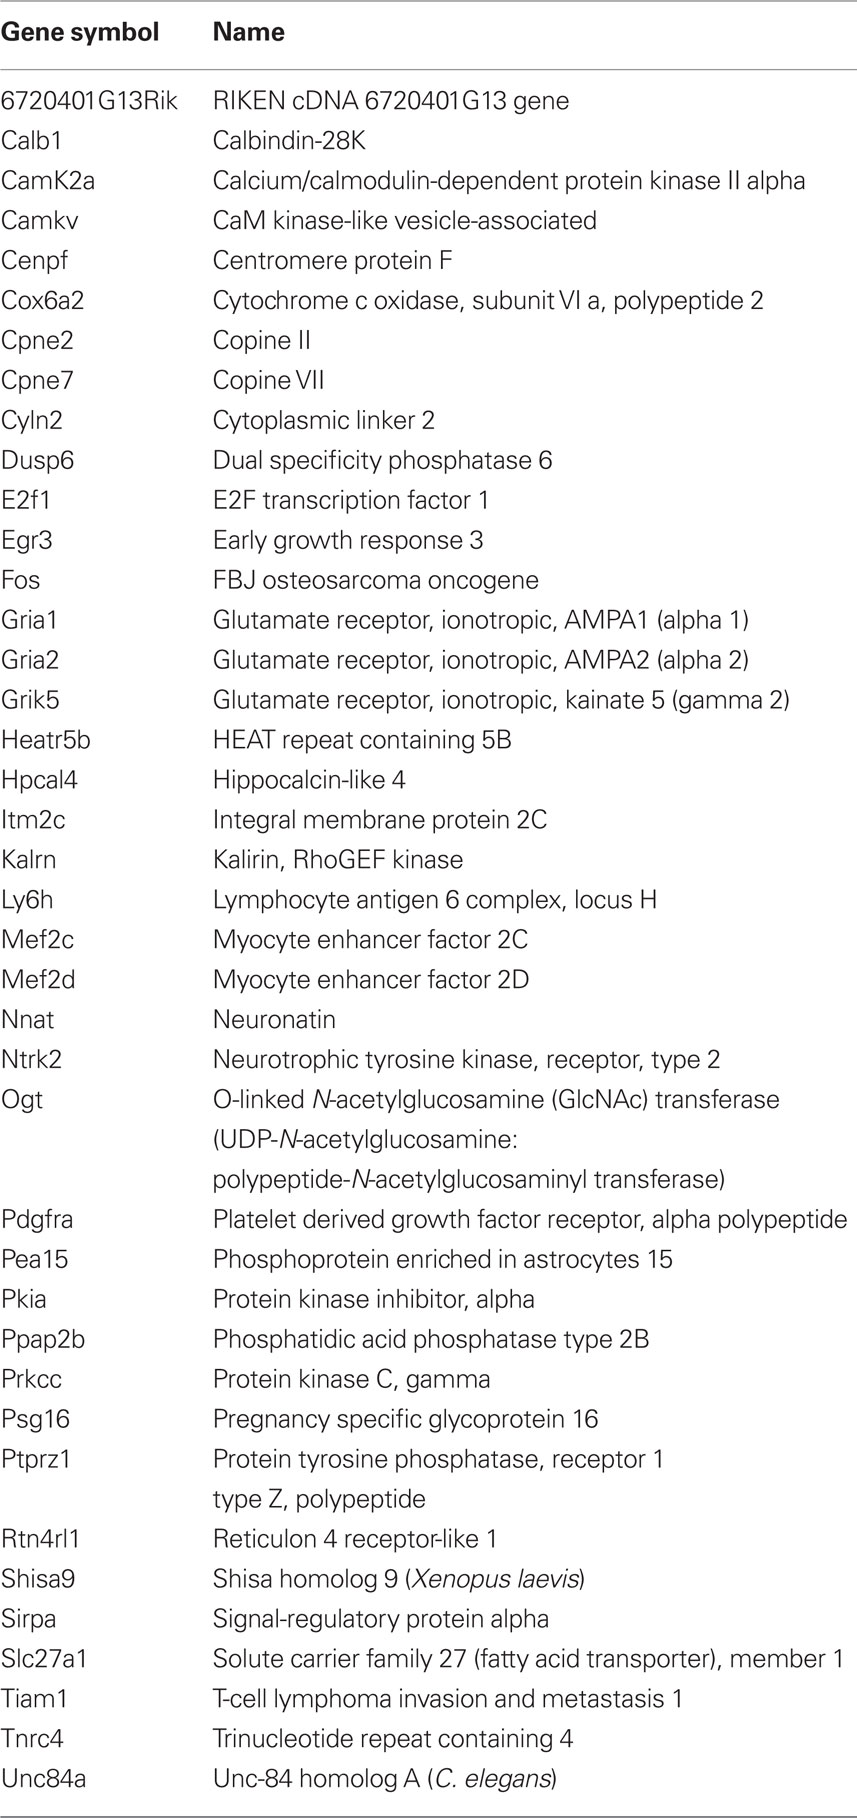
Table 1. Pattern NE gene symbols and names.
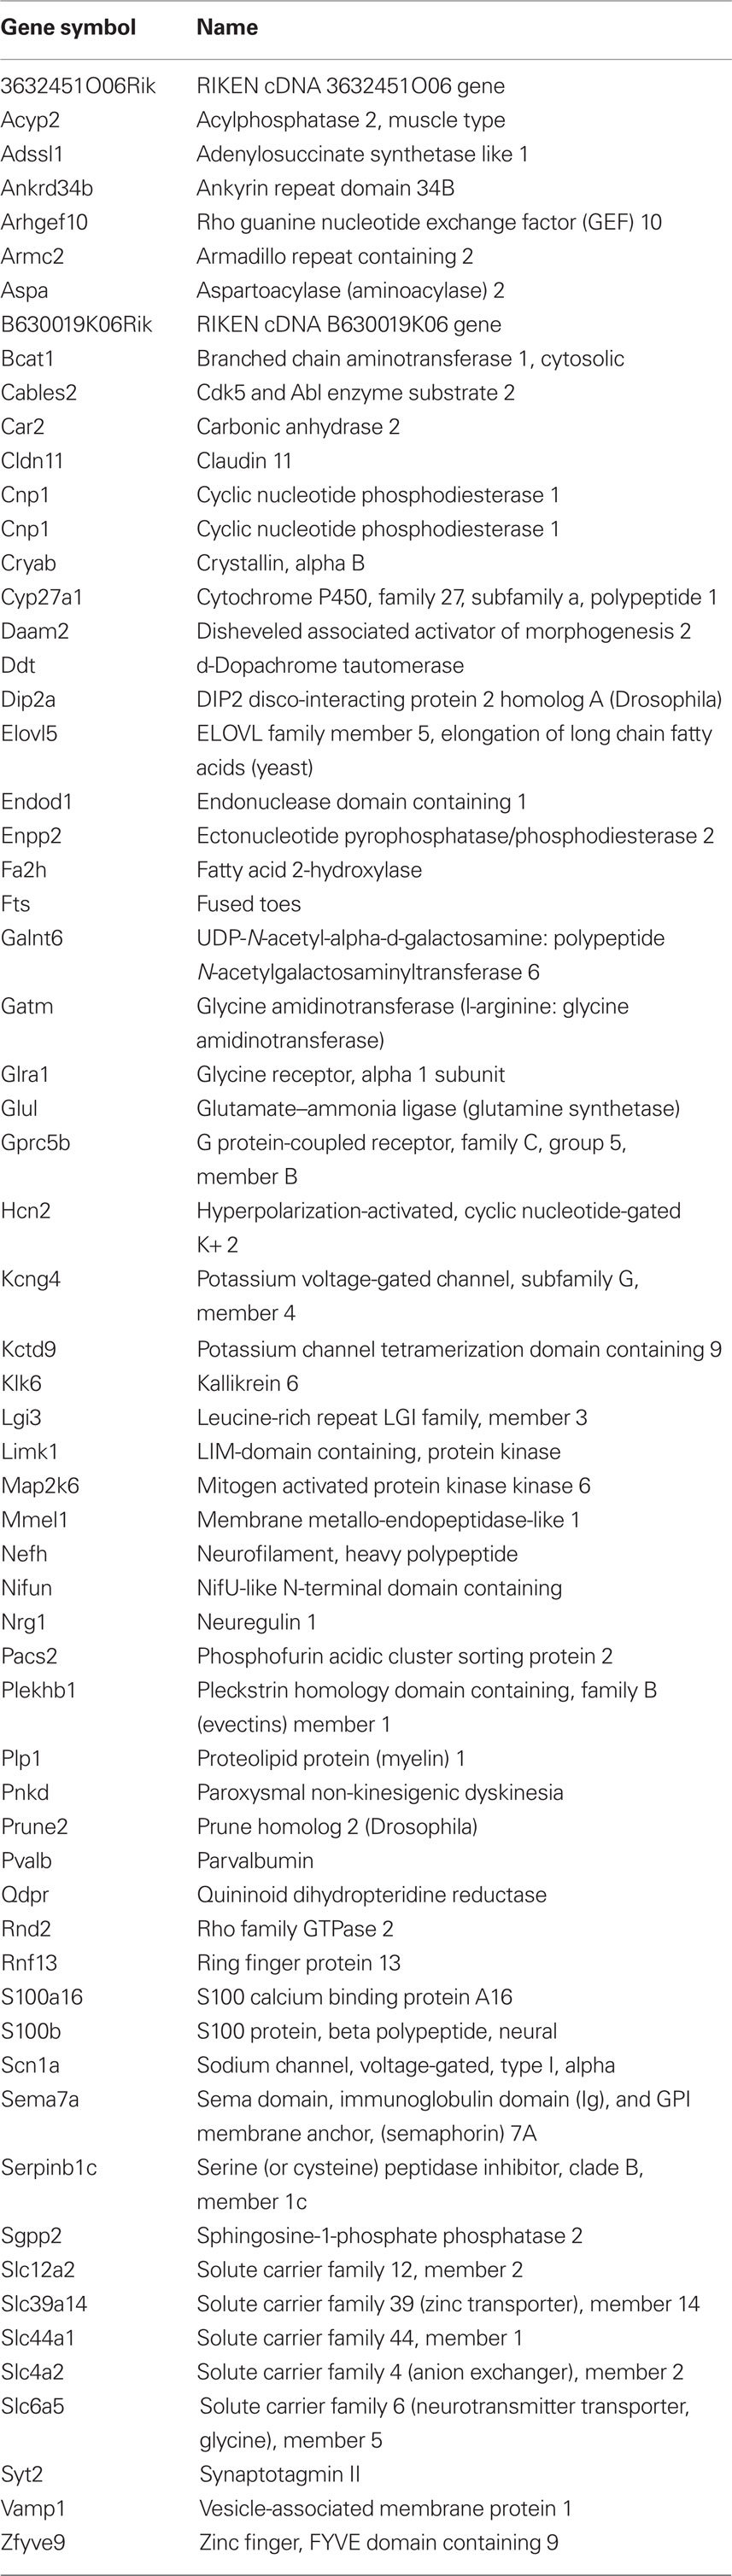
Table 2. Pattern OE gene symbols and names.
Inspection of the gene names and symbols suggested that pattern NE was enriched for neuron-associated genes such as calcium/calmodulin-dependent protein kinase II alpha (CamK2a; Ouimet et al., 1984) and calbindin-28K (Calb1; Pfeiffer et al., 1989). In contrast, several glial cell markers appear in the pattern OE list: carbonic anhydrase II (Car2; Ghandour et al., 1979, 1980), S100b (Ghandour et al., 1981; Rosengren et al., 1986), and glutamine synthetase (Glul; Wu et al., 2005). Also, one neuron marker, neurofilament high molecular weight (Nefh) appears in the pattern OE list (Letournel et al., 2006). We note that none of the ABA regions are white matter tracts (most are small nuclei), so the pattern does not reflect a simple contrast between gray and white matter.
Gene Ontology enrichment analysis allowed us to objectively quantify these trends. The GO provides extensive annotations of genes that allow testing for enrichment of specific functions, subcellular localizations, or processes. By looking for annotations overrepresented in patterns NE or OE we find several interesting groups, though none reach significance after multiple test correction. For pattern NE the top ranked groups include “regulation of transport” (GO:0051049, p-value = 8.3 × 10⁻⁵) and “regulation of neurotransmitter secretion” (GO:0046928, p-value = 0.0035). Pattern OE is enriched for groups such as “potassium ion transport” (GO:0006813, p-value = 0.0047), “cellular ion homeostasis” (GO:0006873, p-value = 0.013), and “regulation of membrane potential” (GO:0042391, p-value = 0.0015). The full GO analysis is available as Data sheet 3 in Supplementary Material.
By linking homologous sequences we quantified how evolutionary recent the pattern NE and OE genes are. Surprisingly, only three of the pattern NE genes had a homolog in yeast, worm, or fly genomes (7.5%, p-value = 0.00023, hypergeometric test). The pattern OE group had 23 (37%, p = 0.067) of earlier origin, slightly more than the faction seen in the entire coronal gene set (32%). Both sets had about the expected number of detected orthologs in the human genome.
We used a third bioinformatics approach to test whether these two patterns might reflect differences in cellular populations, using the Transcriptome Database for Astrocytes, Neurons, and Oligodendrocytes (Cahoy et al., 2008). Figures 1 and 4 show that pattern NE is enriched for genes identified by Cahoy et al. (2008) as being neuron enriched (p-value = 0.0016, hypergeometric test). In contrast, pattern OE has half the number of expected number of neuron-enriched genes (p-value = 0.015). For the Cahoy oligodendrocyte genes the opposite pattern appears, with 29 genes in pattern OE (p-value < 0.0001). Genes from the Cahoy “astrocyte” gene set were represented approximately equally in both sets at the expected proportions. Similar results were obtained by using the lists of oligodendrocyte and neuron-enriched gene sets from the ABA (Lein et al., 2007). These strong cell-type signals led us to label the two gene sets as neuron enriched (NE) and oligodendrocyte enriched (OE).
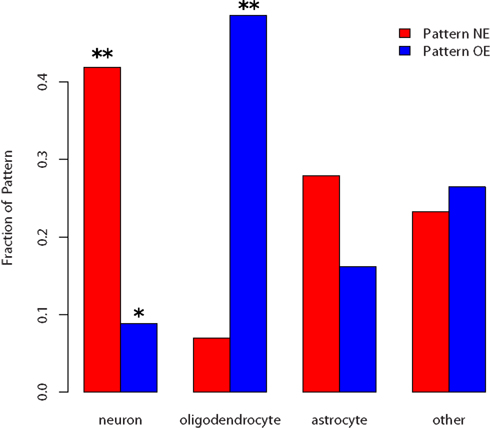
Figure 4. Fraction of cell-type enriched genes appearing in the two patterns. p-values below 0.05 are marked by * and below 0.005 with **. Neuron-enriched genes are overrepresented in the NE list and underrepresented in the OE list. Oligodendrocyte genes are overrepresented in the OE list but not significantly underrepresented in the NE list.
The results presented thus far are limited to information obtained at the gene level. While the two profiles seem to have a relationship to cell type, we wanted to test if they provide information about higher-level brain structure. Our next analysis stage incorporated information on spatial locations within the brain and connectivity.
We first summarized patterns NE and OE as the average of the expression patterns of the gene sets. While pattern OE has slightly lower expression levels on average, the two patterns have very similar variance. This expression pattern across regions was found to be significantly correlated with the anterior–posterior axis: regions that have high pattern OE expression tend to be at the posterior end of the brain (Spearman’s ρ = 0.81), with the opposite true of pattern NE (ρ = −0.76). We previously noted that regions in the posterior end of the brain had fewer connections (ρ = 0.55; French and Pavlidis, 2011). Accordingly we found that the expression patterns correlated with the number of connections the regions have. For incoming connectivity degree the Spearman correlations are 0.49 and −0.54 for pattern NE and OE respectively (141 brain regions). For the 112 regions that have at least one report of an outgoing connection the correlations are 0.32 and −0.44 for pattern NE and OE respectively. Joining the incoming and outgoing connections provides 142 brain regions with correlations of 0.48 (pattern NE) and −0.59 (pattern OE). This means that higher expression of pattern NE is found in “hub-like” regions with many connections, and high expression of pattern OE is observed in “relay-like” regions with few connections. The relationship is shown in Figure 5 with regions of high connectivity degree with low pattern OE expression and high pattern NE expression. All of the above correlations are significant at p < 0.001. It is important to note that the entire coronal gene set has substantial correlations of expression levels to anterior–posterior axis (ρ = 0.29), incoming (ρ = −0.19), outgoing connection degree (ρ = −0.25). This spatial correlation reflects a bias in the coronal set gene selection, which favored genes expressed in the cortex and hippocampus (Ng et al., 2009). Against this baseline, the anterior–posterior expression gradient of the pattern NE and pattern OE genes is still very high.
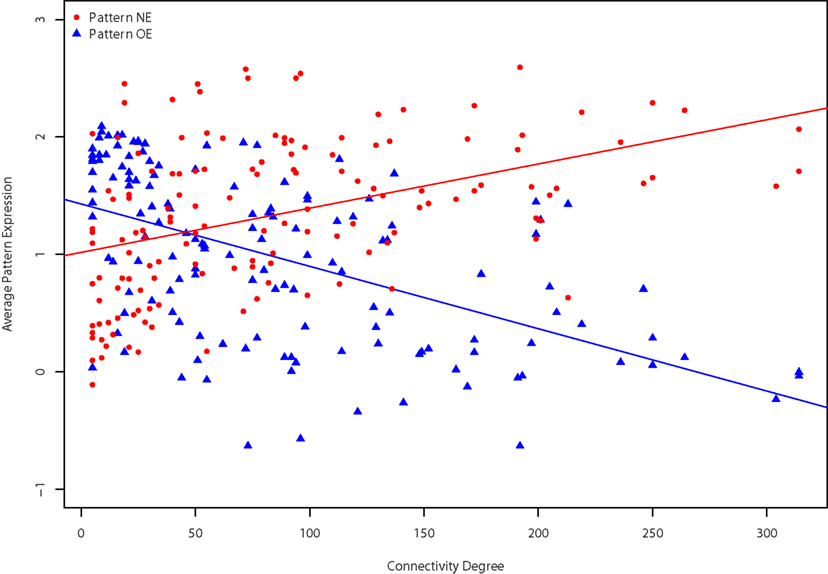
Figure 5. Relationships between degree and expression patterns. Connectivity degree is plotted against average pattern NE (red circles) and OE (blue triangles) expression levels for each brain region. Degree for the 142 regions is the sum of both incoming and outgoing connections.
Because of the known relationship between spatial location in the brain and patterns of connectivity, we sought to correct for this in our analysis of the NE and OE patterns, using partial correlations. We found that the correlations with incoming connectivity degree are still significant after correction for anterior–posterior location, with correlations of 0.20 (pattern NE) and −0.30 (pattern OE). Similarly, the outgoing degree correlations were still significant, though reduced in magnitude: 0.07 (pattern NE, p-value = 0.001) and −0.30 (pattern OE). Correlations to the combined degree across 142 regions are 0.16 (pattern NE) and −0.35 (pattern OE; all of the above correlations are significant at p < 0.001 unless otherwise noted). A similar analysis carried out using the full Cahoy “neuron” and “oligodendrocyte” lists show similar trends, albeit much weaker than patterns NE and OE. Expression of the Cahoy astrocyte-enriched genes is not significantly correlated with connectivity degree or anterior–posterior axis (p > 0.1).
Given the relationship of the NE and OE sets to connectivity, it was of interest to test how these gene sets relate to our previous results (French and Pavlidis, 2011). In that work we presented gene sets that had optimal expression correlations with connectivity (see Introduction for more detail). Unlike the present study, those genes were selected on the basis of correlation with connectivity patterns, not the number of connections. Thirteen of the pattern NE genes and five pattern OE genes overlap with the connectivity-optimized gene set from French and Pavlidis (2011). Accordingly, using the same analysis method of French and Pavlidis (2011) to evaluate relationships between expression and connectivity patterns, the pattern NE and OE genes (pooled) were not significant. In an analysis more closely related to the one undertaken here, French and Pavlidis (2011) also ranked genes by correlation of expression level with connectivity degree, but this was not studied in any detail. Unsurprisingly, the pattern NE and OE sets have strong overlaps with these lists: 89% of the pattern OE genes have significant negative degree correlations and 65% of pattern NE genes have significant positive degree correlations.
Discussion
In this paper we have shown how a complex expression pattern in the rodent brain can be dissected in terms of genes, cell types, spatial location, and connectivity. To our knowledge, the expression patterns we identified have not been previously described. However, previous work has uncovered possible links between neuroanatomy, gene expression, and cell type. Using a voxel-based PCA on a subset of the ABA data, Bohland et al. (2009b) noted that the two most separable structures, the striatum and cerebellum, contain a relatively large number of GABAergic inhibitory neurons. There are a number of differences between the analysis of Bohland et al. (2009b) and ours, including the use of voxels vs. brain regions and the choice of genes analyzed, so it is not easy to compare them (indeed it appears the components in the two PCAs are not equivalent), but it is likely that at least some of the highly weighted genes in the pattern identified by Bohland et al. (2009b) are genes in the pattern we found. A second study has examined a link between expression and connectivity for two specific brain regions (Ng et al., 2009). Using the anatomic gene expression atlas (AGEA) Ng et al. (2009) visualized correlated expression profiles of the parafascicular nucleus and the ventral posterior complex. The ventral posterior complex is a “relay nucleus” and has fewer connections than the hub-like parafascicular nucleus. The AGEA visualization demonstrated that the regions have diverse expression correlation maps that might reflect their diverse function (Ng et al., 2009). In agreement with this result, in our analysis the highly connected parafascicular nucleus has high expression of the neuron-enriched pattern NE compared to the ventral posterior complex. For the oligodendrocyte enriched pattern OE the opposite is true. Our results are consistent with the idea that degrees of connectivity might be reflected in expression pattern.
By comparing to our previous results on connectivity correlations with expression (French and Pavlidis, 2011), we found the patterns seems to contain weak information about connection partners. However, when compared to the background gene set neither of pattern NE and OE gene lists carry significant information about connectivity patterns beyond number of connections. As expected the pattern NE and OE lists do overlap significantly with the previously extracted lists of 887 and 1127 genes that had expression levels positively and negatively correlated with degree (p-value < 0.0001, hypergeometric test). In contrast our lists provide a much smaller set of genes that provide an interesting link to cell-type distribution. Thus patterns NE and OE are distinct from the connectivity-related patterns of French and Pavlidis (2011).
Patterns NE and OE are suggestive of differences in the relative proportion of neuronal and glial cell populations in the brain regions in which they are expressed. We further hypothesize that the correlations these patterns have with connectivity might be explained in terms of highly connected regions having more neurons, and concomitantly fewer oligodendrocytes. However, we could not rigorously test these ideas here because measurements of glia-to-neuron ratios across many brain structures do not appear to be readily available. More detail about the nature of connectivity supported by the pattern NE and OE regions could also provide insight; in particular the connectivity data we used does not detail if the connections are highly myelinated, inhibitory, or excitatory. We also found that the pattern NE genes have a more recent evolutionary origin, while the pattern OE genes tend to be more ancient. This agrees with past work that found evolutionary expansion and regional variation of synaptic genes that are expressed primarily in neurons (Pocklington et al., 2006; Emes et al., 2008).
We note that the connectivity data we employ does not form a complete connectome. The connectivity data we use lacks information about connections that have been shown not to exist. In addition, many brain region pairs have not been studied in a curated tract tracing experiment and may or may not be connected. Of these three cases only one (connected but not known) would increase connectivity degree of a region. Large increases in connectivity degree will affect our results but small changes in connectivity degree are unlikely to change the correlations because we measure Spearman’s rank correlation coefficient. However, we expect additional connectivity data for regions with few reported connections will allow deeper analysis. Further, use of the BAMS connectivity data requires pooling of the underlying voxel-based gene expression data into brain regions. This limits our results to less than half of the brain by volume but prevents large regions from dominating the analysis. A larger analysis at the voxel level may result in more robust inverse correlations. However, associations to connection degree could not be performed because voxel level connectivity data is limited for mouse (Moldrich et al., 2010).
Our analysis required the integration of several complex data sets, illustrating several methodological problems that hinder such efforts. Mapping between anatomical atlases presents a significant challenge in linking transcriptomics to connectomics. While genomics has mostly sorted out how to reference specific genes (Gerstein et al., 2007), it is much harder to identify and delineate a specific brain region (Bohland et al., 2009a; Hawrylycz et al., 2011). In C. elegans the stable number of neurons allows each one to be given a unique identifier, but in more complex organisms even within a specific atlas it can be hard to map brain regions across atlases. For example, in the BAMS database we found differences between the 1998 atlas and 2004 rat brain atlases (Swanson, 1999, 2004). Although mappings between the two atlases are formalized and accessible, only 60% of the regions have mappings (Swanson and Bota, 2010). CoCoMac, a tract tracing database of Macaque connectivity has spent significant effort to reconcile the atlases and like BAMS it provides information on equal, overlapping, and enclosing brain regions (Stephan et al., 2000; Kotter, 2004; Kotter and Wanke, 2005). Using CoCoMac, Modha and Singh (2010) were able to merge the 379 parcellation schemes and over 16,000 mapping relations to create the largest wiring diagram for the Macaque brain. These formalized brain maps will play an important role in future multimodal analyses of the nervous system. Overall, limitations in our ability to interpret these results stress the need for highly detailed neuroinformatics databases of many modalities (Akil et al., 2011).
In conclusion, we identified a novel expression pattern in the rodent brain that correlates with patterns of connectivity and measures of cellular composition. Future work will be aimed at further dissecting these and other patterns, including the potential relationships they may have with behavioral mutations in mice or neuropsychiatric disorders in humans.
Conflict of Interest Statement
The authors declare that the research was conducted in the absence of any commercial or financial relationships that could be construed as a potential conflict of interest.
Acknowledgments
We are greatly thankful to the providers of the data sets relied upon in this study: the Allen Institute for Brain Research, Cahoy et al. and The Brain Architecture Centre. We thank Kevin She and Jesse Gillis for valuable discussion. We thank the reviewers for their helpful comments and suggestions. This work was supported in part by a Discovery Grant from the Natural Sciences and Engineering Research Council of Canada (371348). Further support was provided by a National Institutes of Health grant GM076990 to Paul Pavlidis, the Canadian Foundation for Innovation (Leaders Opportunities Fund), the Michael Smith Foundation for Health Research (Career Investigator award to Paul Pavlidis), and the Canadian Institutes of Health Research (New Investigator Salary Award to Paul Pavlidis). Powell Patrick Cheng Tan is supported by the CIHR Strategic Training Program in Bioinformatics. The funders had no role in study design, data collection and analysis, decision to publish, or preparation of the manuscript.
Supplementary Material
The Supplementary Material for this article can be found online at http://www.frontiersin.org/neuroinformatics/10.3389/fninf.2011.00012/abstract/
Data Sheet 1. Pattern NE identifiers.
Data Sheet 2. Pattern OE identifiers.
Data Sheet 3. Complete pattern OE and NE Gene Ontology enrichment results.
References
Akil, H., Martone, M. E., and Van Essen, D. C. (2011). Challenges and opportunities in mining neuroscience data. Science 331, 708–712.
Ashburner, M., Ball, C. A., Blake, J. A., Botstein, D., Butler, H., Cherry, J. M., Davis, A. P., Dolinski, K., Dwight, S. S., Eppig, J. T., Harris, M. A., Hill, D. P., Issel-Tarver, L., Kasarskis, A., Lewis, S., Matese, J. C., Richardson, J. E., Ringwald, M., Rubin, G. M., and Sherlock, G. (2000). Gene ontology: tool for the unification of biology. The Gene Ontology Consortium. Nat. Genet. 25, 25–29.
Baruch, L., Itzkovitz, S., Golan-Mashiach, M., Shapiro, E., and Segal, E. (2008). Using expression profiles of Caenorhabditis elegans neurons to identify genes that mediate synaptic connectivity. PLoS Comput. Biol. 4, e1000120. doi: 10.1371/journal.pcbi.1000120
Biswal, B. B., Mennes, M., Zuo, X. N., Gohel, S., Kelly, C., Smith, S. M., Beckmann, C. F., Adelstein, J. S., Buckner, R. L., Colcombe, S., Dogonowski, A. M., Ernst, M., Fair, D., Hampson, M., Hoptman, M. J., Hyde, J. S., Kiviniemi, V. J., Kotter, R., Li, S. J., Lin, C. P., Lowe, M. J., Mackay, C., Madden, D. J., Madsen, K. H., Margulies, D. S., Mayberg, H. S., Mcmahon, K., Monk, C. S., Mostofsky, S. H., Nagel, B. J., Pekar, J. J., Peltier, S. J., Petersen, S. E., Riedl, V., Rombouts, S. A., Rypma, B., Schlaggar, B. L., Schmidt, S., Seidler, R. D., Siegle, G. J., Sorg, C., Teng, G. J., Veijola, J., Villringer, A., Walter, M., Wang, L., Weng, X. C., Whitfield-Gabrieli, S., Williamson, P., Windischberger, C., Zang, Y. F., Zhang, H. Y., Castellanos, F. X., and Milham, M. P. (2010). Toward discovery science of human brain function. Proc. Natl. Acad. Sci. U.S.A. 107, 4734–4739.
Bohland, J. W., Bokil, H., Allen, C. B., and Mitra, P. P. (2009a). The brain atlas concordance problem: quantitative comparison of anatomical parcellations. PLoS ONE 4, e7200. doi: 10.1371/journal.pone.0007200
Bohland, J. W., Bokil, H., Pathak, S. D., Lee, C. K., Ng, L., Lau, C., Kuan, C., Hawrylycz, M., and Mitra, P. P. (2009b). Clustering of spatial gene expression patterns in the mouse brain and comparison with classical neuroanatomy. Methods 50, 105–112.
Bota, M., Dong, H. W., and Swanson, L. W. (2003). From gene networks to brain networks. Nat. Neurosci. 6, 795–799.
Bota, M., Dong, H. W., and Swanson, L. W. (2005). Brain architecture management system. Neuroinformatics 3, 15–48.
Cahoy, J. D., Emery, B., Kaushal, A., Foo, L. C., Zamanian, J. L., Christopherson, K. S., Xing, Y., Lubischer, J. L., Krieg, P. A., Krupenko, S. A., Thompson, W. J., and Barres, B. A. (2008). A transcriptome database for astrocytes, neurons, and oligodendrocytes: a new resource for understanding brain development and function. J. Neurosci. 28, 264–278.
Dong, H. W., Swanson, L. W., Chen, L., Fanselow, M. S., and Toga, A. W. (2009). Genomic-anatomic evidence for distinct functional domains in hippocampal field CA1. Proc. Natl. Acad. Sci. U.S.A. 106, 11794–11799.
Emes, R. D., Pocklington, A. J., Anderson, C. N., Bayes, A., Collins, M. O., Vickers, C. A., Croning, M. D., Malik, B. R., Choudhary, J. S., Armstrong, J. D., and Grant, S. G. (2008). Evolutionary expansion and anatomical specialization of synapse proteome complexity. Nat. Neurosci. 11, 799–806.
French, L., and Pavlidis, P. (2011). Relationships between gene expression and brain wiring in the adult rodent brain. PLoS Comput. Biol. 7, e1001049. doi: 10.1371/journal.pcbi.1001049
Gerstein, M. B., Bruce, C., Rozowsky, J. S., Zheng, D., Du, J., Korbel, J. O., Emanuelsson, O., Zhang, Z. D., Weissman, S., and Snyder, M. (2007). What is a gene, post-ENCODE? History and updated definition. Genome Res. 17, 669–681.
Ghandour, M. S., Langley, O. K., Labourdette, G., Vincendon, G., and Gombos, G. (1981). Specific and artefactual cellular localizations of S 100 protein: an astrocyte marker in rat cerebellum. Dev. Neurosci. 4, 66–78.
Ghandour, M. S., Langley, O. K., Vincendon, G., and Gombos, G. (1979). Double labeling immunohistochemical technique provides evidence of the specificity of glial cell markers. J. Histochem. Cytochem. 27, 1634–1637.
Ghandour, M. S., Langley, O. K., Vincendon, G., Gombos, G., Filippi, D., Limozin, N., Dalmasso, D., and Laurent, G. (1980). Immunochemical and immunohistochemical study of carbonic anhydrase II in adult rat cerebellum: a marker for oligodendrocytes. Neuroscience 5, 559–571.
Gillis, J., Mistry, M., and Pavlidis, P. (2010). Gene function analysis in complex data sets using ErmineJ. Nat. Protoc. 5, 1148–1159.
Harris, T. W., Antoshechkin, I., Bieri, T., Blasiar, D., Chan, J., Chen, W. J., De La Cruz, N., Davis, P., Duesbury, M., Fang, R., Fernandes, J., Han, M., Kishore, R., Lee, R., Muller, H. M., Nakamura, C., Ozersky, P., Petcherski, A., Rangarajan, A., Rogers, A., Schindelman, G., Schwarz, E. M., Tuli, M. A., Van Auken, K., Wang, D., Wang, X., Williams, G., Yook, K., Durbin, R., Stein, L. D., Spieth, J., and Sternberg, P. W. (2010). WormBase: a comprehensive resource for nematode research. Nucleic Acids Res. 38, D463–D467.
Hawrylycz, M., Baldock, R. A., Burger, A., Hashikawa, T., Johnson, G. A., Martone, M., Ng, L., Lau, C., Larson, S. D., Nissanov, J., Puelles, L., Ruffins, S., Verbeek, F., Zaslavsky, I., and Boline, J. (2011). Digital atlasing and standardization in the mouse brain. PLoS Comput. Biol. 7, e1001065. doi: 10.1371/journal.pcbi.1001065
Kaufman, A., Dror, G., Meilijson, I., and Ruppin, E. (2006). Gene expression of Caenorhabditis elegans neurons carries information on their synaptic connectivity. PLoS Comput. Biol. 2, e167. doi: 10.1371/journal.pcbi.0020167
Kotter, R. (2004). Online retrieval, processing, and visualization of primate connectivity data from the CoCoMac database. Neuroinformatics 2, 127–144.
Kotter, R., and Wanke, E. (2005). Mapping brains without coordinates. Philos. Trans. R. Soc. Lond. B Biol. Sci. 360, 751–766.
Lein, E. S., Hawrylycz, M. J., Ao, N., Ayres, M., Bensinger, A., Bernard, A., Boe, A. F., Boguski, M. S., Brockway, K. S., Byrnes, E. J., Chen, L., Chen, L., Chen, T. M., Chin, M. C., Chong, J., Crook, B. E., Czaplinska, A., Dang, C. N., Datta, S., Dee, N. R., Desaki, A. L., Desta, T., Diep, E., Dolbeare, T. A., Donelan, M. J., Dong, H. W., Dougherty, J. G., Duncan, B. J., Ebbert, A. J., Eichele, G., Estin, L. K., Faber, C., Facer, B. A., Fields, R., Fischer, S. R., Fliss, T. P., Frensley, C., Gates, S. N., Glattfelder, K. J., Halverson, K. R., Hart, M. R., Hohmann, J. G., Howell, M. P., Jeung, D. P., Johnson, R. A., Karr, P. T., Kawal, R., Kidney, J. M., Knapik, R. H., Kuan, C. L., Lake, J. H., Laramee, A. R., Larsen, K. D., Lau, C., Lemon, T. A., Liang, A. J., Liu, Y., Luong, L. T., Michaels, J., Morgan, J. J., Morgan, R. J., Mortrud, M. T., Mosqueda, N. F., Ng, L. L., Ng, R., Orta, G. J., Overly, C. C., Pak, T. H., Parry, S. E., Pathak, S. D., Pearson, O. C., Puchalski, R. B., Riley, Z. L., Rockett, H. R., Rowland, S. A., Royall, J. J., Ruiz, M. J., Sarno, N. R., Schaffnit, K., Shapovalova, N. V., Sivisay, T., Slaughterbeck, C. R., Smith, S. C., Smith, K. A., Smith, B. I., Sodt, A. J., Stewart, N. N., Stumpf, K. R., Sunkin, S. M., Sutram, M., Tam, A., Teemer, C. D., Thaller, C., Thompson, C. L., Varnam, L. R., Visel, A., Whitlock, R. M., Wohnoutka, P. E., Wolkey, C. K., Wong, V. Y., Wood, M., Yaylaoglu, M. B., Young, R. C., Youngstrom, B. L., Yuan, X. F., Zhang, B., Zwingman, T. A., and Jones, A. R. (2007). Genome-wide atlas of gene expression in the adult mouse brain. Nature 445, 168–176.
Letournel, F., Bocquet, A., Perrot, R., Dechaume, A., Guinut, F., Eyer, J., and Barthelaix, A. (2006). Neurofilament high molecular weight-green fluorescent protein fusion is normally expressed in neurons and transported in axons: a neuronal marker to investigate the biology of neurofilaments. Neuroscience 137, 103–111.
Lichtman, J. W., and Sanes, J. R. (2008). Ome sweet ome: what can the genome tell us about the connectome? Curr. Opin. Neurobiol. 18, 346–353.
Modha, D. S., and Singh, R. (2010). Network architecture of the long-distance pathways in the macaque brain. Proc. Natl. Acad. Sci. U.S.A. 107, 13485–13490.
Moldrich, R. X., Pannek, K., Hoch, R., Rubenstein, J. L., Kurniawan, N. D., and Richards, L. J. (2010). Comparative mouse brain tractography of diffusion magnetic resonance imaging. Neuroimage 51, 1027–1036.
Ng, L., Bernard, A., Lau, C., Overly, C. C., Dong, H. W., Kuan, C., Pathak, S., Sunkin, S. M., Dang, C., Bohland, J. W., Bokil, H., Mitra, P. P., Puelles, L., Hohmann, J., Anderson, D. J., Lein, E. S., Jones, A. R., and Hawrylycz, M. (2009). An anatomic gene expression atlas of the adult mouse brain. Nat. Neurosci. 12, 356–362.
Ouimet, C. C., Mcguinness, T. L., and Greengard, P. (1984). Immunocytochemical localization of calcium/calmodulin-dependent protein kinase II in rat brain. Proc. Natl. Acad. Sci. U.S.A. 81, 5604–5608.
Pfeiffer, B., Norman, A. W., and Hamprecht, B. (1989). Immunocytochemical characterization of neuron-rich rat brain primary cultures: calbindin D28K as marker of a neuronal subpopulation. Brain Res. 476, 120–128.
Pocklington, A. J., Cumiskey, M., Armstrong, J. D., and Grant, S. G. (2006). The proteomes of neurotransmitter receptor complexes form modular networks with distributed functionality underlying plasticity and behaviour. Mol. Syst. Biol. 2, 2006 :0023.
Polleux, F., Ince-Dunn, G., and Ghosh, A. (2007). Transcriptional regulation of vertebrate axon guidance and synapse formation. Nat. Rev. Neurosci. 8, 331–340.
Ressler, K. J., Paschall, G., Zhou, X. L., and Davis, M. (2002). Regulation of synaptic plasticity genes during consolidation of fear conditioning. J. Neurosci. 22, 7892–7902.
Rosengren, L. E., Kjellstrand, P., Aurell, A., and Haglid, K. G. (1986). Irreversible effects of dichloromethane on the brain after long term exposure: a quantitative study of DNA and the glial cell marker proteins S-100 and GFA. Br. J. Ind. Med. 43, 291–299.
Sporns, O., Tononi, G., and Kotter, R. (2005). The human connectome: a structural description of the human brain. PLoS Comput. Biol. 1, e42. doi: 10.1371/journal.pcbi.0010042
Stephan, K. E., Zilles, K., and Kotter, R. (2000). Coordinate-independent mapping of structural and functional data by objective relational transformation (ORT). Philos. Trans. R. Soc. Lond. B Biol. Sci. 355, 37–54.
Swanson, L. W., and Bota, M. (2010). Foundational model of structural connectivity in the nervous system with a schema for wiring diagrams, connectome, and basic plan architecture. Proc. Natl. Acad. Sci. U.S.A. 107, 20610–20617.
Varadan, V., Miller, D. M. III, and Anastassiou, D. (2006). Computational inference of the molecular logic for synaptic connectivity in C. elegans. Bioinformatics 22, e497–e506.
Wheeler, D. L., Barrett, T., Benson, D. A., Bryant, S. H., Canese, K., Chetvernin, V., Church, D. M., Dicuccio, M., Edgar, R., Federhen, S., Geer, L. Y., Kapustin, Y., Khovayko, O., Landsman, D., Lipman, D. J., Madden, T. L., Maglott, D. R., Ostell, J., Miller, V., Pruitt, K. D., Schuler, G. D., Sequeira, E., Sherry, S. T., Sirotkin, K., Souvorov, A., Starchenko, G., Tatusov, R. L., Tatusova, T. A., Wagner, L., and Yaschenko, E. (2007). Database resources of the National Center for Biotechnology Information. Nucleic Acids Res. 35, D5–D12.
White, J. G., Southgate, E., Thomson, J. N., and Brenner, S. (1986). The structure of the nervous system of the nematode Caenorhabditis elegans. Philos. Trans. R. Soc. Lond. B Biol. Sci. 314, 1–340.
Wolf, L., Goldberg, C., Manor, N., Sharan, R., and Ruppin, E. (2011). Gene expression in the rodent brain is associated with its regional connectivity. PLoS Comput. Biol. 7, e1002040. doi: 10.1371/journal.pcbi.1002040
Keywords: connectome, genome, transcriptome, neuron, oligodendrocyte
Citation: French L, Tan PPC and Pavlidis P (2011) Large-scale analysis of gene expression and connectivity in the rodent brain: insights through data integration. Front. Neuroinform. 5:12. doi: 10.3389/fninf.2011.00012
Received: 25 March 2011; Accepted: 18 July 2011;
Published online: 29 July 2011.
Edited by:
Olaf Sporns, Indiana University, USACopyright: © 2011 French, Tan and Pavlidis. This is an open-access article subject to a non-exclusive license between the authors and Frontiers Media SA, which permits use, distribution and reproduction in other forums, provided the original authors and source are credited and other Frontiers conditions are complied with.
*Correspondence: Paul Pavlidis, Centre for High- Throughput Biology, University of British Columbia, 2185 East Mall, Vancouver, BC, Canada V6T 1Z4. e-mail:cGF1bEBjaGliaS51YmMuY2E=