 Pravat K. Mandal
 Kanika Sandal
 Deepika Shukla
 Manjari Tripathi
 Kuldeep Singh
 Saurav Roy
- 1NeuroImaging and NeuroSpectroscopy (NINS) Laboratory, National Brain Research Centre, Manesar, India
- 2Florey Institute of Neuroscience and Mental Health, Parkville, VIC, Australia
- 3Department of Neurology, All Indian Institute of Medical Sciences, New Delhi, India
Alzheimer’s disease (AD) is a devastating neurodegenerative disorder affecting millions of people worldwide. The etiology of AD is not known, and intense research involving multimodal neuroimaging data (e.g., MRI, functional MRI, PET etc.) is extensively used to identify the causal molecular process for AD. In this context, various imaging-based databases accessible to researchers globally, are useful for an independent analysis. Apart from MRI-based brain imaging data, the neurochemical data using magnetic resonance spectroscopy (MRS) provide early molecular processes before the structural or functional changes are manifested. The existing imaging-based databases in AD lack the integration of MRS modality and, thus, limits the availability of neurochemical information to the AD research community. This perspective is an initiative to bring attention to the development of the neuroimaging database, “ANSH,” that includes brain glutathione (GSH), gamma aminobutyric acid (GABA) levels, and other neurochemicals along with MRI-based information for AD, mild cognitive impairment (MCI), and healthy subjects. ANSH is supported by a JAVA-based workflow environment and python providing a simple, dynamic, and distributed platform with data security. The platform consists of two-tiered architecture for data collection and management further supporting quality control, report generation for analyzed data, and data backup with a dedicated storage system. The ANSH database aims to present a single neuroimaging data platform incorporating diverse data types from healthy control and patient groups to provide better insights pertaining to disease progression. This data management platform provides flexible data sharing across users with continuous project monitoring. The development of ANSH platform will facilitate collaborative research and multi-site data sharing across the globe.
Introduction
Alzheimer’s disease (AD) is a major neurodegenerative disorder, and the number of AD patients is increasing globally with each passing year, and disease-modifying treatment is not available. Although pathophysiologic knowledge of AD from existing hypotheses like amyloid beta deposition (Hardy and Higgins, 1992) has helped immensely to understand the disease process, the causal process for AD has not been identified. Neuroimaging modalities involving MRI, fMRI, PET, and behavioral studies have provided the associated structural and behavioral changes in the disease process (Gorgolewski et al., 2016). The first such database was reported by the National Alzheimer’s Coordinating Center (NACC), which mainly involved MRI, and the genetic and behavioral dataset of healthy old (HO), and AD patients (Cronin-Stubbs et al., 2000; Beekly et al., 2004). These databases created an opportune situation for the sharing of imaging-based data with researchers. There are other databases from Image Data Archive, Laboratory of NeuroImaging (IDA LONI; Rex et al., 2003; Neu et al., 2005), Longitudinal Online Research Imaging System (LORIS; Das et al., 2011), Extensible Neuroimaging Archive Toolkit (XNAT; Marcus et al., 2007), Open Access Series of Imaging Study (OASIS; Marcus et al., 2007), Biomedical Informatics Research Network (BIRN; Keator et al., 2008), and Collaborative Informatics and Neuroimaging Suite (COINS; Scott et al., 2011). The list of databases is expanding, and only a few specific features mainly structural and functional related to AD are presented in Figure 1. Subsequently, neurochemical data is added in the present dataset “ANSH” to bridge the gap (Figure 1). MR spectroscopy (MRS) is a potent non-invasive modality to identify the various neurochemicals involved in the early disease process. MRS-driven outcomes provide information that is critically involved in the transition of normal healthy person to mild cognitive impairment (MCI).
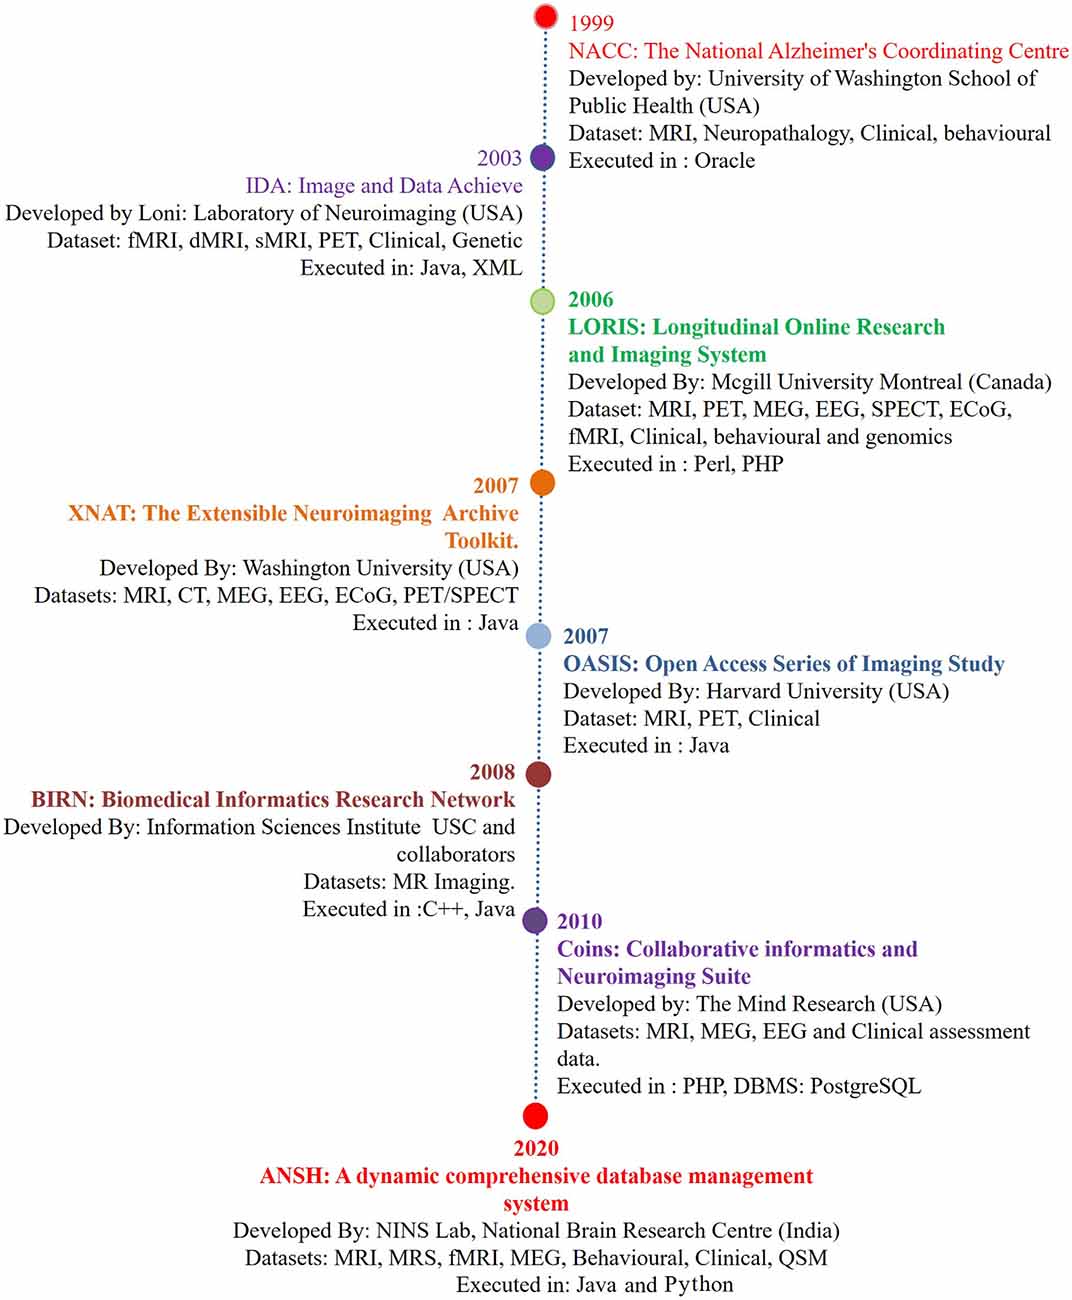
Figure 1. The chronological development of various neuroimage-based database pertaining to Alzheimer’s disease (AD) research with a variety of modalities. (1) National Alzheimer’s Coordinating Center (NACC; Cronin-Stubbs et al., 2000; Beekly et al., 2004). (2) IDA-LONI (Rex et al., 2003; Neu et al., 2005). (3) Longitudinal Online Research Imaging System (LORIS; Das et al., 2011). (4) Neuroimaging Archive Toolkit (XNAT; Marcus et al., 2007). (5) Open Access Series of Imaging Study (OASIS; Marcus et al., 2007). (6) Biomedical Informatics Research Network (BIRN; Keator et al., 2008). (7) Collaborative Informatics and Neuroimaging Suite (COINS; Scott et al., 2011). (8) ANSH: a dynamic comprehensive database management system. Abbreviations: DTI, diffusion tensor imaging; ECoG, electrocorticography; EEG, electroencephalogram; fMRI, functional magnetic resonance imaging; MEG, magnetoencephalography; MRS, magnetic resonance spectroscopy; PET, positron emission tomography; QSM, quantitative susceptibility mapping; SPECT, single-photon emission computerized tomography. MRS data specifically critical antioxidant, receptors, and brain energy metabolites will be available through the ANSH.
Various neurochemicals [e.g., N-acetyl aspartate (NAA), myo-Inositol (mI), creatine (Cr), choline (Cho), etc.; Doraiswamy et al., 1998; Mandal et al., 2015], neurotransmitter [e.g., gamma aminobutyric acid (GABA), glutamate, glutamine, etc.; Bai et al., 2015), antioxidant, and glutathione (GSH) level (Mandal et al., 2012, 2015; Shukla et al., 2020] can be quantified in AD brain using MRS. The NAA/mI ratio and the GSH levels from the hippocampus are correlated to cognitive decline in various behavioral studies (Doraiswamy et al., 1998; Mandal et al., 2015). In MRS studies, the depletion of GSH in the hippocampus, frontal cortices, and anterior cingulate cortices (Mandal et al., 2012, 2015; Shukla et al., 2020) has been validated from various independent postmortem studies (Gu et al., 1998; Sultana et al., 2008; Ansari and Scheff, 2010).
Hence, the inclusion of neurochemical data is required and will play a profound role in AD research for identifying a causal molecular process for AD, possible therapeutic development, and monitoring disease progression. ANSH is the first platform where antioxidant, neurotransmitter, and energy metabolites are discussed and will be available to the research community.
A Chronological Development of Various AD-Based Database
Database and associated data-processing platforms are powerful tools for supporting medical data mining and discovery from the wealth of routinely acquired clinical and imaging data. This facilitates better information, individualized and optimized patient care (Bui et al., 2013).
Since then, many initiatives progressed toward the open sharing and reusability of the original data. This section briefly describes more details of these databases. The University of Washington School of Public Health supported by the National Institute of Health (NIH) started the Alzheimer’s Disease Research Center (ADRC) with a mandate to provide a comprehensive advanced AD research and related disorders from 39 ADRCs at various medical schools across the United States. NACC started with a behavioral and genetic dataset platform and then gradually incorporated MR imaging (Cronin-Stubbs et al., 2000; Beekly et al., 2004). Subsequently, an increasing number of experiments led to the generation of heterogeneous datasets, with an urgent need for standardization and distribution of this information. This initiative resulted in the creation of IDA-LONI for data sharing concerning the disease progression from various research sites globally1. IDA-LONI is a hub comprising approximately 138 studies from various disease datasets with new studies added overtime (Petersen et al., 2010). LONI is fortified with upload, download, quality check (QC), processing, and various other user-level sharing features. The Alzheimer’s disease neuroimaging initiative (ADNI; Petersen et al., 2010) and the human connectome projects are associated with this platform (Rex et al., 2003). LORIS is a web-based platform for neuroimaging studies (Das et al., 2011). LORIS consists of a wide range of datasets including neurological, behavioral, and imaging data from anatomical, functional maps, atlases, and MRI models. LORIS streamlined a framework for storing and processing behavioral, clinical, neuroimaging, and genetic data. The combination of the software platform and web-based approach for data management, throughput task, and data sharing to the approved users was supported by the Neuroimaging Archive Toolkit (XNAT; Marcus et al., 2007), Analysis of Functional Neuroimages (AFNI; Cox, 1996), Human Imaging Database (HID; Marcus et al., 2011), and Brain Imaging Data Structure (BIDS; Gorgolewski et al., 2016), which provide the user with the data management tools for a better analysis of data across a diverse number of neuroimaging datasets. The Neuro-Imaging Tools and Resource Collaboratory (NITRC) has played a vital role in hosting all the neuroimaging software repository, data, and toolboxes under one platform2.
OASIS (Marcus et al., 2007) is a dedicated project involving brain MRI and PET longitudinal data available to the scientific community. The BIRN package offers an amalgamated and distributed infrastructure for the storage, retrieval, analysis, and documentation of biomedical imaging datasets (Keator et al., 2008). BIRN uses XNAT and HID for data acquisition and management (Keator et al., 2008). In progression, COINS is comprised of 300 studies consisting of 19,000 MRI, magnetoencephalography (MEG), and electroencephalogram (EEG) scans with more than 180,000 clinical assessments (Bockholt et al., 2010). The COINS database provides an optimized platform for data mining from multiorganization sources shared with added security and data tracking portal with Public Health Information (PHI; Bockholt et al., 2010).
Importance of MR Spectroscopy Data and Application
MRS data can be generated from any part of the brain using single-voxel mode or multivoxel mode (Mandal, 2007). MRS data is generally smaller in size and easy to handle compared to MRI-based data. Various advanced packages are available to process MRS data, and absolute quantitation of various neurochemicals is also possible (Mandal and Shukla, 2020). These MRS-processing packages can be added with a suitable plugin so that processed MRS data can be utilized in multimodel big data analytics (Sharma et al., 2019). Various MRS pulse sequences are now available to detect specific neurochemicals (GABA, GSH, glutamate/glutamine) without any ambiguity (Terpstra et al., 2003). Figure 2A represents the MRS spectra from the left hippocampus by placing the single-voxel (25 × 25 × 25 mm3), MRS data was acquired using a 3T MRI (Achieva, Philips) scanner, and processed using the KALPANA software (Mandal and Shukla, 2020). Figure 2B represents absolute quantitation of GSH in relevant amount (mM) from the left hippocampus of HO, MCI, and AD patients (Mandal et al., 2015). Significant depletion of GSH level from the left hippocampus, as detected by in vivo MRS, is sensitive for comparing HO, MCI, and AD patients. MRS is also the only technique that can be used to detect the GSH conformers in vivo, and these conformers are likely to play an important role in the AD disease process (Mandal et al., 2017, 2019; Shukla et al., 2020). The changes in the GSH level are susceptible to AD pathology only. Data indicated that, GSH level in the left cerebellum of AD and HO did not alter significantly (p = 0.536); however, the specific change in GSH in the hippocampal regions in the same AD and HO groups was found to be significant (p < 0.001; Mandal et al., 2015). The database involving 31P MRS is critical to understand the impaired energy metabolism process (e.g., increased hippocampal pH) in the AD brain in contrast to the age-matched normal brain (Mandal et al., 2012; Rijpma et al., 2018).
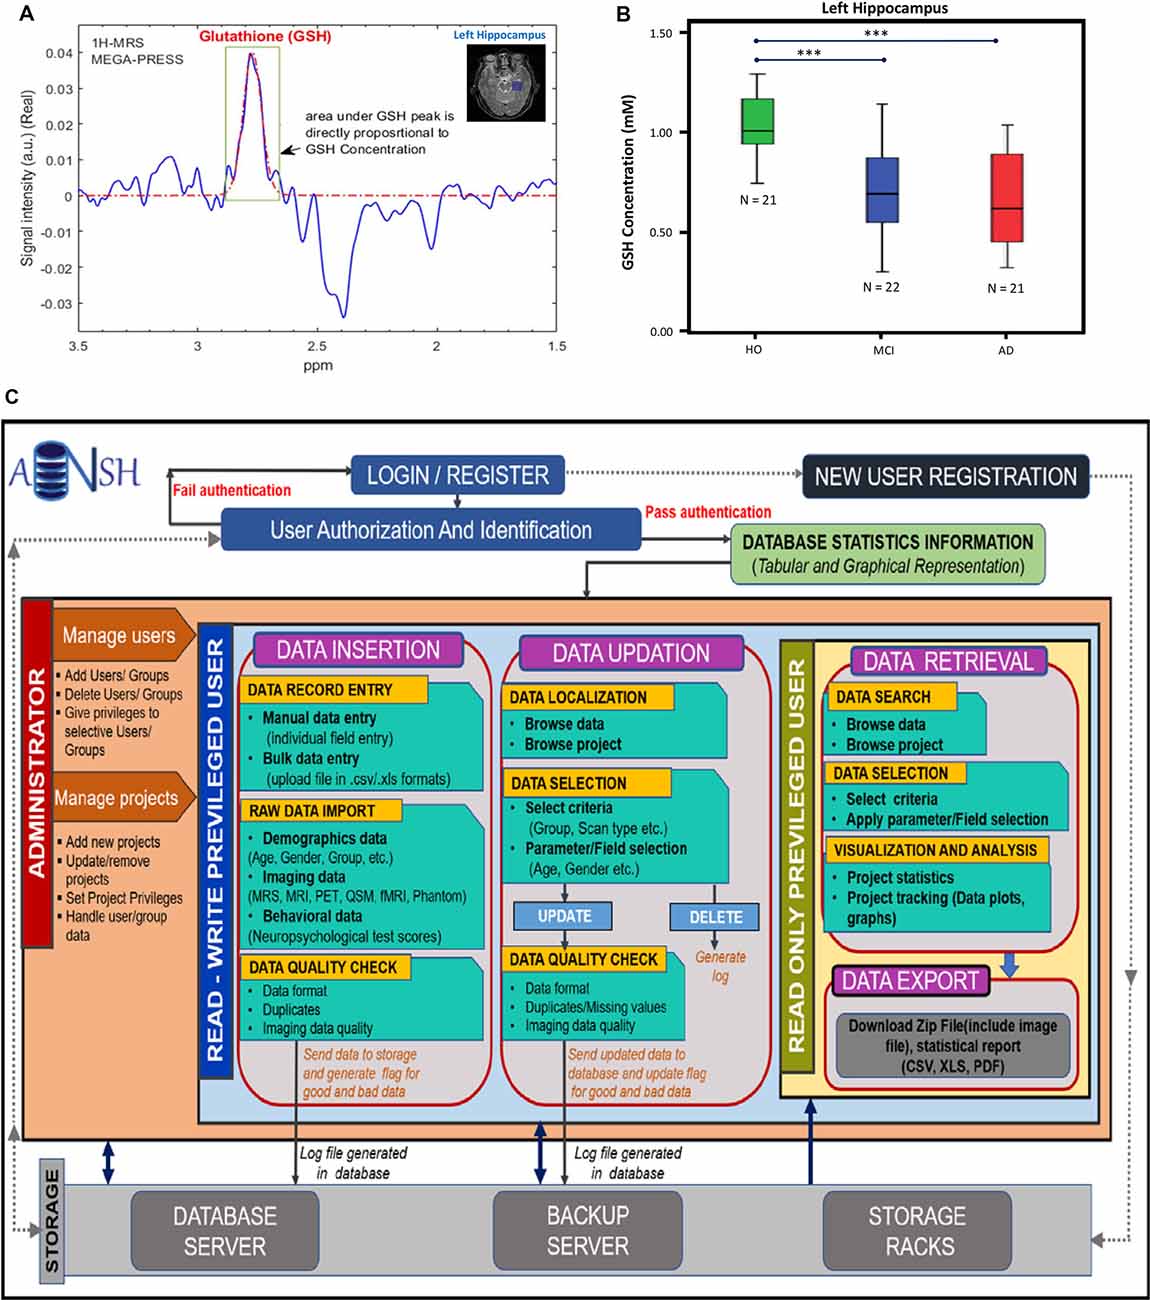
Figure 2. (A) 1H-MRS MEGA-PRESS edited spectra for in vivo glutathione (GSH) estimation in the left hippocampus of a HO brain. (B) Box–whisker plot showing significant GSH concentration depletion in the mild cognitive impairment (MCI) and AD groups compared to the HO group. ***The significance level was set at p < 0.001 (Mandal et al., 2015). (C) This workflow illustrates the conventions for the construction of database and management of data. The access of data is provided by the user authentication. The privileged user is provided with two main segments, i.e., data insertion and updation, where the user can review data and can make appropriate changes. Both segments follow the raw image quality control (QC) before putting the data in the backup servers. It will also keep a track of the data usage and generate logs for the changes. Read-only privileged users are enriched with the segment for data retrieval to export image data and the data reports using various search filters and data selection parameters. All segments are interconnected by the backend server and the rack system of the ANSH.
This perspective will bridge the gap providing the unique neurochemical data in AD research.
Technical Details of the ANSH Database in Brief
Key Features
ANSH, a dynamic and distributed data management platform, follows a two-tired architecture that includes a graphical user interface, processing pipeline, and database server. The ANSH supports a JAVA-based workflow environment and python for storage with flexible data access and data sharing among users. In addition, QC ensures an improved database management. The ANSH also provides a report generation feature with the additional functionality of continuous project monitoring using data visualization and statistical analysis.
Some key features of the ANSH are: (1) distributive platform; (2) user login with privacy implementations; (3) quality check; (4) image viewer; (5) centralized approach to fetch data; (6) real-time tracking and backup of the database; (7) heterogeneous data; (8) effortless import/export of data with the use of data-processing pipelines; and (9) report generation.
Data Types and Quality Control
ANSH provides a dynamic and comprehensive database management system for the heterogeneous neuroimaging datasets, specifically MRI and multinuclear MRS for HO, MCI, and AD categories along with the neuropsychological test scores. The MRI data consist of diverse 3D T1, T2-weighted, Flair, and QSM images for different age groups of healthy young as well as HO subjects. Other imaging modalities such as PET, fMRI, and DTI will also be added to the ANSH database. MRS data for GSH and GABA are provided for age-matched HO, MCI, and AD groups along with T1, T2-weighted, and Flair MRI dataset. The neuropsychological score broadly constitutes from the mini-mental state examination, clock drawing test, trail making tests. The flow diagram of the ANSH is presented in Figure 2C.
ANSH User-Flow Schematic
The ANSH incorporates three levels of users including administrator, write/read privileged, and read privileged only. The administrator is the top-level user, responsible for assigning other user’s rights as well as creating and managing the new and existing project information. The administrator only holds the right to completely remove the specific project data from the database. Users with the read and write privileges can read and write the specific data according to the permission given to them by the administrator, whereas the user with the read privileges will only be able to read a selective database for the specific projects as permitted by the administrator. Each user can export the selected data from the specified project.
Dataset Handling
Data entry in the ANSH database can be accomplished individually using data entry forms or imported in bulk. Data insertion and updation rights are held by the administrator and given to the write-privileged users for the specified projects. Data retrieval rights are entitled to all users. The ANSH also provides detailed data report, data visualization plots (i.e., bar and pie charts) as image files and statistical information in the form of pdf and excel which can be exported afterwards.
Data Processing, Storage, and Security
In the ANSH database management system, the user can access the database through a secure desktop application. Data imported or entered, undergoes a rigorous quality assurance process with a quality flag level. This quality tagged data is sent to the server for storage and subsequently history logs are maintained and stored in the ANSH server tracking associated changes.
Data security is provided in multiple steps: (1) authorized users will be granted access to the database, (2) quarantine of sensitive files (e.g., user password file), where files are encrypted and hashed, (3) tracking user behavior against data, (4) successful/failed attempts to establish connection are logged to track intruders, (5) restricting user access by designing and granting appropriate user with limited administrative privileges, and (6) database backups are taken as a part of security protocol, where these backups allow to recover the lost data that may have resulted from hardware failure, data corruption, theft, or natural disasters.
Conclusion and Future Directions
The ANSH database construction is a sincere attempt to bring the critical neurochemical information from HO, MCI, and AD patients to the global researchers for comparative analysis. WE will also add Parkinson disease data and other mental disorders data in ANSH database. This novel program is in an expanding stage and needs further infrastructure support to build a robust system to cater to the Indian and global brain research community.
Data Availability Statement
The original contributions presented in the study are included in the article, further inquiries can be directed to PM through email cHJhdmF0Lm1hbmRhbEBnbWFpbC5jb20=.
Author Contributions
PM and DS conceptualized the idea and were involved in the manuscript writing and figure design. KSa was involved in the database design, manuscript writing, analysis of various databases and preparation of Figure 1. MT was involved in discussion as a clinical collaborator. KSi was involved in programming of the database development and expansion and preparation of Figure 2. SR was involved in Web-based application and front-end generation.
Funding
PM (Principal Investigator) is grateful for the financial support (Tata Innovation Fellow, No. BT/HRD/01/05/2015) from the Ministry of Science and Technology, Government of India, and the Indo-Australian Biotechnology Fund (Grant No. BT/Indo-Aus/10/31/2016). PM (Principal Investigator) and DS (Co-Investigator) also thank the Ministry of Electronics and Information Technology [4(5)/2019/ITEA] for funding support.
Conflict of Interest
The authors declare that the research was conducted in the absence of any commercial or financial relationships that could be construed as a potential conflict of interest.
Acknowledgments
PM thanks Ms. Avantika Samkaria (Researcher, NINS lab) and Ms. Komal Jindal (Senior R&D Engineer, NINS lab) for critical comments and editorial support. PM and DS dedicate this article to their parents.
Footnotes
References
Ansari, M. A., and Scheff, S. W. (2010). Oxidative stress in the progression of Alzheimer disease in the frontal cortex. J. Neuropathol. Exp. Neurol. 69, 155–167. doi: 10.1097/nen.0b013e3181cb5af4
Bai, X., Edden, R. A. E., Gao, F., Wang, G., Wu, L., Zhao, B., et al. (2015). Decreased γ-aminobutyric acid levels in the parietal region of patients with Alzheimer’s disease. J. Magn. Reson. Imaging 41, 1326–1331. doi: 10.1002/jmri.24665
Beekly, D. L., Ramos, E. M., van Belle, G., Deitrich, W., Clark, A. D., Jacka, M. E., et al. (2004). The national Alzheimer’s coordinating center (NACC) database: an Alzheimer disease database. Alzheimer Dis. Assoc. Disord. 18, 270–277.
Bockholt, H. J., Scully, M., Courtney, W., Rachakonda, S., Scott, A., Caprihan, A., et al. (2010). Mining the mind research network: a novel framework for exploring large scale, heterogeneous translational neuroscience research data sources. Front. Neuroinform. 3:36. doi: 10.3389/neuro.11.036.2009
Bui, A. A., Hsu, W., Arnold, C., El-Saden, S., Aberle, D. R., and Taira, R. K. (2013). Imaging-based observational databases for clinical problem solving: the role of informatics. J. Am. Med. Inform. Assoc. 20, 1053–1058. doi: 10.1136/amiajnl-2012-001340
Cox, R. W. (1996). AFNI: software for analysis and visualization of functional magnetic resonance neuroimages. Comput. Biomed. Res. 29, 162–173. doi: 10.1006/cbmr.1996.0014
Cronin-Stubbs, D., DeKosky, S. T., Morris, J. C., and Evans, D. A. (2000). Promoting interactions with basic scientists and clinicians: the NIA Alzheimer’s disease data coordinating center. Stat. Med. 19, 1453–1461. doi: 10.1002/(sici)1097-0258(20000615/30)19:11/12<1453::aid-sim437>3.0.co;2-7
Das, S., Zijdenbos, A. P., Harlap, J., Vins, D., and Evans, A. C. (2011). LORIS: a web-based data management system for multi-center studies. Front. Neuroinform. 5:37. doi: 10.3389/fninf.2011.00037
Doraiswamy, P. M., Charles, H. C., and Krishnan, K. R. (1998). Prediction of cognitive decline in early Alzheimer’s disease. Lancet 352:1678. doi: 10.1016/S0140-6736(05)61449-3
Gorgolewski, K. J., Auer, T., Calhoun, V. D., Craddock, R. C., Das, S., Duff, E. P., et al. (2016). The brain imaging data structure, a format for organizing and describing outputs of neuroimaging experiments. Sci. Data 3:160044. doi: 10.1038/sdata.2016.44
Gu, M., Owen, A. D., Toffa, S. E., Cooper, J. M., Dexter, D. T., Jenner, P., et al. (1998). Mitochondrial function, GSH and iron in neurodegeneration and Lewy body diseases. J. Neurol. Sci. 158, 24–29. doi: 10.1016/s0022-510x(98)00095-1
Hardy, J. A., and Higgins, G. A. (1992). Alzheimer’s disease: the amyloid cascade hypothesis. Science 256, 184–185. doi: 10.1126/science.1566067
Keator, D. B., Grethe, J. S., Marcus, D., Ozyurt, B., Gadde, S., Murphy, S., et al. (2008). A national human neuroimaging collaboratory enabled by the biomedical informatics research network (BIRN). IEEE Trans. Inf. Technol. Biomed. 12, 162–172. doi: 10.1109/TITB.2008.917893
Mandal, P. K. (2007). Magnetic resonance spectroscopy (MRS) and its application in Alzheimer’s disease. Concept Magn. Reson. 30A, 40–64. doi: 10.1002/cmr.a.20072
Mandal, P. K., Akolkar, H., and Tripathi, M. (2012). Mapping of hippocampal pH and neurochemicals from in vivo multi-voxel 31P study in healthy normal young male/female, mild cognitive impairment and Alzheimer’s disease. J. Alzheimers Dis. 31, S75–S86. doi: 10.3233/jad-2012-120166
Mandal, P. K., and Shukla, D. (2020). KALPANA: advanced spectroscopic signal processing platform for improved accuracy to aid in early diagnosis of brain disorders in clinical setting. J. Alzheimers Dis. 75, 397–402. doi: 10.3233/jad-191351
Mandal, P. K., Saharan, S., Tripathi, M., and Murari, G. (2015). Brain glutathione levels—a novel biomarker for mild cognitive impairment and Alzheimer’s disease. Biol. Psychiatry 78, 702–710. doi: 10.1016/j.biopsych.2015.04.005
Mandal, P. K., Shukla, D., Govind, V., Boulard, Y., and Ersland, L. (2017). Glutathione conformations and its implications for in vivo magnetic resonance spectroscopy. J. Alzheimers Dis. 59, 537–541. doi: 10.3233/jad-170350
Mandal, P. K., Shukla, D., Tripathi, M., and Ersland, L. (2019). Cognitive improvement with glutathione supplement in Alzheimer’s disease: a way forward. J. Alzheimers Dis. 68, 531–535. doi: 10.3233/jad-181054
Mandal, P. K., Tripathi, M., and Sugunan, S. (2012). Brain oxidative stress: detection and mapping of anti-oxidant marker “glutathione” in different brain regions of healthy male/female, MCI and Alzheimer patients using non-invasive magnetic resonance spectroscopy. Biochem. Biophys. Res. Commun. 417, 43–48. doi: 10.1016/j.bbrc.2011.11.047
Marcus, D. S., Harwell, J., Olsen, T., Hodge, M., Glasser, M. F., Prior, F., et al. (2011). Informatics and data mining tools and strategies for the human connectome project. Front. Neuroinform. 5:4. doi: 10.3389/fninf.2011.00004
Marcus, D. S., Olsen, T. R., Ramaratnam, M., and Buckner, R. L. (2007). The extensible neuroimaging archive toolkit: an informatics platform for managing, exploring and sharing neuroimaging data. Neuroinformatics 5, 11–34. doi: 10.1385/ni:5:1:11
Marcus, D. S., Wang, T. H., Parker, J., Csernansky, J. G., Morris, J. C., and Buckner, R. L. (2007). Open access series of imaging studies (OASIS): cross-sectional MRI data in young, middle aged, nondemented and demented older adults. J. Cogn. Neurosci. 19, 1498–1507. doi: 10.1162/jocn.2007.19.9.1498
Neu, S. C., Valentino, D. J., and Toga, A. W. (2005). The LONI Debabeler: a mediator for neuroimaging software. NeuroImage 24, 1170–1179. doi: 10.1016/j.neuroimage.2004.10.035
Petersen, R. C., Aisen, P. S., Beckett, L. A., Donohue, M. C., Gamst, A. C., Harvey, D. J., et al. (2010). Alzheimer’s disease neuroimaging initiative (ADNI): clinical characterization. Neurology 74, 201–209. doi: 10.1212/WNL.0b013e3181cb3e25
Rex, D. E., Ma, J. Q., and Toga, A. W. (2003). The LONI pipeline processing environment. NeuroImage 19, 1033–1048. doi: 10.1016/s1053-8119(03)00185-x
Rijpma, A., van der Graaf, M., Meulenbroek, O., Olde Rikkert, M. G. M., and Heerschap, A. (2018). Altered brain high-energy phosphate metabolism in mild Alzheimer’s disease: a 3-dimensional 31P MR spectroscopic imaging study. Neuroimage Clin. 18, 254–261. doi: 10.1016/j.nicl.2018.01.031
Scott, A., Courtney, W., Wood, D., de la Garza, R., Lane, S., King, M., et al. (2011). COINS: an innovative informatics and neuroimaging tool suite built for large heterogeneous datasets. Front. Neuroinform. 5:33. doi: 10.3389/fninf.2011.00033
Sharma, A., Shukla, D., Goel, T., and Mandal, P. K. (2019). BHARAT: an integrated big data analytic model for early diagnostic biomarker of Alzheimer’s disease. Front. Neurol. 10:9. doi: 10.3389/fneur.2019.00009
Shukla, D., Mandal, P. K., Tripathi, M., Vishwakarma, G., Mishra, R., and Sandal, K. (2020). Quantitation of in vivo brain glutathione conformers in cingulate cortex among age-matched control, MCI and AD patients using MEGA-PRESS. Hum. Brain Mapp. 41, 194–217. doi: 10.1002/hbm.24799
Sultana, R., Piroddi, M., Galli, F., and Butterfield, D. A. (2008). Protein levels and activity of some antioxidant enzymes in hippocampus of subjects with amnestic mild cognitive impairment. Neurochem. Res. 33, 2540–2546. doi: 10.1007/s11064-008-9593-0
Keywords: Alzheimer’s disease, diagnostic marker, neurochemical, glutathione, neuroimaging, behavioural database
Citation: Mandal PK, Sandal K, Shukla D, Tripathi M, Singh K and Roy S (2020) ANSH: Multimodal Neuroimaging Database Including MR Spectroscopic Data From Each Continent to Advance Alzheimer’s Disease Research. Front. Neuroinform. 14:571039. doi: 10.3389/fninf.2020.571039
Received: 09 June 2020; Accepted: 31 August 2020;
Published: 21 October 2020.
Edited by:
Heye Zhang, Sun Yat-sen University, ChinaReviewed by:
Zhifan Gao, University of Western Ontario, CanadaMenglin Wu, Nanjing Tech University, China
Copyright © 2020 Mandal, Sandal, Shukla, Tripathi, Singh and Roy. This is an open-access article distributed under the terms of the Creative Commons Attribution License (CC BY). The use, distribution or reproduction in other forums is permitted, provided the original author(s) and the copyright owner(s) are credited and that the original publication in this journal is cited, in accordance with accepted academic practice. No use, distribution or reproduction is permitted which does not comply with these terms.
*Correspondence: Pravat K. Mandal, cHJhdmF0Lm1hbmRhbEBnbWFpbC5jb20=; cHJhdmF0Lm1hbmRhbEBmbG9yZXkuZWR1LmF1; Deepika Shukla, ZGVlcGlrYS5zaHVrbGEwOTE0QGdtYWlsLmNvbQ==