 Yuan Shao
 Jingru Ruan
 Yuyun Xu
 Zhenyu Shu
 Xiaodong He
- 1Department of Radiology, Zhejiang Provincial People’s Hospital, Affiliated People’s Hospital of Hangzhou Medical College, Hangzhou, China
- 2Bengbu Medical College, Bengbu, China
Purpose: The aim of this study was to compare two radiomic models in predicting the progression of white matter hyperintensity (WMH) and the speed of progression from conventional magnetic resonance images.
Methods: In this study, 232 people were retrospectively analyzed at Medical Center A (training and testing groups) and Medical Center B (external validation group). A visual rating scale was used to divide all patients into WMH progression and non-progression groups. Two regions of interest (ROIs)—ROI whole-brain white matter (WBWM) and ROI WMH penumbra (WMHp)—were segmented from the baseline image. For predicting WMH progression, logistic regression was applied to create radiomic models in the two ROIs. Then, age, sex, clinical course, vascular risk factors, and imaging factors were incorporated into a stepwise regression analysis to construct the combined diagnosis model. Finally, the presence of a correlation between radiomic findings and the speed of progression was analyzed.
Results: The area under the curve (AUC) was higher for the WMHp-based radiomic model than the WBWM-based radiomic model in training, testing, and validation groups (0.791, 0.768, and 0.767 vs. 0.725, 0.693, and 0.691, respectively). The WBWM-based combined model was established by combining age, hypertension, and rad-score of the ROI WBWM. Also, the WMHp-based combined model is built by combining the age and rad-score of the ROI WMHp. Compared with the WBWM-based model (AUC = 0.779, 0.716, 0.673 in training, testing, and validation groups, respectively), the WMHp-based combined model has higher diagnostic efficiency and better generalization ability (AUC = 0.793, 0.774, 0.777 in training, testing, and validation groups, respectively). The speed of WMH progression was related to the rad-score from ROI WMHp (r = 0.49) but not from ROI WBWM.
Conclusion: The heterogeneity of the penumbra could help identify the individuals at high risk of WMH progression and the rad-score of it was correlated with the speed of progression.
Introduction
White matter hyperintensity (WMH) is a common feature found in the periventricular and deep white matter of the elderly (Longstreth et al., 2005). Maillard et al. (2014) reported that the abnormal regions are perceived as larger on diffusion tensor imaging (DTI) than on fluid-attenuated inversion recovery (FLAIR) images and proposed the concept of “structural penumbra.” A prospective study reported that 80% of WMH progression appears as direct extensions of preexisting lesions rather than new, scattered lesions (de Groot et al., 2013). Also, this study revealed the pattern of WMH progression, which was found to extend from the focus to the penumbra. Our study was aimed at comparing the performance of two radiomic models to predict the progression and progression speed of white matter hyperintensities.
Previous studies have suggested that the FLAIR intensity of a single voxel assists DTI in predicting WMH progression, indicating that the intensity of an individual voxel in conventional Magnetic resonance imaging (MRI) possibly contains influential information regarding the integrity of the white matter (Maillard et al., 2013). Radiomics is a relatively new field that could reveal changes in the microstructure and its regularity by extracting the intensity value of a single voxel and analyzing its relationship with the intensity value of neighboring voxels and its position within the brain (Yip and Aerts, 2016). Our previous research also found that radiomic findings could reflect the heterogeneity and complexity of the white matter, which may result from less uniform MRI signal intensities caused by reduced myelin content or increased water content (Shao et al., 2018; Shu Z. et al., 2020; Shu Z. Y. et al., 2020). Tozer et al. (2018) showed that the texture of the whole-brain white matter (WBWM) was moderately correlated with global cognition and executive dysfunction, and they may be less sensitive than DTI parameters in predicting cognitive decline (Tozer et al., 2018). We thought that considering the WBWM as the region of interest (ROI) may reduce the predictive power as it would contain more normal tissues. However, the heterogeneity and complexity of the penumbra may be more representative of the lesions. To our knowledge, there have been no studies comparing the predictive power of the WBWM and penumbra.
This study was aimed at investigating whether the heterogeneity of the penumbra was more obvious than that of WBWM in identifying high-risk patients. Furthermore, we want to explore whether a correlation exists between radiomic findings and the speed of progression.
Materials and Methods
Subjects
This research was approved by the ethics committee, and the need of obtaining informed consent of patients was waived owing to the retrospective design of the study.
Magnetic resonance imaging data of 152 patients from Medical Center A (ZPP hospital) and 80 patients from Medical Center B (LSP hospital) were collected in this study. The labeled names of all patients of the Medical Center A dataset were listed in alphabetical order and divided into two sets: the division formed a training set (n = 105) and a testing set (n = 47) in the ratio of 7:3. The database of Medical Center B patients was used as an external validation dataset. Prins et al. (2004) proposed a visual rating scale in 2004; based on this scale, all patients were divided into WMH progression group (n = 57 in A and n = 31 in B) and non-progression group (n = 95 in A and n = 49 in B). Periventricular WMH (PWMH) and deep WMH (DWMH) were compared independently. PWMH was defined as WMH within 10 mm from the ventricle surface. WMH away from the ventricle surface 10 mm is defined as DWMH. Scores of −3 to +3 were given according to the progression or decrease in PWMH in the former horn, body, and posterior horn, as shown in Figure 1. Scores of −4 to +4 were given according to the progression or decrease in DWMH in different brain regions. WMH progression was defined when the total score was ≥1. WMHs were graded, and their volume was quantified using FLAIR images. Clinical information on various aspects, such as vascular risk factors, clinical course, age, and sex, was obtained from the medical records of the picture archiving and communications system.
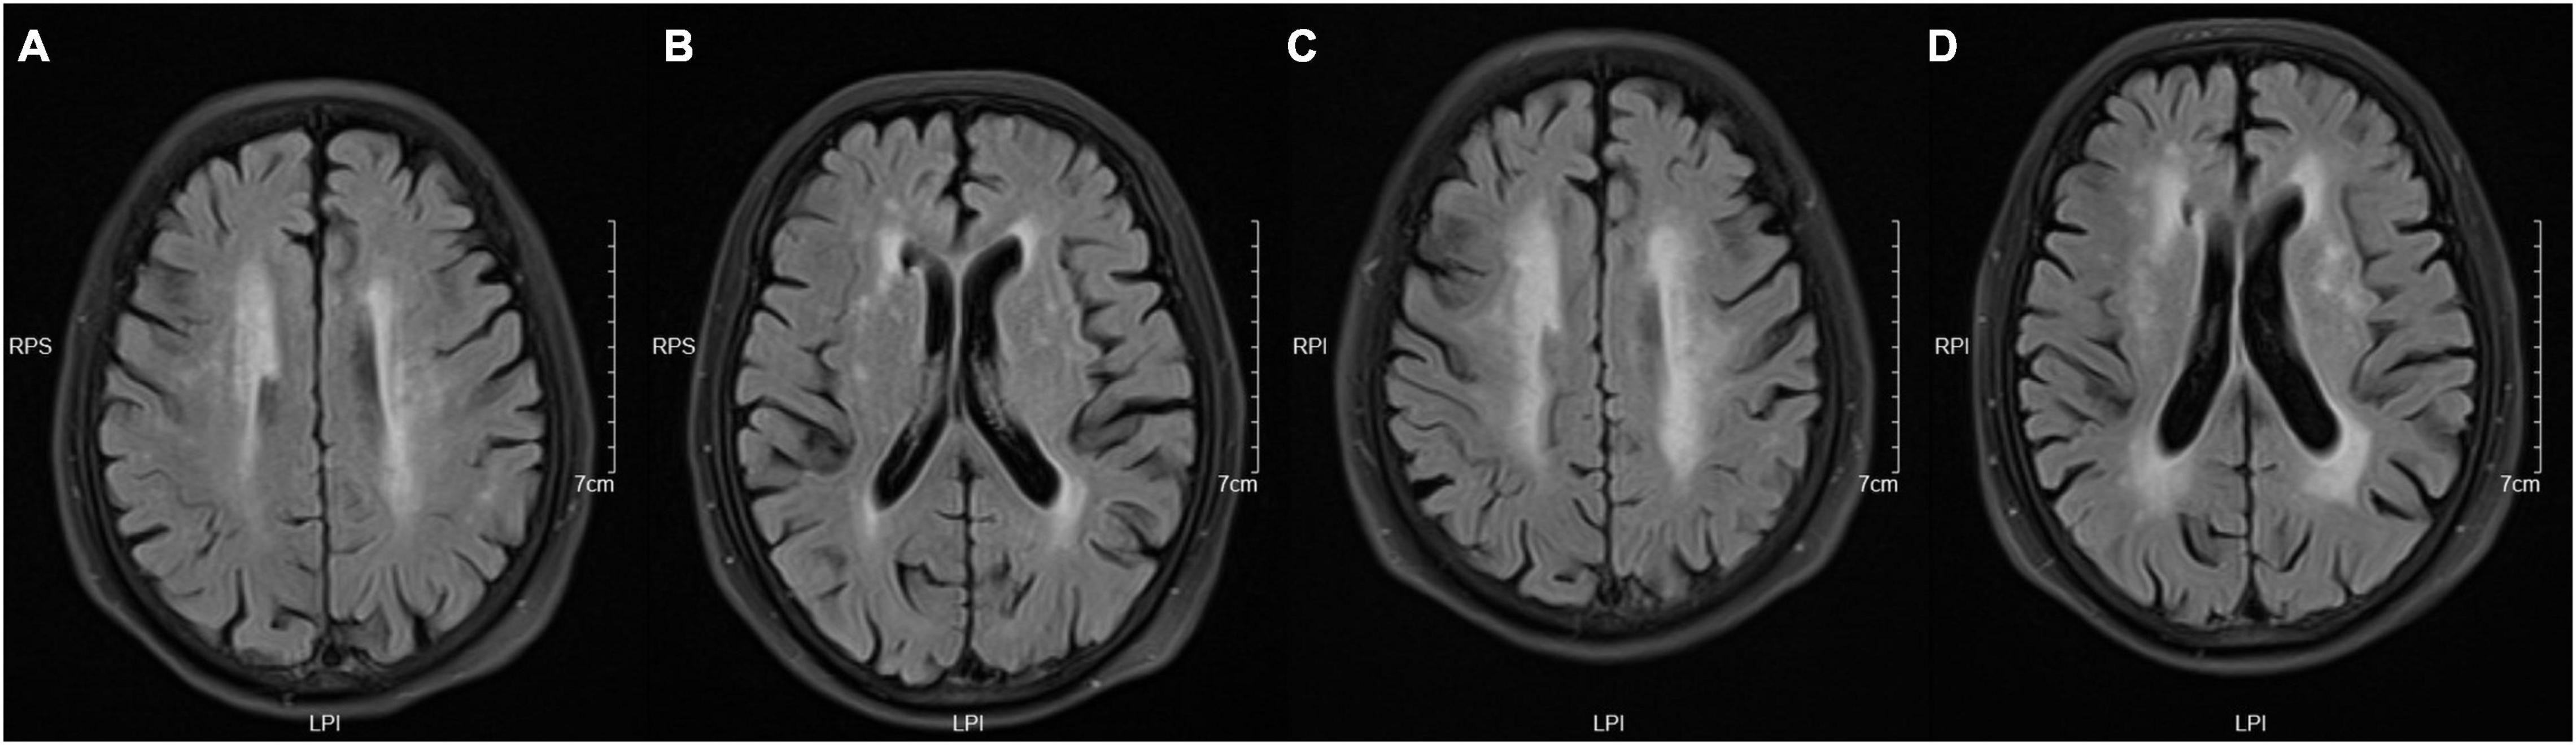
Figure 1. Take the periventricular score as an example. These images were obtained from a 73-year-old woman with a history of hypertension and diabetes. Panels (A,B) are baseline images, and (C,D) are follow-up images. These images show enlargement of white matter hyperintensity (WMH) in frontal caps, lateral bands, and occipital caps. So, the periventricular score for this patient is +3.
We included patients who (1) had a clinical diagnosis of minor strokes or transient ischemic attacks, (2) underwent more than two MRI examinations on the same machine within an interval of 2–3 years, (3) were older than 60 years at the first examination, and (4) had visible WMH at baseline. We excluded patients who (1) had acute vascular lesions, such as ischemic stroke (except for lacunar infarction) or intracranial hemorrhage; (2) had non-vascular white matter lesions, such as immunologic demyelination, metabolic encephalopathy, poisoning, and infection; (3) had other intracranial lesions, including Alzheimer’s disease, Parkinson’s disease, craniocerebral trauma, or tumor; (4) had incomplete clinical data; (5) had incomplete imaging data; and (6) had imaging data with motion or machine artifacts. Figures 2, 3 show the flowchart summarizing participant recruitment and building radiomic models.
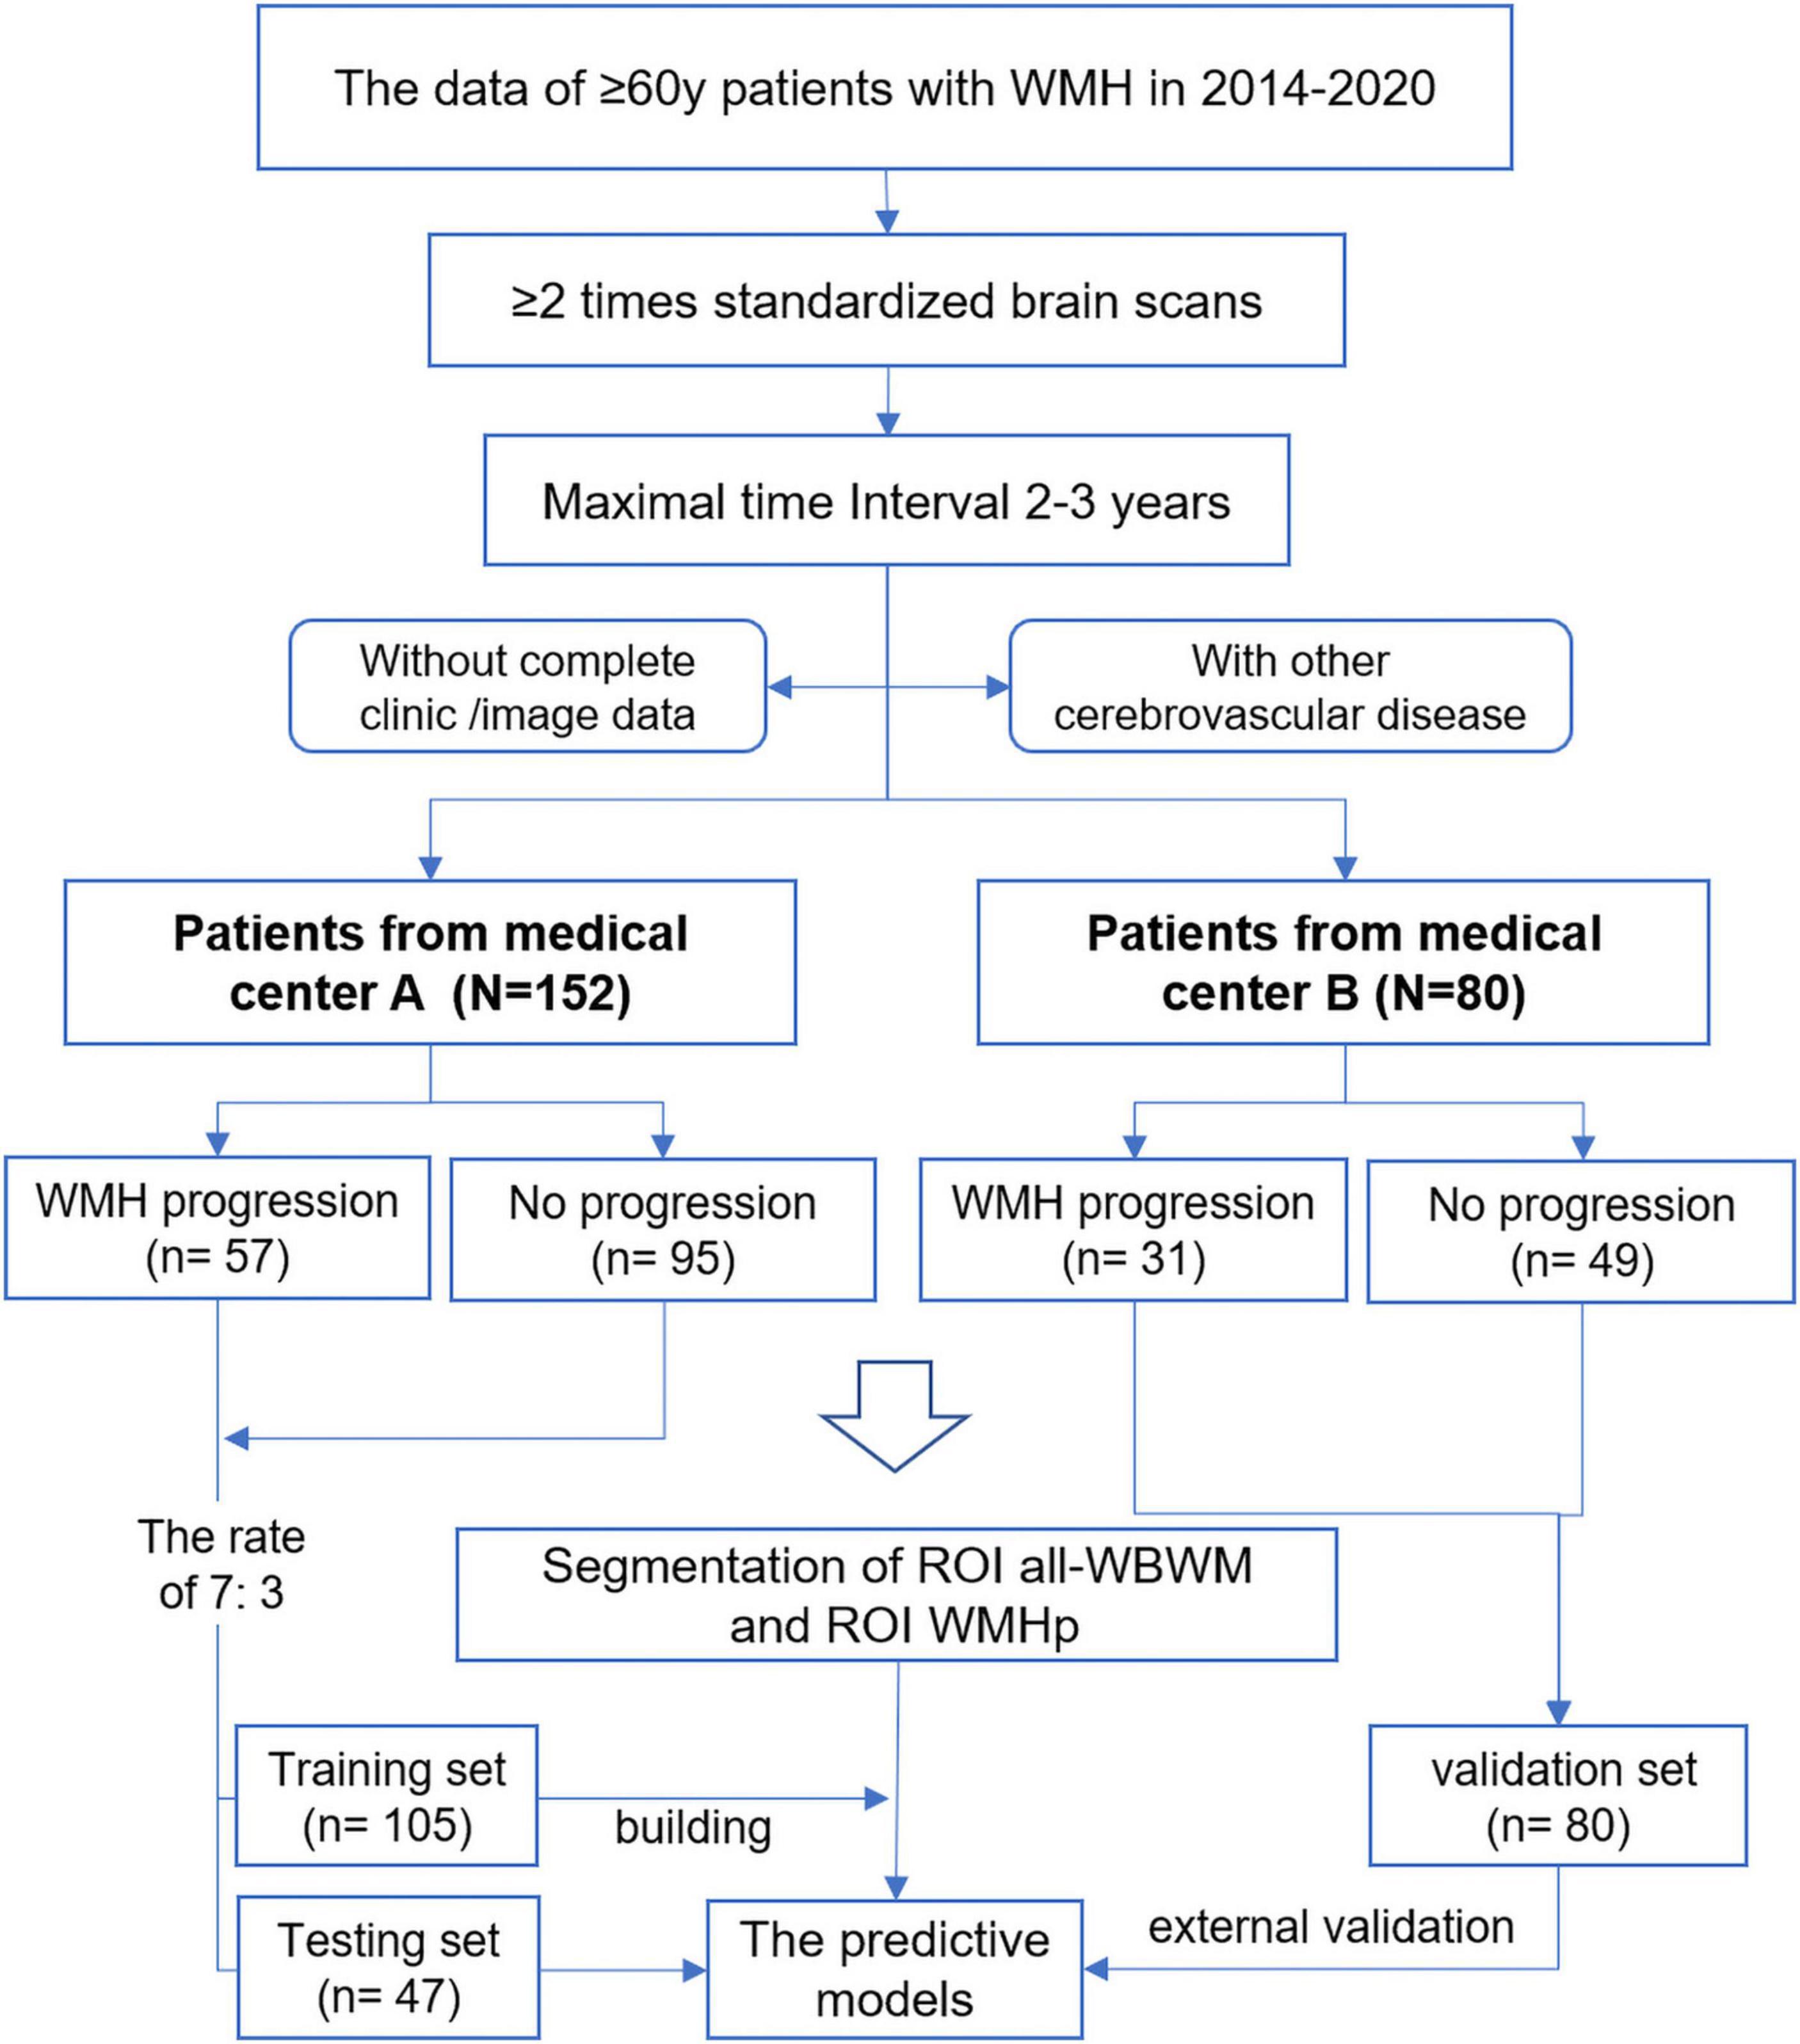
Figure 2. Flowchart of this study.
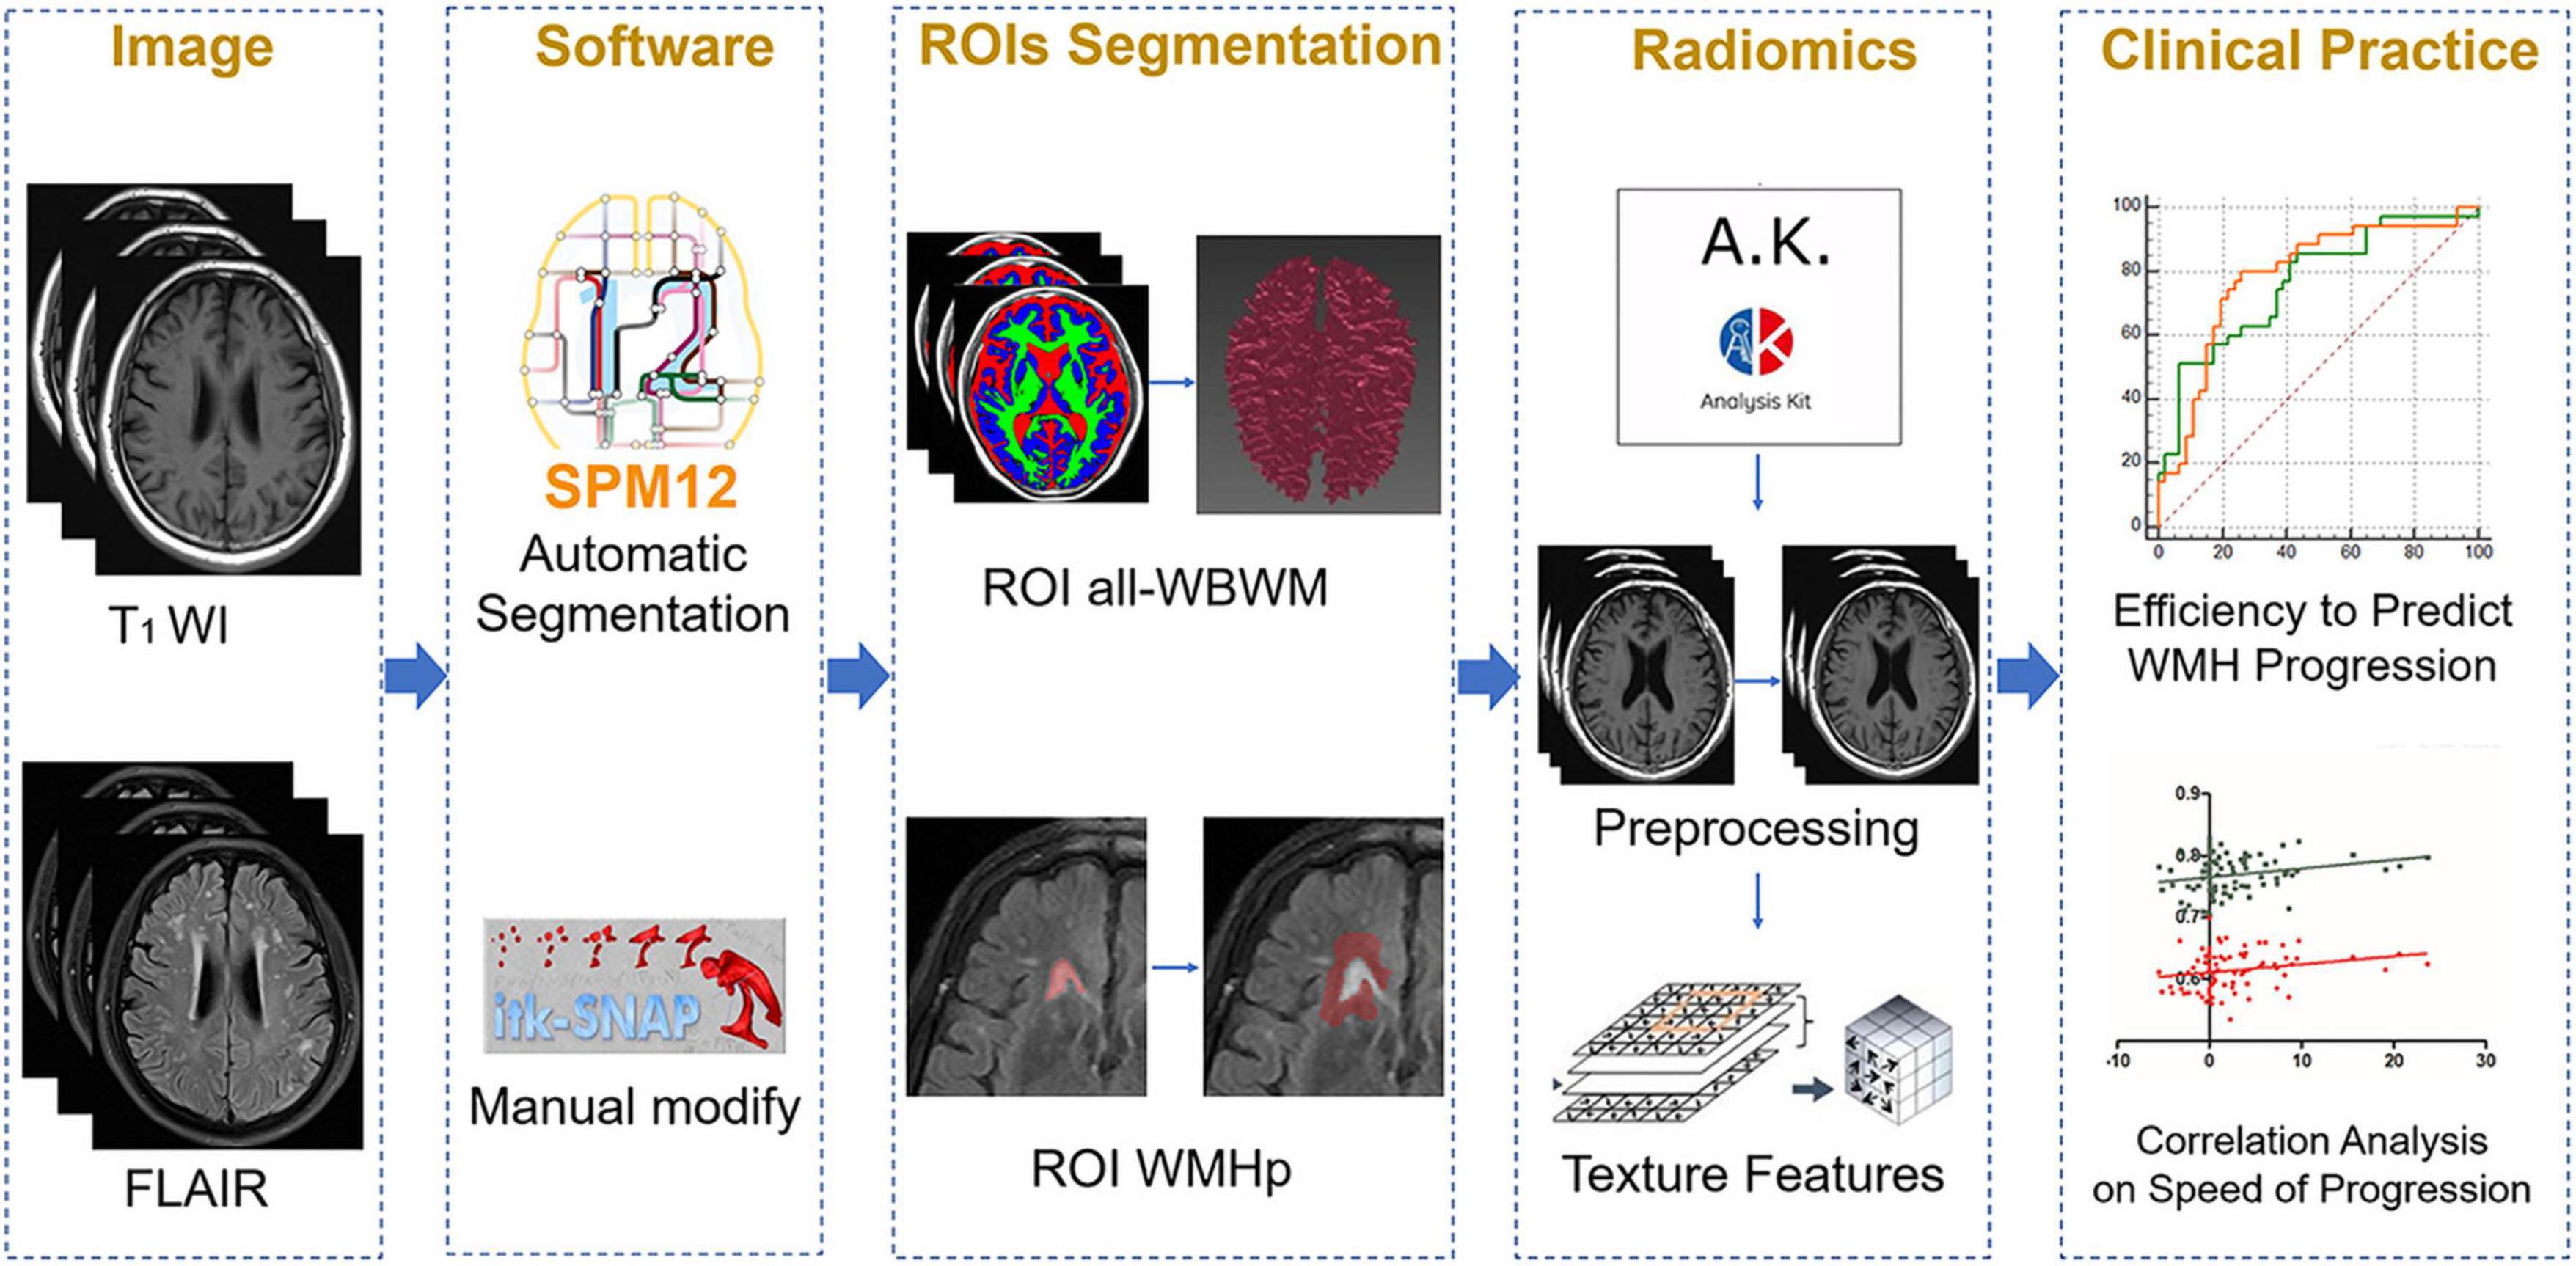
Figure 3. The overall outline of the radiomic procedure used in the current work, including image selection, region of interest (ROI) segmentation, model fitting, and clinical application.
Magnetic Resonance Imaging Acquisition
Brain MRI scans in medical centers A and B were performed using a 3.0 T MRI scanner with an eight-channel head coil (Discovery MR 750, GE Healthcare, Chicago, IL, United States). The routine sequences were as follows: axial T1WI, T2WI, FLAIR, and DWI. We used axial FLAIR to observe and segment the identified WMH based on the following parameters: TR = 9,000 ms, TE = 120 ms, field of view (FOV) = 220 mm × 220 mm, matrix = 256 × 256, and section thickness = 5 mm, and inter-slice gap = 1.5 mm. We used T1WI for segmenting the white matter with TR = 1,750 ms, TE = 24 ms, FOV = 220 mm × 220 mm, section thickness = 5 mm, and inter-slice gap = 1.5 mm. T2WI: TR = 9,823 ms, TE = 101 ms, FOV = 220 mm × 220 mm, section thickness = 5 mm, and inter-slice gap = 1.5 mm. DWI: TR = 3,071 ms, TE = minimum, b = 0, 1,000 s/mm2, FOV = 220 mm × 220 mm, inter-slice gap = 1.5 mm, and section thickness = 5 mm.
Image Preprocessing
All MRI scan sequences were converted to NIfTI files (.nii.gz) and preprocessed for normalization. Different imaging sequences were co-registered to the same anatomical template; then, they were interpolated to the same resolution (1 mm × 1 mm × 1 mm) and skull-stripped (Rohlfing et al., 2010; Bakas et al., 2017). The noise in the images was reduced using Gaussian filtering; then, for reducing external interference factors, magnetic field migration correction was performed. Then, by downsampling each image into 32 bins, the image grayscale intensity level was discretized and normalized for noise reduction. Given these fixed bins values and numbers, the grayscale range of the image is divided into equally spaced intervals. Thus, the grayscale values reflected the size and intensity resolution of the discretized bins (i.e., there are four sized bins per grayscale).
Segmentation of Region of Interests
Region of Interest Whole-Brain White Matter
After spatially normalizing the MRI images to a universal coordinate system, the gray matter, white matter, and cerebrospinal fluid (GM/WM/CSF) of the whole brain were automatically segmented in T1WI using the Statistical Parametric Maps 12 (SPM12) toolbox.1 The automatically segmented WM was treated as the ROI WBWM.
Region of Interest White Matter Hyperintensity Penumbra
The WMH was segmented automatically using FLAIR and T1WI. Maillard et al. (2014) defined the WMH penumbra as the 5 mm area surrounding the WMH. We used the AGK software (Artificial-Intelligent Radio-Genomics Kits; GE Healthcare, Chicago, IL, United States) to automatically expand the WMH region by 5 mm. Then, the sulcus and gyrus were manually removed by two experienced neuroradiologists using the ITK-SNAP software.2 Supplementary Figure 1 shows a diagram describing this ROI segmentation approach. All segmentations were visually checked for segmentation errors and artifacts.
Extraction of Radiomic Features
All MRI images and ROIs were imported into the AGK software to extract radiomic features. The radiomic features were calculated, including histogram, texture, form factor, gray-level co-occurrence matrix (GLCM), run-length matrix (RLM), and gray-level size zone matrix (GLSZM). The extracted texture features were standardized, which removed the unit limits of the data of each feature and converted it into a dimensionless pure value. This allowed the indexes of different units or orders to be compared and weighted. For details, see Supplementary Materials.
Construction and Assessment of the Radiomic Models
Based on the training set, we performed analysis of variance (ANOVA) of the extracted features. For feature dimensionality reduction, the analysis of ANOVA + Mann–Whitney U-test, correlation analysis, and gradient boosting decision tree were sequentially performed. See Supplementary Materials for details. The five machine learning methods, namely Bayes, the random forest, the logistic regression, the support vector machine classifiers (SVM), and the k-nearest neighbor (KNN), were used to build models, and the best modeling method was selected through comparison. The test set, the training set, and the external verification set were used to verify the predictive efficiency, including calibration efficiency, net value, and diagnostic accuracy, which were estimated using the calibration curve, the decision curve analysis (DCA), and receiver operating characteristic (ROC) curve.
Interobserver and Intra-Observer Reproducibility
For eliminating the sulcus and gyrus, the ROI WMHp was first manually adjusted by the physician XDH. One month later, the physicians XDH and YS manually eliminated these again on 30 randomly selected subjects. The intra-observer correlation coefficient was calculated based on the first measurement of the physicians XDH and YS. The interobserver correlation coefficient was calculated based on the two measurements acquired by the physician XDH.
Statistical Analysis
We performed our statistical analyses using SPSS 20.0 (IBM, Chicago, IL, United States). Comparisons of clinical and imaging characteristics were performed using a T-test, Mann–Whitney U-test, or chi-square test. Moreover, we performed univariate logistic regression analyses on each potential predictor variable associated with WMH progression, including age, sex, imaging factors, and vascular risk factors. Thereafter, to construct combined prediction models, factors with marginal significance (P < 0.1) in univariate logistic regression were included in multivariable logistic regression. The pairwise correlation among clinical features, the radiomic score (rad-score), and the speed of WMH progression were calculated using the Spearman’s analysis. The values of P ≤ 0.05 were considered to indicate statistical significance.
Results
Demographic and Clinical Characteristics
Table 1 shows the imaging features and demographic characteristics of the participants. In Medical Center A, the median age of patients with WMH progression was significantly higher than for those without WMH progression (74 years vs. 68 years, P = 0.004). In Medical Center B, the average age of patients was higher in the WMH progression group than in the non-progression group; however, the difference was not statistically significant (73.52 years vs. 71.65 years, P = 0.327). In both medical centers, the difference in the volume and speed of WMH progression was statistically significant between the two groups (all P < 0.05). We found no significant difference in imaging features and demographic characteristics between medical centers A and B (all P > 0.05).
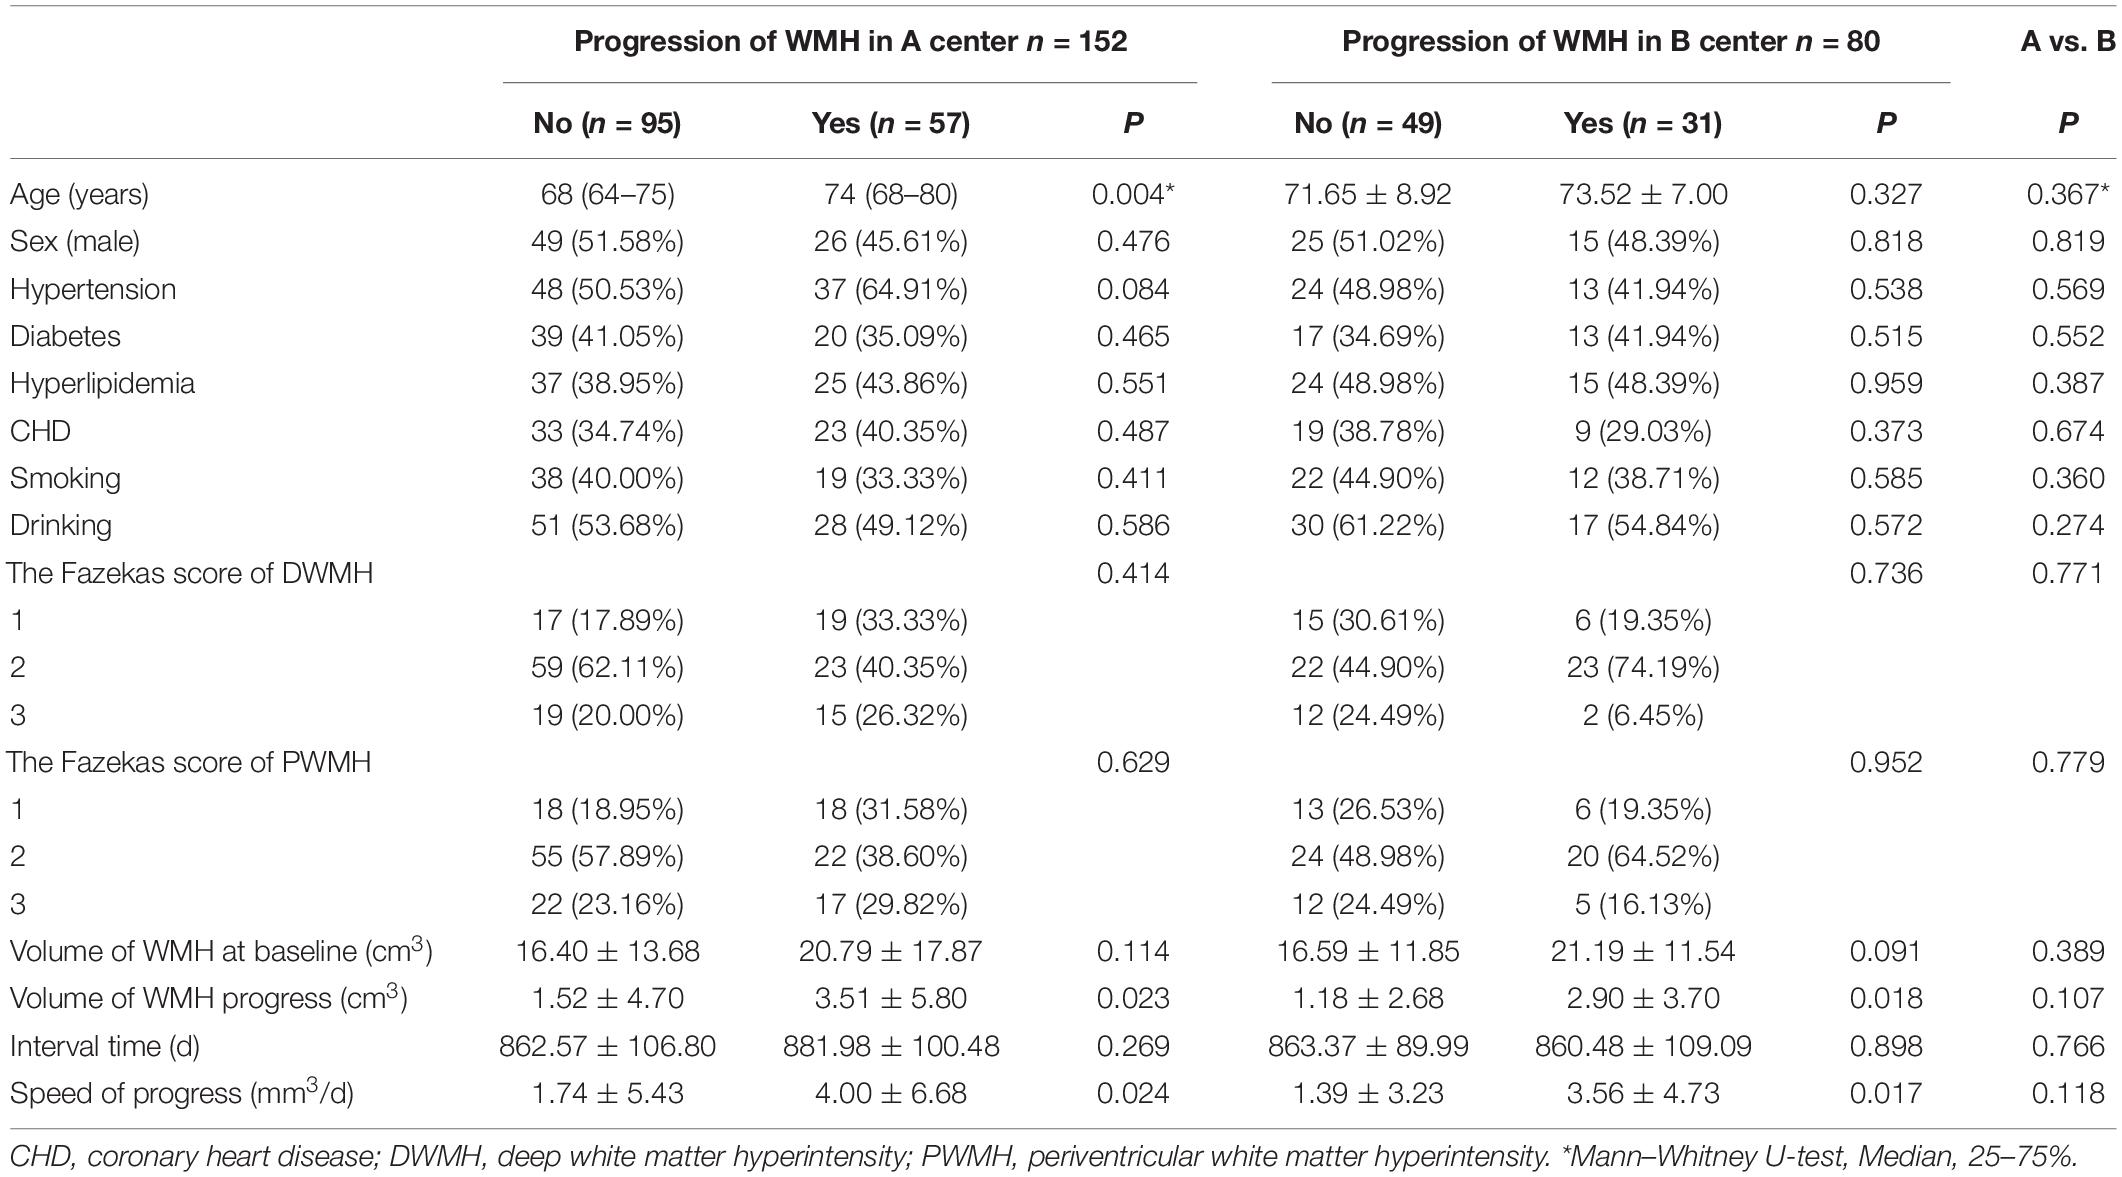
Table 1. The demographic characteristics and imaging features of the participants in medical centers A and B.
Building Radiomic Models to Predict White Matter Hyperintensity Progression
For constructing radiomic models after feature dimensionality reduction, the optimal features were selected, including 12 features in the ROI WMHp and 7 features in the ROI WBWM. The area under the curve (AUC) value was higher for the logistic regression model than for other machine learning methods. In line with this finding, the models were built using the logistic regression classifier (Figure 4). The rad-score was calculated using the formula for the features. The rad-score was found to be significantly different between the progression and non-progression groups in two ROIs (all P < 0.05; Table 2). Additional information about the formulas is shown in the Supplementary Material. The predictive efficacies (represented as the AUC) of the ROI WBWM were 0.725, 0.693, and 0.691 for the training group, testing group, and external validation group, respectively. Similarly, the predictive efficacies of the ROI WMHp were 0.791, 0.768, and 0.767 for the training group, testing group, and external validation group, respectively. Figures 5–7 show the diagnostic accuracy, the calibration efficiency, and the net value of models, which were evaluated using the ROC, the Hosmer–Lemeshow test, and DCA, respectively.
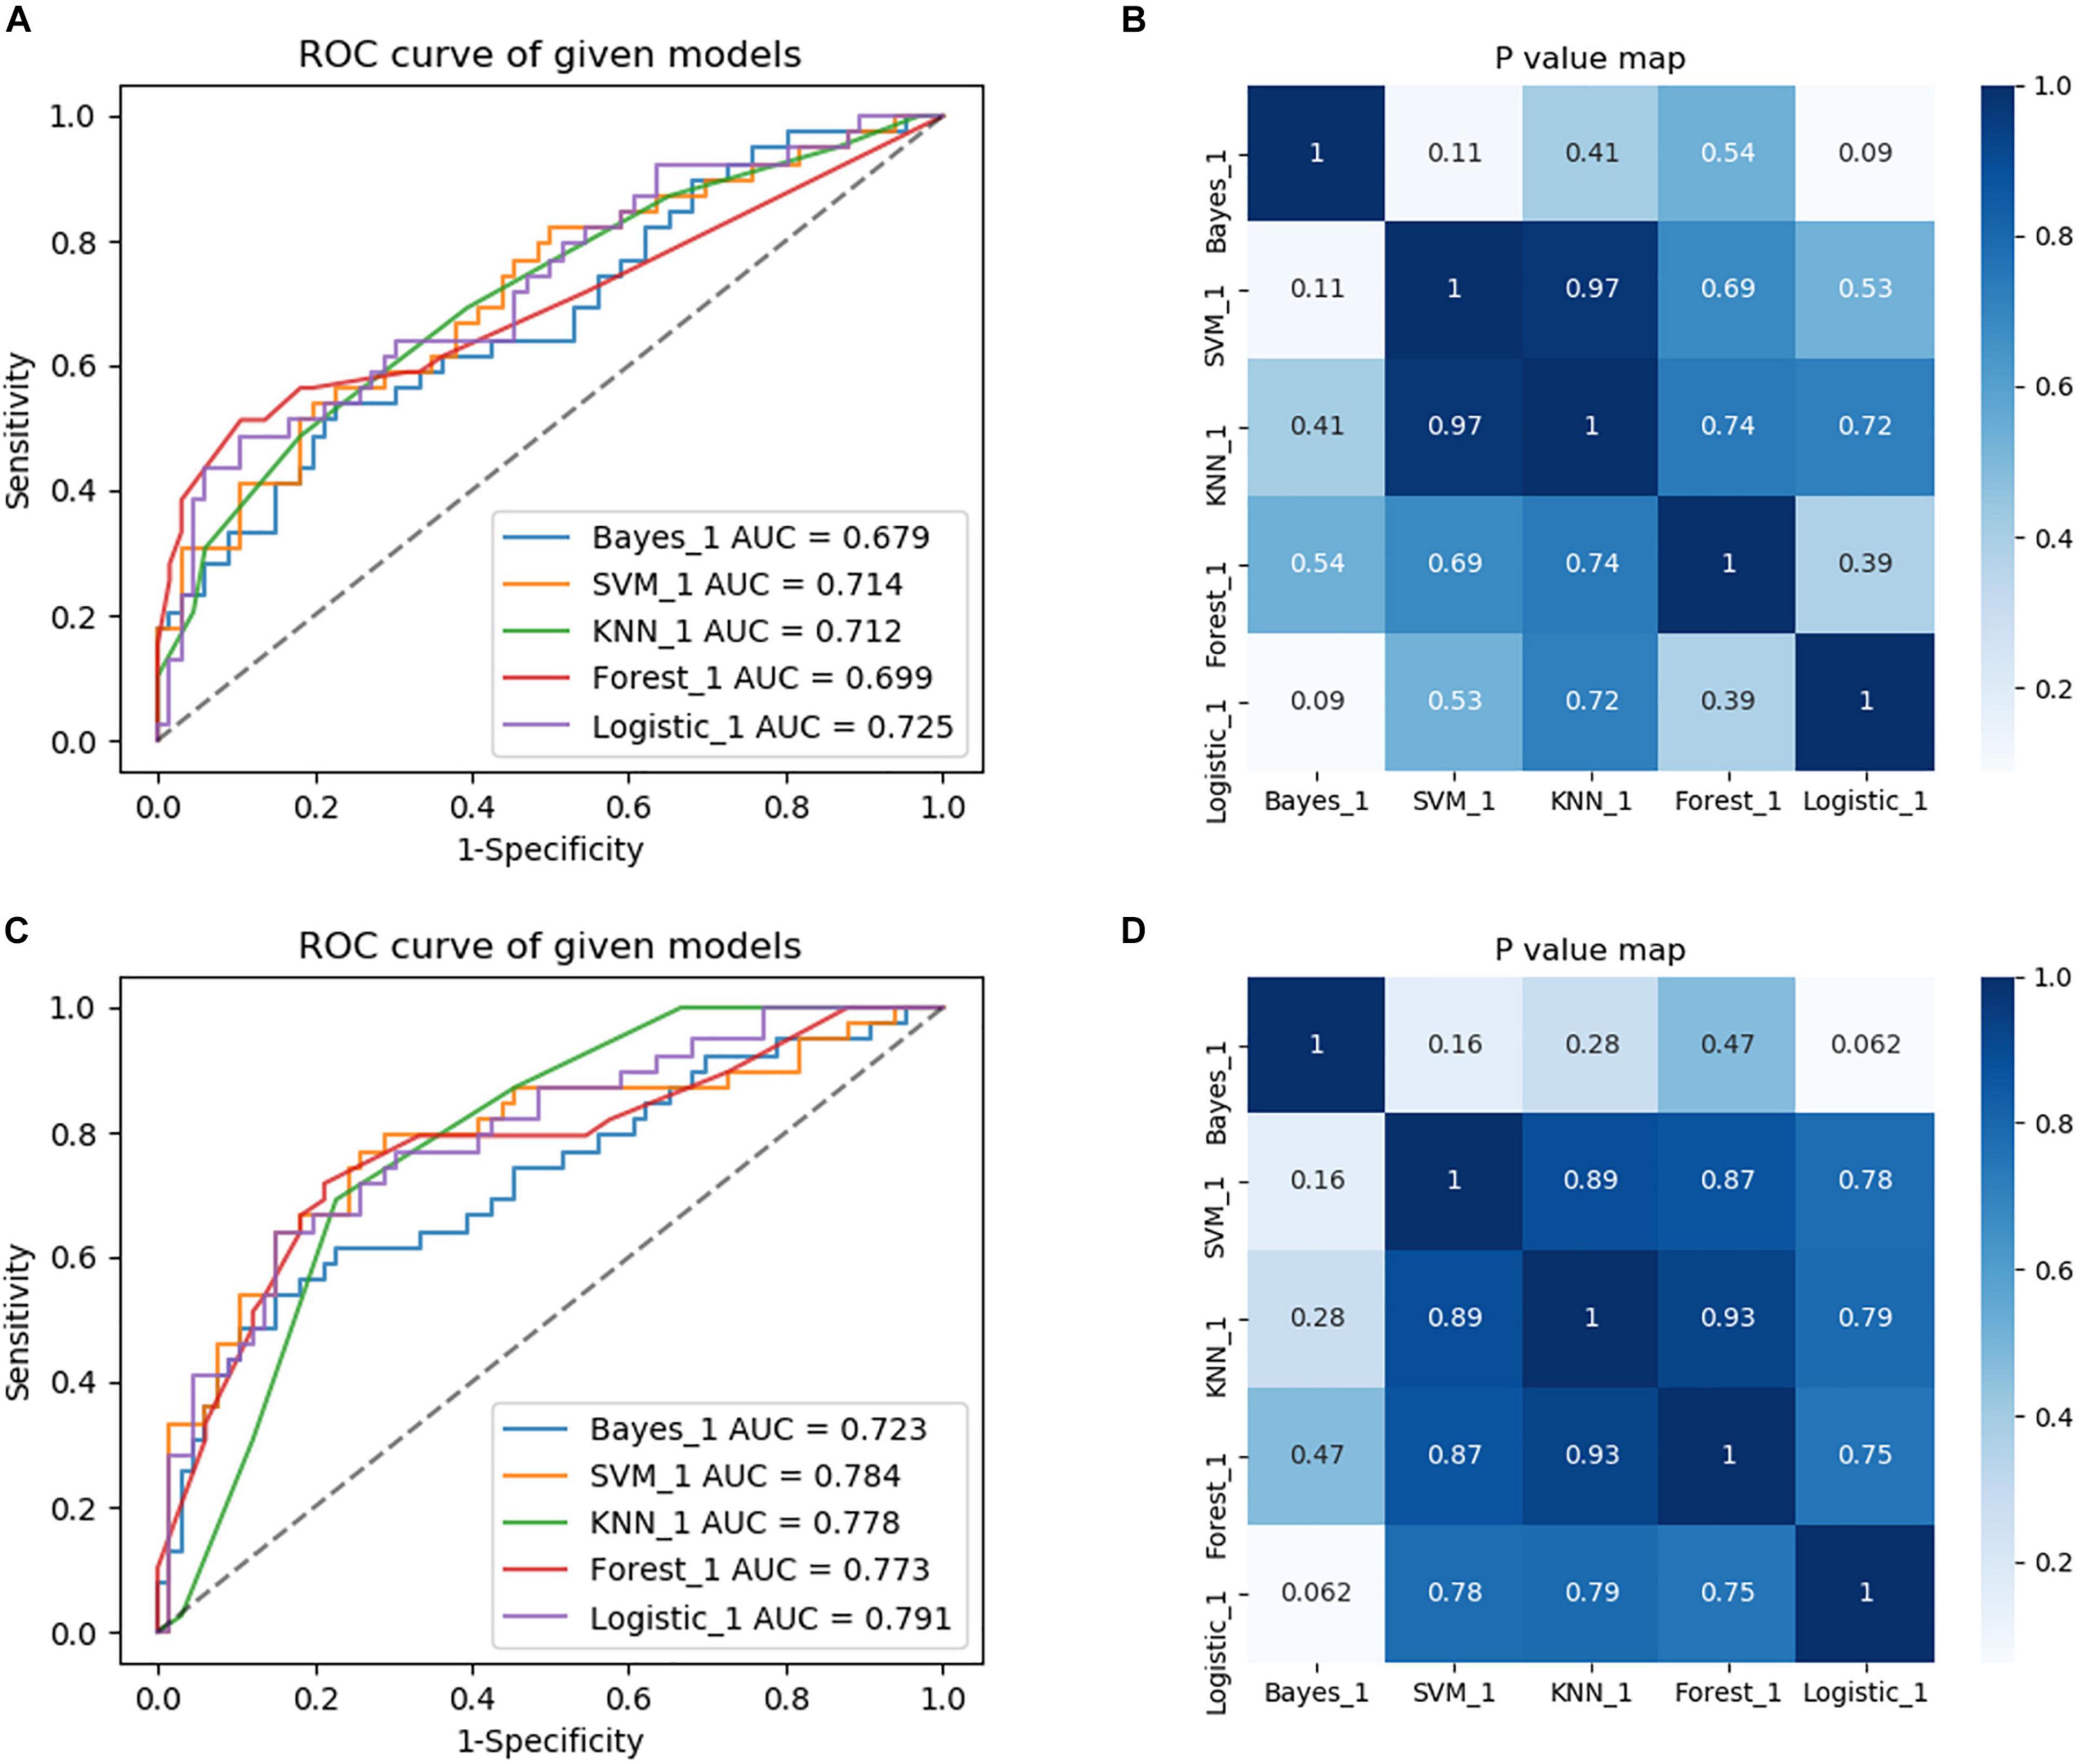
Figure 4. Comparison of diagnostic performance of five machine learning approaches and selection of the best machine learning approach to build models. (A) The region of interest (ROC) curves of the five machine learning methods in the training group of the ROI whole-brain white matter (WBWM). (B) A heatmap of P-values comparing diagnostic performance for five machine learning approaches in the ROI WBWM. (C) The ROC curves of the five machine learning methods in the training group of the ROI WMH penumbra (WMHp). (D) A heatmap of P-values comparing diagnostic performance for five machine learning approaches in ROI WMHp.
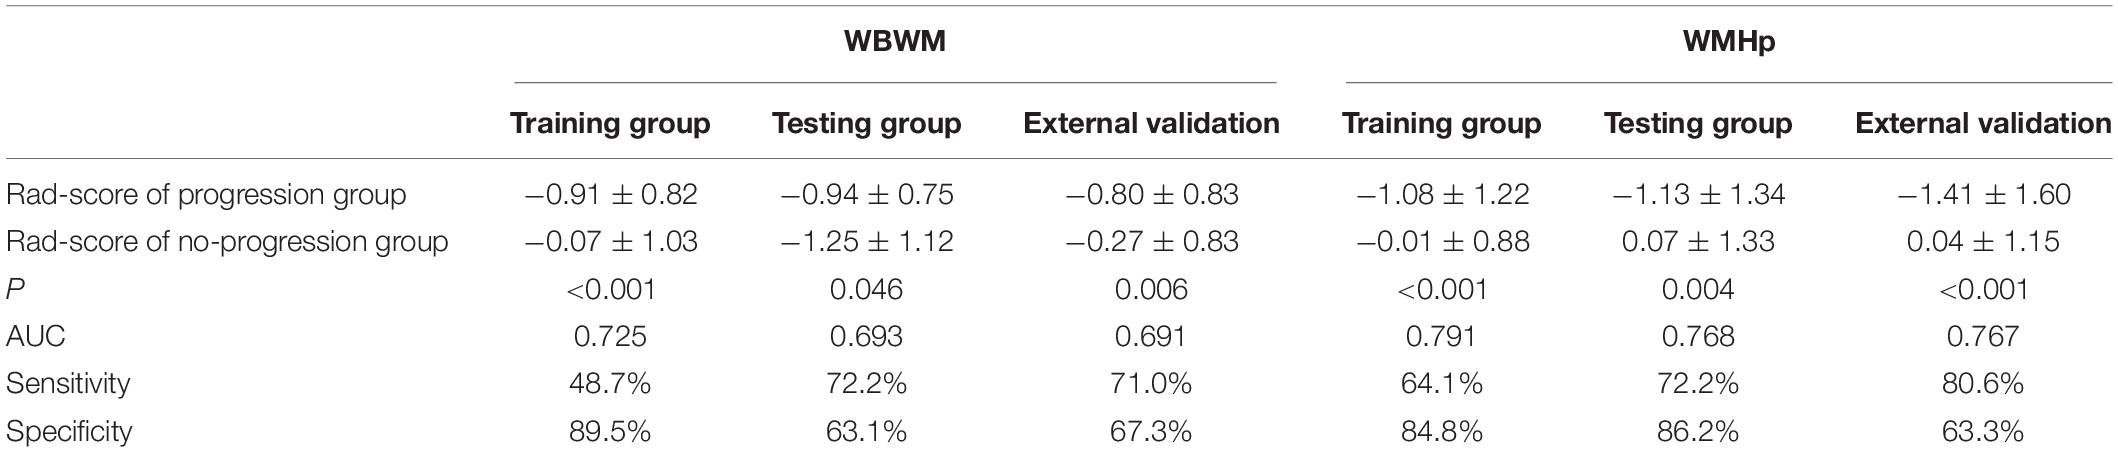
Table 2. Diagnostic accuracy of the rad-score in the training group, testing group, and external validation group.
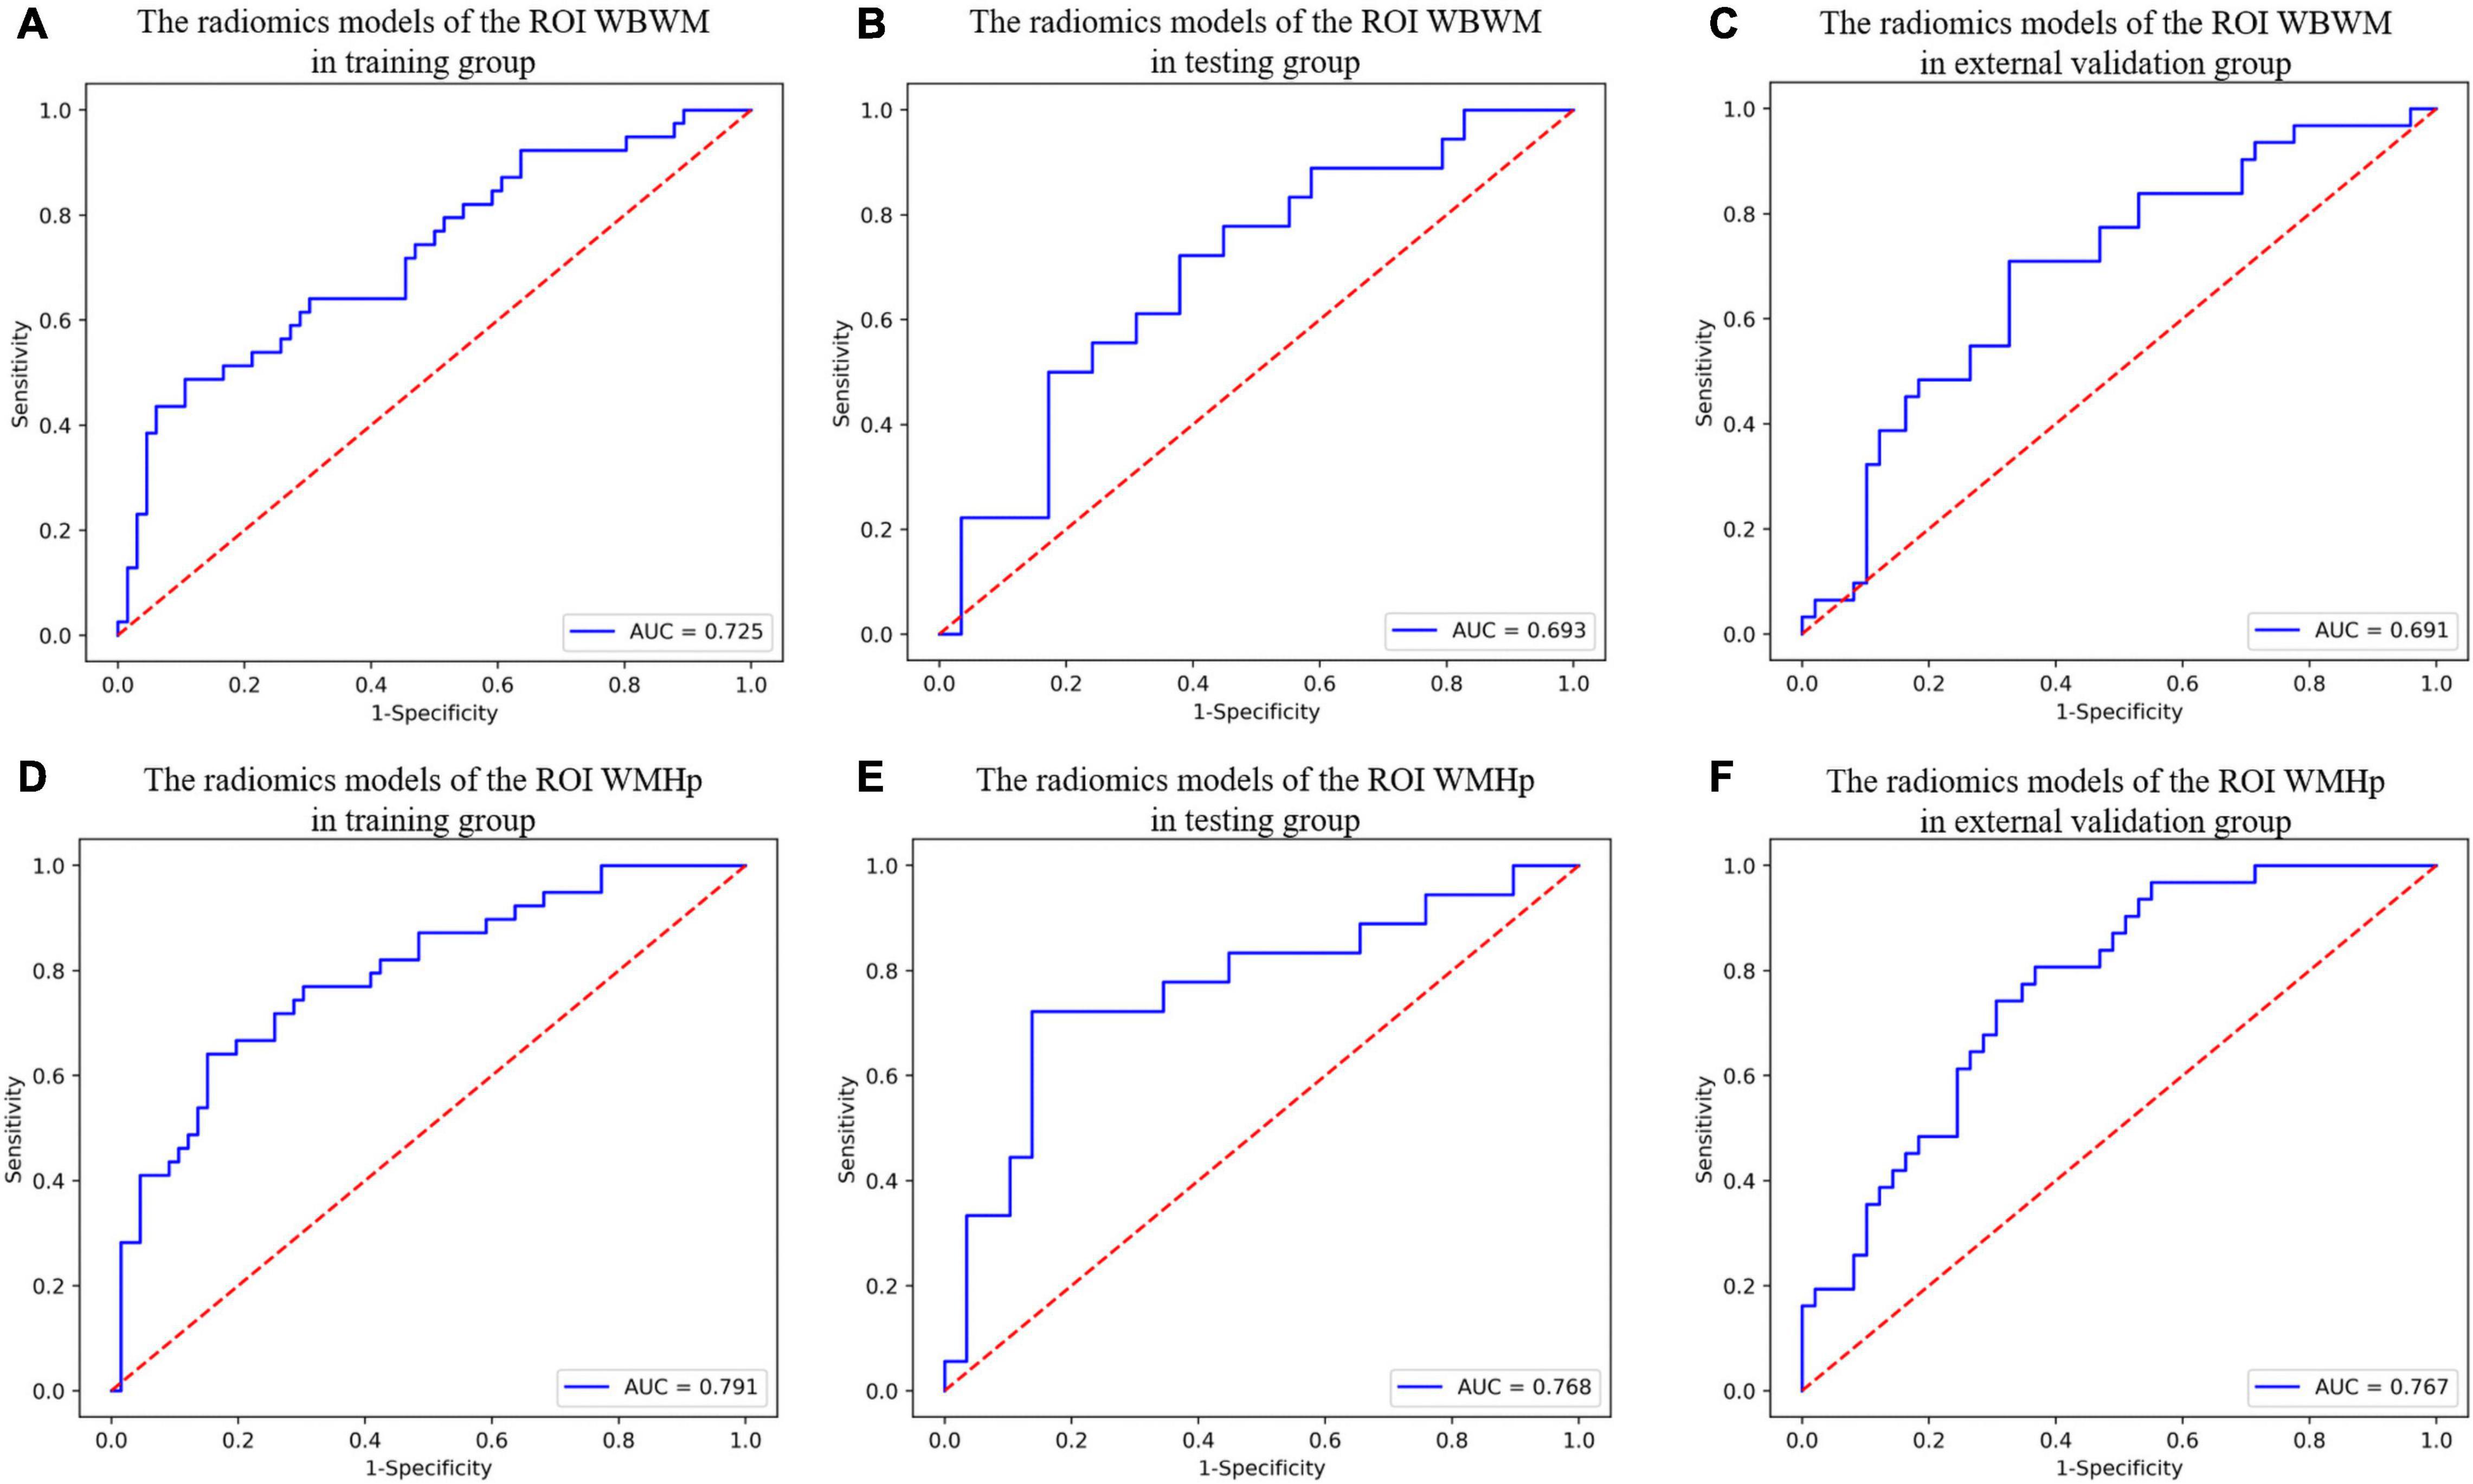
Figure 5. The diagnostic accuracy of radiomic models in different groups of two regions of interests (ROIs). (A–C) The ROC curves of the radiomic models of the ROI whole-brain white matter (WBWM) in the training group, testing group, and external validation group, respectively. (D–F) The ROC curves of the radiomic models of the ROI WMH penumbra (WMHp) in the training group, testing group, and external validation group, respectively.
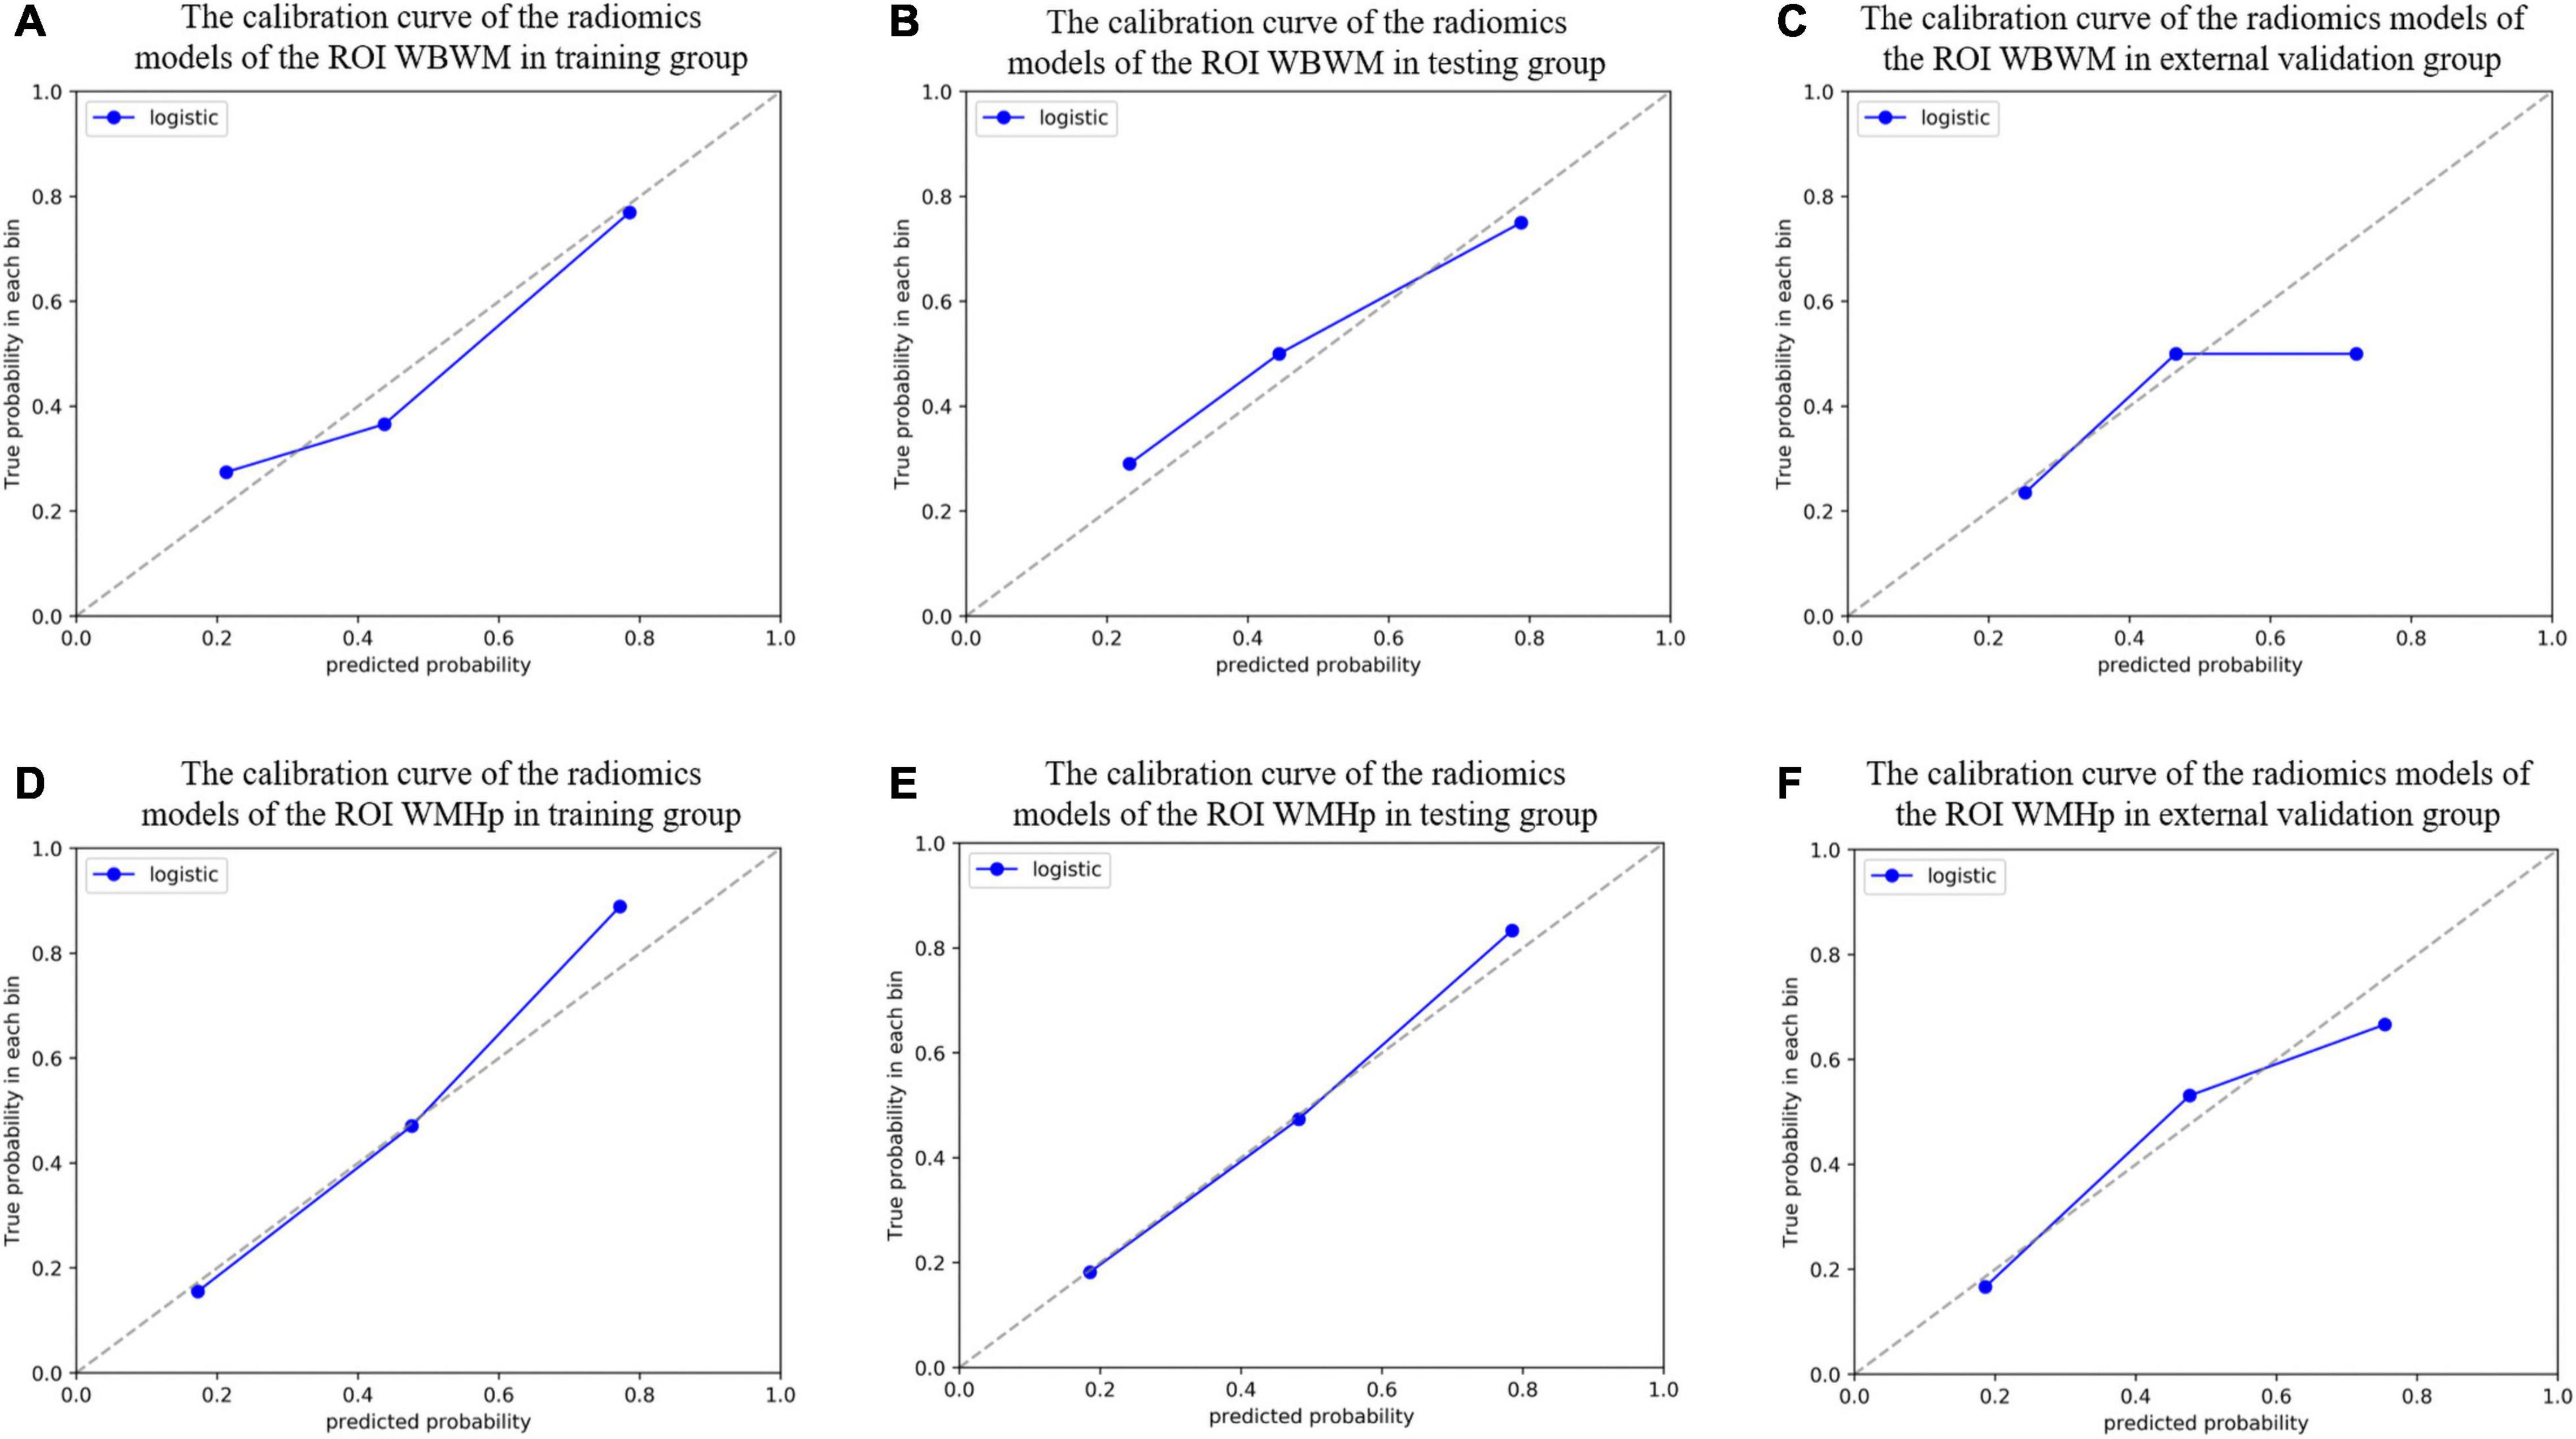
Figure 6. The calibration curve was used to describe the goodness-of-fit of radiomic models in different groups of two regions of interests (ROIs). (A–C) The radiomic models of the ROI whole-brain white matter (WBWM) in the training group, testing group, and external validation group, respectively. (D–F) The radiomic models of the ROI WMH penumbra (WMHp) in the training group, testing group, and external validation group, respectively. The Hosmer–Lemeshow test revealed good goodness-of-fit of all models (all P > 0.05).
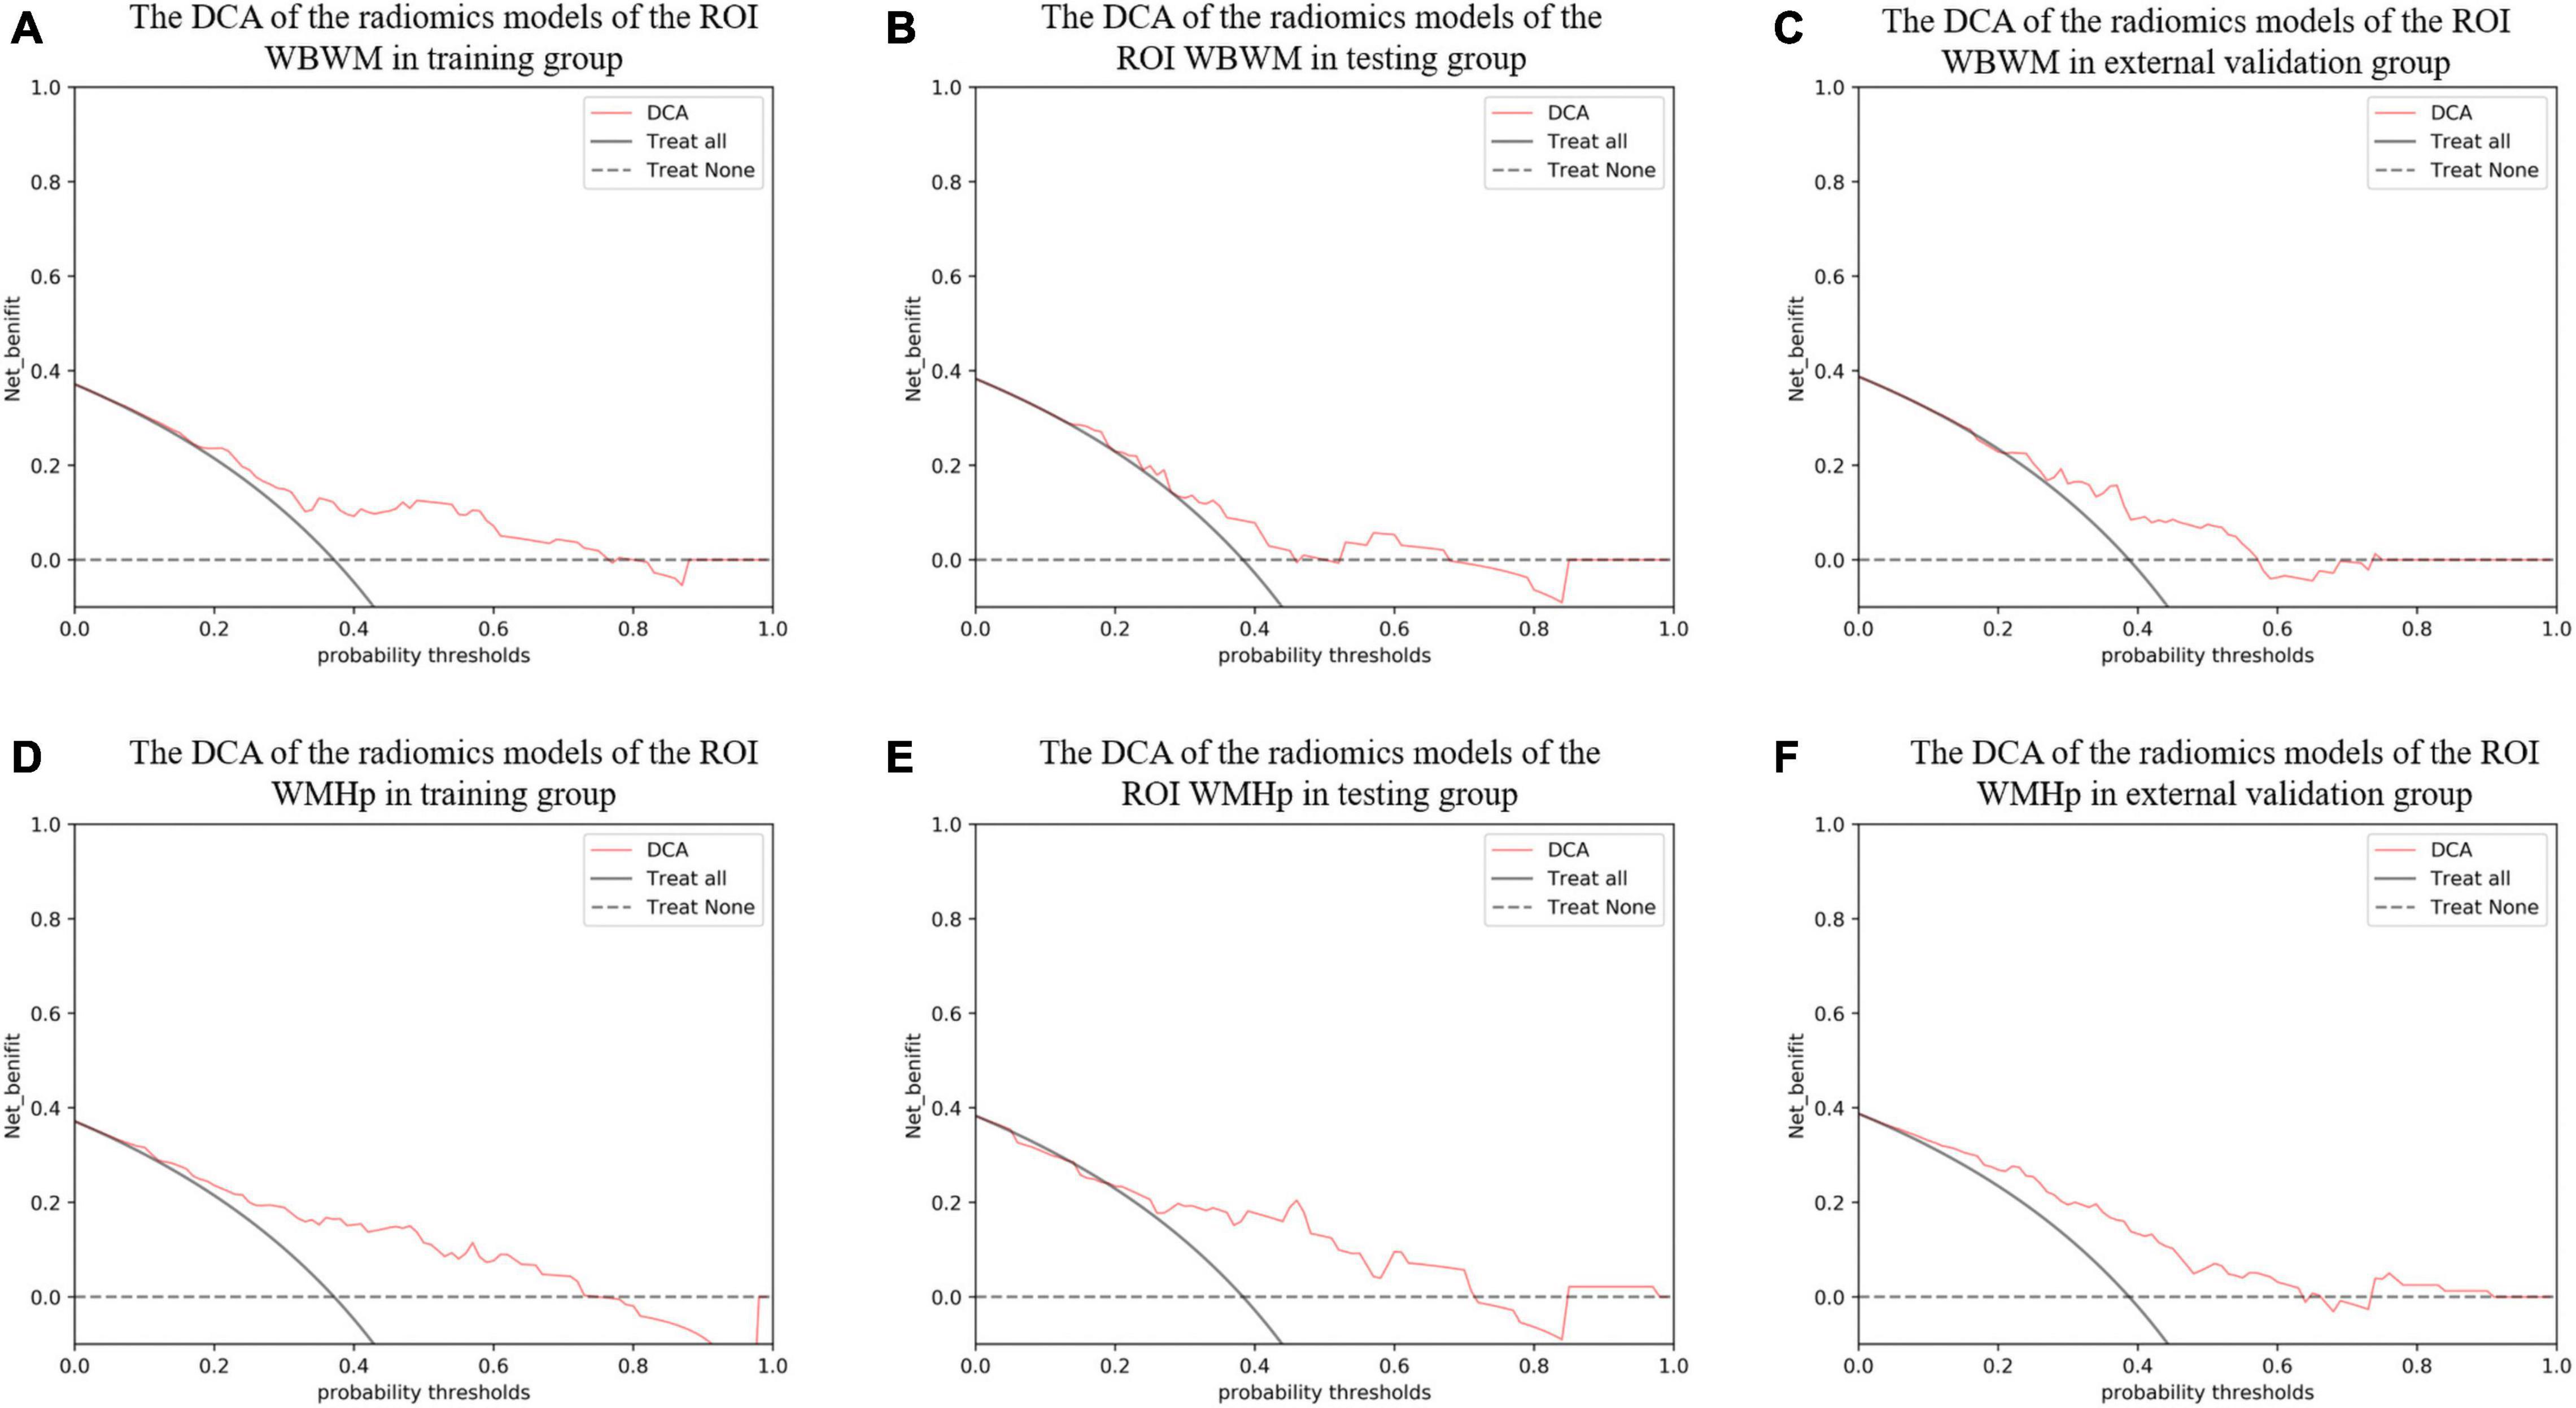
Figure 7. The decision curve analysis (DCA) curve was used to describe the net value of radiomic models in different groups of two regions of interests (ROIs). The Y-axis represents the net benefit. The pink line represents the radiomic model. The solid black line represents the hypothesis that all patients have white matter hyperintensity (WMH) progression. The black dotted line represents the hypothesis that no patients have WMH progression. The X-axis represents the threshold probability. The threshold probability is where the expected benefit of a treatment is equal to the expected benefit of avoiding the treatment. (A–C) The DCA of the radiomic models of the ROI whole-brain white matter (WBWM) in the training group, testing group, and external validation group, respectively. (D–F) The DCA of the radiomic models of the ROI WMH penumbra (WMHp) in the training group, testing group, and external validation group, respectively.
Building Combined Models to Predict White Matter Hyperintensity Progression
After stepwise logistic regression analysis, age, hypertension, and the rad-score of the ROI WBWM were the independent factors of WMH progression (Table 3). We used these factors to construct the combined model in WBWM. The AUCs were 0.779, 0.716, and 0.673 in the training group, testing group, and external validation group, respectively (Table 4). In addition, the combined model in WBWM was constructed using the age and the rad-score of the ROI WMHp (Table 3). The AUCs were 0.793, 0.774, and 0.777 in the training group, testing group, and external validation group, respectively (Table 4).
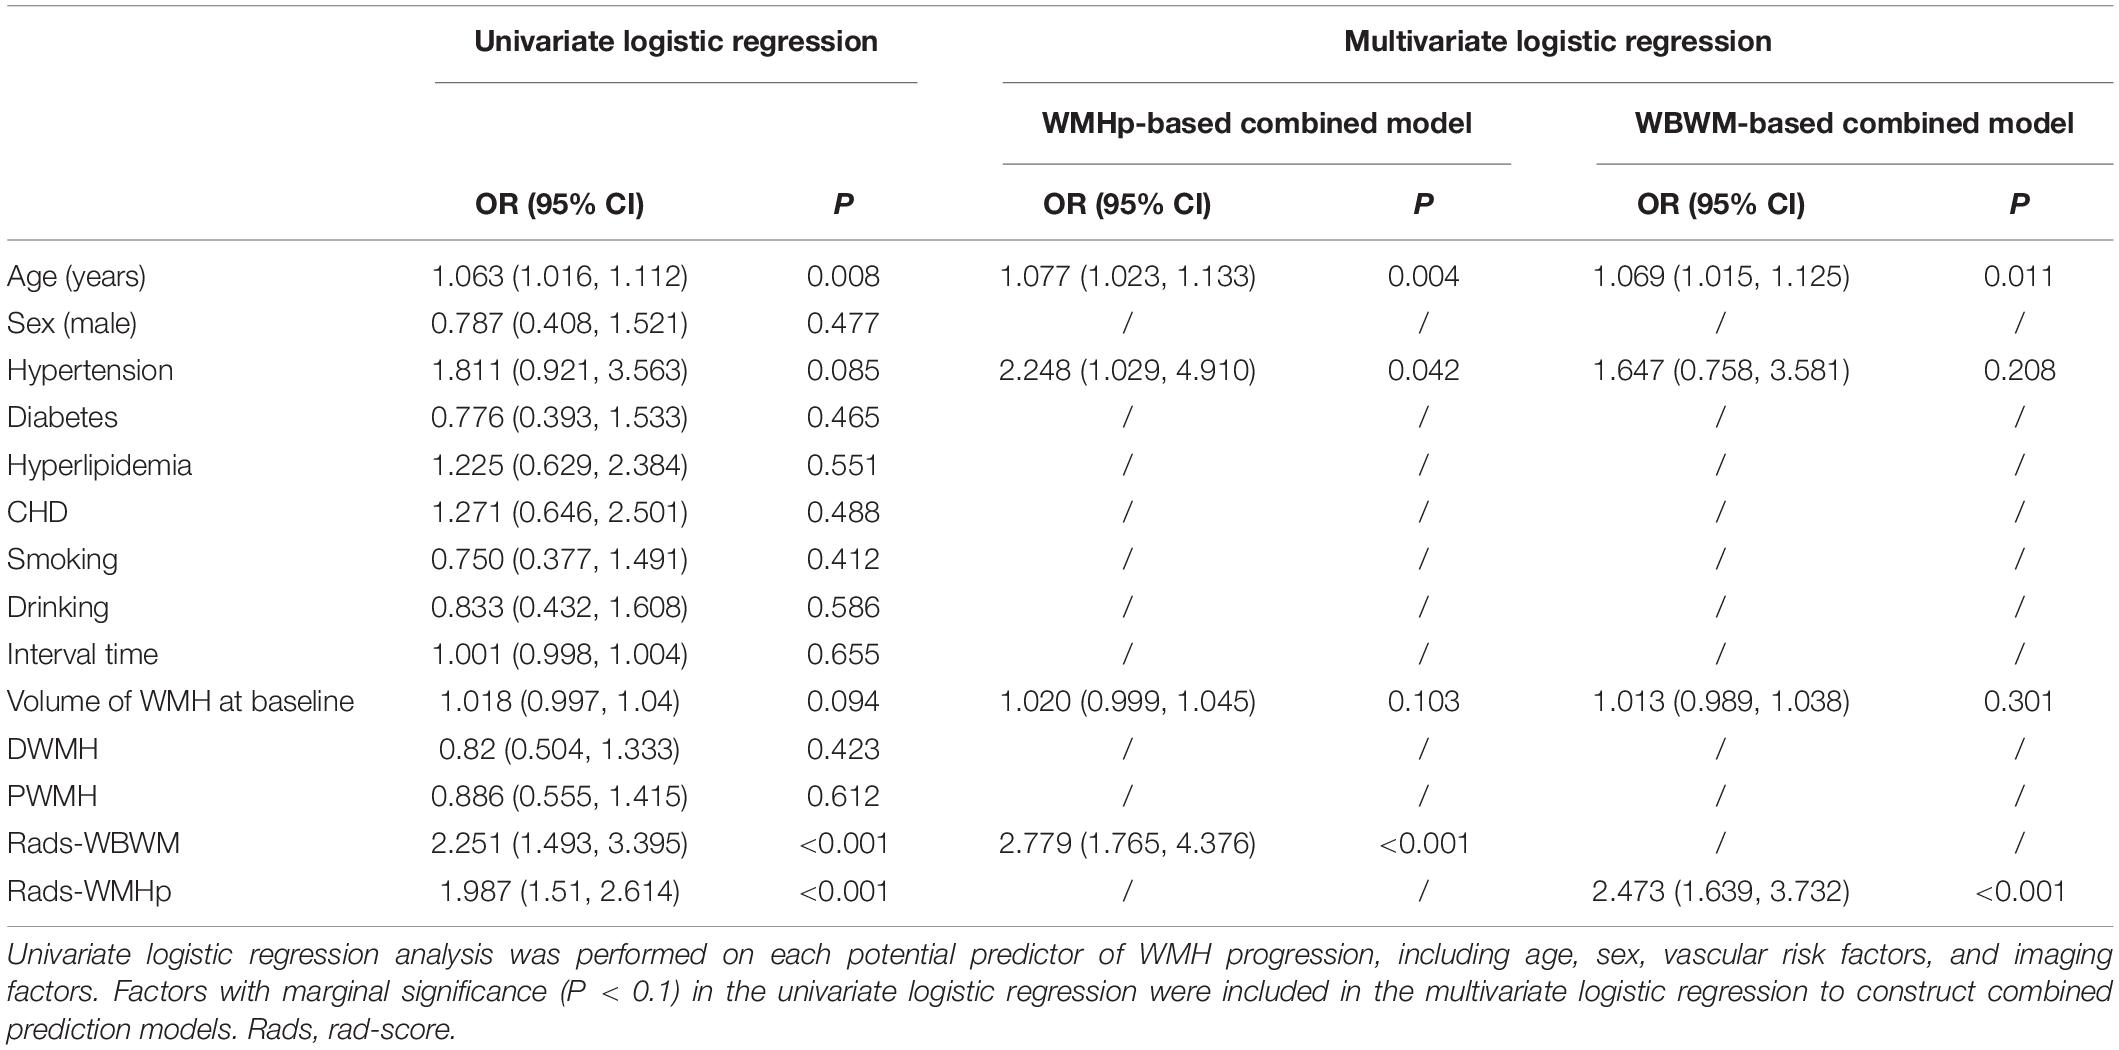
Table 3. Stepwise logistic regression analysis was performed to construct combined clinical and imaging models for predicting WMH progression.
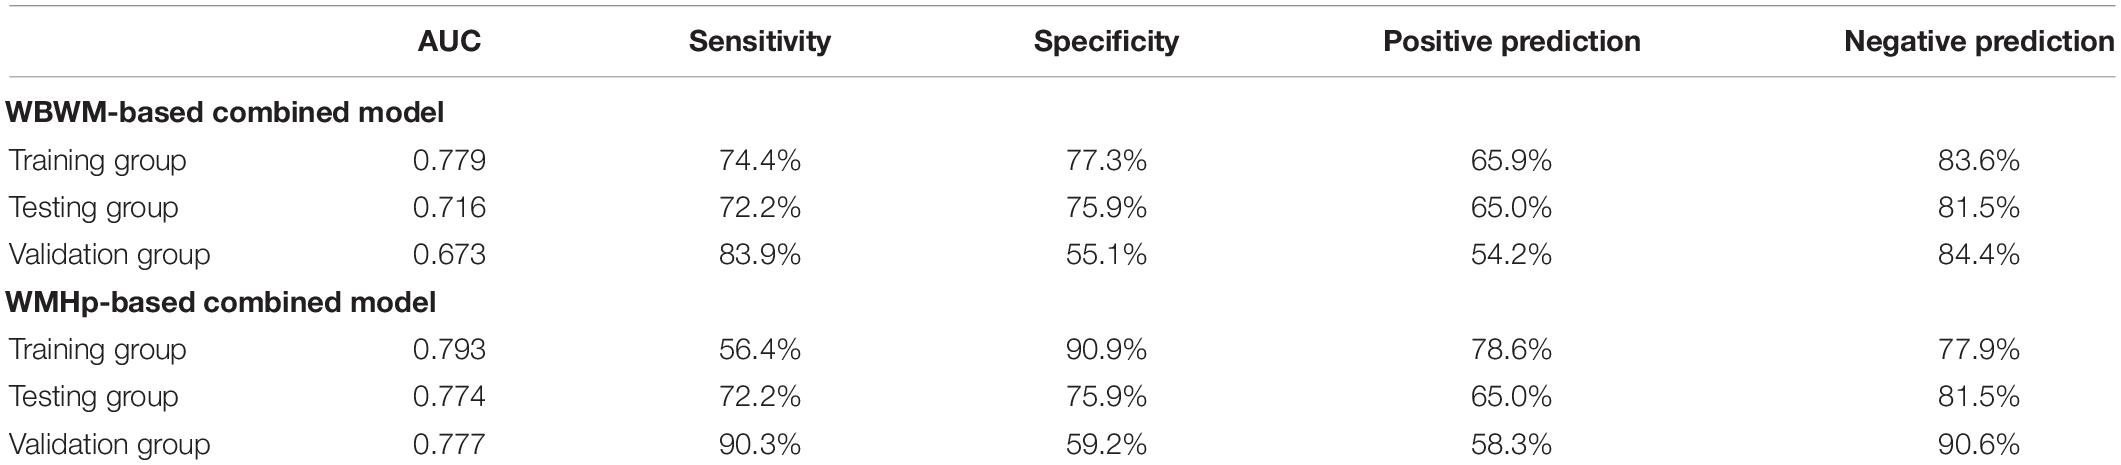
Table 4. The predictive efficacy of two joint models in training group, testing group, and validation group.
The Pairwise Correlation Among Clinical Risk Factors, Rad-Score, and Speed of Progression
The speed of WMH progression was positively correlated with the rad-score from the ROI WMHp and age (r = 0.49 and r = 0.15, respectively). In addition, in our sample, we found a weak correlation between hypertension and coronary heart disease, hypertension and diabetes, and hyperlipidemia and smoking (r = 0.14, r = 0.16, and r = 0.18, respectively). Women were more likely to develop diabetes than men (r = −0.16), as shown in Figure 8.
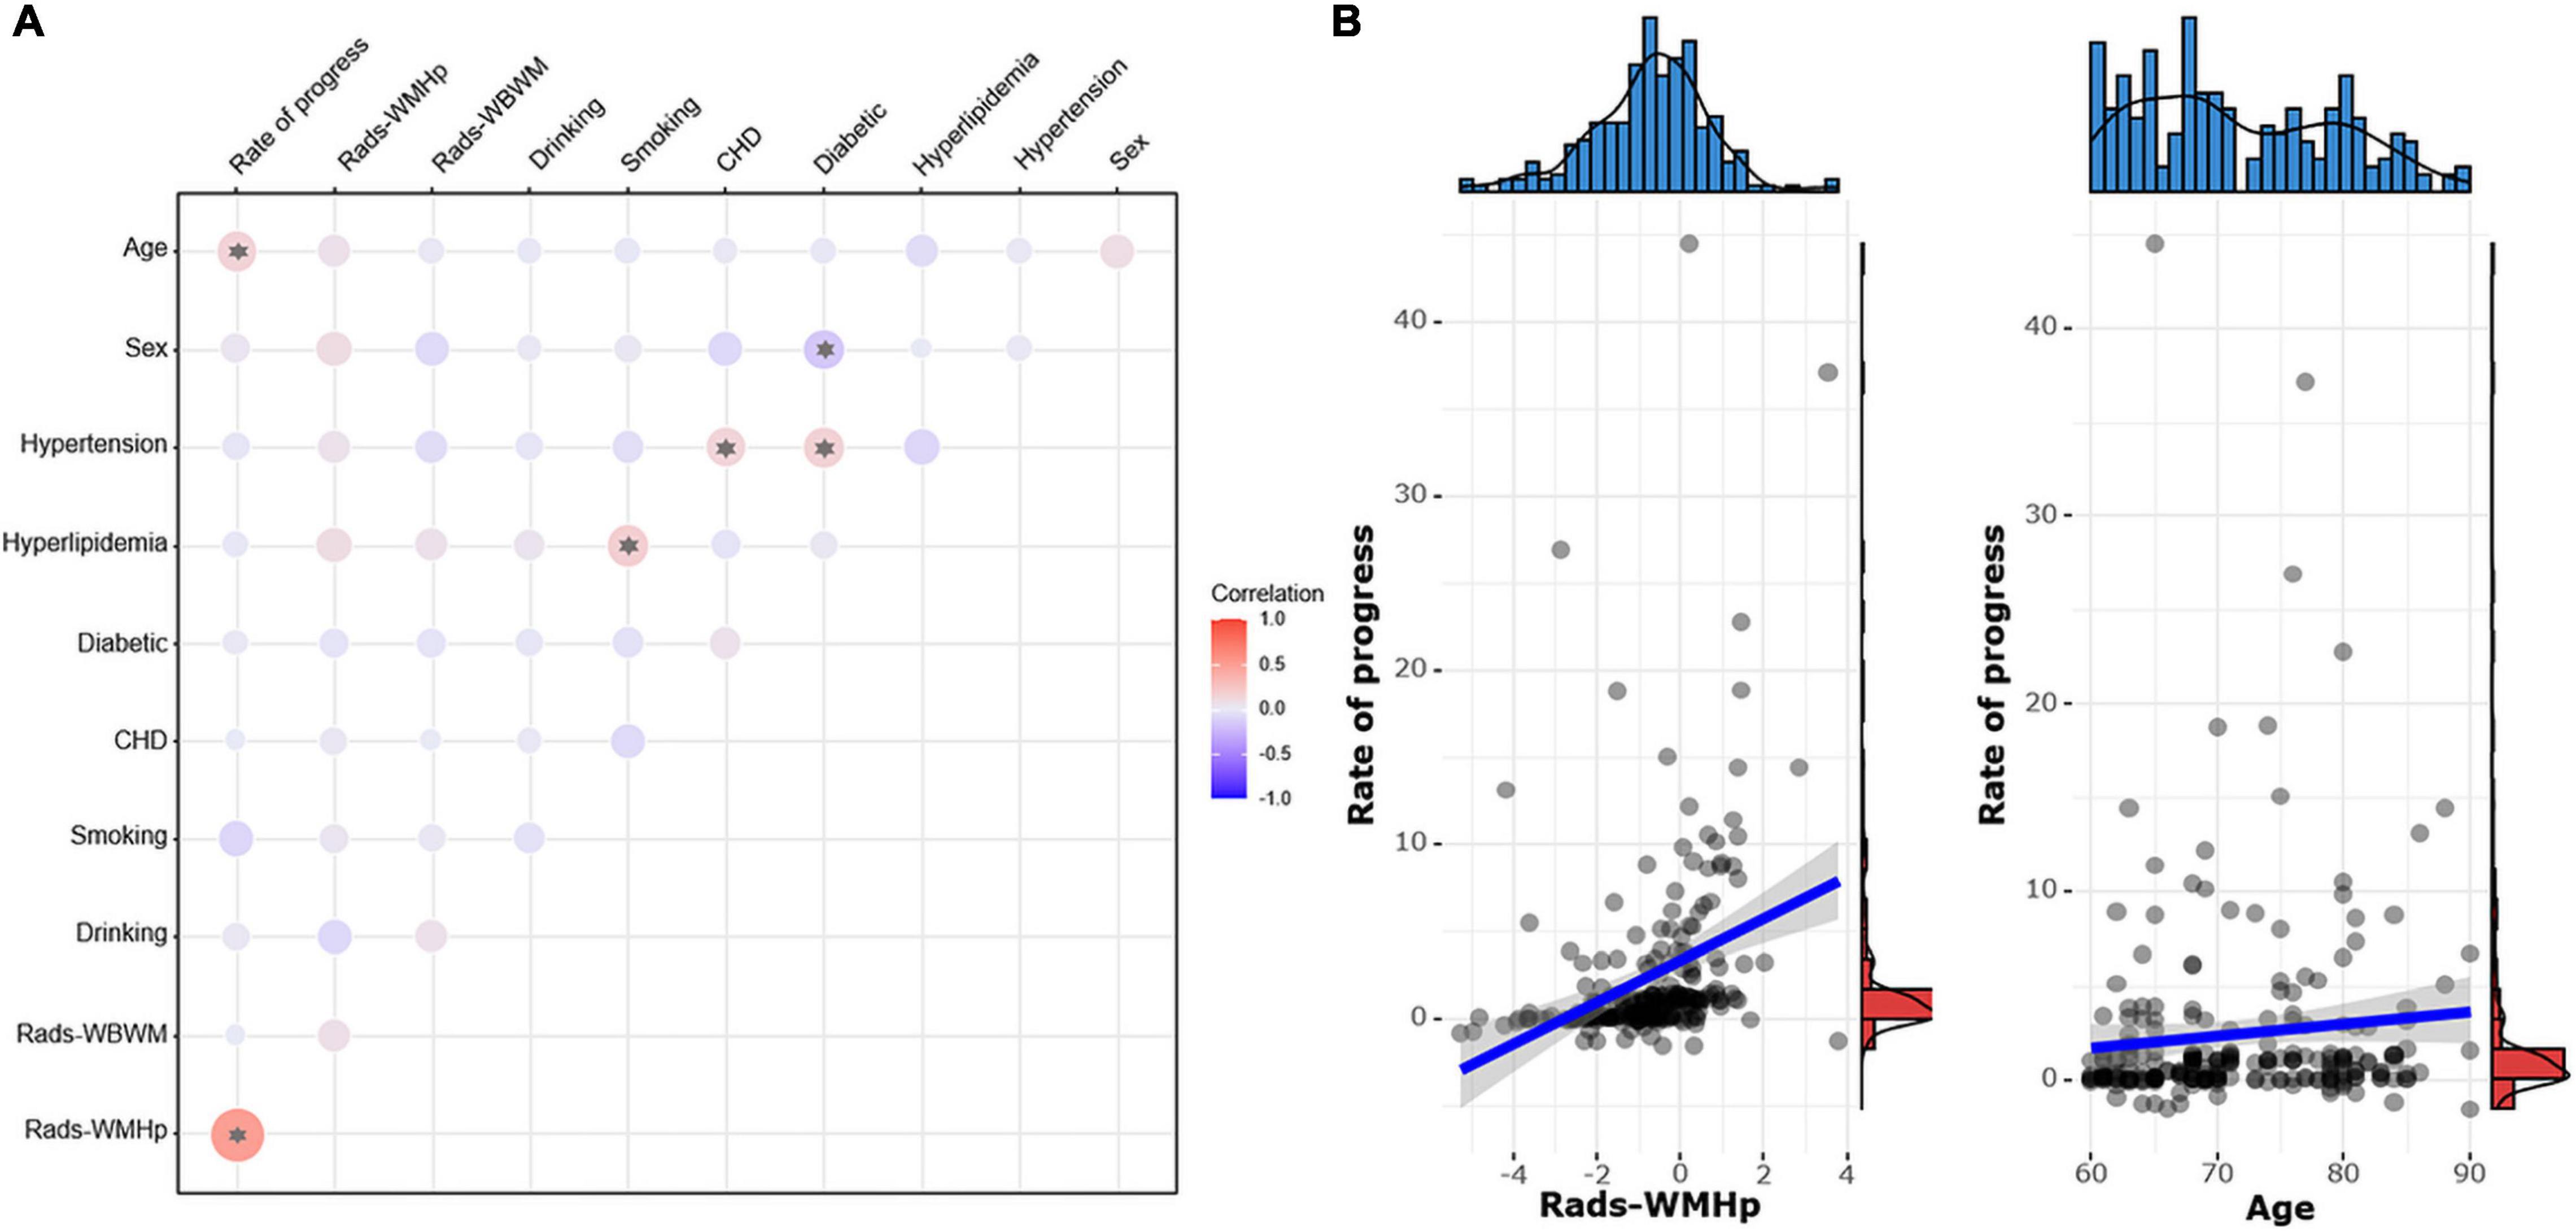
Figure 8. (A) The pairwise correlation heatmap among clinical risk factors, the rad-score, and the speed of white matter hyperintensity (WMH) progression. The color bar on the right represents the size of the correlation coefficient. The larger the circle in the figure, the higher the correlation. Asterisk indicates P < 0.05. CHD, coronary heart disease. (B) Scatter diagrams show the correlation between the speed of progress and the rad-score of WMH penumbra (WMHp) and age.
Interobserver and Intra-Observer Reproducibility
The intra- and interobserver correlation coefficients of segmenting the ROI WMHp were 0.846 and 0.885, respectively.
Discussion
Our results revealed that the predictive efficiency was higher for the ROI WMHp-based radiomic model than the ROI WBWM-based radiomic model. Compared with the WBWM-based combined model, the WMHp-based combined model has higher diagnostic efficiency and better generalization ability. Another noteworthy result was that the speed of progression was related to the rad-score of the ROI WMHp but not to that of the ROI WBWM.
The efficiency of the WMHp-based radiomic model was higher than that of the WBWM-based radiomic model in predicting the WMH progression. This finding may be attributed to the fact that the evolutionary mechanism of WMH predominantly affects the foci and moves toward the periphery gradually (Maniega et al., 2015; Reginold et al., 2018; van Leijsen et al., 2018; Vangberg et al., 2019). The microstructure of the WMHp region has been suggested to be more heterogeneous and complex and more predictive of WMH progression. However, the predictive power of WBWM was reduced by the inclusion of more extensive normal tissues (Shu Z. et al., 2020). This result also suggests that in particular for clinical studies, the selection of ROIs by medical principles may be more important than the size of ROIs for diagnostic accuracy.
Moreover, we also found that the ROI WMHp-based combined model has higher better generalization ability in predicting the WMH progression. This model has been validated in an external cohort with good diagnostic efficiency, and age was the independent clinical factor that survived in the predictive model. The WMH is the main radiological feature of small vessel disease, with age as a confirmed risk factor (Grueter and Schulz, 2012; Sabisz et al., 2019). Besides, our findings suggested that hypertension could also be an established risk factor for the WMH progression in the ROI WBWM-based combined model. Hypertension would damage small blood vessel walls and increase blood–brain barrier permeability, thus aggravating white matter progression (Chen et al., 2019; Sabisz et al., 2019).
Previous studies using radiomics on the WMH progression ignored the effect of the interval time between examinations (Shu Z. et al., 2020; Shu Z. Y. et al., 2020). To avoid this lapse, we further studied the correlation between the speed of progression and the rad-score. Consequently, we found that the speed of the WMH progression to be related to the rad-score of only ROI WMHp and not of the ROI WBWM. The WMH progression follows the pattern of extending from the lesion to the adjacent regions, the heterogeneity, and the complexity of the penumbra was more representative of and correlated more strongly to the progression of the lesion (Maillard et al., 2014). However, the heterogeneity of WBWM was diluted by relatively more normal tissues, and it was not correlated with the speed of progression. We also found a mild correlation between age and the speed of progress, which corroborated previous reports (Schmidt et al., 2003; Grueter and Schulz, 2012).
This study has some limitations. First, the sample size was not large enough, so more cases need to be collected to verify the model. Second, semiautomatic segmentation of ROI WMHp was time-consuming than automatic delineation, which would reduce its clinical usefulness in future.
Conclusion
Radiomic findings revealed that the damage of WMH extended further from the high-intensity area observed on conventional MRI sequences. The heterogeneity of the penumbra could identify the individuals at high risk of WMH progression and the rad-score of it was correlated with the speed of progression.
Data Availability Statement
The raw data supporting the conclusions of this article will be made available by the authors, without undue reservation.
Ethics Statement
The studies involving human participants were reviewed and approved by the Medical Ethics Committee of Zhejiang Provincial People’s Hospital. Written informed consent for participation was not required for this study in accordance with the national legislation and the institutional requirements.
Author Contributions
XH designed this study and guided the experiment. YS and YX wrote this manuscript and participated in the whole experiment process. YS and ZS analyzed the data. All authors read and approved the final manuscript.
Funding
The work was supported by the National Natural Science Foundation of China (Grant No. 82101983) and the Natural Science Foundation of Zhejiang Province Health Department (Grant No. 2021KY067).
Conflict of Interest
The authors declare that the research was conducted in the absence of any commercial or financial relationships that could be construed as a potential conflict of interest.
Publisher’s Note
All claims expressed in this article are solely those of the authors and do not necessarily represent those of their affiliated organizations, or those of the publisher, the editors and the reviewers. Any product that may be evaluated in this article, or claim that may be made by its manufacturer, is not guaranteed or endorsed by the publisher.
Supplementary Material
The Supplementary Material for this article can be found online at: https://www.frontiersin.org/articles/10.3389/fninf.2021.789295/full#supplementary-material
Abbreviations
WMH, white matter hyperintensity; WBWM, whole-brain white matter; WMHp, white matter hyperintensity penumbra; ANOVA, analysis of variance; AUC, area under the curve; DTI, diffusion tensor imaging; FLAIR, fluid-attenuated inversion recovery; GLCM, gray-level co-occurrence matrix; GLSZM, Gray Level Size Zone Matrix; RLM, run-length matrix; ROC, receiver operating characteristic; ROI, regions of interest; FOV, field of view.
Footnotes
References
Bakas, S., Akbari, H., Sotiras, A., Bilello, M., Rozycki, M., Kirby, J. S., et al. (2017). Advancing the cancer genome atlas glioma MRI collections with expert segmentation labels and radiomic features. Sci. Data 4:170117. doi: 10.1038/sdata.2017.117
Chen, X., Zhu, Y., Geng, S., Li, Q., and Jiang, H. (2019). Association of blood pressure variability and intima-media thickness with white matter hyperintensities in hypertensive patients. Front. Aging Neurosci. 11:192. doi: 10.3389/fnagi.2019.00192
de Groot, M., Verhaaren, B. F., de Boer, R., Klein, S., Hofman, A., van der Lugt, A., et al. (2013). Changes in normal-appearing white matter precede development of white matter lesions. Stroke 44, 1037–1042. doi: 10.1161/strokeaha.112.680223
Grueter, B. E., and Schulz, U. G. (2012). Age-related cerebral white matter disease (leukoaraiosis): a review. Postgrad. Med. J. 88, 79–87. doi: 10.1136/postgradmedj-2011-130307
Longstreth, W. T. Jr., Arnold, A. M., Beauchamp, N. J. Jr., Manolio, T. A., Lefkowitz, D., Jungreis, C., et al. (2005). Incidence, manifestations, and predictors of worsening white matter on serial cranial magnetic resonance imaging in the elderly: the Cardiovascular Health Study. Stroke 36, 56–61. doi: 10.1161/01.Str.0000149625.99732.69
Maillard, P., Carmichael, O., Harvey, D., Fletcher, E., Reed, B., Mungas, D., et al. (2013). FLAIR and diffusion MRI signals are independent predictors of white matter hyperintensities. AJNR Am. J. Neuroradiol. 34, 54–61. doi: 10.3174/ajnr.A3146
Maillard, P., Fletcher, E., Lockhart, S. N., Roach, A. E., Reed, B., Mungas, D., et al. (2014). White matter hyperintensities and their penumbra lie along a continuum of injury in the aging brain. Stroke 45, 1721–1726. doi: 10.1161/strokeaha.113.004084
Maniega, S. M., Valdés Hernández, M. C., Clayden, J. D., Royle, N. A., Murray, C., Morris, Z., et al. (2015). White matter hyperintensities and normal-appearing white matter integrity in the aging brain. Neurobiol. Aging 36, 909–918. doi: 10.1016/j.neurobiolaging.2014.07.048
Prins, N. D., van Straaten, E. C., van Dijk, E. J., Simoni, M., van Schijndel, R. A., Vrooman, H. A., et al. (2004). Measuring progression of cerebral white matter lesions on MRI: visual rating and volumetrics. Neurology 62, 1533–1539. doi: 10.1212/01.wnl.0000123264.40498.b6
Reginold, W., Sam, K., Poublanc, J., Fisher, J., Crawley, A., and Mikulis, D. J. (2018). Impact of white matter hyperintensities on surrounding white matter tracts. Neuroradiology 60, 933–944. doi: 10.1007/s00234-018-2053-x
Rohlfing, T., Zahr, N. M., Sullivan, E. V., and Pfefferbaum, A. (2010). The SRI24 multichannel atlas of normal adult human brain structure. Hum. Brain Mapp. 31, 798–819. doi: 10.1002/hbm.20906
Sabisz, A., Naumczyk, P., Marcinkowska, A., Graff, B., Gąsecki, D., Glińska, A., et al. (2019). Aging and hypertension - independent or intertwined white matter impairing factors? insights from the quantitative diffusion tensor imaging. Front. Aging Neurosci. 11:35. doi: 10.3389/fnagi.2019.00035
Schmidt, R., Enzinger, C., Ropele, S., Schmidt, H., and Fazekas, F. (2003). Progression of cerebral white matter lesions: 6-year results of the Austrian stroke prevention study. Lancet 361, 2046–2048. doi: 10.1016/s0140-6736(03)13616-1
Shao, Y., Chen, Z., Ming, S., Ye, Q., Shu, Z., Gong, C., et al. (2018). Predicting the development of normal-appearing white matter with radiomics in the aging brain: a longitudinal clinical study. Front. Aging Neurosci. 10:393. doi: 10.3389/fnagi.2018.00393
Shu, Z., Xu, Y., Shao, Y., Pang, P., and Gong, X. (2020). Radiomics from magnetic resonance imaging may be used to predict the progression of white matter hyperintensities and identify associated risk factors. Eur. Radiol. 30, 3046–3058. doi: 10.1007/s00330-020-06676-1
Shu, Z. Y., Shao, Y., Xu, Y. Y., Ye, Q., Cui, S. J., Mao, D. W., et al. (2020). Radiomics nomogram based on MRI for predicting white matter hyperintensity progression in elderly adults. J. Magn. Reson. Imaging 51, 535–546. doi: 10.1002/jmri.26813
Tozer, D. J., Zeestraten, E., Lawrence, A. J., Barrick, T. R., and Markus, H. S. (2018). Texture analysis of T1-weighted and fluid-attenuated inversion recovery images detects abnormalities that correlate with cognitive decline in small vessel disease. Stroke 49, 1656–1661. doi: 10.1161/strokeaha.117.019970
van Leijsen, E. M. C., Bergkamp, M. I., van Uden, I. W. M., Ghafoorian, M., van der Holst, H. M., Norris, D. G., et al. (2018). Progression of white matter hyperintensities preceded by heterogeneous decline of microstructural integrity. Stroke 49, 1386–1393. doi: 10.1161/strokeaha.118.020980
Vangberg, T. R., Eikenes, L., and Håberg, A. K. (2019). The effect of white matter hyperintensities on regional brain volumes and white matter microstructure, a population-based study in HUNT. Neuroimage 203:116158. doi: 10.1016/j.neuroimage.2019.116158
Keywords: white matter, penumbra, radiomics, magnetic resonance imaging, texture analysis
Citation: Shao Y, Ruan J, Xu Y, Shu Z and He X (2021) Comparing the Performance of Two Radiomic Models to Predict Progression and Progression Speed of White Matter Hyperintensities. Front. Neuroinform. 15:789295. doi: 10.3389/fninf.2021.789295
Received: 04 October 2021; Accepted: 04 November 2021;
Published: 01 December 2021.
Edited by:
Hancan Zhu, Shaoxing University, ChinaReviewed by:
Liming Hsu, University of North Carolina at Chapel Hill, United StatesRuiting Zhang, Zhejiang University, China
Copyright © 2021 Shao, Ruan, Xu, Shu and He. This is an open-access article distributed under the terms of the Creative Commons Attribution License (CC BY). The use, distribution or reproduction in other forums is permitted, provided the original author(s) and the copyright owner(s) are credited and that the original publication in this journal is cited, in accordance with accepted academic practice. No use, distribution or reproduction is permitted which does not comply with these terms.
*Correspondence: Xiaodong He, MTU4ODg4MTU2NDVAMTYzLmNvbQ==