 Rachele Fabbri
 Ermes Botte
 Arti Ahluwalia
 Chiara Magliaro
- 1Research Center “E. Piaggio”, University of Pisa, Pisa, Italy
- 2Department of Information Engineering (DII), University of Pisa, Pisa, Italy
- 3Interuniversity Center for the Promotion of 3R Principles in Teaching and Research (Centro 3R), Pisa, Italy
Introduction: Computational models are valuable tools for understanding and studying a wide range of characteristics and mechanisms of the brain. Furthermore, they can also be exploited to explore biological neural networks from neuronal cultures. However, few of the current in silico approaches consider the energetic demand of neurons to sustain their electrophysiological functions, specifically their well-known oxygen-dependent firing.
Methods: In this work, we introduce Digitoids, a computational platform which integrates a Hodgkin-Huxley-like model to describe the time-dependent oscillations of the neuronal membrane potential with oxygen dynamics in the culture environment. In Digitoids, neurons are connected to each other according to Small-World topologies observed in cell cultures, and oxygen consumption by cells is modeled as limited by diffusion through the culture medium. The oxygen consumed is used to fuel their basal metabolism and the activity of Na+-K+-ATP membrane pumps, thus it modulates neuronal firing.
Results: Our simulations show that the characteristics of neuronal firing predicted throughout the network are related to oxygen availability. In addition, the average firing rate predicted by Digitoids is statistically similar to that measured in neuronal networks in vitro, further proving the relevance of this platform.
Dicussion: Digitoids paves the way for a new generation of in silico models of neuronal networks, establishing the oxygen dependence of electrophysiological dynamics as a fundamental requirement to improve their physiological relevance.
1 Introduction
Exploring how neurons process and transmit information is crucial for advancing our knowledge of the brain. Along with the study of biological neural networks in cultures or in in vitro slices (Chiappalone et al., 2019; Compte et al., 2003; Humpel, 2015; Van Pelt et al., 2005), computational, or in silico, models have been successfully exploited, e.g., to support the study of neuronal network modulation and delineate potential mechanisms underlying activity patterns (Doorn et al., 2023; Masquelier and Deco, 2013; Sukenik et al., 2021; Wen et al., 2022). Several model-based solutions for generating virtual representations of neural cells able to replicate the salient properties of experimentally observed behaviors have been proposed (Lonardoni et al., 2015). For instance, intuitive and easy to use simulators (e.g., BRIAN 2, NEST, NEURON) have been employed to simulate spiking neural network models (Gewaltig and Diesmann, 2007; Hines and Carnevale, 2001; Stimberg et al., 2019). Traditionally, they include mathematical descriptions of the single-neuron activity, ranging from simple phenomenological characterization of neuronal spiking (Izhikevich, 2003) to more complex, biophysical conductance-based simulations of ion fluxes between the intra and the extracellular space (Hodgkin and Huxley, 1952b), as well as models of cell-cell connections to replicate the neuronal network architecture (Markram et al., 2015; Masoli et al., 2022; Potjans and Diesmann, 2014). Some studies also incorporate more sophisticated models, e.g., including astrocytes via tripartite synapses (Lenk et al., 2020).
However, few of these approaches include energetic considerations, i.e., the dynamics of ATP hydrolysis (Kuznetsov, 2024; Wei et al., 2014). It is well-known that metabolism is involved in brain functionality: nutrients—and, in particular, oxygen (O2)—fuel brain specialized functions, determining the electrophysiological dynamics and brain plasticity, up to cognitive functions (Watts et al., 2018). More specifically, beyond the basic activities common to other cells (e.g., DNA and RNA synthesis), resource uptake in neurons is also dedicated to support spiking, because of the role of the Na+-K+-ATP pump in signal propagation (Attwell and Laughlin, 2001; Lennie, 2003). Since ATP dephosphorylation depends on the rate of O2 consumption, its dynamics can be monitored (Brosel et al., 2018; Özugur et al., 2020). O2 dependence is also crucial for in vitro slice preparations, requiring humid and well-oxygenated environment for their culturing (Sanchez-Vives et al., 2000). An analytical formulation describing O2-dependent firing was proposed by Wei and collaborators (Wei et al., 2014) to elucidate the mechanisms of seizure development and termination, as well as their interaction with energy metabolism. This model assumes that O2 variations depend on the diffusion from the bath solution and on the neuronal consumption rate for firing, but it does not consider that O2 can also be consumed for sustaining other metabolic functions of the cell (Attwell and Laughlin, 2001; Lennie, 2003).
The formulation proposed by Wei’s team was applied to brain tissue slices. However, O2 is also crucial in in vitro cultures: for example, in traditional monolayers, cells are inevitably exposed to different O2 levels when varying the amount of medium or the O2 boundary concentration (Al-Ani et al., 2018; Gordon and Amini, 2021; Pacitti et al., 2019; Walsh et al., 2005). Starting from Wei et al.’s model, we have developed a computational platform able to mimic the in vitro electrophysiological behavior of neuronal cultures at the single-cell and network level. We refer to Digitoids as the digitalized versions of in vitro neuronal monolayers obtained from dissociated neurons, in which the dependence on O2 concentration of network dynamics is considered. As in vitro networks can have different culture conditions and layouts (Antonello et al., 2022; Downes et al., 2012; Emre Kapucu et al., 2022; Hyvärinen et al., 2019), the platform is purposely designed to be modular, thus the user can generate Digitoids matching any type of in vitro neuronal network. Here we describe the theory and computational setup of Digitoids. For testing the performance and highlighting the crucial role of O2 in describing firing dynamics in neuronal cultures, we digitalized the layouts of neuron monolayers seeded on commercial micro-electrode arrays (MEAs). The O2-dependent model of firing and metabolism was implemented on digitalized networks to assess if a degree of similarity can be found between the Digitoids’ output and the corresponding experimental data from MEA recordings, comparing the predictivity of our platform to that of traditional models which neglect the dependence of firing activity on O2 supply. Albeit preliminary, these results highlight the significant role of O2 dynamics in network behaviors and thus the necessity of including energetic considerations while mathematically describing electrophysiological activity in cell cultures.
2 Materials and methods
2.1 Theory and outline of the computational platform
Figure 1. A shows the in vitro scenario simulated by the Digitoids. It is composed of a well seeded with neurons, supplied with a layer of culture medium of height h. The cells are assumed to be homogeneously distributed on the bottom of the well (at z = 0). Four phenomena occur in the system: i) O2 diffusion through the medium, ii) O2 consumption by neurons to fuel both basic cellular processes and electrophysiological activity, iii) neuron firing and iv) neural network dynamics, i.e., the transfer of electrical information via synaptic-mediated connections among cells. Considering the symmetry of the system, O2 diffusion can be assumed to occur only along the z axis and independently of the x and y directions (McMurtrey, 2016; Patterson and Mazurek, 2010; Place et al., 2017). Each neuron at z = 0 consumes O2 as described in the subsection 2.1.2 Single-neuron model, generating an axial concentration gradient and a consequent downward flux. Moreover, O2 diffusion and reaction can be simulated as “background dynamics”, given that their characteristic times are significantly longer than those of the electrophysiological phenomena occurring on the x,y plane, where the neuron monolayer lies (Table 1). Transfer information is mainly influenced by the strength and number of synaptic connections between neurons. Thus, the O2-dependent single-neuron dynamics can be decoupled from those of the network as a whole. As such, the network (Figure 1A) can be considered as the integration of modules describing the O2 consumption—depending on its downward diffusion—as well as the firing for a single neuron (Figure 1B), modulated through the extent of its in-plane connectivity. Under these assumptions, the single-neuron metabolic and electrophysiological activity can be determined at each time step according to the O2 concentration perceived by the cells at z = 0, which is in turn updated depending on the single-neuron consumption and allows computing the diffusive flux magnitude along the medium column. On this basis, the O2 concentration profile at the subsequent time step can be estimated and the process iterated over time.
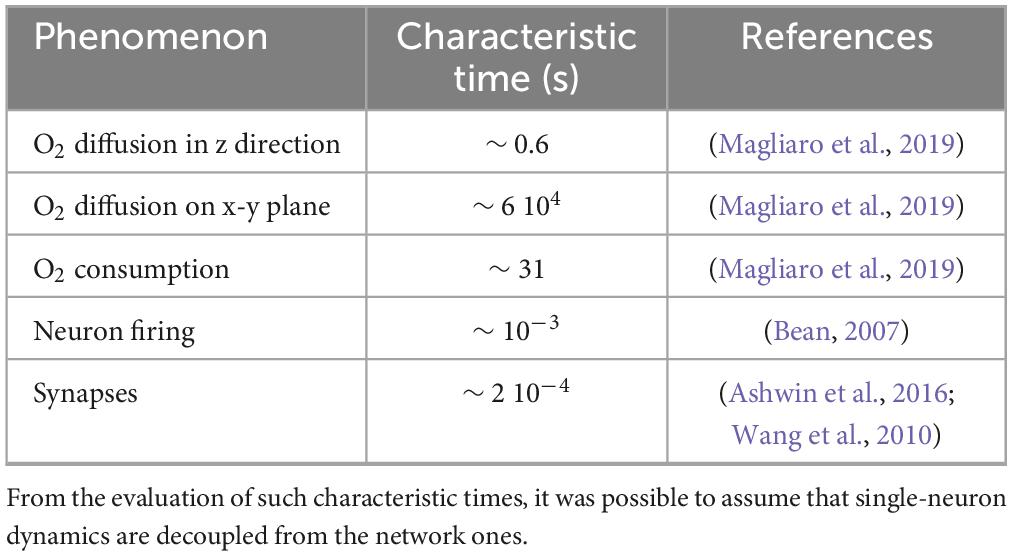
Table 1. Characteristic times of the phenomena involved in the single-neuron model: O2 diffusion—in the x direction and in the x-y plane, O2 consumption, neuron firing and synapses.
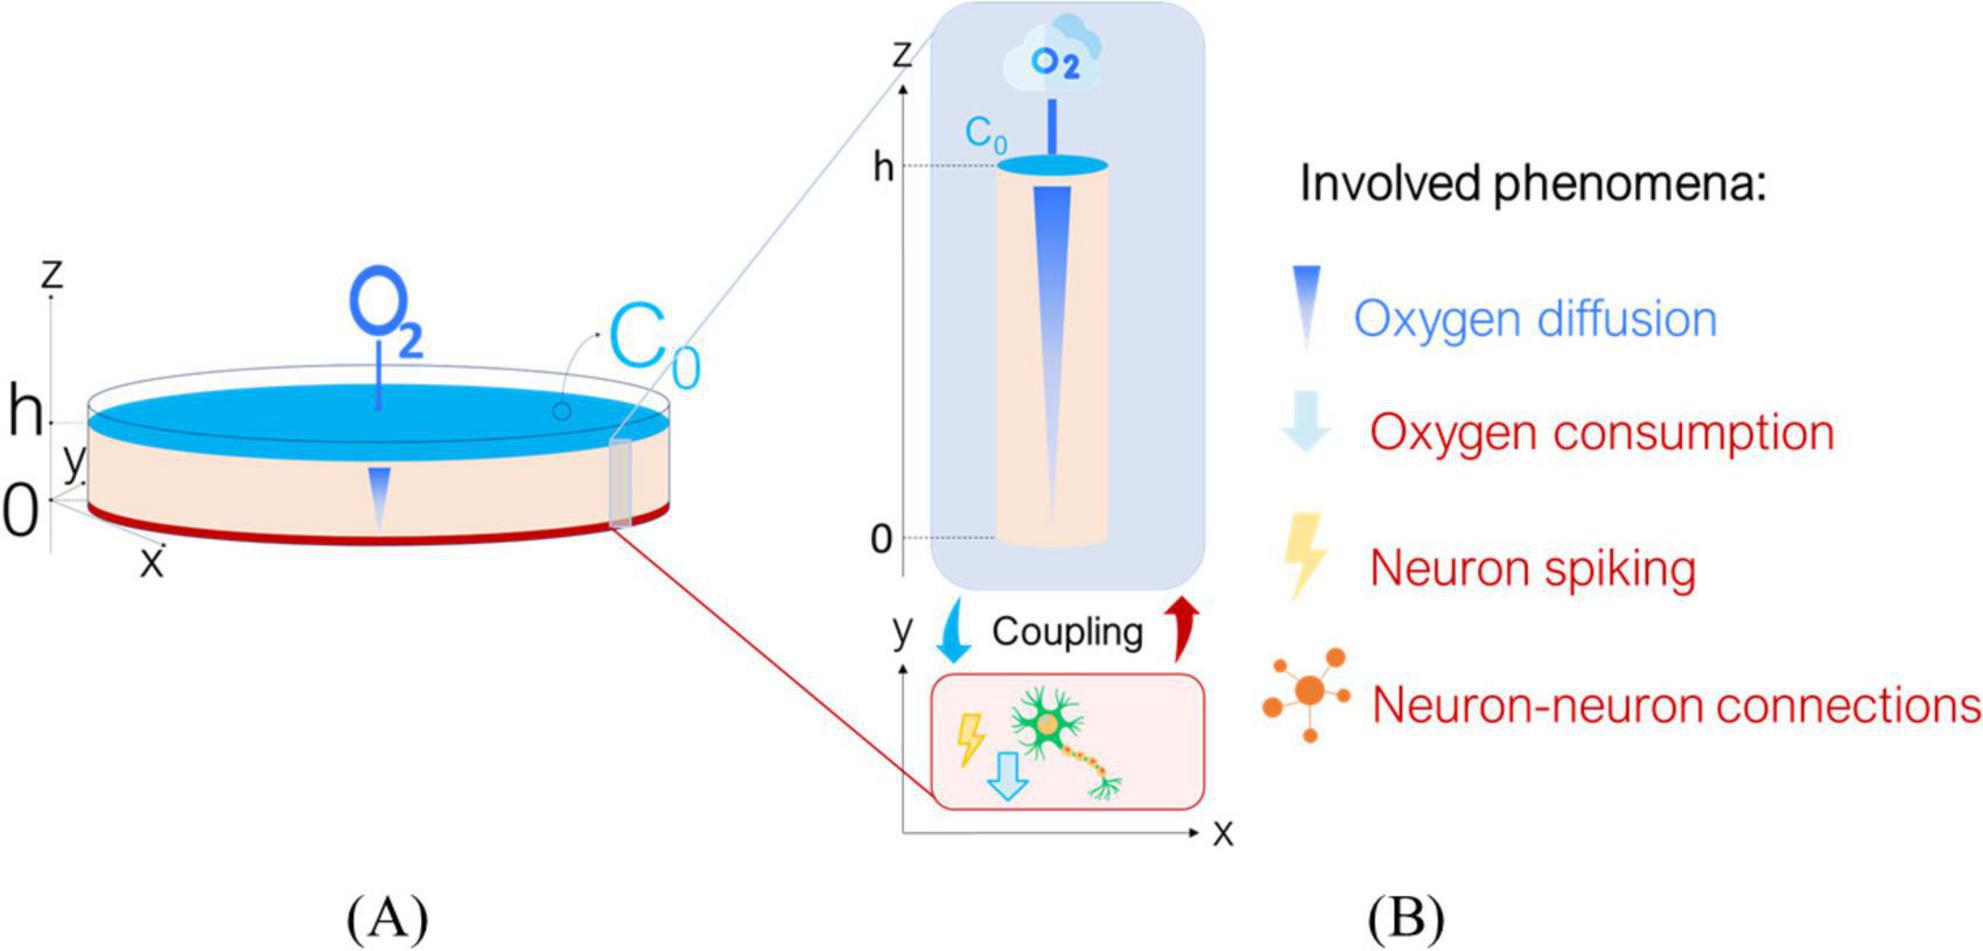
Figure 1. Overview of the Digitoids platform. (A) The in vitro scenario to be modeled: we describe a neuronal monolayer where cells are seeded at the bottom of a well, filled with culture medium reaching height h. The top layer of culture medium interfaces with air, allowing O2 to diffuse and reach the cells, which consume it to sustain their metabolism and for firing. (B) Sketch of the coupling between O2 diffusion through the culture medium and single-neuron activity. We assume that single-cell dynamics can be decoupled from the network ones: a neuron lies in plane x-y and is covered by a medium column of height h, where O2 diffuses from top to the bottom along z axis. The biophysical phenomena involved are listed on the right: O2 diffusion, O2 consumption, neuron spiking and neuron-to-neuron connections.
The computational platform was developed in Matlab (version R2023b the Mathworks Inc., Boston Massachusetts), exploiting the Simulink toolbox.
2.1.1 Diffusion model
O2 diffusion through the culture medium is modeled as a one-dimensional phenomenon governed by the Fick’s second law:
where c (mol m–3) is the O2 concentration and D (m2 s–1) is the diffusion constant of O2 in the culture medium. Eq. (1) is solved using the finite difference method according to the initial and boundary conditions. Specifically, assuming that the well is initially filled with O2-saturated culture medium, the initial condition is c(z, 0) = c0, and the air-medium interface maintains a uniform and time-invariant O2 concentration, i.e., c(h,t) = c0. Note that, as neurons consume O2 by means of a surface reaction (i.e., they sink O2 as an outward flux through the well bottom), there is no volumetric reaction term to include in Eq. (1).
2.1.2 Single-neuron model
The single-neuron model describes the O2 consumption for maintaining both vital and electrophysiological functions and the O2-dependent dynamics in each cell of the network as a function of the current O2 availability [i.e., c(0,t)] as input.
Regarding the O2 consumption, we assume that 75% of the available O2 is devoted to fuel neuronal spiking activity (namely, cf = 0.75⋅c), and the remaining 25% (namely, cnf = 0.25⋅c) to sustain basic cell processes (Attwell and Laughlin, 2001; Lennie, 2003). The O2 consumption rate of the whole neuron network (R(c), in mol m–3 s–1) can be thus expressed as:
where Rnf(cnf) is the rate at which O2 is consumed for cellular and sub-cellular processes not directly linked to electrophysiological activity, and Rf(cf) is the O2 consumption contributing to neuron firing. Specifically, Rnf(cnf) can be formulated according to the Michaelis-Menten kinetics (Berger et al., 2018; Magliaro et al., 2019):
where sOCR (mol s–1) is the maximal consumption rate of a single cell in the network, ρcells (m–3) is the volumetric cell density of the monolayer and km (mol m–3) is the Michaelis-Menten constant, i.e., the O2 concentration corresponding to half saturation of the consumption rate. On the other hand, Rf(cf) was described by Wei and co-workers (Wei et al., 2014) as:
where Ipump (mol m–3 s–1) is the transport rate of ions across the membrane and α (a.u.) is a conversion factor from pump transport rate to time variation of O2 concentration. Ipump is related to intracellular (subscript i) sodium and the extracellular (subscript o) potassium concentrations as in the following equation:
in which we assume that the rate ρ (mol m–3 s–1) at which the pumps transport ions across the membrane depends on the O2 concentration according to a sigmoidal function.
In Eq. (6), ρmax (mol m–3 s–1) is the maximal rate at which the pump operates, i.e., when the medium is fully oxygenated. Therefore, Ipump regulates the trans-membrane electrochemical gradient depending on the O2 availability, which thus influences the membrane potential V (mV) and the firing activity of the neuron. The Hodgkin-Huxley (HH) model is used to describe the dynamics of V (Hodgkin et al., 1952; Hodgkin and Huxley, 1952a):
where C (μF cm–2) is the membrane capacitance, Iext (μA cm–2) is the external applied or synaptic current from other neurons, INa,IK,ICl (μA cm–2) are the sodium, potassium and chloride currents. The latter corresponds to a leakage current, as it is mainly represented by flux of Cl– ions (Hodgkin and Huxley, 1952a).
It is worth highlighting that—as in the traditional formulation of the HH model—the membrane potential V (Eq. 7) depends on the potassium and sodium currents INa and IK:
where m,p, and n are activation and inactivation variables (their description is given by Supplementary Eqs. 1–7) of voltage-gated ionic channels, whose values range from 0 to 1 and define the fraction of open and closed channels throughout the membrane. For the sake of simplicity, the non-voltage-sensitive leaks were not reported. As detailed in Eqs. (8) and (9), INa and IK are in turn functions of the reversal potential ENa and EK, respectively, given by the Nernst equation:
However, while in the HH model the intracellular concentration of sodium and the extracellular concentration of potassium are considered as constants, in this formulation they are modulated by Ipump, which is a function of the local O2 concentration, as described through Eqs. (5) and (6). Thus, Nernst potentials of sodium and potassium (Eqs. 10 and 11) vary with O2. All the dynamics describing neuronal functioning are here assumed to occur at 37°C, corresponding to the physiological temperature for eukaryotic cells. Intracellular sodium and extracellular potassium concentrations are in turn modulated by INa, IK and Ipump, as described by the following equations (Eqs. 12 and 13):
More details on the model are provided in the Supplementary Text 1 (Eqs. 8–10).
2.1.3 Connectivity model
The neuronal network is generated connecting the single neurons. In this study, we implemented the neuron-to-neuron coupling via chemical synapses (Roth and van Rossum, 2009). Thus, the membrane potential of the i-th neuron is described by the following equation.
in Eq. (14) is the synaptic current input to the post-synaptic neuron i and it is modeled as:
in which we assume that the i-th neuron receives inputs from N pre-synaptic neurons. aij is the coefficient describing the connection between vertices i and j of the adjacency matrix A, obtained through the Watts-Strogaz method (more details in the next Section and in Supplementary Table 2). (mV) is the reversal potential of the synapse for the j-th pre-synaptic neuron and can assume the following values according to the nature of the synaptic connection (Borges et al., 2023; Wei et al., 2014).
The value of the synaptic conductance (μS cm–2) is modified every time the pre-synaptic neuron fires, i.e., every time Vi exceeds the threshold value of 0mV with a positive derivative. At each spike, there is a release of neurotransmitter into the synaptic cleft, thus the synaptic conductance over time is modeled as an exponential decay:
where t0 is the time at which the spike is fired by the pre-synaptic neuron, is the maximal conductance value and τsyn is the decay time constant, which assumes the following values (Wei et al., 2014).
The synaptic dynamics are implemented in the model by updating the value of the synaptic conductance as follows (Borges et al., 2023; Roth and van Rossum, 2009):
where μS cm–2 is the intensity of the synaptic update, the same for both excitatory and inhibitory synapses. In Digitoids, 80% of neurons are excitatory and 20% inhibitory.
2.1.4 Network model
It has been observed that the structure of neuronal networks in both brain tissues and cellular monolayers can be described by Small-World (SW) graphs (Antonello et al., 2022; Bettencourt et al., 2007; de Santos-Sierra et al., 2014). Specifically, a SW graph shows intermediate characteristics between a random and a regular graph, with dense clustering of neighboring vertices and short distances between pair of vertices. Indeed, in vivo chemical synapses typically facilitate the formation of dense local connections between neurons, thus giving rise to clusters, as well as of long-range connections allowing clusters of neurons to communicate (Bassett and Bullmore, 2006). Given a network composed of n vertices and m edges, it can be described by the metrics reported in Supplementary Table 2 (Humphries and Gurney, 2008; Watts and Strogatz, 1998).
We generated SW neural networks in a purposely developed Simulink library, which describes the wiring information through an adjacency matrix A, usually used to represent inter-neuron connections (de Santos-Sierra et al., 2014; Poli et al., 2015; Shefi et al., 2002). Starting from the number of vertices and edges and the metrics characterizing the networks, A can be obtained using the Watts-Strogatz method (Chen et al., 2007). Each coefficient of the matrix describes the connectivity between vertex i and j. Specifically, aij = 1 if an edge exists from vertex i to vertex j, otherwise it is 0. We thus exploited such adjacency matrices to create connections between neurons, defined by chemical synapses (Eqs. 14–20). Both the O2 diffusion and the single-neuron models were integrated in the library, which allows defining: (i) the initial and boundary O2 concentration c0 at the air-medium interface, (ii) the height of the medium h, and (iii) the metabolic and firing parameters of the neuron.
2.2 Impact of oxygen on single-neuron activity
For assessing the influence of O2 availability on firing, the single-neuron model coupled with O2 diffusion was first computed using stepwise variations of both (i) the boundary concentration of O2 from 0.2 mol m–3 (i.e., the maximum available oxygen concentration in water) to 0.04 mol m–3 [i.e., the critical oxygen concentration for cell survival (Berger et al., 2018)] and (ii) the culture medium height h from 0.1 to 3 mm, based on the conditions usually used for neuron electrophysiological recordings (Ballesteros-Esteban et al., 2023; Negri et al., 2020; Scelfo et al., 2012). All the parameter combinations were simulated for 20 s (variable step solver “ode15s” by Simulink) and are summarized in Table 2.
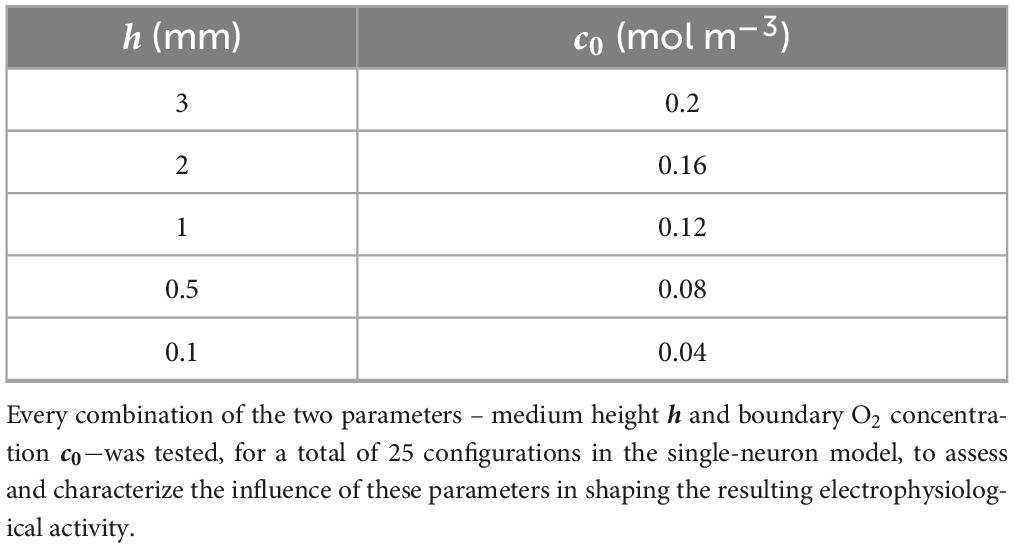
Table 2. Values of the parameters simulated in the single-neuron configuration.
2.3 Analysis of single-neuron membrane potential
To characterize how the shape of the spike trains and the single-spike waveforms are influenced by the different combinations of c0 and h–and, thus, by the overall O2 availability within the system—we defined two new metrics: the Aspect Ratio (AR, expressed in logarithmically-scaled mV s–1) and the Dissipation Rate (DR, expressed in s–1), defined as follows:
where ΔVmax is the peak-to-peak amplitude of the highest spike in the train, ttrain is the time duration of the train and α (in mV s–1) is the average value of the first derivative of the envelope of the peaks in the train. ttrain was expressed as the difference between the end and start times tend and tstart, identified as the time at which the first derivative of the signal is equal to 0 and the time at which the signal amplitude > −60 mV (Di Florio et al., 2022; Wilson and Emerson, 2002), respectively. Figure 2A reports a typical spike train, and a graphical representation of the quantities used to calculate AR and DR.
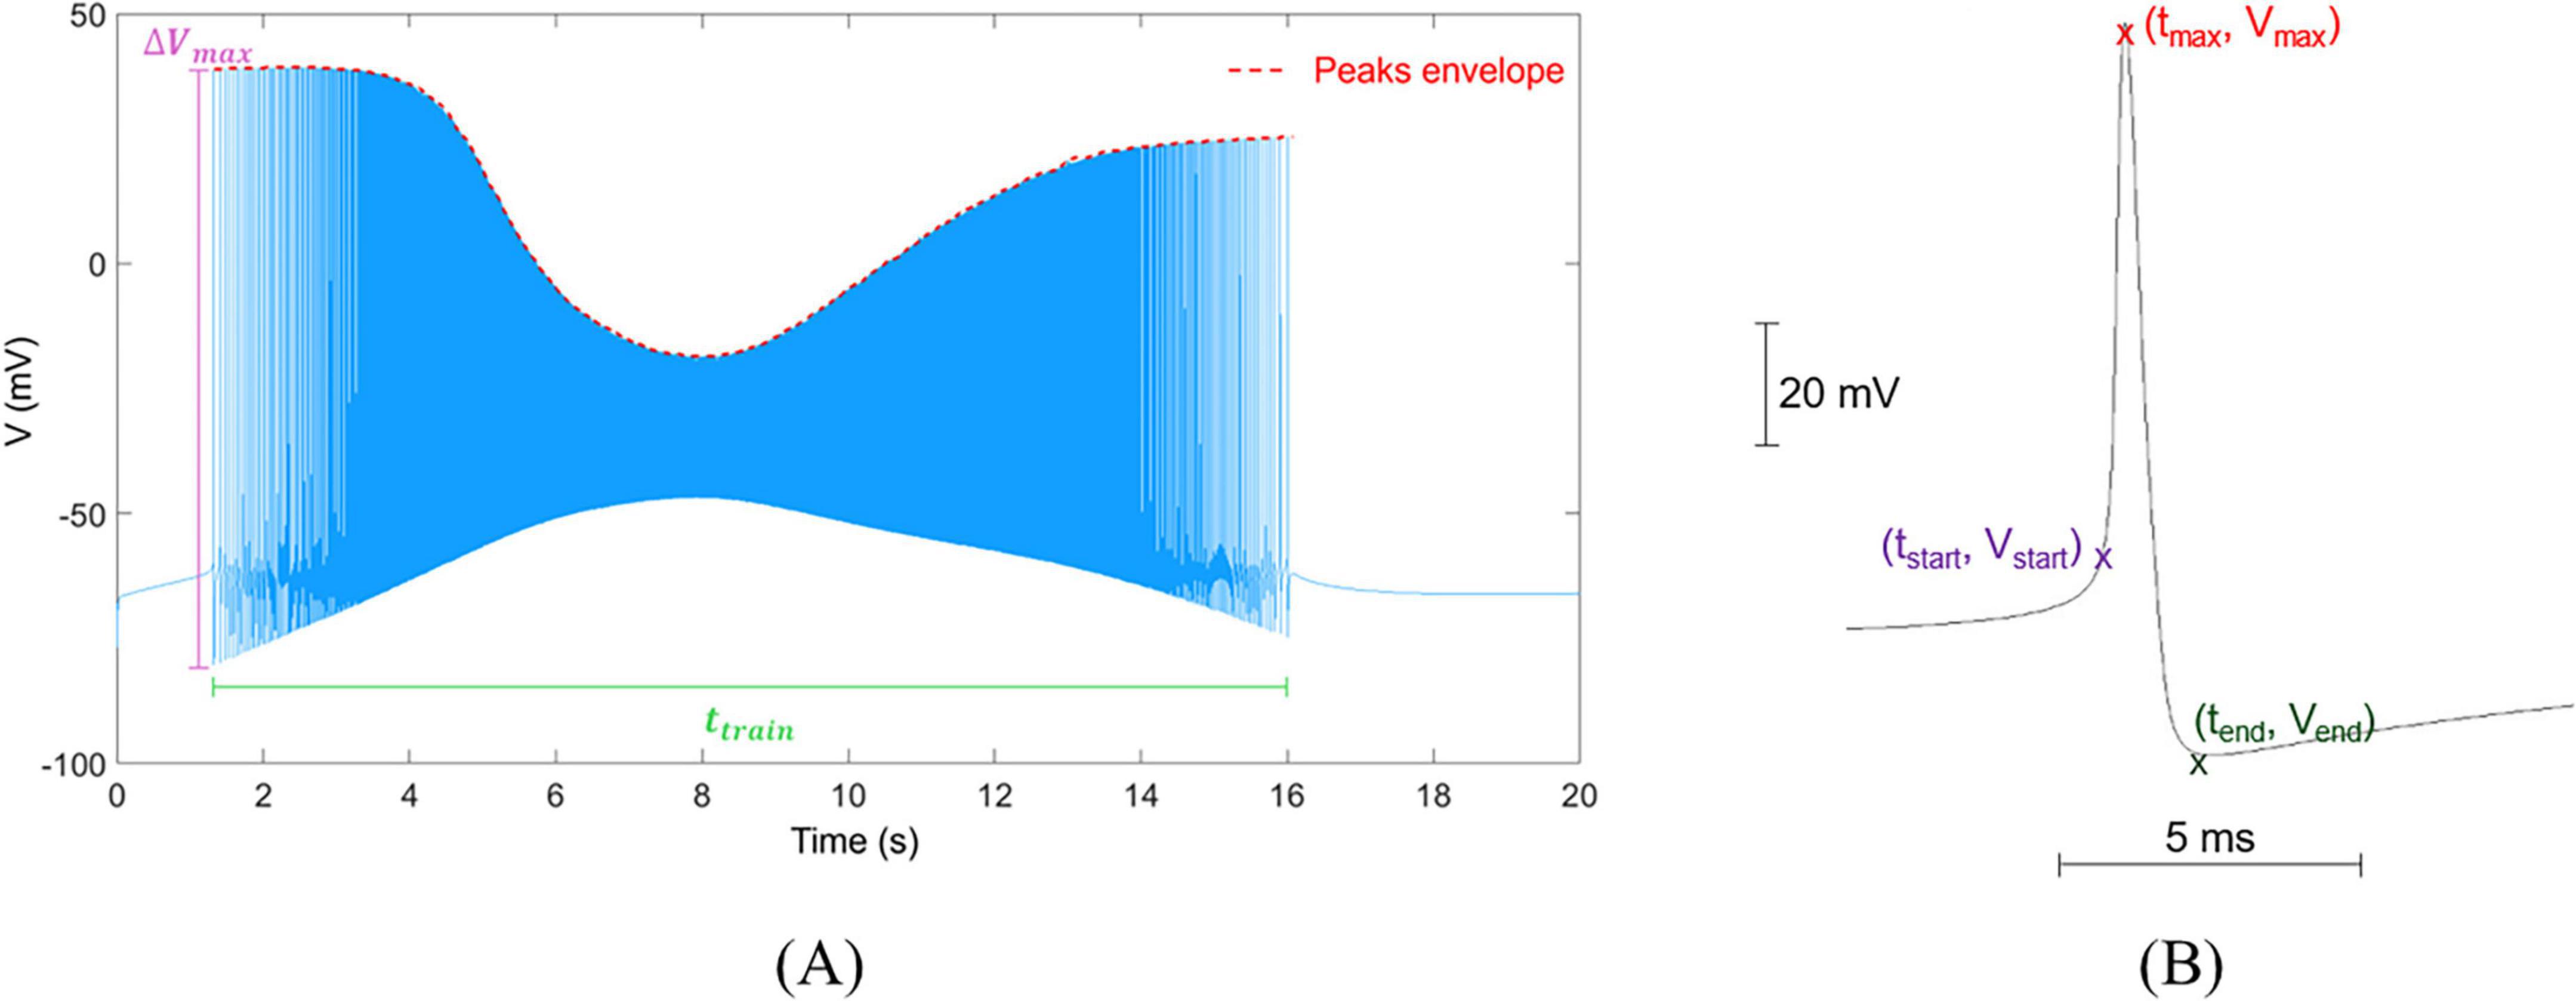
Figure 2. Visual representation of trains and single spikes, and their metrics. (A) Example of a spike train simulated for a single neuron, in which membrane voltage V (mV) varies in time (s). The plot reports the parameters used to calculate AR and DR: Δ Vmax is the maximal peak-to-peak amplitude, ttrain is the time duration of the train, and the peak envelope is used to calculate the average value of its first derivative, α. (B) Waveform of a single spike isolated from the train with indication of reference points for calculating its electrophysiological characteristics (vpp, rr and fr).
We separately assessed the correlation of each of the three metrics–ttrain, AR and DR—with the boundary O2 concentration c0 and the medium height h by computing the non-parametric Spearman coefficient (significance level of 0.05).
The shape of single spikes was also evaluated, calculating the peak-to-peak amplitude (vpp = vmax−vmin, expressed in mV), rise rate (rr = (vmax−vstart)/(tmax−tstart), in mV s–1) and fall rate (fr = (vmax−vend)/(tmax−tend) in mV s–1), where tmax is calculated as the time corresponding to the maximum of the spike (Figure 2B; Ghaderi et al., 2018; Zaitsev et al., 2012).
Finally, to describe the features of the spikes fired by single neurons as a function of the balance between diffusive O2 supply and its consumption by the neurons irrespective of the specific setup of the simulation, we exploited the Thiele Modulus, Φ2. Specifically, Φ2 is defined as the ratio between the characteristic diffusion (τd) and reaction (τr) times. Since metabolism and firing occur simultaneously in the neuron domain, the reaction dynamics is driven by the faster of the two phenomena. Given that the reaction is described by the sum of two rates (Eq. 2), Φ2 can be formulated as follows:
where τnf and τf indicate the characteristic times of basal and firing-related O2 consumption, respectively. Refer to Supplementary Text 2 for further details on the derivation of Eq. (23). The shape metrics of the spike trains–AR and DR−were then also evaluated as a function of Φ2.
2.4 Assessment of digitoids performance
2.4.1 Digitoids versus experimental data
Digitoids performance was evaluated using the experimental data presented in Ballesteros-Esteban et al. (2023), following the pipeline shown in Figure 3. In ref. (Ballesteros-Esteban et al., 2023), the authors describe the morphology and the electrophysiological activity of neuron networks in vitro. The network activity was recorded via a MEA, and the mean Firing Rate (mFR) as well as the event synchronization were extracted. The topological evolution of the networks was mapped to a network graph, where neurons are represented as vertices and their physical connections as edges, and the SW metrics were defined. Their experimental setup and SW metrics are detailed in Supplementary Tables 1, 2, and a more in-depth description of the experimental set-up and procedures is provided in Supplementary Text 4. In our work, measurements from Day In Vitro (DIV) 11 to DIV 16—i.e., when the network exhibits a SW layout (Ballesteros-Esteban et al., 2023) —were exploited, without the intention of mapping the temporal evolution of the in vitro neuronal cultures. Given the number of vertices and edges for those DIVs reported in Ballesteros-Esteban and co-workers and the metrics characterizing the networks, the adjacency matrix was obtained through the Watts-Strogatz method, setting the rewiring probability to 0.5 (Watts and Strogatz, 1998). Three SW graphs were obtained for each DIV considered. The outcoming connectivity models are sparse (i.e., the number of edges is less than the possible number of edges in the order of O(q), where q is the total number of vertices), with a mean edge density (defined in Supplementary Table 2) of 2.5%, in consistence with previously reported experimental values (Antonello et al., 2022; Downes et al., 2012).
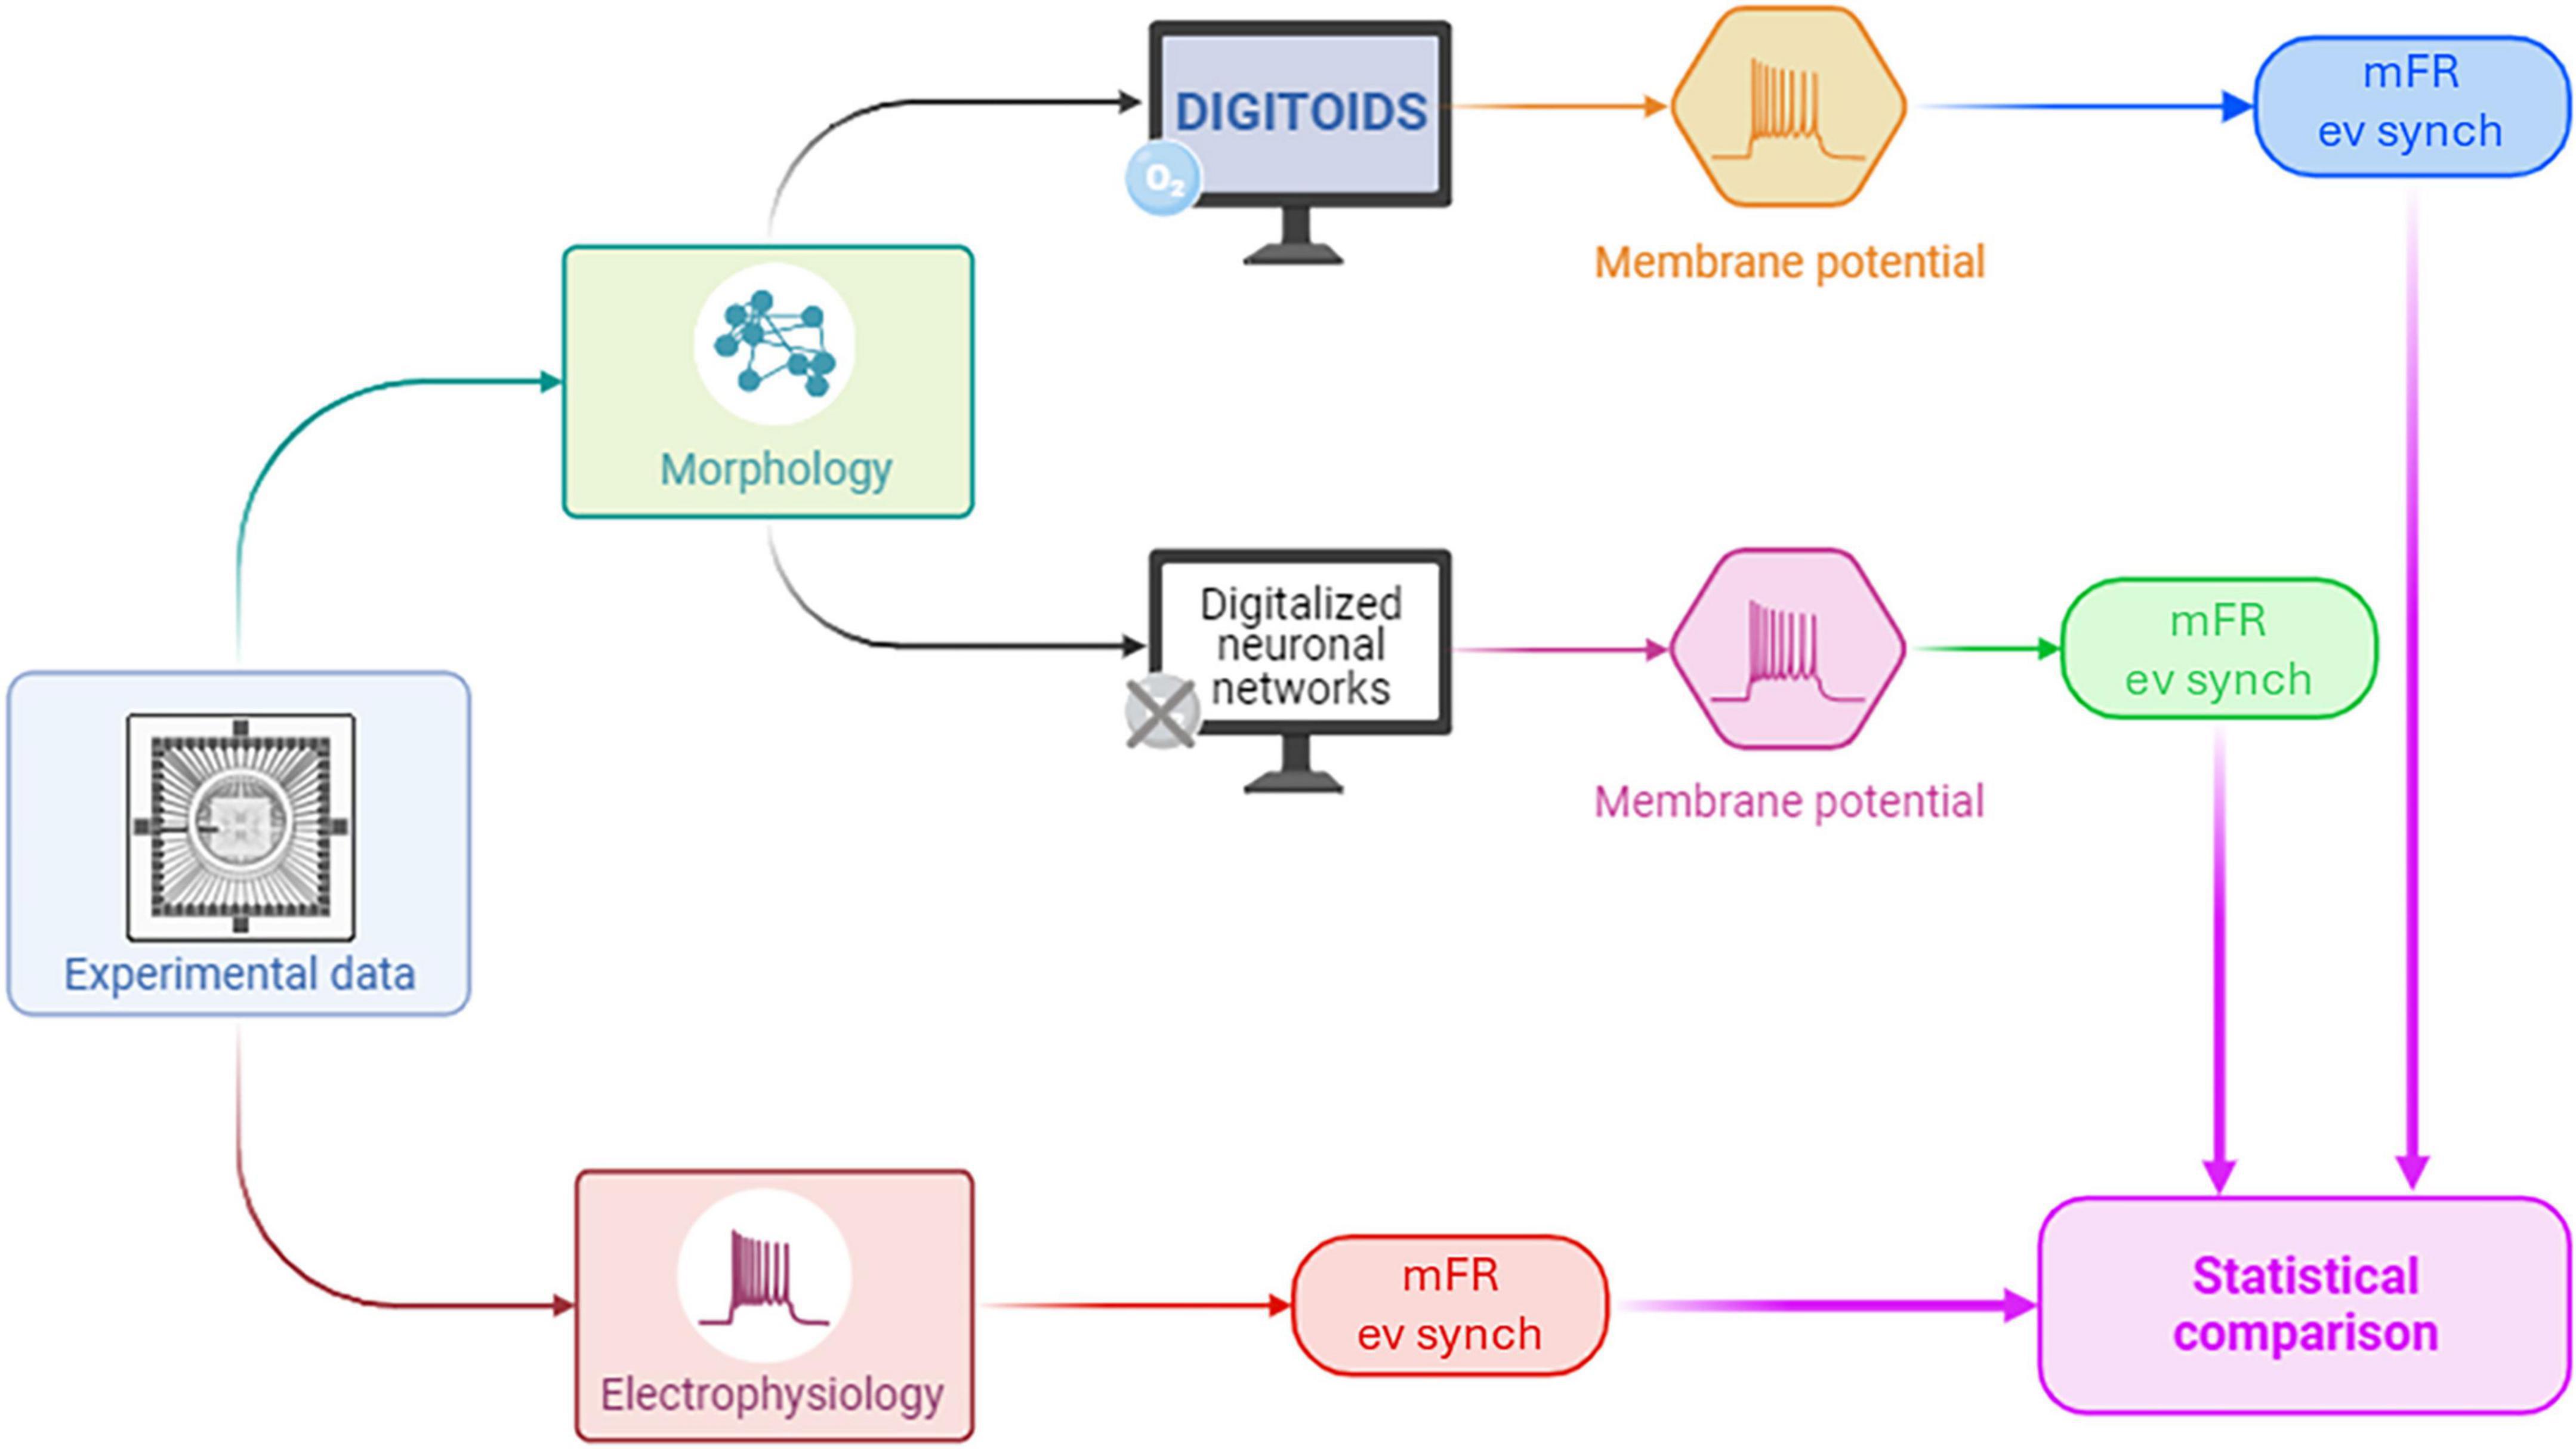
Figure 3. The pipeline adopted for assessing the performance of Digitoids using experimental data. Experimental topological parameters from neurons cultured on MEAs were used to build the Digitoids and the HH (i.e., O2-independent models) neuronal networks. The Digitoids and HH models were simulated, and their membrane potentials were processed in the same way as the experimental electrophysiological data to extract mFR. Finally, mFRs from the two computational models – Digitoids and HH – and experimental neuronal cultures were statistically compared to assess whether a similarity exists.
The SW layouts and the adjacency matrices were used to generate the corresponding Digitoids. The layouts, along with their number of vertices and edges, are reported in Supplementary Table 3, while the model parameters are listed in Table 3. The same SW layouts were used to build in silico neuronal networks where the traditional HH model was implemented instead of the O2-dependent one, described in Section 2.1.2. The single-neuron description was obtained by imposing the membrane pump to work optimally, i.e., with fixed pump rate ρmax (Table 3). The current components of the model are the same of the single-neuron model (Section 2.1.2)—i.e, INa, IK and ICl−−consistently with the model developed by Wei and co-workers (Wei et al., 2014). The neurons in the computational network models are spontaneously active due to potassium concentration in the bath. All the network models were simulated for 20 s with the variable-step solver “ode15s” of Simulink, with maximal step size of 0.4.
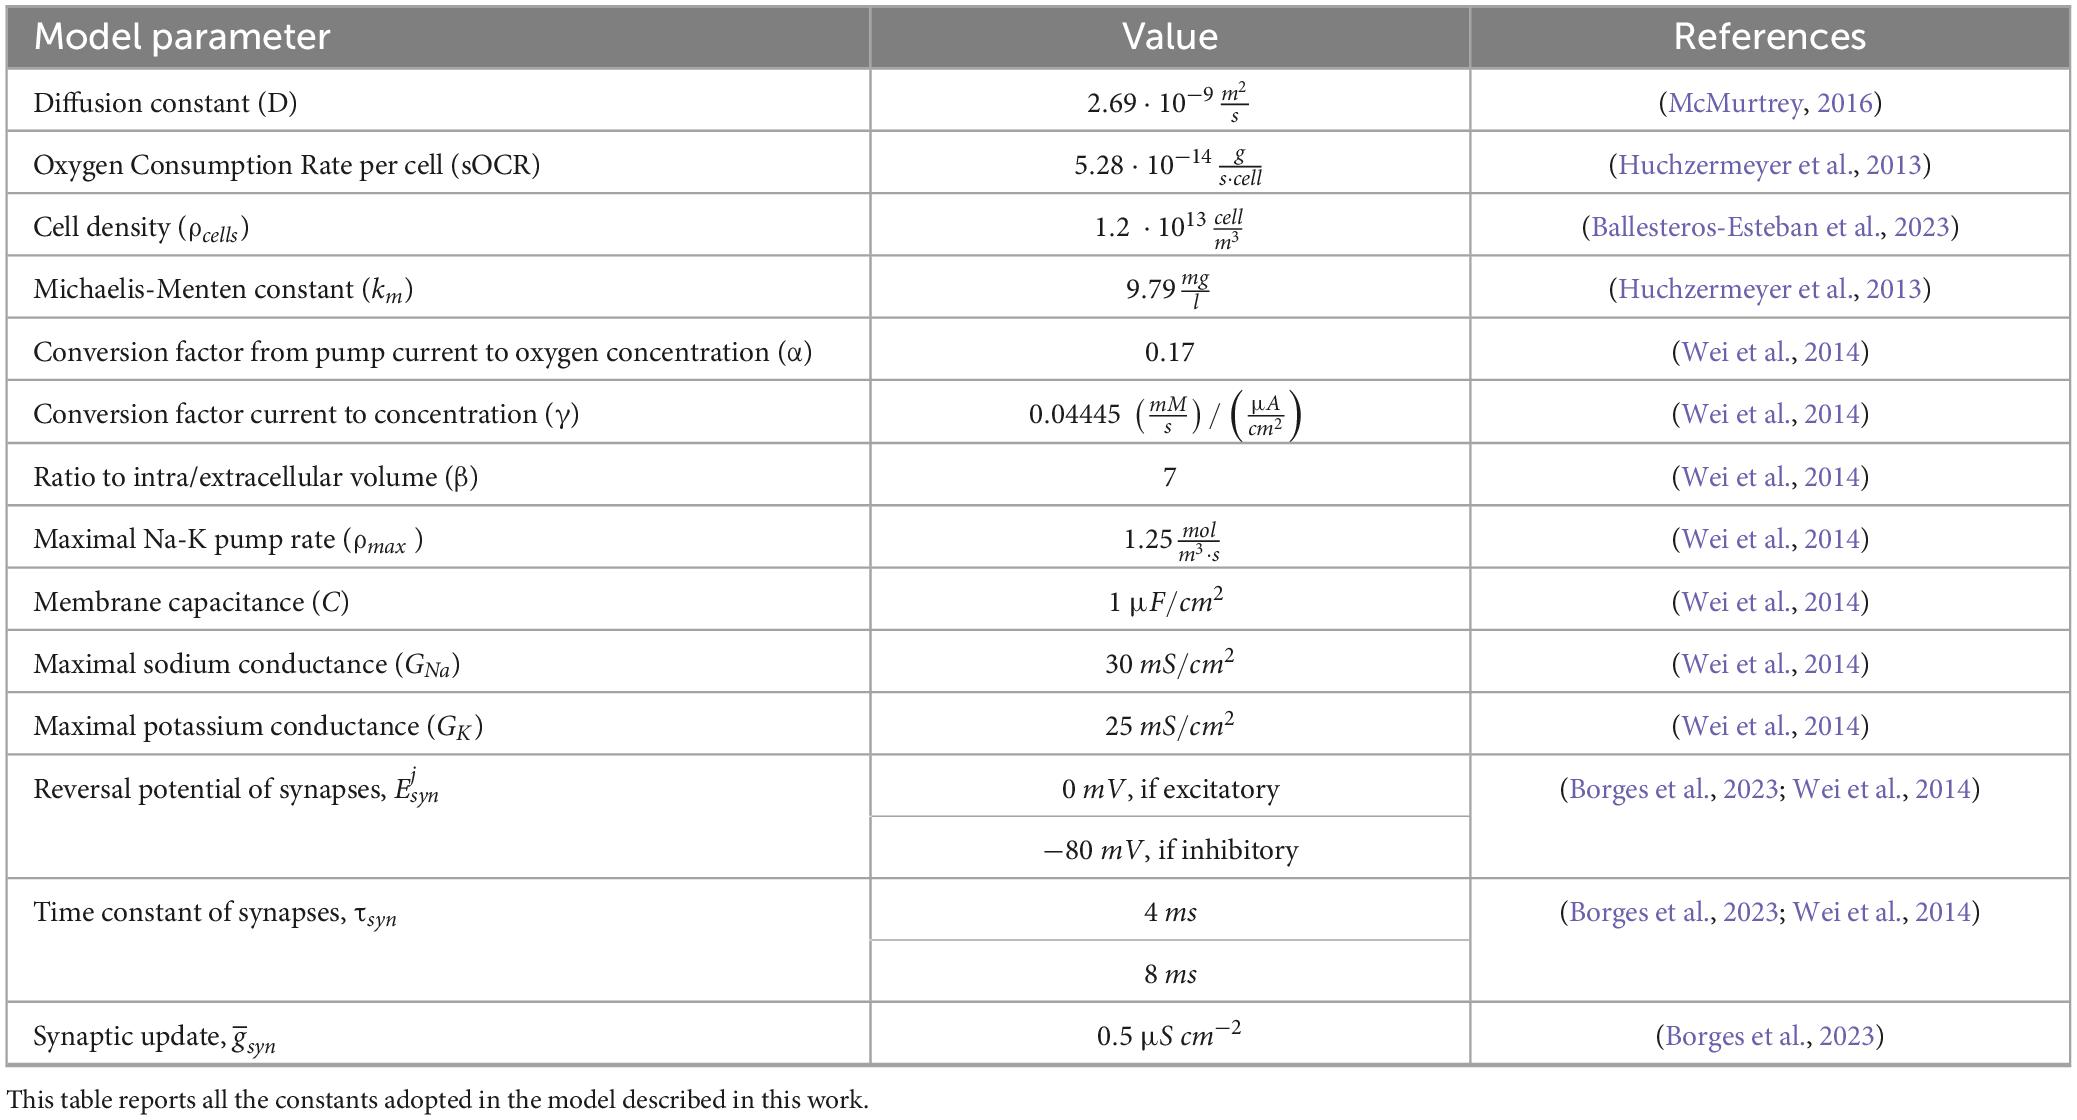
Table 3. Values of the parameters used in the model.
2.4.2 Impact of oxygen on network-level activity
Six Digitoids (with SW layout size described in Supplementary Table 3) were developed and simulated to explore the effects of O2 deprivation on the network activity. For this purpose, the six Digitoids were first simulated in normal oxygenation conditions for cell culture, i.e., considering a boundary concentration c0 = 0.2mM. Then, the same networks were simulated lowering c0 to 0.04mM, i.e., the threshold O2 concentration ensuring physiological cell functioning and survival (Berger et al., 2018).
2.5 Statistical analysis
Statistical analyses were performed using GraphPad Prism 8 (GraphPad Software, Boston, Massachusetts United States) to identify any significant differences between the mFR of the computational models and the experimental data. Thus, firstly, the distributions of mFR of the O2-dependent firing in Digitoids, the mFR experimentally measured in cultured neurons and the mFR values from the traditional HH model were tested for normality, by adopting the Shapiro-Wilk test (α = 0.05). Since the distributions were not Gaussian, the non-parametric Kruskal-Wallis test was used (α = 0.05). To compare mFR and event synchronization between the Digitoids simulated in normal (i.e., c0 = 0.2mM) and O2 deprivation (i.e., c0 = 0.04mM) conditions, the Mann-Whitney test was instead adopted (α = 0.05).
3 Results
3.1 Dependence of firing on oxygen availability
Figure 4 shows examples of the outcome of the Digitoids, i.e., the neuron membrane potential and the O2 concentration at the cell level (z = 0) taken over a time window of 20 s for different values of the boundary O2 concentration. As expected, the plots indicate that single neurons exhibit an O2-dependent firing, with reduced activity when the local concentration decreases. Indeed, when the neuron fires, the Na+-K+-ATP pump is activated, thus O2 is consumed (Eqs. 2–4), and its concentration at z = 0 decreases. Longer spike trains are generated if O2 availability is high.
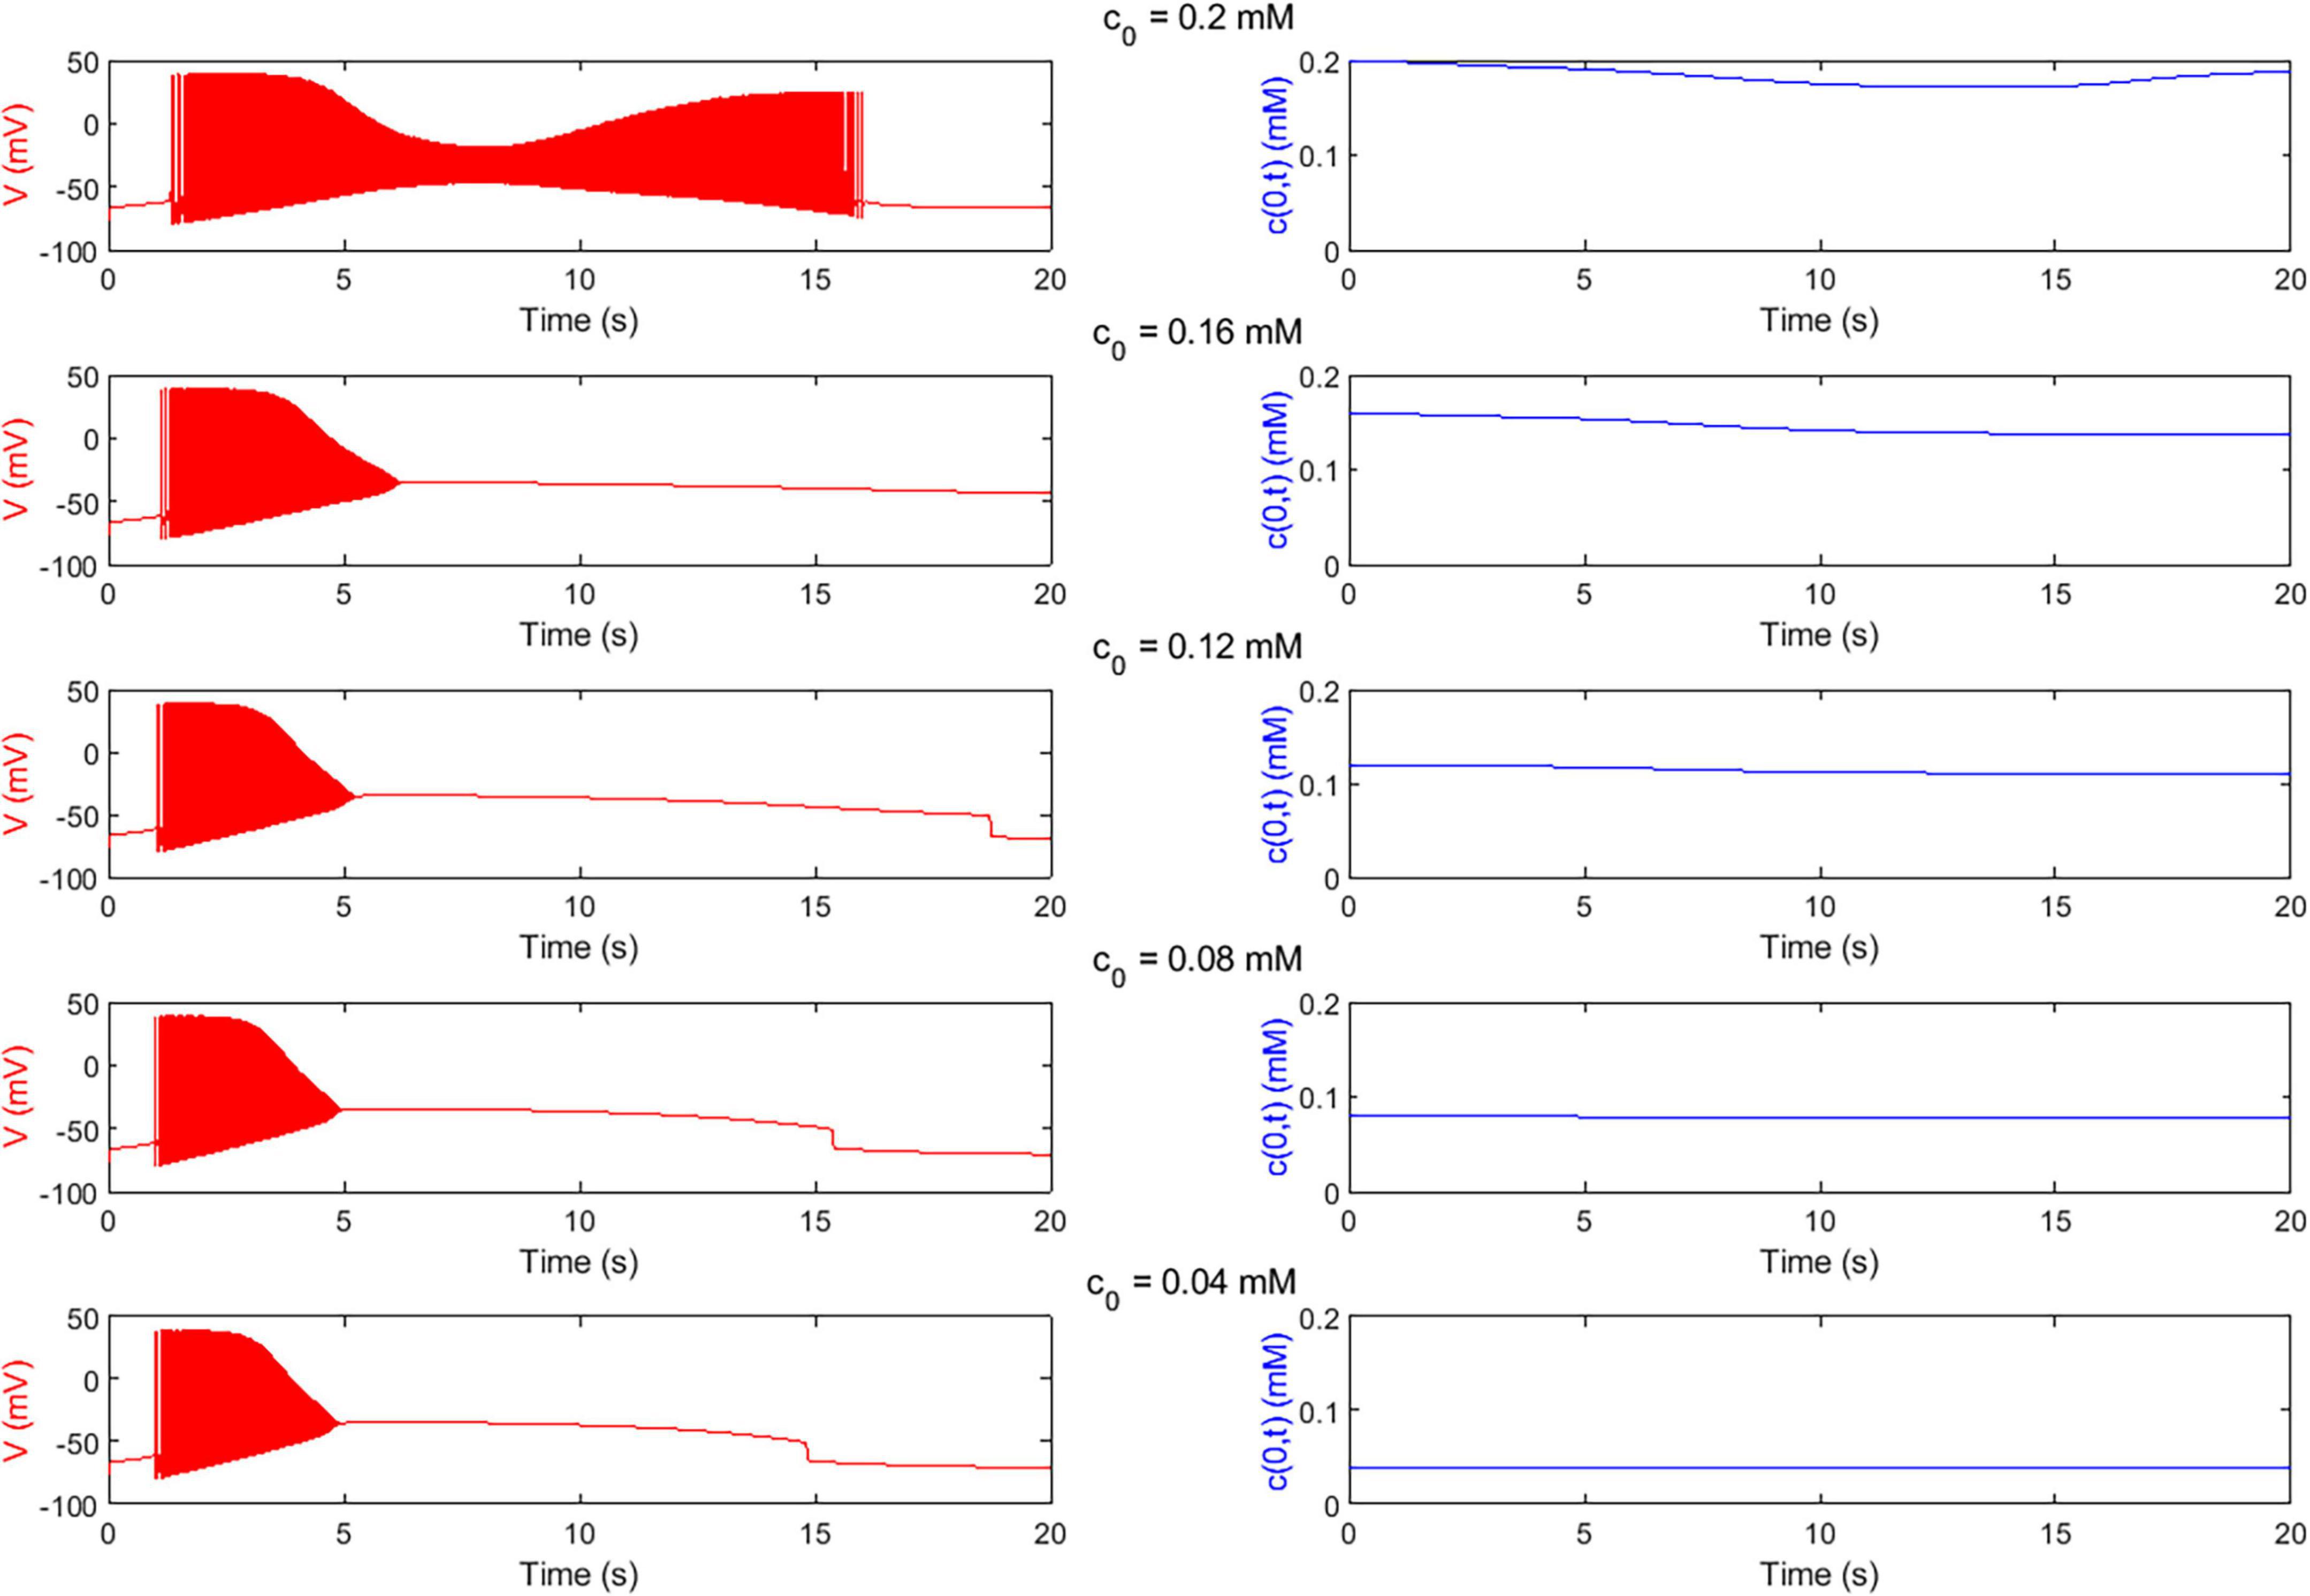
Figure 4. O2-dependent electrophysiological activity of single neurons predicted by Digitoids. Membrane potential (V, left column) and O2 concentration at the neuron level (c(0,t), right column) over the first 20 s of the simulation of the single-neuron model with h = 0.1 mm for different values of boundary O2 concentration c0 (reported in Table 2). In the upper panel, the output of the configuration with highest O2 availability is depicted. The neuron is able to fire a long train of action potentials. In correspondence of the firing, c(0,t) decreases because O2 is consumed by the cell to sustain metabolism and electrical activity.
For what concerns the sensitivity of the shape metrics to the parameters c0 and h, plots are reported in Supplementary Figures 5, 6. Specifically, Supplementary Figure 5 graphically depicts the dependence of ttrain, AR and DR (Eqs. 21 and 22) on c0 for each of the tested medium heights, while Supplementary Figure 6 reports their dependence on h parametrized with respect to c0. From the visual analysis of the plots, a monotonic relation can be identified between the parameters c0 and h–which set the availability of O2 over time to the neuron—and the train metrics. This suggests that the neuron is able to fire longer trains of action potentials when the O2 availability in the system is not a limiting factor, i.e., with highest c0 and lowest h. Furthermore, the Spearman correlation coefficient r was computed to provide a quantitative means of such dependencies. Numerical values of r are reported in Supplementary Tables 4–9 together with corresponding p-values. All the metrics display significant correlation with c0, while they significantly correlate with the medium height only when boundary O2 is maximal. Indeed, the single-neuron output is more sensitive to growing medium heights when O2 availability is not limited yet by reduced air saturation, that is c0 < 0.2 mM. Otherwise, supply constraints due to the increased diffusive path do not significantly affect the duration of spike trains.
Moreover, single spikes were identified for each combination of h and c0; for each spike, vpp, rr and fr were calculated, and their trend over time are shown in Supplementary Figures 1–3. At the beginning of the simulation (i.e., when O2 availability is high), vpp values appear independent of h and c0 (see Supplementary Figure 1). Then, vpp decreases over time with a rate depending on c0. In particular, we observed that the rate at which vpp decreases at the end of the spike train is higher for the lower values of c0. This is reported in Figure 5A, where the slope of vpp (dVpp) over the last four time points considered in the simulation is shown to better highlight the dependence on the different values of h and c0.
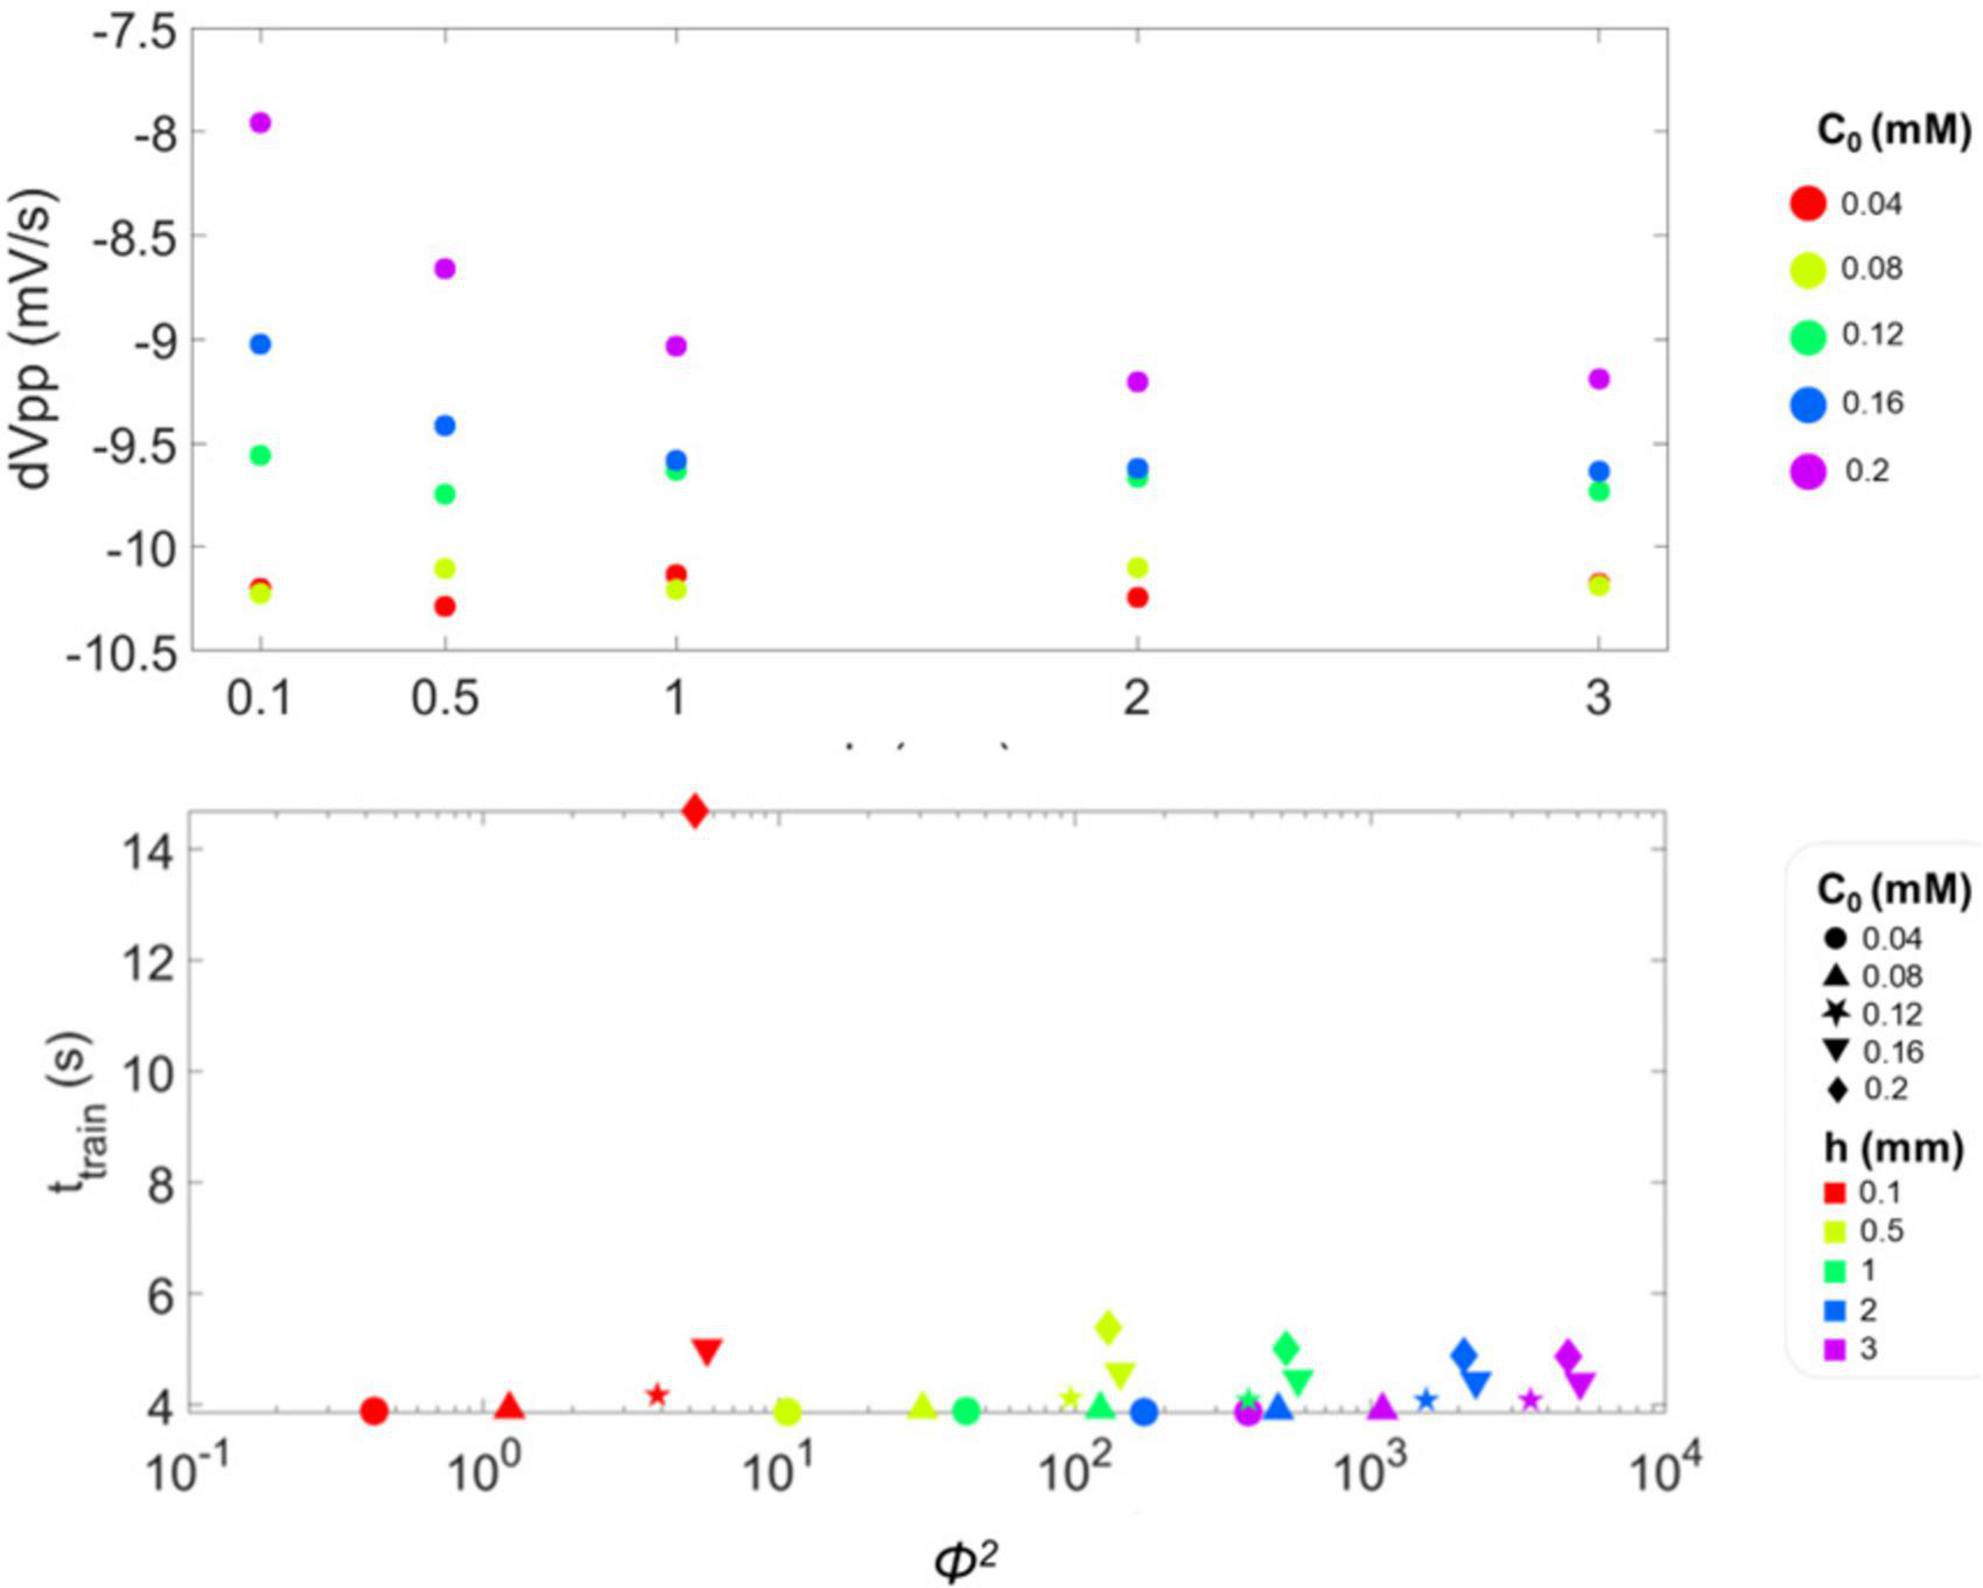
Figure 5. (A) Slope of the peak-to-peak amplitude of single spikes (dVpp) calculated for the last four points of vpp in the spike train and plotted as a function of medium height h. For the three lowest values of h − 0.5, 1 and 2 mm −, the value of dVpp is more negative when c0 is lower. This means that the train of action potentials fired by the single-neuron model is terminated with a steeper slope, i.e., faster with respect to conditions of higher c0. (B) Duration of the spike train, ttrain, as a function of Φ2, whose values are reported in log-scale. Datapoints correspond to the considered combinations of c0 and h, reported in Table 2: different symbols correspond to different values of c0, while colors to h.
Figure 5B depicts ttrain as a function of Φ2. Notably, ttrain is sensitive to the level of O2 available to the neuron, as reported in Bean (2007), since it decreases with higher Φ2 (that is with lower c0 and higher h). This implies that firing is a diffusion-limited phenomenon, which is suppressed when it cannot be energetically sustained due to O2 depletion (Nieber, 1999; Pires Monteiro et al., 2021; Santiago et al., 2023). Moreover, the dispersion of ttrain values becomes narrower with increasing Φ2, indicating that the firing threshold is governed by O2 availability, which is in turn increasingly limited by diffusion as h increases.
The same trends with respect to Φ2 are observable for DR and AR−see Supplementary Text 3 and Supplementary Figure 4 for details.
3.2 Performance of the digitoids
Figure 6 shows the mFR obtained from: (i) the experimental in vitro recordings reported in Ballesteros-Esteban et al. (2023); (ii) the output from the corresponding Digitoids; (iii) the firing activity of the network with the same topological layout but the traditional formulation of electrophysiology according to the HH model. For all the DIV considered, no statistically significant differences were found between the mFR of Digitoids and the corresponding experimental data. On the other hand, the values of mFR of the traditional O2-independent HH model were significantly different if compared to both the in vitro observations and Digitoids predictions. The associated p-values are reported in Supplementary Table 10.
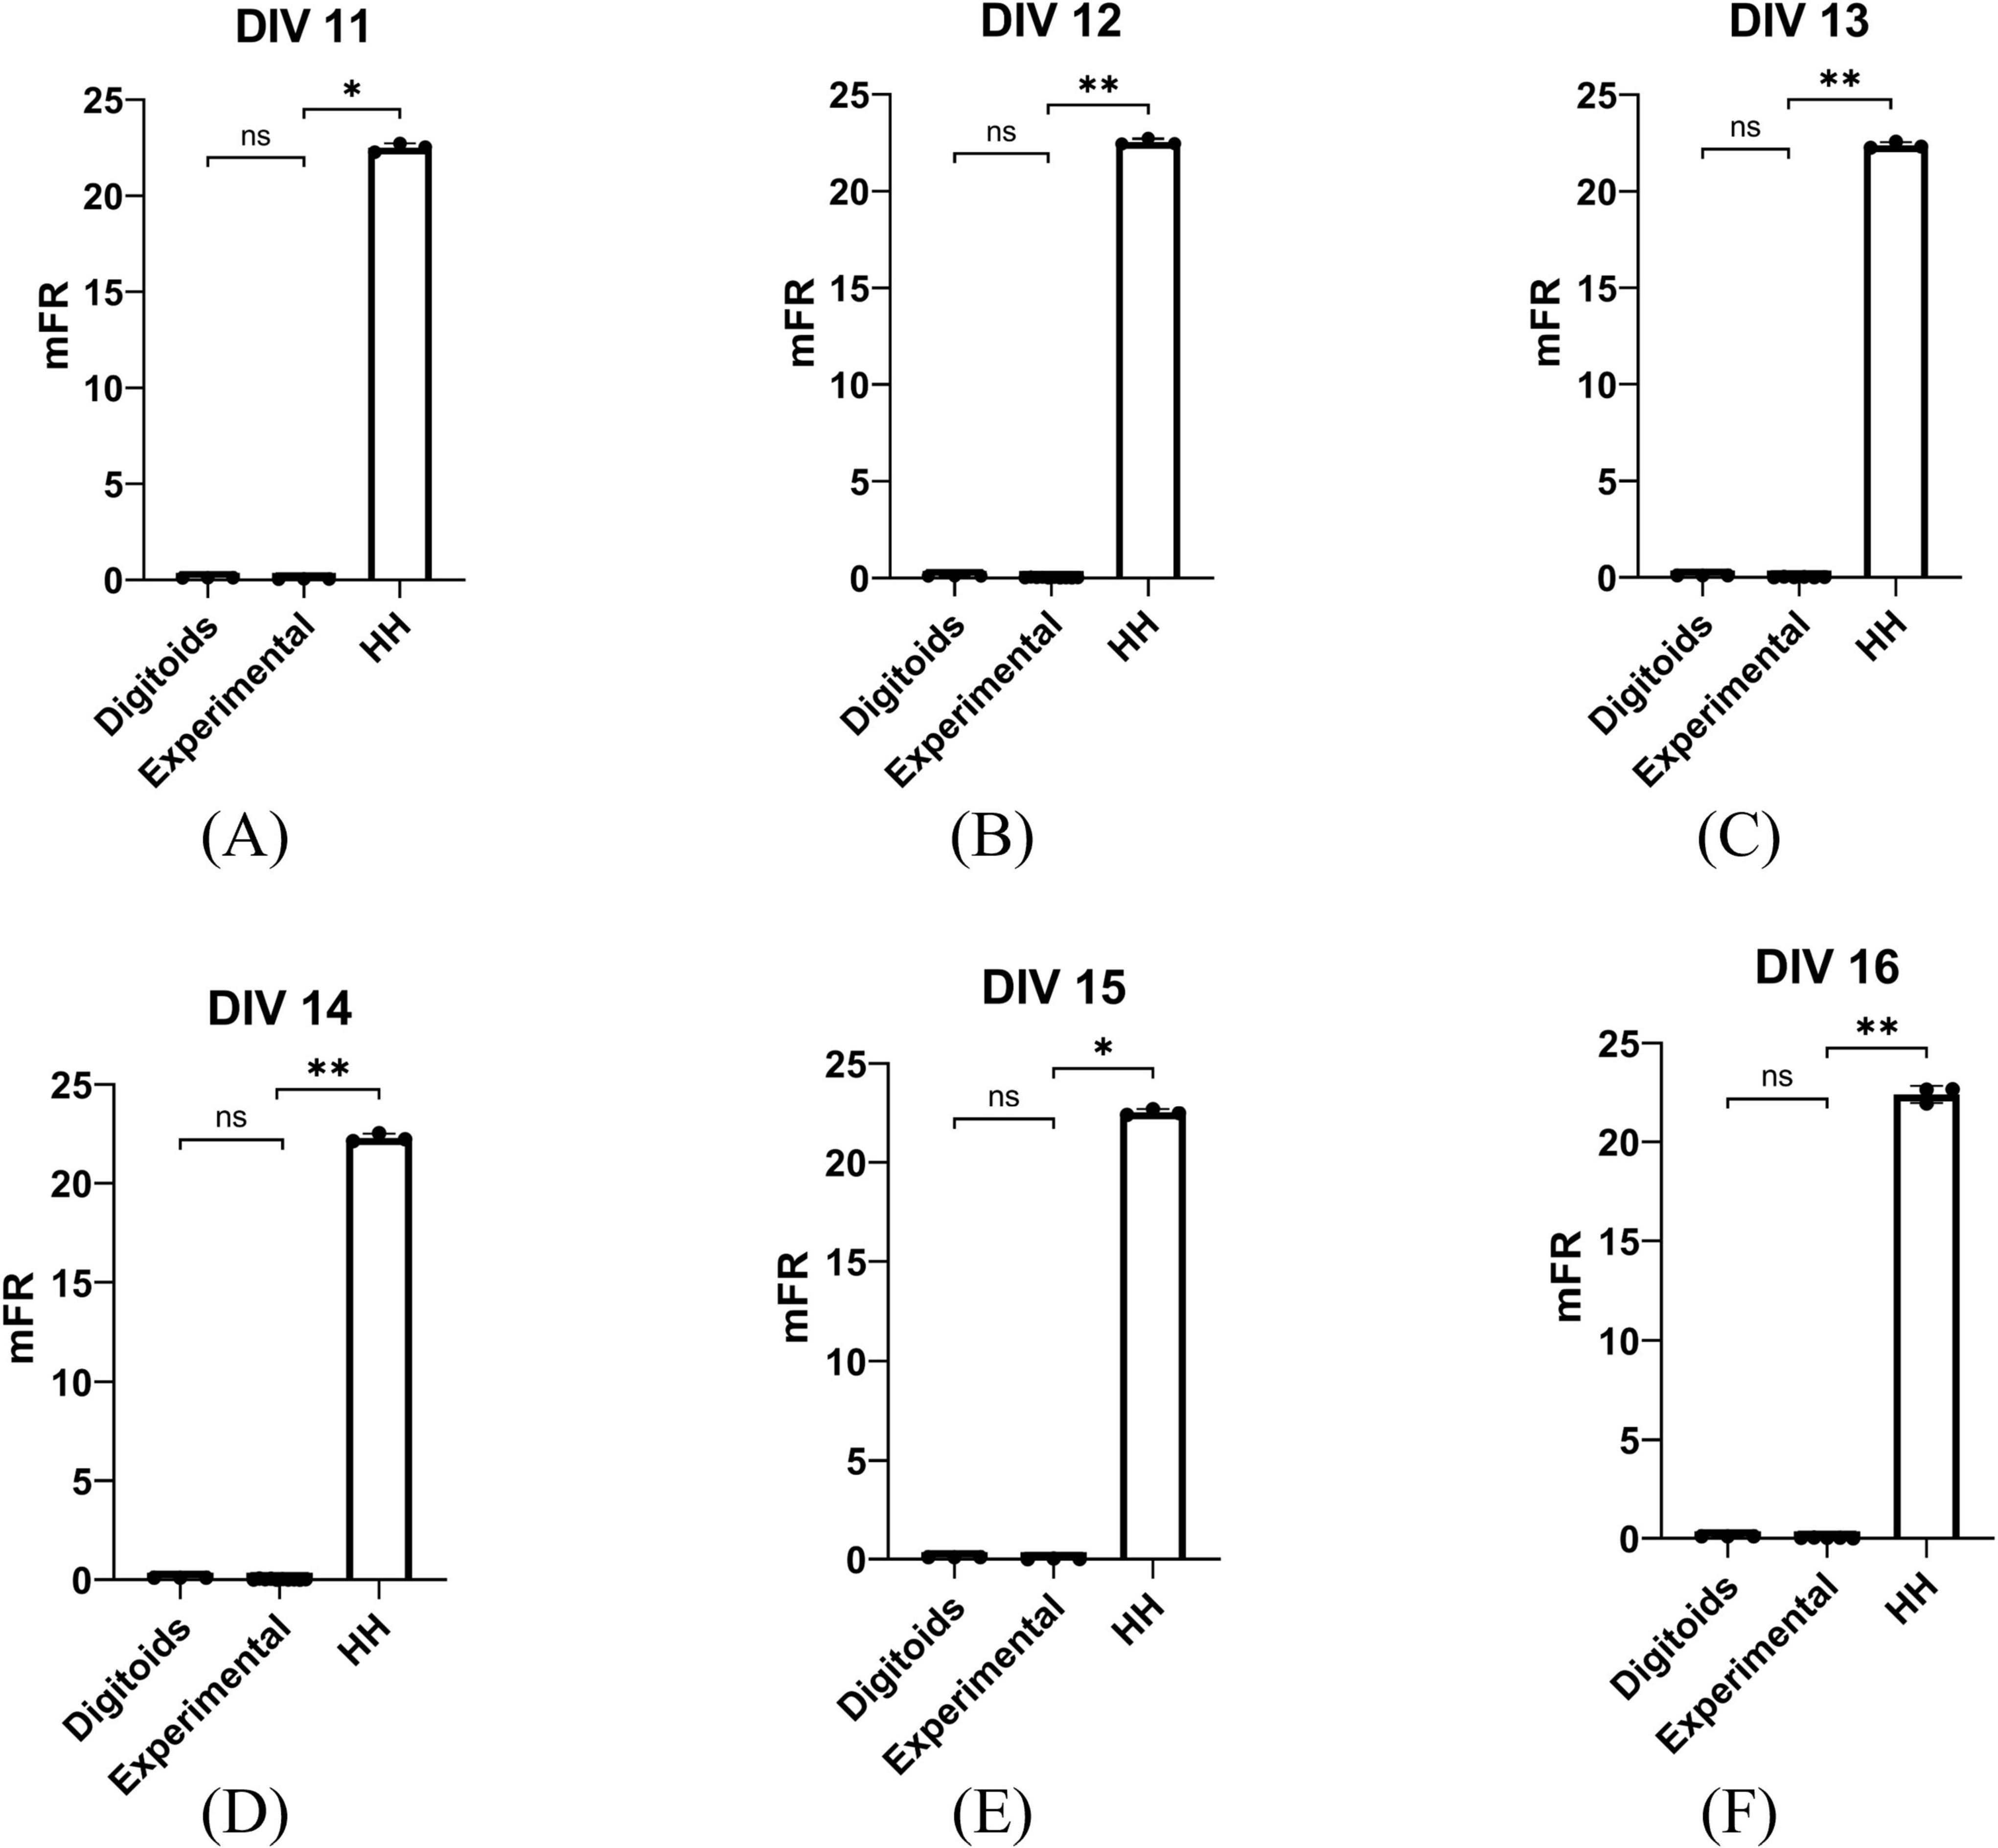
Figure 6. Statistical comparison between mFR (spikes s–1) values obtained from experimental measurements, the Digitoids and the HH model for the six different Day In Vitro (DIV) considered for analyses: (A) DIV 11, (B) DIV 12, (C) DIV 13, (D) DIV 14, (E) DIV 15, (F) DIV 16. At each DIV, mFR calculated from Digitoids and Experimental data exhibits no tatistically significant differences, while Experimental and Digitoids are always different. *p < 0.05, **p < 0.005.
Further, the whole-network effect of O2 deprivation on mFR predicted by Digitoids is shown in Figure 7A. When accounting for reduced O2 availability (c0 = 0.04mM), Digitoids coherently predicted significantly lower mFR than that obtained for c0 = 0.2mM. The event synchronization was also evaluated in such conditions. Also in this case, O2 deprivation lowers the predicted synchronization values, with significant differences with respect to values predicted by the Digitoids with normoxic conditions (Figure 7B).
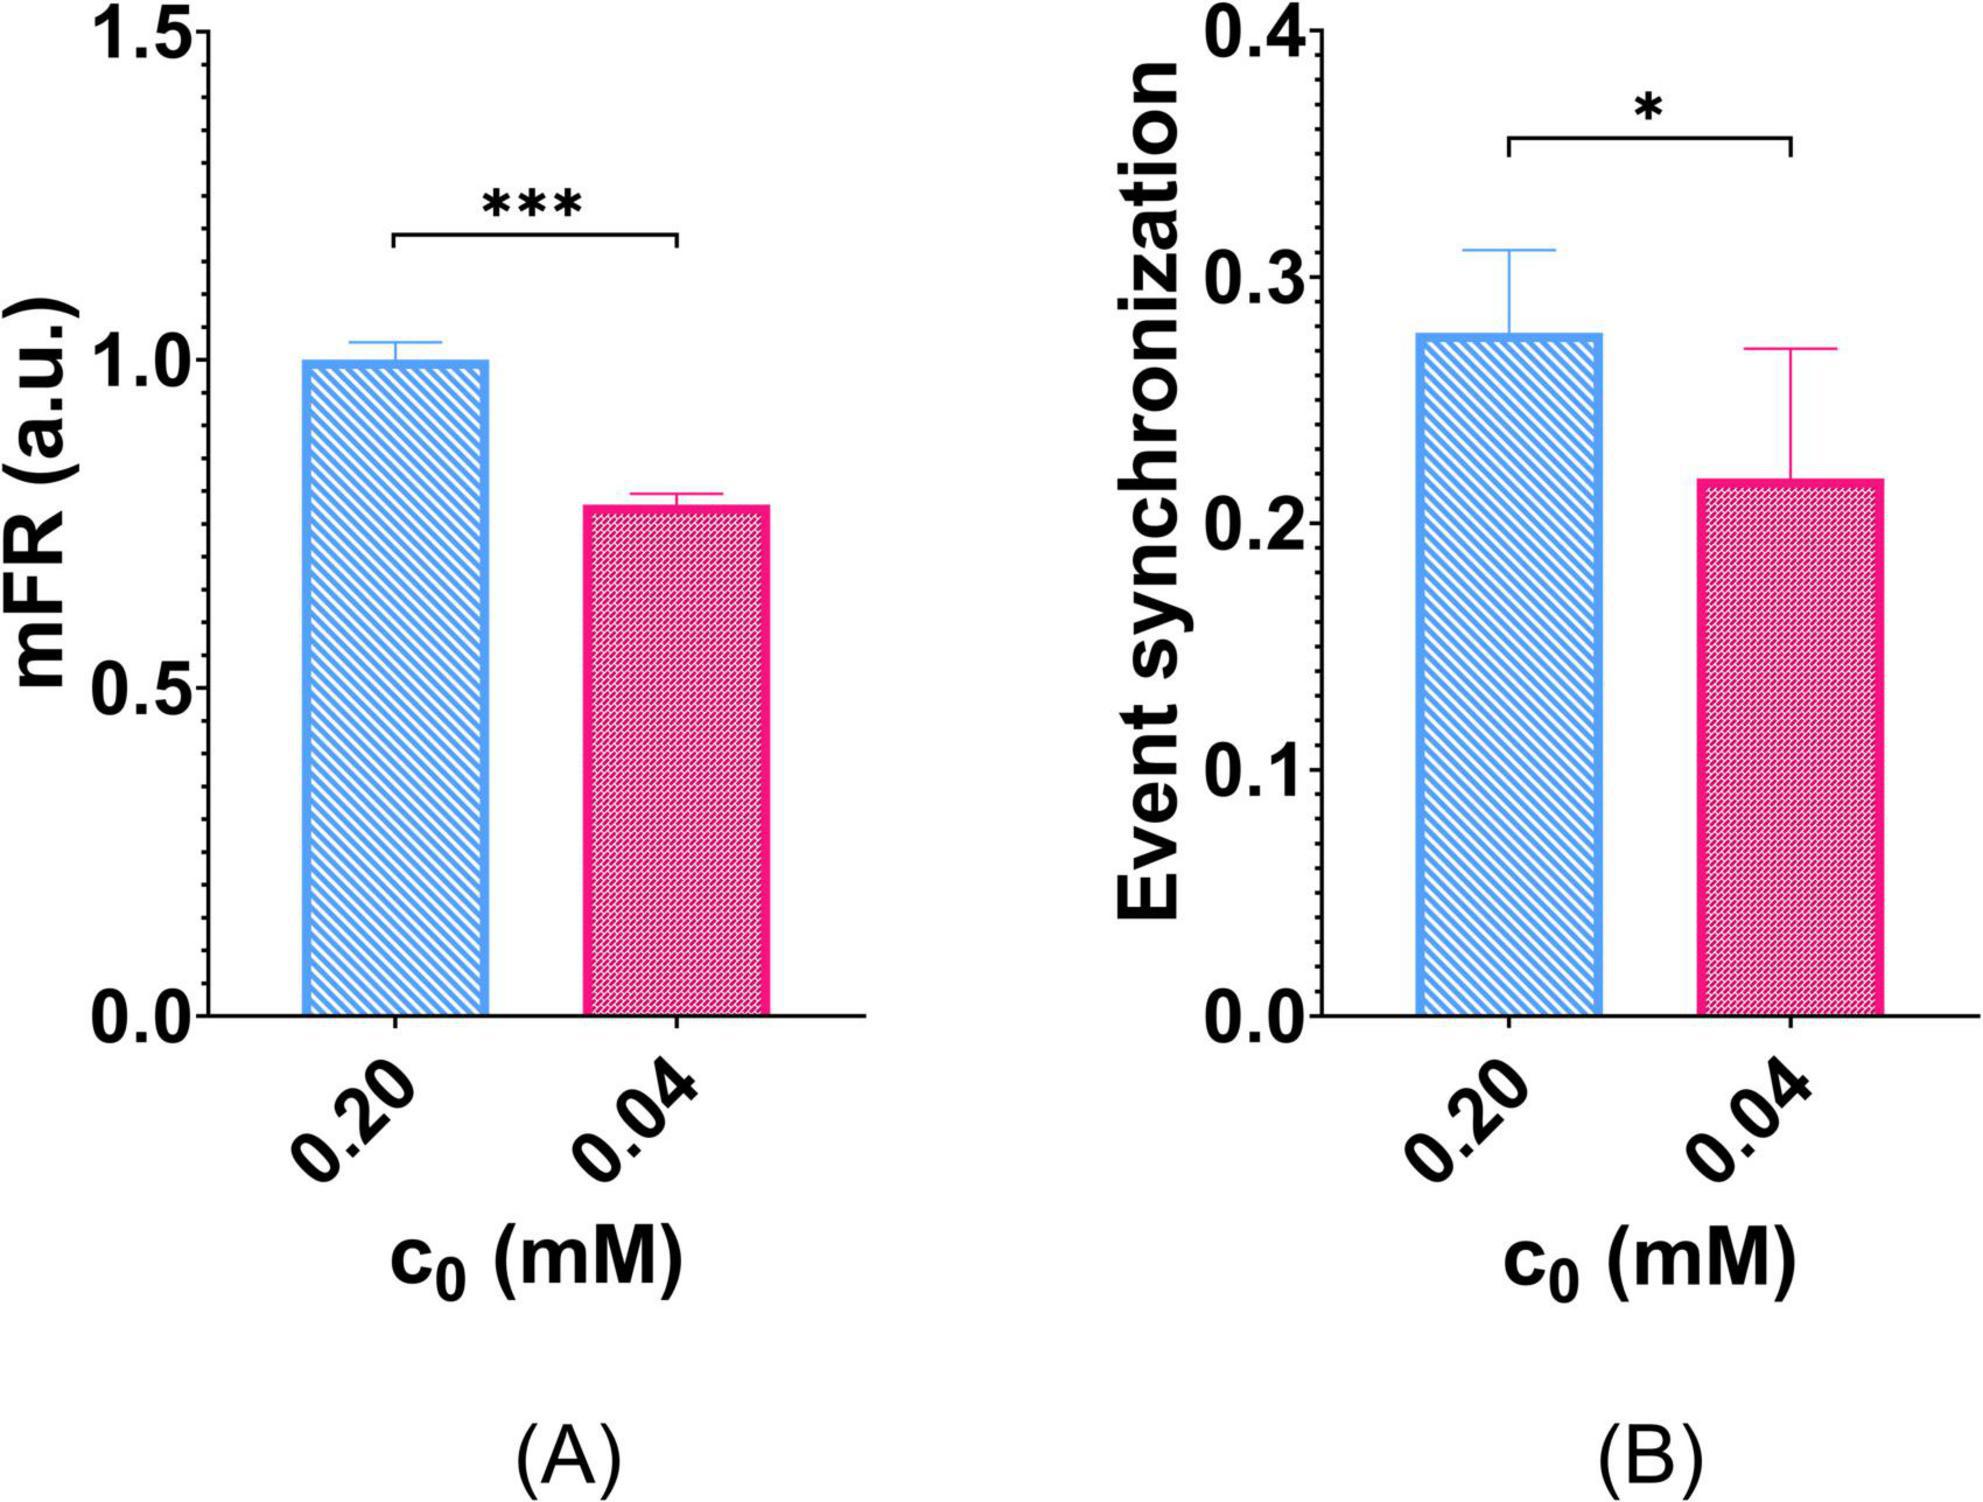
Figure 7. Effects of O2 deprivation on network activity. Six Digitoids were simulated with normal O2 and with deprived O2 in culture medium to compare their mFR. (A) mFR is significantly reduced when the networks are simulated in O2 deprivation conditions. mFR values are reported in a.u. since they were normalized for the average value calculated in normoxic conditions (i.e., c0 = 0.20mM). ***p < 0.001. (B) O2 deprivation also reduces the event synchronization of the networks, with statistically significant differences with respect to the normoxic condition. *p < 0.05.
Supplementary Figure 7 depicts an example of the event synchronization calculated from one of the simulated Digitoids.
4 Discussion
O2 levels are crucial to neuronal function in vitro: they significantly affect viability, oxidative stress and mitochondrial function (Zhu et al., 2012). However, the influence of O2 on in vitro electrophysiological behavior is often neglected. In this work, we developed a computational platform—Digitoids—able to replicate a neuronal network in vitro. Digitoids embeds a model of neuron firing in which the O2 dynamics of diffusion and consumption are introduced and coupled with ionic transport across the cell membrane. The novelty of the proposed model resides in the coupling of O2 diffusion and consumption dynamics with neuronal electrical activity. Thanks to this approach, different culture conditions and layouts can be replicated obtaining descriptions of O2-dependent activity tailored on the specific system under study.
To demonstrate the importance of O2 in neuron firing, we computed different metrics of the spike train as well as of single spikes and assessed their dependency on O2 availability. Overall, the observed trends confirm that the electrophysiological behavior of single neurons is modulated by O2 supply. These results are supported by the significant correlation between the train metrics and the boundary O2 concentration, c0. Interestingly, neuron firing was found to be less sensitive to O2 fluctuations in conditions of limited resource availability (i.e., for high Φ 2 values). Indeed, reduced—or even non-significant—correlation coefficients of spike train characteristics with medium height are found when boundary O2 does not correspond to air saturation (i.e., c = 0.2 mM).
This behavior can be explained considering that reduced O2 hinders the homeostatic maintenance of ion concentrations between the intra and extracellular environments, which is responsible for sustaining the electrical activity of the neuron, as reported for both brain slices and in vitro cultures exposed to hypoxia (Brisson et al., 2013; Fiskum et al., 2021; Pires Monteiro et al., 2021; Spong et al., 2016; Zanelli et al., 2015). Under these conditions, the Na+-K+-ATP pump lacks sufficient resources to fuel ion transport, and thus firing decreases or even ceases (Nieber, 1999). The preliminary results obtained simulating O2 deprivation at the network level corroborate this evidence, suggesting that cells reduce their electrical activity and synchronization than in standard oxygenation at both the single-neuron and whole-network scale. These results are consistent with studies which reported reduced firing rate of cultured neurons when exposed to hypoxia (Fiskum et al., 2021; Hofmeijer et al., 2014).
As a first preliminary assessment of the goodness of Digitoids predictions, we compared the simulated firing rate to that measured in neuronal networks seeded on commercial MEAs. No statistically significant differences were found between the experimentally measured mFRs and those predicted by Digitoids. Additionally, we compared the mFRs observed in vitro to predictions by the classic HH model applied to the same network layouts. The results are significantly different, highlighting that the mutual influence between local O2 concentration and the ion pump activity affects electrophysiological dynamics, as also captured by the analyses performed on the single-neuron output. It is worth highlighting that for Digitoids and experimental data the mFR is much lower than in the traditional HH model. In the latter, the initial values of simulation parameters (described in Section 2.4) indeed induce neurons to fire longer trains of APs, which are not limited by reduced O2 availability. Including O2 dynamics instead allows Digitoids to mimic its potential deprivation due to neuronal uptake, hindering the cross-membrane transport of ions as the energetic demand of membrane pumps cannot be satisfied.
The platform is designed to be modular and adaptable to different culture conditions by tuning the cell metabolic and electrophysiological parameters. More complex models of neuronal cultures, (e.g., co-cultures) can be developed by adding different single-cell blocks to the Simulink library to mimic other neural phenotypes. Following the approach described in Callegari et al. (2023), three-dimensional (3D) neuronal constructs can also be built by overlaying monolayers on each other. Thus, Digitoids can be extended to the simulation of neurospheres and cerebral organoids (Poli et al., 2019), supporting the investigation of their biophysical mechanisms. These constructs are particularly susceptible to O2 availability, as its depletion can lead to the formation of non-viable cores, hindering the development of mature traits and of a 3D neural network (Poli et al., 2019).
It is important to note that the experimental data used for comparison were derived from insect neurons, while the model parameters are typical of mammalian neurons. Nevertheless, the fundamental mechanisms underlying spike generation are similar across different species (Spong et al., 2016), and invertebrates are widely used to advance our understanding of more complex organisms (Newcomb et al., 2023; Sattelle and Buckingham, 2006). A more in-depth validation of our platform would require parallel recordings of electrophysiological and O2 dynamics in in vitro neurons. Specifically, perturbations will be added in the model and the predicted output will be compared to an experimental setting where the same perturbation is introduced (e.g., incubator O2 level drop). Furthermore, future effort will be carried out to integrate in the model also the O2 demand of synaptic activity (Faria-Pereira and Morais, 2022). For what concerns the parameters specific of the electrophysiological model, they will be tuned to better fit the recorded electrophysiology of in vitro neurons.
To proof the feasibility of using Digitoids, we exploited topological and electrophysiological data acquired on low density cultured networks. Thus, the simulated networks involve a relatively limited number of neurons and connections. To further expand the relevance of this work, larger networks can be developed and simulated. Larger-sized Digitoids can be developed with the same approach described in this work (Section 2.4.1) by defining a bioinspired (i.e., based on biologically observed features) adjacency matrix to layout the spatial distribution of single neurons and their connections within the Simulink framework.
In conclusion, this work represents a promising first step towards creating “digital twins” of in vitro neuronal networks. The approach implemented in Digitoids can be exploited for gaining important insights into brain pathophysiology. As an example, stroke and ischemia are characterized by low O2 levels, which lead to cognitive decline, neuronal damage and cell death (Klein Gunnewiek et al., 2020; Radenkovic et al., 2024; Voogd et al., 2023). In addition, neurodegeneration is known to be intimately linked to mitochondrial—and thus bioenergetic—dysfunctions (Bustamante-Barrientos et al., 2023). Hence, Digitoids hold the potential to support, or even replace, primary neuronal cultures, as they are cost-effective, have a longer lifespan and allow high-throughput experiments that would be unfeasible in vitro (Velasco et al., 2020). Ongoing efforts include further model validation through detailed O2 and electrophysiological measurements, as well as expanding the model to include additional modules for different neuron types and 3D networks.
Data availability statement
The original contributions presented in the study are included in the article/Supplementary material, further inquiries can be directed to the corresponding authors.
Ethics statement
The manuscript presents research on animals that do not require ethical approval for their study.
Author contributions
RF: Data curation, Formal Analysis, Software, Visualization, Writing – original draft. EB: Data curation, Formal Analysis, Visualization, Writing – review & editing. AA: Supervision, Writing – review & editing. CM: Conceptualization, Funding acquisition, Methodology, Project administration, Supervision, Writing – review & editing.
Funding
The author(s) declare that financial support was received for the research and/or publication of this article. This work has received funding from the NAP project (HORIZON-EIC-2022-PathfinderOpen) under grant agreement No. 101099310.
Conflict of interest
The authors declare that the research was conducted in the absence of any commercial or financial relationships that could be construed as a potential conflict of interest.
Generative AI statement
The authors declare that no Generative AI was used in the creation of this manuscript.
Publisher’s note
All claims expressed in this article are solely those of the authors and do not necessarily represent those of their affiliated organizations, or those of the publisher, the editors and the reviewers. Any product that may be evaluated in this article, or claim that may be made by its manufacturer, is not guaranteed or endorsed by the publisher.
Supplementary material
The Supplementary Material for this article can be found online at: https://www.frontiersin.org/articles/10.3389/fninf.2025.1549916/full#supplementary-material
References
Al-Ani, A., Toms, D., Kondro, D., Thundathil, J., Yu, Y., and Ungrin, M. (2018). Oxygenation in cell culture: Critical parameters for reproducibility are routinely not reported. PLoS One 13:e0204269. doi: 10.1371/journal.pone.0204269
Antonello, P. C., Varley, T. F., Beggs, J., Porcionatto, M., Sporns, O., and Faber, J. (2022). Self-organization of in vitro neuronal assemblies drives to complex network topology. eLife 11:e74921. doi: 10.7554/ELIFE.74921
Ashwin, P., Coombes, S., and Nicks, R. (2016). Mathematical frameworks for oscillatory network dynamics in neuroscience. J. Math. Neurosci. 6:92. doi: 10.1186/S13408-015-0033-6
Attwell, D., and Laughlin, S. B. (2001). An energy budget for signaling in the grey matter of the brain. J. Cereb. Blood Flow Metab. 21, 1133–1145. doi: 10.1097/00004647-200110000-00001
Ballesteros-Esteban, L. M., Leyva, I., Almendral, J. A., and Sendiña-Nadal, I. (2023). Self-organization and evolution of structure and function in cultured neuronal networks. Chaos Solitons Fractals 173:113764. doi: 10.1016/j.chaos.2023.113764
Bassett, D. S., and Bullmore, E. (2006). Small-world brain networks. Neuroscientist 12, 512–523. doi: 10.1177/1073858406293182
Bean, B. P. (2007). The action potential in mammalian central neurons. Nat. Rev. Neurosci. 8, 451–465. doi: 10.1038/nrn2148
Berger, E., Magliaro, C., Paczia, N., Monzel, A. S., Antony, P., Linster, C. L., et al. (2018). Millifluidic culture improves human midbrain organoid vitality and differentiation. Lab Chip 18, 3172–3183. doi: 10.1039/C8LC00206A
Bettencourt, L. M. A., Stephens, G. J., Ham, M. I., and Gross, G. W. (2007). Functional structure of cortical neuronal networks grown in vitro. Phys. Rev. E - Statist. Nonlinear Soft Matter Phys. 75:021915. doi: 10.1103/PhysRevE.75.021915
Borges, F. S., Protachevicz, P. R., Souza, D. L. M., Bittencourt, C. F., Gabrick, E. C., Bentivoglio, L. E., et al. (2023). The roles of potassium and calcium currents in the bistable firing transition. Brain Sci. 13:1347. doi: 10.3390/brainsci13091347
Brisson, C. D., Lukewich, M. K., and Andrew, R. D. (2013). A distinct boundary between the higher brain’s susceptibility to ischemia and the lower brain’s resistance. PLoS One 8:e79589. doi: 10.1371/journal.pone.0079589
Brosel, S., Grothe, B., and Kunz, L. (2018). An auditory brainstem nucleus as a model system for neuronal metabolic demands. Eur. J. Neurosci. 47, 222–235. doi: 10.1111/ejn.13789
Bustamante-Barrientos, F. A., Luque-Campos, N., Araya, M. J., Lara-Barba, E., de Solminihac, J., Pradenas, C., et al. (2023). Mitochondrial dysfunction in neurodegenerative disorders: Potential therapeutic application of mitochondrial transfer to central nervous system-residing cells. J. Trans. Med. 21:613. doi: 10.1186/s12967-023-04493-w
Callegari, F., Brofiga, M., and Massobrio, P. (2023). Modeling the three-dimensional connectivity of in vitro cortical ensembles coupled to micro-electrode arrays. PLoS Comp. Biol. 19:e1010825. doi: 10.1371/journal.pcbi.1010825
Chen, Y. W., Zhang, L. F., and Huang, J. P. (2007). The Watts–Strogatz network model developed by including degree distribution: Theory and computer simulation. J. Phys. Math. Theoret. 40, 8237–8246. doi: 10.1088/1751-8113/40/29/003
Chiappalone, M., Pasquale, V., and Frega, M. (2019). “Preface: In vitro neuronal networks,” in In vitro neuronal networks: From culturing methods to neuro-technological applications. advances in neurobiology, eds M. Chiappalone, V. Pasquale, and M. Frega (Berlin: Springer). doi: 10.1111/jnc.16121
Compte, A., Sanchez-Vives, M. V., McCormick, D. A., and Wang, X.-J. (2003). Cellular and network mechanisms of slow oscillatory activity (<1 Hz) and wave propagations in a cortical network model. J. Neurophysiol. 89, 2707–2725. doi: 10.1152/jn.00845.2002
de Santos-Sierra, D., Sendiña-Nadal, I., Leyva, I., Almendral, J. A., Anava, S., Ayali, A., et al. (2014). Emergence of small-world anatomical networks in self-organizing clustered neuronal cultures. PLoS One 9:e85828. doi: 10.1371/journal.pone.0085828
Di Florio, M., Iyer, V., Rajhans, A., Buccelli, S., and Chiappalone, M. (2022). “Model-based online implementation of spike detection algorithms for neuroengineering applications,” in Proceedings of the 2022 44th annual international conference of the IEEE Engineering in Medicine & Biology Society (EMBC), (Piscataway, NJ: IEEE). doi: 10.1109/EMBC48229.2022.9871444
Doorn, N., van Hugte, E. J. H., Ciptasari, U., Mordelt, A., Meijer, H. G. E., Schubert, D., et al. (2023). An in silico and in vitro human neuronal network model reveals cellular mechanisms beyond NaV1. 1 underlying Dravet syndrome. Stem Cell Rep. 18, 1686–1700. doi: 10.1016/j.stemcr.2023.06.003
Downes, J. H., Hammond, M. W., Xydas, D., Spencer, M. C., Becerra, V. M., Warwick, K., et al. (2012). Emergence of a small-world functional network in cultured neurons. PLoS Comp. Biol. 8:e1002522. doi: 10.1371/JOURNAL.PCBI.1002522
Emre Kapucu, F., Vinogradov, A., Hyvärinen, T., Ylä-Outinen, L., and Narkilahti, S. (2022). Comparative microelectrode array data of the functional development of hPSC-derived and rat neuronal networks. Sci. Data 9:120. doi: 10.1038/s41597-022-01242-4
Faria-Pereira, A., and Morais, V. A. (2022). Synapses: The Brain’s energy-demanding sites. Int. J. Mol. Sci. 23:3627. doi: 10.3390/ijms23073627
Fiskum, V., Sandvig, A., and Sandvig, I. (2021). Silencing of activity during hypoxia improves functional outcomes in motor neuron networks in vitro. Front. Integrat. Neurosci. 15:792863. doi: 10.3389/fnint.2021.792863
Gewaltig, M.-O., and Diesmann, M. (2007). NEST (NEural Simulation Tool). Scholarpedia 2:1430. doi: 10.4249/SCHOLARPEDIA.1430
Ghaderi, P., Marateb, H. R., and Safari, M.-S. (2018). Electrophysiological profiling of neocortical neural subtypes: A semi-supervised method applied to in vivo whole-cell patch-clamp data. Front. Neurosci. 12:823. doi: 10.3389/fnins.2018.00823
Gordon, J., and Amini, S. (2021). General overview of neuronal cell culture. Methods Mol. Biol. 2311, 1–8. doi: 10.1007/978-1-0716-1437-2_1
Hines, M. L., and Carnevale, N. T. (2001). Neuron: A tool for neuroscientists. Neuroscientist 7, 123–135. doi: 10.1177/107385840100700207
Hodgkin, A. L., and Huxley, A. F. (1952a). A quantitative description of membrane current and its application to conduction and excitation in nerve. J. Physiol. 117, 500–544. doi: 10.1113/JPHYSIOL.1952.SP004764
Hodgkin, A. L., and Huxley, A. F. (1952b). Currents carried by sodium and potassium ions through the membrane of the giant axon of Loligo. J. Physiol. 116, 449–472. doi: 10.1113/JPHYSIOL.1952.SP004717
Hodgkin, A. L., Huxley, A. F., and Katz, B. (1952). Measurement of current- voltage relations in the membrane of the giant axon of Loligo. J. Physiol. 116, 424–448. doi: 10.1113/JPHYSIOL.1952.SP004716
Hofmeijer, J., Mulder, A. T. B., Farinha, A. C., van Putten, M. J. A. M., and le Feber, J. (2014). Mild hypoxia affects synaptic connectivity in cultured neuronal networks. Brain Res. 1557, 180–189. doi: 10.1016/j.brainres.2014.02.027
Huchzermeyer, C., Berndt, N., Holzhü Tter, H.-G., and Kann, O. (2013). Oxygen consumption rates during three different neuronal activity states in the hippocampal CA3 network. J. Cereb. Blood Flow Metab. 33, 263–271. doi: 10.1038/jcbfm.2012.165
Humpel, C. (2015). Organotypic brain slice cultures: A review. Neuroscience 305, 86–98. doi: 10.1016/J.NEUROSCIENCE.2015.07.086
Humphries, M. D., and Gurney, K. (2008). Network “small-world-ness”: A quantitative method for determining canonical network equivalence. PLoS One 3:e0002051. doi: 10.1371/journal.pone.0002051
Hyvärinen, T., Hyysalo, A., Kapucu, E., Aarnos, L., Vinogradov, A., Eglen, S. J., et al. (2019). Functional characterization of human pluripotent stem cell-derived cortical networks differentiated on laminin-521 substrate: Comparison to rat cortical cultures. Sci. Rep. 9:17125. doi: 10.1038/s41598-019-53647-8
Izhikevich, E. M. (2003). Simple model of spiking neurons. IEEE Trans. Neural Netw. 14, 1569–1572. doi: 10.1109/TNN.2003.820440
Klein Gunnewiek, T. M., Van Hugte, E. J. H., Frega, M., Guardia, G. S., Foreman, K., Panneman, D., et al. (2020). m.3243A > G-Induced mitochondrial dysfunction impairs human neuronal development and reduces neuronal network activity and synchronicity. Cell Rep. 31:107538. doi: 10.1016/j.celrep.2020.107538
Kuznetsov, A. V. (2024). Effects of time-dependent adenosine triphosphate consumption caused by neuron firing on adenosine triphosphate concentrations in synaptic boutons containing and lacking a stationary mitochondrion. J. Biomechan. Eng. 146:111002. doi: 10.1115/1.4065743
Lenk, K., Satuvuori, E., Lallouette, J., Ladrón-de-Guevara, A., Berry, H., and Hyttinen, J. A. K. (2020). A computational model of interactions between neuronal and astrocytic networks: The role of astrocytes in the stability of the neuronal firing rate. Front. Comp. Neurosci. 13:92. doi: 10.3389/fncom.2019.00092
Lennie, P. (2003). The cost of cortical computation. Curr. Biol. 13, 493–497. doi: 10.1016/S0960-9822(03)00135-0
Lonardoni, D., Di Marco, S., Amin, H., Berdondini, L., and Nieus, T. (2015). A computational model of cell culture dynamics: The role of connectivity and synaptic receptors in the appearance of synchronized bursting events. BMC Neurosci. 16:177. doi: 10.1186/1471-2202-16-S1-P177
Magliaro, C., Rinaldo, A., and Ahluwalia, A. (2019). Allometric scaling of physiologically-relevant organoids. Sci. Rep. 9:11890. doi: 10.1038/s41598-019-48347-2
Markram, H., Muller, E., Ramaswamy, S., Reimann, M. W., Abdellah, M., Sanchez, C. A., et al. (2015). Reconstruction and simulation of neocortical microcircuitry. Cell 163, 456–492. doi: 10.1016/j.cell.2015.09.029
Masoli, S., Rizza, M. F., Tognolina, M., Prestori, F., and D’Angelo, E. (2022). Computational models of neurotransmission at cerebellar synapses unveil the impact on network computation. Front. Comp. Neurosci. 16:1006989. doi: 10.3389/fncom.2022.1006989
Masquelier, T., and Deco, G. (2013). Network bursting dynamics in excitatory cortical neuron cultures results from the combination of different adaptive mechanism. PLoS One 8:e75824. doi: 10.1371/journal.pone.0075824
McMurtrey, R. J. (2016). Analytic models of oxygen and nutrient diffusion, metabolism dynamics, and architecture optimization in three-dimensional tissue constructs with applications and insights in cerebral organoids. Tissue Eng. Part C Methods 22, 221–249. doi: 10.1089/ten.TEC.2015.0375
Negri, J., Menon, V., and Young-Pearse, T. L. (2020). Assessment of spontaneous neuronal activity in vitro using multi-well multi-electrode arrays: Implications for assay development. Eneuro 7:ENEURO.0080-19.2019. doi: 10.1523/ENEURO.0080-19.2019.
Newcomb, J. M., Todd, K., and Buhl, E. (2023). Editorial: Invertebrate neurophysiology—of currents, cells, and circuits. Front. Neurosci. 17:1303574. doi: 10.3389/fnins.2023.1303574
Nieber, K. (1999). Hypoxia and neuronal function under in vitro conditions. Pharmacol. Therapeut. 82, 71–86. doi: 10.1016/S0163-7258(98)00061-8
Özugur, S., Kunz, L., and Straka, H. (2020). Relationship between oxygen consumption and neuronal activity in a defined neural circuit. BMC Biol. 18:76. doi: 10.1186/s12915-020-00811-6
Pacitti, D., Privolizzi, R., and Bax, B. E. (2019). Organs to cells and cells to organoids: The evolution of in vitro central nervous system modelling. Front. Cell. Neurosci. 13:129. doi: 10.3389/fncel.2019.00129
Patterson, M. S., and Mazurek, E. (2010). Calculation of cellular oxygen concentration for photodynamic therapy in vitro. Methods Mol. Biol. 635, 195–205. doi: 10.1007/978-1-60761-697-9_14
Pires Monteiro, S., Voogd, E., Muzzi, L., De Vecchis, G., Mossink, B., Levers, M., et al. (2021). Neuroprotective effect of hypoxic preconditioning and neuronal activation in a in vitro human model of the ischemic penumbra. J. Neural Eng. 18:036016. doi: 10.1088/1741-2552/abe68a
Place, T. L., Domann, F. E., and Case, A. J. (2017). Limitations of oxygen delivery to cells in culture: An underappreciated problem in basic and translational research. Free Radical Biol. Med. 113, 311–322. doi: 10.1016/J.FREERADBIOMED.2017.10.003
Poli, D., Magliaro, C., and Ahluwalia, A. (2019). Experimental and computational methods for the study of cerebral organoids: A review. Front. Neurosci. 13:162. doi: 10.3389/fnins.2019.00162
Poli, D., Pastore, V. P., and Massobrio, P. (2015). Functional connectivity in in vitro neuronal assemblies. Front. Neural Circuits 9:57. doi: 10.3389/fncir.2015.00057
Potjans, T. C., and Diesmann, M. (2014). The cell-type specific cortical microcircuit: Relating structure and activity in a full-scale spiking network model. Cereb. Cortex 24, 785–806. doi: 10.1093/cercor/bhs358
Radenkovic, S., Budhraja, R., Klein-Gunnewiek, T., King, A. T., Bhatia, T. N., Ligezka, A. N., et al. (2024). Neural and metabolic dysregulation in PMM2-deficient human in vitro neural models. Cell Rep. 43:113883. doi: 10.1016/j.celrep.2024.113883
Roth, A., and van Rossum, M. C. W. (2009). Modeling synapses. Comp. Model. Methods Neuroscient. 6, 139–160. doi: 10.7551/mitpress/7543.003.0008
Sanchez-Vives, M. V., Nowak, L. G., and McCormick, D. A. (2000). Cellular mechanisms of long-lasting adaptation in visual cortical neurons in vitro. J. Neurosci. 20, 4286–4299. doi: 10.1523/JNEUROSCI.20-11-04286.2000
Santiago, J., Kreutzer, J., Bossink, E., Kallio, P., and le Feber, J. (2023). Oxygen gradient generator to improve in vitro modeling of ischemic stroke. Front. Neurosci. 17:1110083. doi: 10.3389/fnins.2023.1110083
Sattelle, D. B., and Buckingham, S. D. (2006). Invertebrate studies and their ongoing contributions to neuroscience. Invertebrate Neurosci. 6, 1–3. doi: 10.1007/s10158-005-0014-7
Scelfo, B., Politi, M., Reniero, F., Palosaari, T., Whelan, M., and Zaldívar, J.-M. (2012). Application of multielectrode array (MEA) chips for the evaluation of mixtures neurotoxicity. Toxicology 299, 172–183. doi: 10.1016/j.tox.2012.05.020
Shefi, O., Golding, I., Segev, R., Ben-Jacob, E., and Ayali, A. (2002). Morphological characterization of in vitro neuronal networks. Phys. Rev. E 66:021905. doi: 10.1103/PhysRevE.66.021905
Spong, K. E., Andrew, R. D., and Robertson, R. M. (2016). Mechanisms of spreading depolarization in vertebrate and insect central nervous systems. J. Neurophysiol. 116, 1117–1127. doi: 10.1152/jn.00352.2016
Stimberg, M., Brette, R., and Goodman, D. F. M. (2019). Brian 2, an intuitive and efficient neural simulator. eLife 8:e47314. doi: 10.7554/ELIFE.47314
Sukenik, N., Vinogradov, O., Weinreb, E., Segal, M., Levina, A., and Moses, E. (2021). Neuronal circuits overcome imbalance in excitation and inhibition by adjusting connection numbers. Proc. Natl. Acad. Sci. U. S. A. 118:e2018459118. doi: 10.1073/pnas.2018459118
Van Pelt, J., Vajda, I., Wolters, P. S., Corner, M. A., and Ramakers, G. J. A. (2005). Dynamics and plasticity in developing neuronal networks in vitro. Prog. Brain Res. 147, 171–188. doi: 10.1016/S0079-6123(04)47013-7
Velasco, V., Shariati, S. A., and Esfandyarpour, R. (2020). Microtechnology-based methods for organoid models. Microsyst. Nanoeng. 6:76. doi: 10.1038/s41378-020-00185-3
Voogd, E. J. H. F., Frega, M., and Hofmeijer, J. (2023). Neuronal responses to ischemia: Scoping review of insights from human-derived in vitro models. Cell. Mol. Neurobiol. 43, 3137–3160. doi: 10.1007/s10571-023-01368-y
Walsh, K., Megyesi, J., and Hammond, R. (2005). Human central nervous system tissue culture: A historical review and examination of recent advances. Neurobiol. Dis. 18, 2–18. doi: 10.1016/j.nbd.2004.09.002
Wang, Q., Perc, M., Duan, Z., and Chen, G. (2010). Impact of delays and rewiring on the dynamics of small-world neuronal networks with two types of coupling. Phys. Statist. Mechan. Appl. 389, 3299–3306. doi: 10.1016/J.PHYSA.2010.03.031
Watts, D. J., and Strogatz, S. H. (1998). Collective dynamics of ‘small-world’ networks. Nature 393, 440–442. doi: 10.1038/30918
Watts, M. E., Pocock, R., and Claudianos, C. (2018). Brain energy and oxygen metabolism: Emerging role in normal function and disease. Front. Mol. Neurosci. 11:216. doi: 10.3389/fnmol.2018.00216
Wei, Y., Ullah, G., Ingram, J., and Schiff, S. J. (2014). Oxygen and seizure dynamics: II. Computational modeling. J. Neurophysiol. 112, 213–223. doi: 10.1152/jn.00541.2013
Wen, J., Peitz, M., and Brüstle, O. (2022). A defined human-specific platform for modeling neuronal network stimulation in vitro and in silico. J. Neurosci. Methods 373:109562. doi: 10.1016/j.jneumeth.2022.109562
Wilson, S. B., and Emerson, R. (2002). Spike detection: A review and comparison of algorithms. Clin. Neurophysiol. 113, 1873–1881. doi: 10.1016/S1388-2457(02)00297-3
Zaitsev, A. V., Povysheva, N. V., Gonzalez-Burgos, G., and Lewis, D. A. (2012). Electrophysiological classes of layer 2/3 pyramidal cells in monkey prefrontal cortex. J. Neurophysiol. 108, 595–609. doi: 10.1152/jn.00859.2011
Zanelli, S. A., Rajasekaran, K., Grosenbaugh, D. K., and Kapur, J. (2015). Increased excitability and excitatory synaptic transmission during in vitro ischemia in the neonatal mouse hippocampus. Neuroscience 310, 279–289. doi: 10.1016/J.NEUROSCIENCE.2015.09.046
Keywords: in silico modeling, neuron firing, oxygen metabolism, in vitro neuronal network, digitalized neuronal network
Citation: Fabbri R, Botte E, Ahluwalia A and Magliaro C (2025) Digitoids: a novel computational platform for mimicking oxygen-dependent firing of neurons in vitro. Front. Neuroinform. 19:1549916. doi: 10.3389/fninf.2025.1549916
Received: 22 December 2024; Accepted: 09 June 2025;
Published: 01 July 2025.
Edited by:
Alberto Marchisio, New York University Abu Dhabi, United Arab EmiratesReviewed by:
Leonardo Dalla Porta, August Pi i Sunyer Biomedical Research Institute (IDIBAPS), SpainNina Doorn, University of Twente, Netherlands
Copyright © 2025 Fabbri, Botte, Ahluwalia and Magliaro. This is an open-access article distributed under the terms of the Creative Commons Attribution License (CC BY). The use, distribution or reproduction in other forums is permitted, provided the original author(s) and the copyright owner(s) are credited and that the original publication in this journal is cited, in accordance with accepted academic practice. No use, distribution or reproduction is permitted which does not comply with these terms.
*Correspondence: Chiara Magliaro, Y2hpYXJhLm1hZ2xpYXJvQHVuaXBpLml0