 Kelley M. Swanberg
 Karl Landheer
 David Pitt
 Christoph Juchem
- 1Department of Biomedical Engineering, Columbia University Fu Foundation School of Engineering and Applied Science, New York, NY, United States
- 2Department of Neurology, Yale University School of Medicine, New Haven, CT, United States
- 3Department of Radiology, Columbia University College of Physicians and Surgeons, New York, NY, United States
Proton magnetic resonance spectroscopy (1H-MRS) offers a growing variety of methods for querying potential diagnostic biomarkers of multiple sclerosis in living central nervous system tissue. For the past three decades, 1H-MRS has enabled the acquisition of a rich dataset suggestive of numerous metabolic alterations in lesions, normal-appearing white matter, gray matter, and spinal cord of individuals with multiple sclerosis, but this body of information is not free of seeming internal contradiction. The use of 1H-MRS signals as diagnostic biomarkers depends on reproducible and generalizable sensitivity and specificity to disease state that can be confounded by a multitude of influences, including experiment group classification and demographics; acquisition sequence; spectral quality and quantifiability; the contribution of macromolecules and lipids to the spectroscopic baseline; spectral quantification pipeline; voxel tissue and lesion composition; T1 and T2 relaxation; B1 field characteristics; and other features of study design, spectral acquisition and processing, and metabolite quantification about which the experimenter may possess imperfect or incomplete information. The direct comparison of 1H-MRS data from individuals with and without multiple sclerosis poses a special challenge in this regard, as several lines of evidence suggest that experimental cohorts may differ significantly in some of these parameters. We review the existing findings of in vivo 1H-MRS on central nervous system metabolic abnormalities in multiple sclerosis and its subtypes within the context of study design, spectral acquisition and processing, and metabolite quantification and offer an outlook on technical considerations, including the growing use of machine learning, by future investigations into diagnostic biomarkers of multiple sclerosis measurable by 1H-MRS.
Introduction
In vivo proton magnetic resonance spectroscopy (1H-MRS) is a method that can estimate the concentrations of select small molecules in living tissue using electromagnetic waves to manipulate and monitor the behavior of hydrogen nuclear spins in a magnetic field. Since Felix Bloch of Stanford University performed in 1946 what is now considered to be the first in vivo MRS measurement, of his own finger (1), in vivo spectroscopy has developed considerably, now enabling the routine assessment of multiple small-molecule metabolites in tissues like the human skeletal muscle (2), liver (3), brain (4), heart (5), breast (6), bone (7), prostate (8), kidney (9), and, more recently, the spinal cord (10).
Despite the diagnostic potential suggested by the range of organs to which spectroscopy has been applied to safely and non-invasively investigate in vivo metabolism in the laboratory, its clinical utility remains limited. In the brain, 1H-MRS is currently used as an auxiliary to magnetic resonance imaging (MRI) for clinical decision-making in tumors, neonatal hypoxia and congenital metabolic disorders and leukoencephalopathies, pediatric traumatic brain injury, and infectious brain abscesses (11). Its application to other conditions is, however, minimal. This fact is reflected in reimbursement protocols published by the largest three health insurance providers in the United States, according to which 1H-MRS is “unproven and/or not medically necessary” (United Health Group) (12), “investigational and not medically necessary” for all non-oncological indications (Anthem) (13), and “experimental and investigational” for all but the characterization of brain tumors and other biopsy-eligible lesions (Aetna) (14). 1H-MRS thus currently represents a wealth of unpolished potential in the diagnostics of countless diseases currently evaluated by slower, more invasive, or otherwise riskier means.
Multiple sclerosis is one such disease. With more than 2.3 million patients worldwide and a prevalence that appears to be rising in the United States (15) and potentially among ethnic groups historically considered to be low-risk (16), multiple sclerosis is a chronic autoimmune condition that targets the central nervous system, rendering it one of the most common causes of neurological disability in young adults (17). Its diagnosis continues to depend on the subjective and uncertain (18) multifactorial synthesis of symptom self-report, neurological evaluation, and magnetic resonance imaging for central nervous system lesions, in addition to lumbar puncture for assay of oligoclonal bands in the cerebrospinal fluid (19). Diagnosis is further complicated by the presence of at least three disease phenotypes with distinct courses and expected response to commonly employed disease-modifying therapies: relapsing-remitting multiple sclerosis, secondary progressive multiple sclerosis, and primary progressive multiple sclerosis, differences among which will be detailed later.
Despite abundant evidence that multiple sclerosis affects numerous metabolites measurable by brain 1H-MRS, spectroscopy is not currently used as a first-line diagnostic tool for the disease. Translation from the metabolite signals acquired via 1H-MRS to clinically useable predictive biomarkers still awaits the development of techniques either to maximize the precision with which one can isolate one or two metabolic smoking guns, as in improved shimming or spectral editing, or to uncover a reproducible pattern of subtle disease effects on multiple metabolites, as in machine learning. Most likely, the successful development of multiple sclerosis diagnostic biomarkers from 1H-MRS data will represent a combination of the two efforts. Spectroscopic data inputs to disease classifiers may be normalized, dimensionally reduced, or otherwise transformed into uninterpretable arbitrary units and therefore need not represent physically descriptive measurements of absolute molarity to be clinically useful. Even metabolite signals in arbitrary units, however, must enable classification schemes that are both sensitive and reproducible. Increased within-group variance from the variable influence of extra-concentration factors like relaxation, for example, may reduce the sensitivity of a potential classifier. On the other hand, increased between-group variance from a confound that may not be generalizable to every sequence, such as diffusion weighting, can enable the development of a seemingly sensitive classifier in one specialized experiment—for instance, metabolite values referenced to differentially diffusion-weighted water signals—but obstruct the usefulness of its broad application to clinical decision-making unless the nature of this confound is precisely understood.
As will be discussed, spectroscopic quantification may encompass multiple sources of obfuscating within-group variance or misleading between-group variance. These can include unrepresentative or mismatched subject sampling (section Study Cohort Demographics), unconsidered effects of spectral acquisition and processing techniques (section Spectral Acquisition and Processing), and faulty evidentiary support for conversion factors used to translate between signal intensity and usable concentration values (section Metabolite Quantification). Some potential confounds to metabolite quantification by 1H-MRS, including atrophy index, voxel gray-white matter composition, diffusion weighting, metabolite T1 and T2 relaxation constants, and other MR-visible differences in tissue physiology may, when characterized and controlled, serve as useful diagnostic biomarkers in their own right. The present review focuses, however, on minimizing their influence on the primary utility of 1H-MRS as a measure of in vivo small molecule concentrations in the march toward a clinically useful diagnostic biomarker for multiple sclerosis.
Potential Small-Molecule Diagnostic Biomarkers of Multiple Sclerosis Measurable by 1H-MRS
Small Molecules Examined in 1H-MRS Investigations of Multiple Sclerosis
Proton spectroscopic analysis of multiple sclerosis has examined a variety of individual small molecules in living central nervous system tissue, including N-acetyl aspartate, creatine, choline, myoinositol, glutamate, glutamine, γ-aminobutyric acid (GABA), glutathione, and lactate. For reasons of difficult isolation from a single spectral dataset, some of these and other metabolites are often grouped under more general categories, like total creatine (creatine and phosphocreatine), total N-acetyl aspartate (N-acetyl aspartate or NAA plus N-acetyl aspartylglutamate or NAAG), total choline (choline, phosphocholine, and glycerophosphocholine), inositol (myoinositol and scylloinositol), or Glx (glutamate and glutamine). Since different authors exhibit varying precision in nomenclature, for simplicity in the present review the terms N-acetyl aspartate, creatine, and choline may refer to any subset of biomolecules listed above in the “total” definitions thereof. In addition to small-molecule metabolites comprising the principal peaks of a 1H-MRS spectrum, the less well-defined lipids and macromolecules constituting the broader background signatures of some sequences have also been examined for differences between individuals with and without multiple sclerosis.
By far the majority of 1H-MRS studies of multiple sclerosis examine one or all of the highest-amplitude signals on a standard 1H-MRS localizing sequence, from N-acetyl aspartate, creatine, and choline. A detailed treatment of the potential roles of each class of molecules in healthy and diseased brain is well beyond the scope of the present review. It is, however, to be noted that beyond exhibiting high-intensity single peaks (so-called singlets) that facilitate their straightforward quantification, each of these classes of metabolite also possesses a biological function that reasonably implicates it in the existing narrative of multiple sclerosis pathology. Perhaps unsurprisingly, then, all three compounds, among others, have previously demonstrated abnormalities relative to control in brain 1H-MRS studies of multiple sclerosis.
N-Acetyl Aspartate (NAA)
N-acetyl aspartate (NAA) is a small molecule synthesized predominantly in mature neurons from acetate and acetyl-coenzyme A. In addition to displaying concentration abnormalities in a number of neurological disorders and injuries, it may serve in part as a storage and transport reservoir for acetate used in myelin lipid anabolism. N-acetyl aspartylglutamate (NAAG) is also predominantly localized to the neurons, though of a smaller range than N-acetyl aspartate, and may modulate the release of neurotransmitters in a variety of pathways (20). The acetyl moieties of both molecules exhibit high-amplitude singlets at 2.01 (N-acetyl aspartate) or 2.04 (N-acetyl aspartylglutamate) ppm; both molecules also exhibit additional multiplets, especially from aspartate in the 2.5–2.7 and 4.4–4.6 ppm range as well as further signals from the amine (N-acetyl aspartate) and glutamate (N-acetyl aspartylglutamate) moieties (21).
Creatine-referenced N-acetyl aspartate has shown reductions relative to control in mixed or unspecified multiple sclerosis lesions (22–35), white matter (36), normal-appearing white matter (22, 24, 25, 30, 34, 37–46), and mixed tissue (47); in relapsing-remitting multiple sclerosis lesions (48–56), white matter (36, 54, 57–64), normal-appearing white matter (48, 50–52, 65–70), gray matter (54, 70), mixed tissue (54, 58, 63, 71–75), and spine (76); and in progressive multiple sclerosis lesions (50, 52, 77–79), white matter (36, 60, 62, 80), normal-appearing white matter (45, 46, 50, 52, 66, 69, 78, 79, 81, 82), gray matter (83), and mixed tissue (71, 73, 84–89). In addition, N-acetyl aspartate quantified as institutional units or relative to non-creatine references like water or phantom acquisitions has been shown to decrease in mixed or unspecified multiple sclerosis lesions (22, 29, 90–96), white matter (97, 98), normal-appearing white matter (22, 91, 94, 99–105), gray matter (94, 100, 103, 104, 106), mixed tissue (107, 108), spine (109–112), and whole-brain measures (113, 114); in relapsing-remitting lesions (50, 53, 96, 115–117), normal-appearing white matter (50, 67, 115, 117–121), gray matter (70, 115, 118, 119, 122), mixed tissue (123, 124), and whole-brain measures (125–128); and in progressive lesions (50, 78, 96, 129), white matter (62, 80), normal-appearing white matter (50, 78, 82, 120, 121, 129–131), gray matter (106, 121, 131–133), mixed tissue (88, 130, 134, 135), spine (136), and whole-brain measures (126).
Creatine (Cr)
Creatine (Cr) and phosphocreatine (PCr) support the equilibrium of phosphorylated adenosine species useful for cellular energy metabolism by way of kinase enzymes that shuttle phosphates among these molecules (20). Both molecules exhibit overlapping singlets at 3.0 ppm and 3.9 ppm from methyl and methylene, respectively, in addition to amine signals (21). The effect of multiple sclerosis on creatine concentrations in the central nervous system is still unclear, as creatine has been suggested to increase in mixed or unspecified multiple sclerosis lesions (92) and normal-appearing white matter (37); in relapsing-remitting multiple sclerosis lesions (137), normal-appearing white matter (50, 69, 137), and mixed tissue (123); and in progressive multiple sclerosis lesions (50), white matter (62), normal-appearing white matter (50, 69), and mixed tissue (84, 135). It has also demonstrated decreases, however, in unspecified and mixed multiple sclerosis lesions (94), normal-appearing white matter (105), and gray matter (103); in relapsing-remitting lesions (116); and in progressive gray matter (133) and mixed tissue (88).
Choline (Cho)
Choline-containing compounds, the majority of which are attached to the phospholipid membrane (much of choline or Cho not visible to 1H-MRS) but also found as small molecules in aqueous solution (phosphocholine or PCho and glycerophosphocholine or GPC), are thought to be taken into brain tissue through the blood-brain barrier as choline and represent the precursors and byproducts of phospholipid membrane metabolism (20). Mobile choline and phosphocholine exhibit high-intensity methyl singlets at 3.2 ppm with additional methylene multiplets at 4.1–4.3 and 3.5–3.6 ppm, while glycerophosphocholine demonstrates a range of complex resonances from 3.2 to 4.3 ppm (21). Creatine-referenced choline has demonstrated increases in mixed or unspecified multiple sclerosis group lesions (23–25, 34, 41, 138) and normal-appearing white matter (34, 41); in relapsing-remitting lesions (49, 139, 140), normal-appearing white matter (141), and spine (142); and in progressive lesions (78) and spine (76). Decreases, however, have also been shown in mixed multiple sclerosis lesions (29) and in relapsing-remitting lesions (143), normal-appearing white matter (66), gray matter (144), and mixed tissue (144, 145). Increases in choline quantified otherwise have been shown in mixed multiple sclerosis lesions (27, 90, 92) and normal-appearing white matter (92, 101); in relapsing-remitting lesions (137, 146), white matter (64), normal-appearing white matter (137), and gray matter (122); and progressive mixed tissue (84, 135), but decreases have also been demonstrated in mixed multiple sclerosis lesions (91, 94), normal-appearing white matter (105), and gray matter (94); relapsing-remitting lesions (116) and gray matter (119); and progressive mixed tissue (130).
Inositols (Ins)
Inositols are cyclic organic molecules comprising nine different isomers, of which myoinositol and scylloinositol are the most abundant in human tissue. Myoinositol (mIns) can be found intracellularly within both glial cells and some neuronal types, where it serves as an osmolyte and metabolic precursor to a class of signaling molecules (20). Inositols, particularly myoinositol, have demonstrated central nervous system abnormalities in multiple sclerosis. Creatine-referenced inositol or myoinositol has been shown to increase in mixed or unspecified multiple sclerosis lesions (24, 28, 29, 138, 147); in relapsing-remitting lesions (49, 53, 139, 140, 148), normal-appearing white matter (67), and mixed tissue (84); and in progressive mixed tissue (84) and spine (76), while inositols otherwise quantified have demonstrated increases in multiple sclerosis lesions (29, 92), normal-appearing white matter (92, 99, 101, 102, 110), and gray matter (99, 102, 106); relapsing-remitting multiple sclerosis lesions (53), normal-appearing white matter (67, 69, 117, 119), and mixed tissue (124); and progressive lesions (136), normal-appearing white matter (69, 131), gray matter (106), and mixed tissue (84).
Glutamate (Glu), Glutamine (Gln), and γ-Aminobutyric Acid (GABA)
Excitatory neurotransmitter glutamate (Glu) and inhibitory neurotransmitter γ-aminobutyric acid (GABA) have also been implicated in multiple sclerosis pathology. As discussed in the section Acquisition Methods, isolating glutamate from its metabolic precursor and spectral neighbor glutamine (Gln) (20) is difficult at magnetic field strengths of 3 T and below, so 1H-MRS experiments involving this metabolite in multiple sclerosis have been sparse. Glutamate concentration not referenced to creatine has shown decreases in multiple sclerosis mixed tissue (107) and relapsing-remitting mixed tissue (149) but also increases in multiple sclerosis lesions (92) and normal-appearing white matter (92, 100).
GABA is naturally present at comparatively low concentrations in the brain, and the signal amplitude of its peaks is further reduced by J-coupling interactions among its protons. Isolating its signature from those of nearby metabolites choline and creatine is therefore difficult in one-dimensional spectroscopy without additional spectral editing methods. While research on the molecule is therefore limited, edited GABA concentration has been shown to decrease in relapsing-remitting (150) and progressive (134) mixed tissue.
Glutathione (GSH)
Limited work using 1H-MRS has also been performed to assess the effects glutathione (GSH) in the brain. Like GABA, glutathione possesses a low-amplitude spectral signature that overlaps heavily with metabolites of much higher brain concentrations, therefore requiring spectral editing for accurate quantification by one-dimensional 1H-MRS. Previous research employing this editing has suggested that multiple sclerosis is associated with glutathione decreases in gray but not white matter voxels measured superior to the ventricles (104); some evidence also exists of reduced glutathione concentration in secondary progressive mixed-tissue voxels in the frontal (151, 152) and parietal (152) cortex.
Lactate (Lac)
Lactate is a byproduct of pyruvate reduction in anaerobic glycolysis that is thought to serve as an alternative cellular energy source during high levels of neural activity. While transient increases of lactate have been observed in healthy brain, its prolonged presence in neural tissue is typically considered a mark of pathology (20). Accordingly, some evidence exists of enhanced lactate signal in mixed or unspecified multiple sclerosis lesions (24, 31, 153) and relapsing-remitting lesions (140).
Study Cohort Demographics
Multiple Sclerosis Phenotypes
While a number of studies have employed experiment groups of undefined (30–32, 47, 93, 104, 138, 147, 153–157) or mixed (22–28, 33, 34, 36–38, 40–43, 81, 90–92, 94, 97, 100–103, 105, 107–111, 113, 114, 158–168) multiple sclerosis phenotypes, a significant body of literature focuses on the metabolic underpinnings of distinctly relapsing-remitting, secondary progressive, and primary progressive multiple sclerosis variants.
Relapsing-remitting multiple sclerosis (RR-MS) is marked by months to years of clinical quiescence punctuated by subacute neurological relapses of paresthesia, paresis, loss of balance and coordination, anopsia, dysautonomia, cognitive dysfunction, and other symptoms. These clinical manifestations are usually accompanied by the presence of hyperintense white matter lesions on T2-weighted MRI or gadolinium-enhancing lesions evident in T1-weighted MR sequences (169). Gadolinium-enhancing lesions lose contrast enhancement over the course of several weeks (170) but may remain as hyperintensities on T2-weighted images, some of which also manifest as usually irreversible hypointensities on T1-weighted images suggestive of inflammatory edema, demyelination, and, when chronic, axonal loss (171). 1H-MRS in gadolinium-enhancing acute lesions of relapsing-remitting multiple sclerosis has demonstrated lower concentrations of N-acetyl aspartate, creatine, and glutamate-glutamine with increases in choline and myoinositol (116) and sometimes increased lactate (140).
Progressive multiple sclerosis (P-MS), by contrast, exhibits a relative absence of clinical relapses and comparatively less focal inflammatory central nervous activity, manifesting instead as functional deterioration with neurodegeneration, marked by diffuse white matter injury and greater rates of cortical atrophy. Most cases of progressive multiple sclerosis are secondary progressive (SP-MS) transitions from a relapsing disease course. A minority of patients develop a progressive form from the outset, a disease course which is then termed primary progressive multiple sclerosis (PP-MS) (169).
Normal-appearing white matter has demonstrated similar metabolic signatures in both conditions. Relapsing-remitting normal-appearing white matter has demonstrated reductions in N-acetyl aspartate normalized to creatine (48, 50–52, 65–70), choline (67), or other references (50, 67, 115, 117–121), and lower creatine-referenced choline (66) as well as higher creatine (50, 69, 137), creatine-referenced myoinositol (67), and inositol (67, 69, 117, 119) than controls (Figure 1A). Secondary progressive normal-appearing white matter has similarly demonstrated lower N-acetyl aspartate normalized to creatine (46, 52, 66, 69, 79), choline (78), or other references (78, 120, 121); and higher creatine (69) and inositols (69) than controls (Figure 2A).
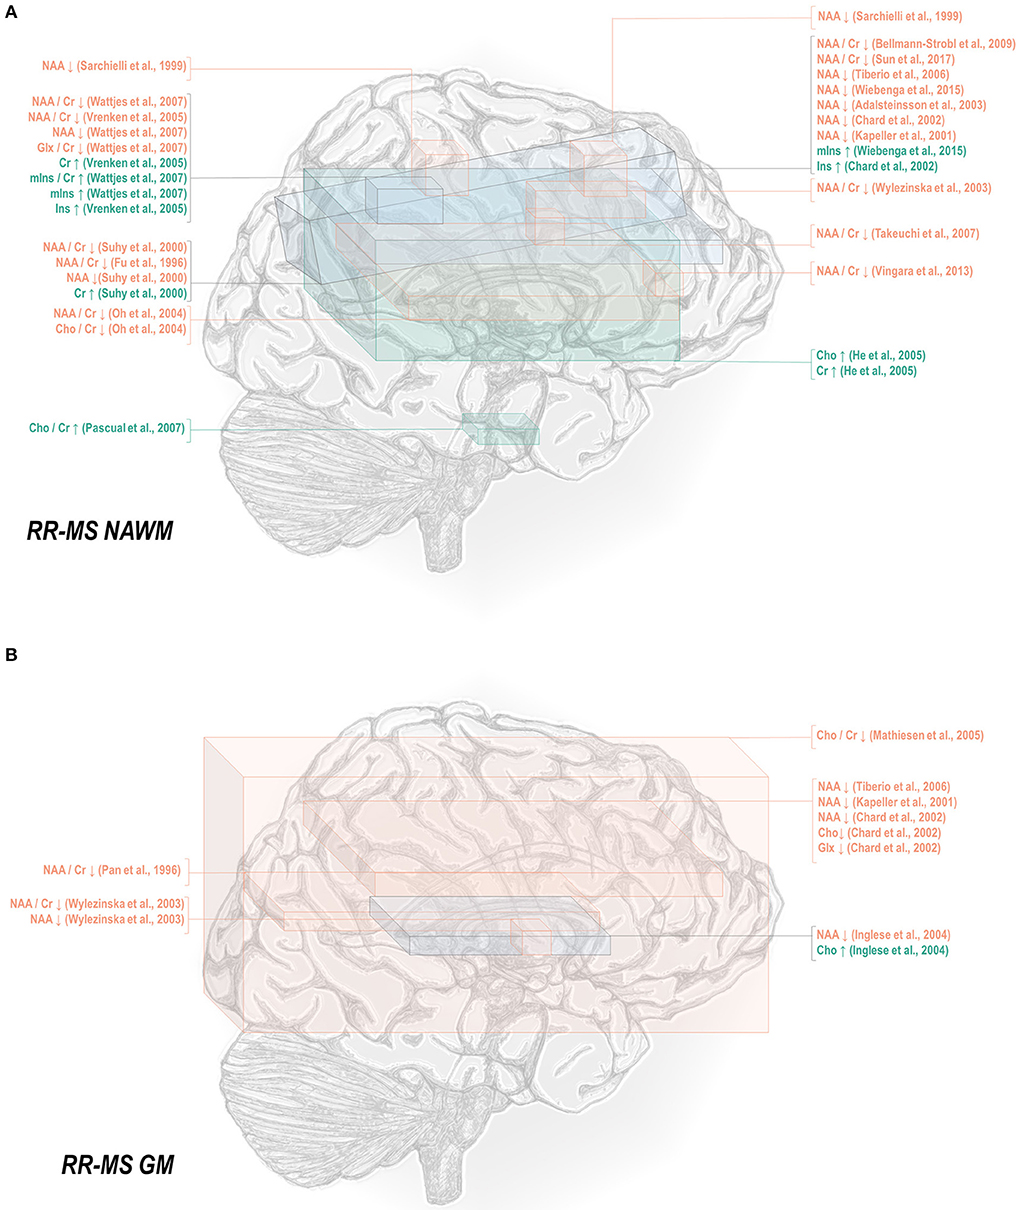
Figure 1. Relapsing-remitting multiple sclerosis is associated with a number of metabolic changes as measured by proton magnetic resonance spectroscopy in both white and gray matter. (A) Previous applications of proton magnetic resonance spectroscopy (1H-MRS) in the normal-appearing white matter (NAWM) of relapsing-remitting multiple sclerosis (RR-MS) patients have demonstrated decreases in N-acetyl aspartate (NAA) and glutamate-glutamine (Glx), increases in creatine (Cr), and inositols (Ins), and either decreases or increases in choline (Cho) relative to control. (B) Similar analyses in gray matter (GM) have demonstrated decreases in N-acetyl aspartate and glutamate-glutamine with either decreases or increases in choline.
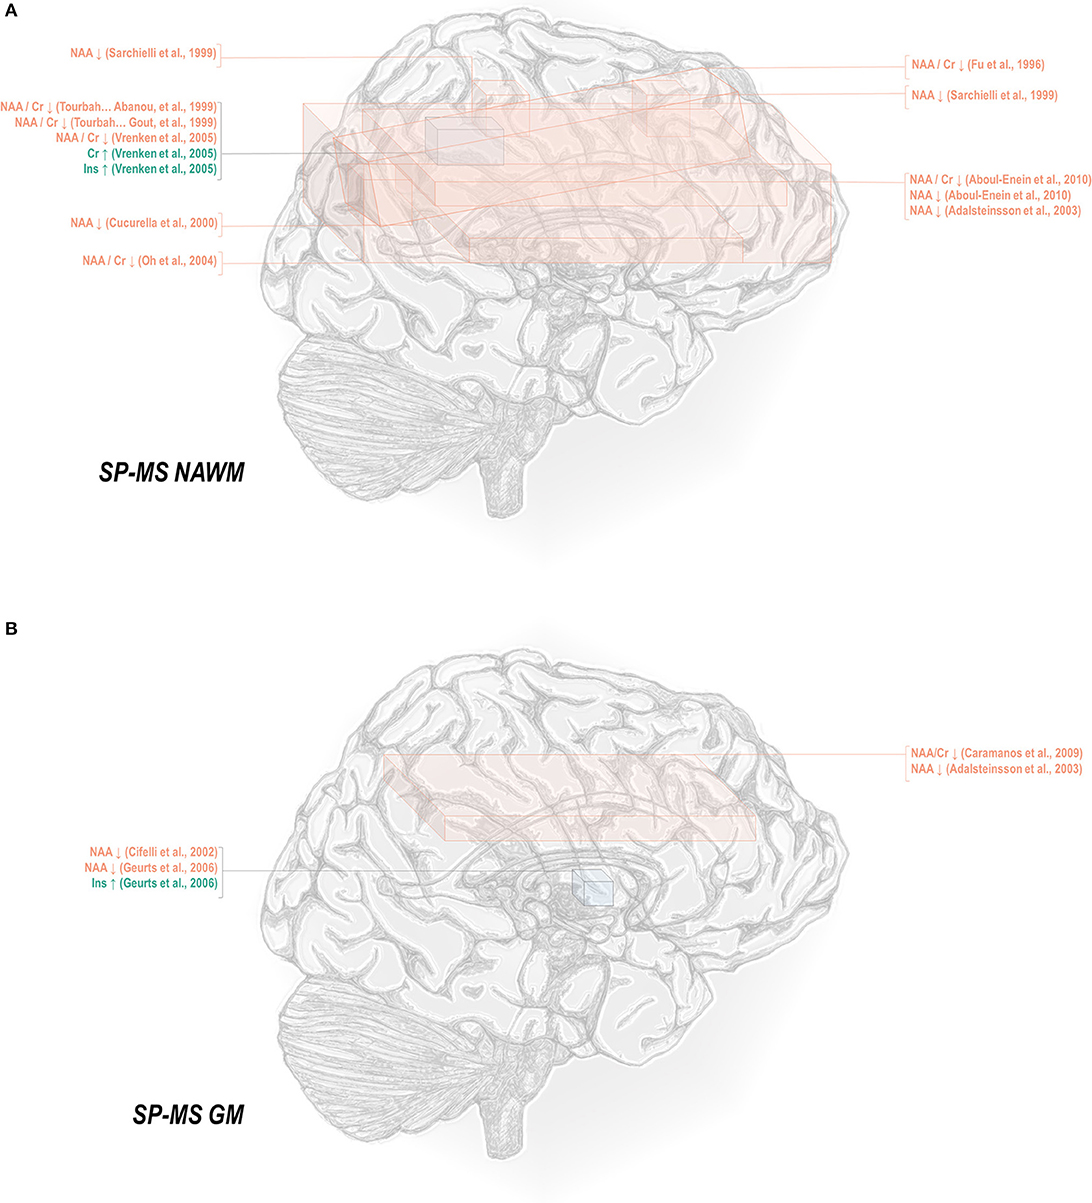
Figure 2. Secondary progressive multiple sclerosis is associated with a number of metabolic changes as measured by proton magnetic resonance spectroscopy in both white and gray matter. (A) Previous applications of proton magnetic resonance spectroscopy (1H-MRS) in the normal-appearing white matter (NAWM) of secondary progressive multiple sclerosis (SP-MS) patients have demonstrated decreases in N-acetyl aspartate (NAA) with increases in creatine (Cr) and inositols (Ins). (B) Similar analyses in gray matter (GM) have demonstrated decreases in NAA with increases in inositols.
In normal-appearing white matter of relapsing-remitting multiple sclerosis only, additional findings of lower creatine-referenced glutamate-glutamine (67), increases in creatine-referenced choline (141), and an increase in choline (137) have also been reported. It is uncertain from these reports alone whether the finding of these metabolic abnormalities in relapsing-remitting but not secondary progressive multiple sclerosis reflects not true metabolic differences in the two diseases but rather lack of research. A multitude of spectroscopic analyses on the normal-appearing white matter of relapsing-remitting multiple sclerosis have reported null results in either metabolite, and while several have similarly addressed normal-appearing white matter choline (46, 66, 69, 78–80, 120, 172) in secondary progressive multiple sclerosis, only a handful have done so for glutamate or glutamine (69, 172, 173). One rare study reporting group statistics for both relapsing-remitting and secondary progressive multiple sclerosis normal-appearing white matter demonstrated an aggregate increase in glutamate regardless of phenotype (100). The limited number of studies directly comparing both subtypes have additionally demonstrated greater abnormality in secondary progressive than relapsing-remitting multiple sclerosis, with larger decreases in N-acetyl aspartate referenced to creatine (36, 79, 80) and otherwise (80, 105, 120) in areas of white matter, a difference mirrored in research in which normal-appearing white matter in central brain (66) and centrum semiovale (79) demonstrated differences from control in N-acetyl aspartate in the secondary progressive but not the relapsing-remitting phenotype. Similarly, one study showed increases from control in creatine in white matter for secondary progressive but not relapsing-remitting multiple sclerosis (62), though the region of interest under investigation notably contained lesions in all disease groups.
A smaller number of studies have examined the effects of each subtype on gray matter metabolism. Relapsing-remitting gray matter has demonstrated decreases of N-acetyl aspartate referenced to creatine (54, 70) and other metrics (70, 115, 118, 119, 122) (Figure 1B). Similarly, secondary progressive gray matter has demonstrated decreases in N-acetyl aspartate referenced to creatine (83) or otherwise (106, 121, 132) (Figure 2B). The literature on secondary progression has not, however, replicated either decreases (119, 144) or increases (122) in choline or decreases in glutamate-glutamine (119) found in relapsing-remitting gray matter, and, unlike the literature on gray matter in relapsing-remitting multiple sclerosis, has demonstrated increases in inositol (106) relative to controls. Published spectroscopic analyses comparing gray matter specifically in relapsing-remitting and secondary progressive multiple sclerosis are sparse, but, similarly to the literature on normal-appearing white matter, have demonstrated decreases in N-acetyl aspartate in secondary progressive but not relapsing-remitting multiple sclerosis (83, 121), in addition to the aforementioned increases in inositol in secondary progressive but not relapsing-remitting multiple sclerosis (106).
Mixed-tissue voxels typically contain a significant proportion of gray matter; studies thereof may thus be queried to supplement understanding of metabolic similarities and differences between relapsing-remitting and secondary progressive gray matter. Mixed-tissue voxels in relapsing-remitting multiple sclerosis have demonstrated decreased N-acetyl aspartate referenced to creatine (54, 58, 63, 71–74) or otherwise (123, 124); increased creatine (123); increased inositol referenced to creatine (84) or otherwise (124); and decreased GABA plus homocarnosine and macromolecules, called GABA+ (150). Similarly, studies on mixed-tissue voxels in secondary progressive multiple sclerosis have reported decreases in N-acetyl aspartate referenced to creatine (71, 73, 84, 85, 88) and otherwise (88, 134, 135), as well as increases in creatine (84, 135) and inositol referenced to creatine or otherwise (84), and decreases in GABA (134) but have not replicated relapsing-remitting findings of decreased creatine-referenced choline (144, 145), glutamate (149), or glutamate-glutamine (124, 149). Secondary progressive but not relapsing-remitting patients have, however, exhibited decreases in mixed-tissue creatine (88) and glutathione (151, 152) as well as increases in choline (135). The handful of analyses concomitantly examining mixed-tissue voxels in both phenotypes have reported decreases in N-acetyl aspartate in either both patient groups (71) or secondary progressive multiple sclerosis only (84, 85, 88) and increases in creatine-referenced inositol in both patient groups, in addition to increases in inositol and creatine in secondary progressive but not relapsing-remitting multiple sclerosis (84).
Less thoroughly studied in the spectroscopy literature is the primary progressive phenotype, which comprises only about 15% of all cases. Primary progressive multiple sclerosis normal-appearing white matter has demonstrated decreases in N-acetyl aspartate referenced to creatine (45, 50, 69, 78, 82), choline (78), and otherwise (50, 78, 82, 129, 131), as well as increases in inositol (69, 131) and creatine (50) (Figure 3A). Primary progressive gray matter has similarly demonstrated decreases in N-acetyl aspartate (106, 131, 133) but also in creatine (133) and glutamate-glutamine (131) (Figure 3B).
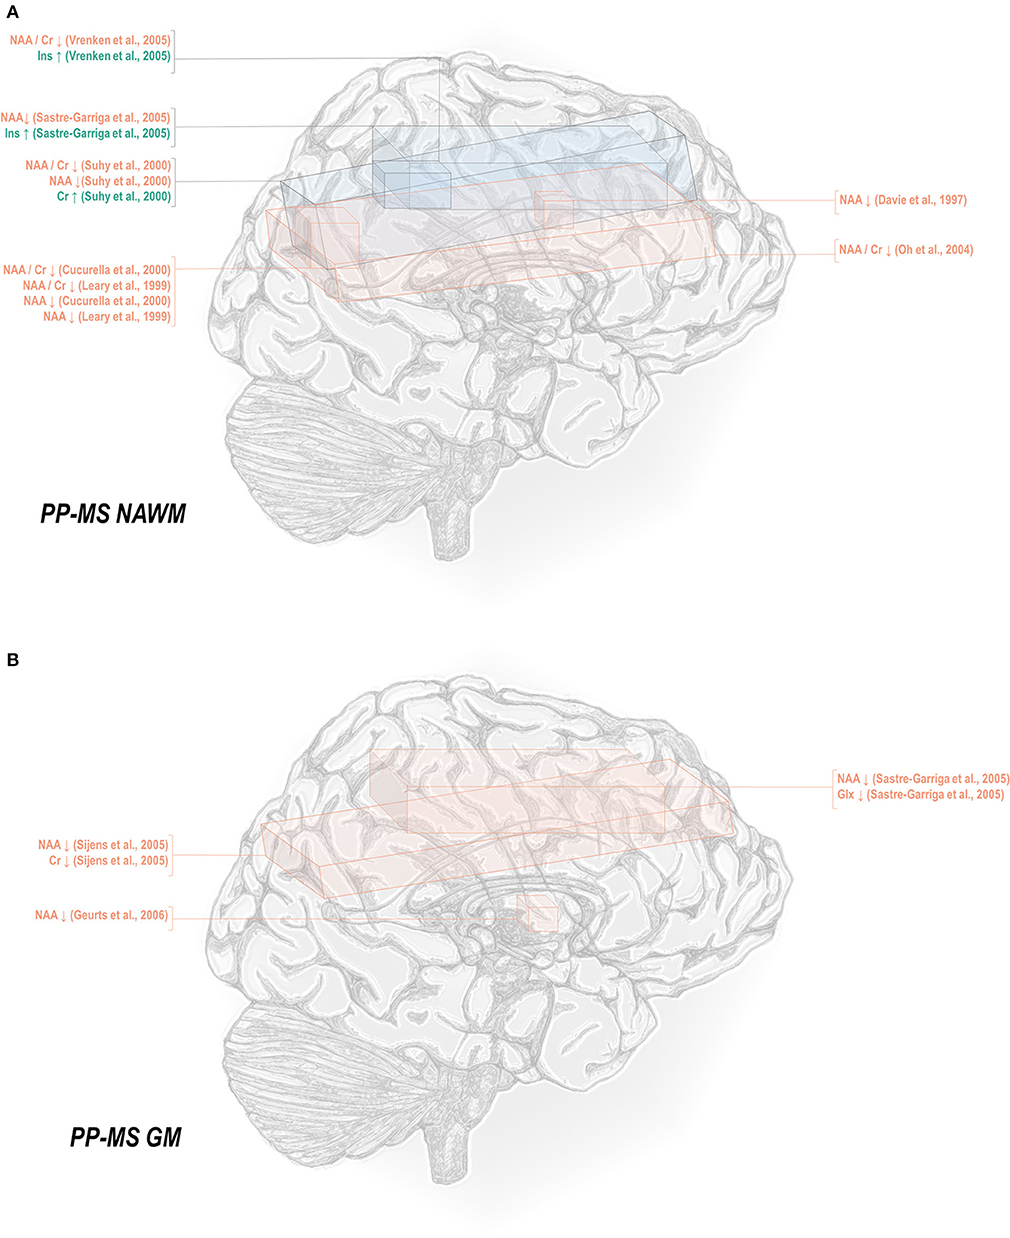
Figure 3. Primary progressive multiple sclerosis is associated with a number of metabolic changes as measured by proton magnetic resonance spectroscopy in both white and gray matter. (A) Previous applications of proton magnetic resonance spectroscopy (1H-MRS) in the normal-appearing white matter (NAWM) of primary progressive multiple sclerosis (PP-MS) patients have demonstrated decreases in N-acetyl aspartate (NAA) with increases in creatine (Cr) and inositols (Ins). (B) Similar analyses in gray matter (GM) have demonstrated decreases in NAA, creatine, and glutamate-glutamine (Glx).
A handful of papers makes reference to a relapsing-progressive multiple sclerosis patient case (86) or group (174), described in the latter as “in a progressive phase of the disease after having shown remissions” and therefore ambiguous in its distinction from the secondary progressive phenotype. Alternatively, some studies include progressive-relapsing patients within mixed-subtype cohorts (101, 113, 163, 164). It bears emphasis, however, that current recommendations suggest that “relapsing-progressive” lacks a consensus definition and therefore not be reified as a phenotype distinct from that of secondary progressive disease (175); and that “progressive-relapsing” be re-categorized as “primary progressive with disease activity” (176).
A few studies include experimental groups defined by “progressive multiple sclerosis” (81, 130, 177), including patients with either the primary or secondary progressive variant. Both phenotypes exhibit similar patterns of clinical decline, albeit in primary progressive without a preceding relapse-onset phase, as well as poorer response to disease-modifying therapies that can have striking therapeutic effects in relapsing-remitting cases (178). The existence of some treatment-responsive subgroups in drug trials for progressive multiple sclerosis has indicated, however, that the distinction not only between relapsing and progressive disease phenotypes but also among different progressive patients may lie in the relative contributions of shared disease mechanisms rather than qualitative differences among the mechanisms themselves (178). It may be argued that primary progressive multiple sclerosis exhibits the greatest contribution from mechanisms independent of autoimmunity, as indicated by the lower proportion of women, who typically exhibit higher incidence of autoimmune diseases than men, expressing this phenotype relative to the others (179). This possibility may caution against the conflation of primary with secondary progressive multiple sclerosis in the continued search for diagnostic biomarkers measurable by 1H-MRS.
Finally, some in vivo proton spectroscopy work has examined the metabolic signatures of clinically isolated syndrome (CIS) (67, 180–183) and radiologically isolated syndrome (RIS) (184, 185), including to predict conversion of individuals with these often prodromal syndromes to clinically definite multiple sclerosis. A comprehensive or detailed treatment of the existing literature thereof stands outside the scope of the present review, which centers instead on studies of the disease phenotypes defined above. Its relative sparsity, however, particularly marked for radiologically isolated conditions, highlights a potentially fruitful avenue for future investigation into disease evolution from the earliest stages of imaging and symptomatic manifestation.
Age and Disease Duration
A number of studies within the multiple sclerosis literature have examined and found no significant correlations in controls between age and mixed tissue N-acetyl aspartate, creatine, choline, or inositol (84); or in multiple sclerosis patients between age and concentrations of whole-brain N-acetyl aspartate (186, 187); creatine-referenced N-acetyl aspartate in white matter (36); or creatine-referenced N-acetyl aspartate, choline, or myoinositol in chronic or acute lesions or normal-appearing white matter (148) or in parietal gray or white matter (63); similarly, no relationship was found between age and concentrations of creatine-referenced N-acetyl aspartate, choline, myoinositol, or macromolecules, or the magnitude of the creatine signal itself, in normal-appearing white matter or non-enhancing lesions (48). Other research has reported in control white matter significant positive relationships between age and concentrations of creatine (50, 101) and myoinositol (101), neither metric replicated in multiple sclerosis patients (50, 101), in addition to a significant inverse relationship in multiple sclerosis patients between age and whole-brain N-acetyl aspartate (127), spinal N-acetyl aspartate (29), creatine-referenced N-acetyl aspartate in gray or white matter (188), and normal-appearing white-matter glutamate-glutamine (131). Finally, concentrations of white matter and thalamic myoinositol, white matter creatine, and white matter and thalamic choline (99), in addition to the magnitude of the unsuppressed signal from water in white matter (48), have all been shown to increase with age.
With these potentialities under consideration, a large proportion of cross-sectional spectroscopic analyses on multiple sclerosis have included explicit age matching between disease groups and control in their study designs. These endeavors have been marked by varying levels of success. A random-effects model (189) of 106 cross-sectional comparisons of multiple healthy controls and patients with relapsing-remitting multiple sclerosis, mixed multiple sclerosis subtypes, or multiple sclerosis of no designated subtype published from 1991 to 2018, using a previously reported method for interpolating standard deviations (190) in 32 cases, found a mean difference of +2.5 ± 0.8 years in patient relative to control ages, corresponding with a Hedge's g of 0.28 ± 0.09 (p < 0.0001; Figure 4). A similar analysis of 37 cross-sectional investigations between controls and patients with progressive multiple sclerosis (including progressive, primary progressive, and secondary progressive, as well as “relapsing-progressive” and “chronic progressive”) published between 1996 and 2017, using interpolated standard deviations in 7 cases, found a mean difference of +6.7 ± 1.9 years in patient relative to control ages, corresponding with a Hedge's g of 0.73 ± 0.21 (p < 0.0001; Figure 5).
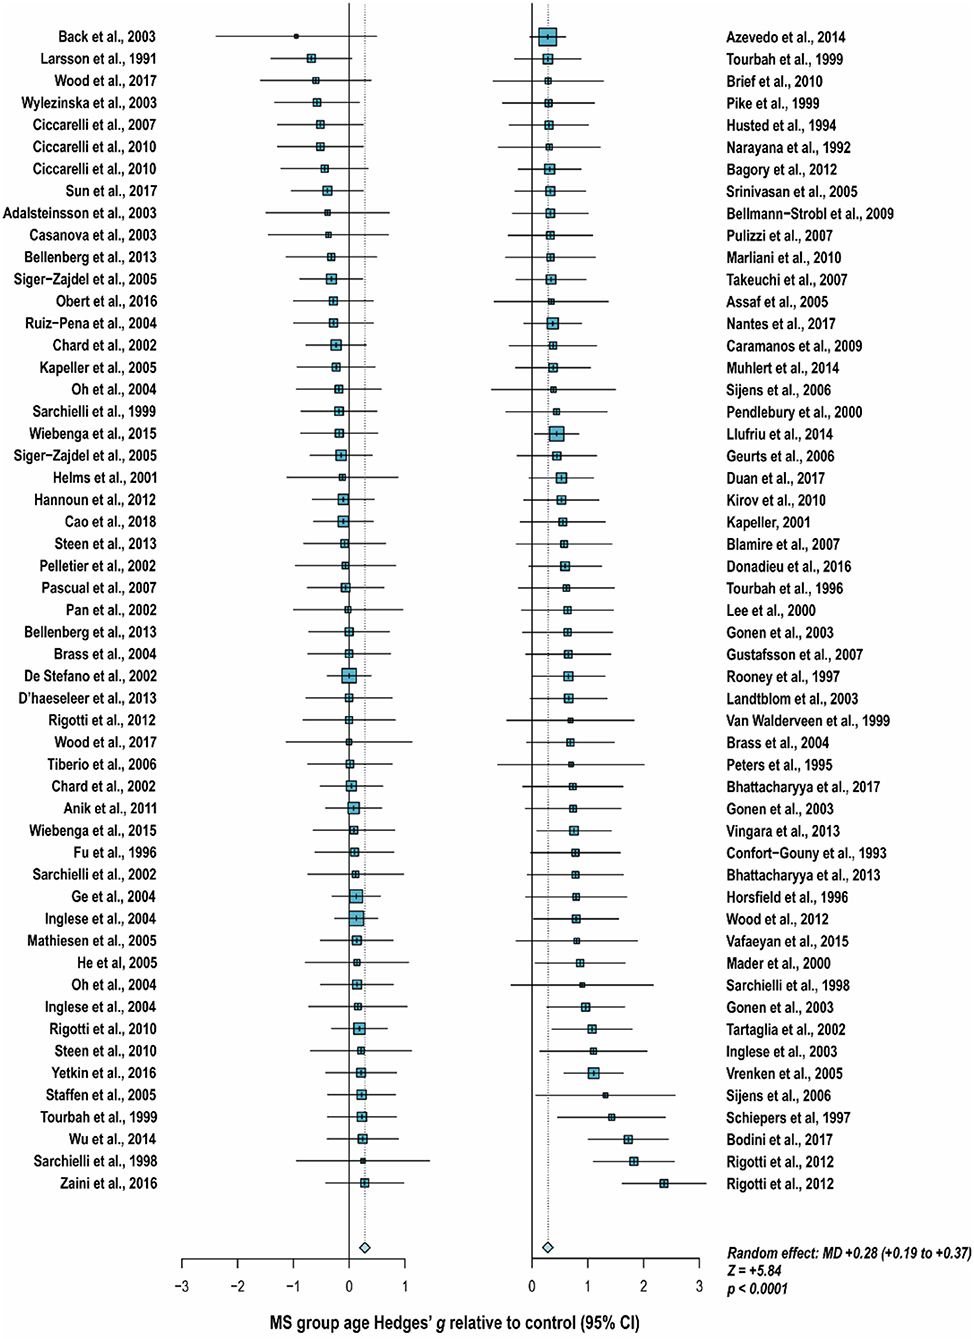
Figure 4. Cross-sectional analyses of relapsing-remitting and mixed multiple sclerosis subtypes published between 1991 and 2018 have reported comparing patient groups with age-matched or younger control groups. Shown are the standardized mean differences between MS patient and control groups of 106 1H-MRS studies published between 1991 and 2018 that report means as well as standard deviations and/or range for group ages examining metabolic differences in the brain and/or spinal cord between individuals with and without relapsing-remitting, unspecified, or mixed subtypes of multiple sclerosis. A random-effects model exhibited a significant effect of group on subject age across the 106 comparisons, with an overall Hedges' g of +0.28 ± 0.09 (mean difference +2.5 ± 0.8 years) and significance level of p < 0.0001. Many analyses attempted to compensate for such age differences in their statistical modeling procedures. Marker area is weighted by group size. MS: multiple sclerosis; MD: standardized mean difference, reported as Hedges' g; CI: confidence interval.
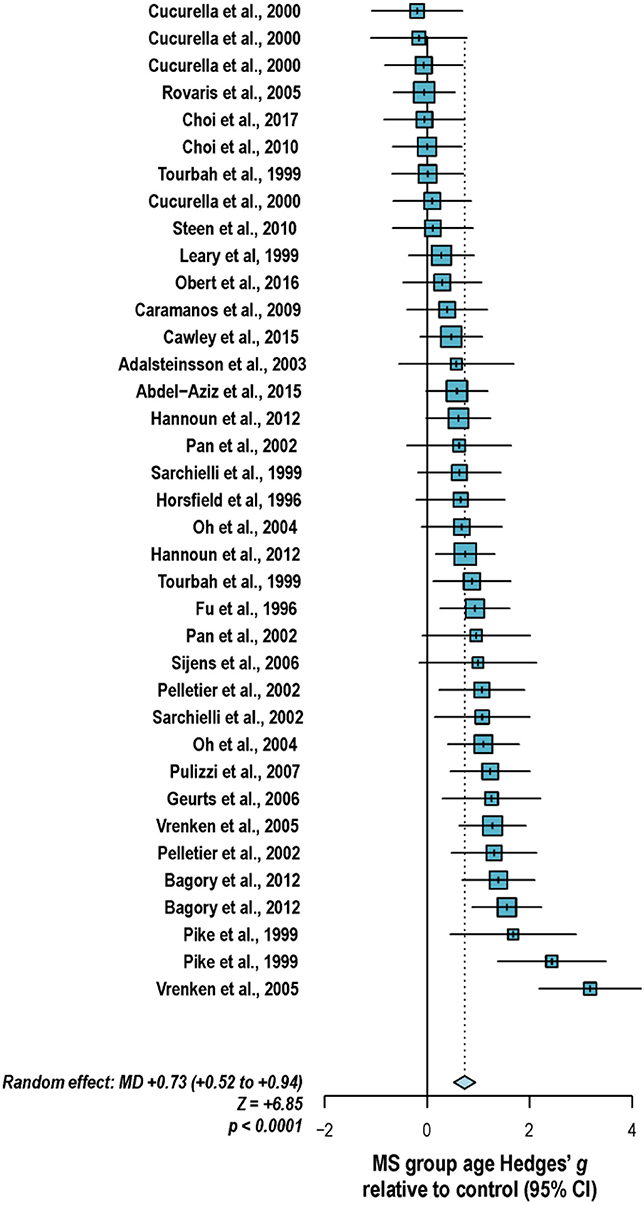
Figure 5. Cross-sectional analyses of progressive multiple sclerosis published between 1996 and 2017 have reported comparing patient groups with age-matched or substantially younger control groups. Shown are the mean differences between multiple sclerosis patient and control groups of 37 1H-MRS studies published between 1996 and 2017 that report means as well as standard deviations and/or range for group ages examining metabolic differences in the brain and/or spinal cord between individuals with and without primary progressive, secondary progressive, progressive relapsing or chronic progressive, or mixed progressive subtypes of multiple sclerosis. A random-effects model exhibited a significant effect of group on subject age across the 37 comparisons, with an overall Hedges' g of +0.73 ± 0.21 (mean difference +6.7 ± 1.9 years) and significance level of p < 0.0001. Many analyses attempted to compensate for such age differences in their statistical modeling procedures. Marker area weighted by group size. MS: multiple sclerosis; MD: standardized mean difference, reported as Hedges' g; CI: confidence interval.
What element of the subtype-specific findings currently published, particularly those involving progressive groups, is influenced by differences in age therefore remains a valid question. While this issue can be skirted by exact age-matching among experimental groups (152), some researchers have contended with ineluctable disparities in group demographics by either confirming the lack of a statistically significant correlation between participant age and salient experimental endpoints, as reported above, or including age values in their statistical models [as in, for example, (66)].
Disease duration is another potential confound that may affect multiple sclerosis subtype-specific trends in metabolite ratios and concentrations. Like age, some research has investigated and found no significant correlation between disease duration and whole-brain N-acetyl aspartate (186, 187); cervical spinal N-acetyl aspartate (110); lesion creatine-referenced N-acetyl aspartate (34, 148), choline (34, 148), or myoinositol (148); white matter creatine-referenced N-acetyl aspartate (34, 63, 148), choline (34, 63, 148), or myoinositol (63, 148); creatine-referenced N-acetyl aspartate, choline, or myoinositol in posterior cingulate gyrus (63); N-acetyl aspartate, choline, or creatine in cortical white matter (64) or occipito-parietal cortex (88); N-acetyl aspartate or choline in cerebellar white matter (98); or N-acetyl aspartate, choline, creatine, or myoinositol in central brain (191). Other research has shown that disease duration may vary inversely with whole-brain N-acetyl aspartate (126, 192, 193), white matter N-acetyl aspartate (110, 194), thalamic N-acetyl aspartate (70), and lesion creatine-referenced N-acetyl aspartate (52) as well as directly with normal-appearing white matter creatine (69, 131). As in considerations of group age-matching, it is therefore important to control for the possibility that apparent metabolic differences ostensibly traceable to disease variant or even age are not being driven by this confound either, and vice-versa.
Sex
Despite the fact that multiple sclerosis, with the possible exception of the primary progressive variant, exhibits a higher and rising predominance in women relative to men (195), few papers have explicitly addressed the question of sex differences in the brain 1H-MRS signatures of the disease. These previous reports have found no sex differences in whole-brain N-acetyl aspartate (186); white matter creatine-referenced N-acetyl aspartate (36); or spinal cord creatine, N-acetyl aspartate, or choline (29). Other non-spectroscopic magnetic resonance studies of multiple sclerosis have found sex differences, however, in contrast-enhancing lesion load (196–198), primary progressive T1-weighted lesion volume (199), and degree of gray matter atrophy (200, 201). To our knowledge no 1H-MRS research to date has explicitly examined the potential interactions between sex and disease state on the metabolic signatures of central nervous tissue.
Especially in light of these reported sex differences on imaging scans, in the absence of robust spectroscopic findings to the contrary, it is prudent to assume a potential for sex differences in brain metabolite concentrations and therefore match experiment groups not only for age but also for sex. In only a few studies (35, 42, 54, 57, 65, 83, 105, 152, 202) was the reported sex composition identical between the control and at least one experimental group; in a handful of others, the statistical influence of imperfect sex-matching was assessed by chi-square analysis (51, 56, 107, 203, 204). An investigation of 134 cross-sectional analyses published between 1992 and 2018 that reported group sex ratios found that, on average, control groups contained 6 percentage points fewer women (range 55% fewer to 30% more) than experimentally compared groups of multiple sclerosis patients, with significant disparities from experimental groups in control for both proportion (t = −2.9, two-tailed p = 0.004) and absolute number (t = −2.6, p = 0.01) of tested women (Figure 6). As in age-biased analysis, a few groups have attempted to control for this potential confound by adjusting for sex in statistical analysis of disease group effect size (56, 64, 100, 103, 118, 119, 124, 134, 136, 191, 205, 206) or, as mentioned, checking separately for associations between sex and 1H-MRS outcomes (29, 36, 103, 186).
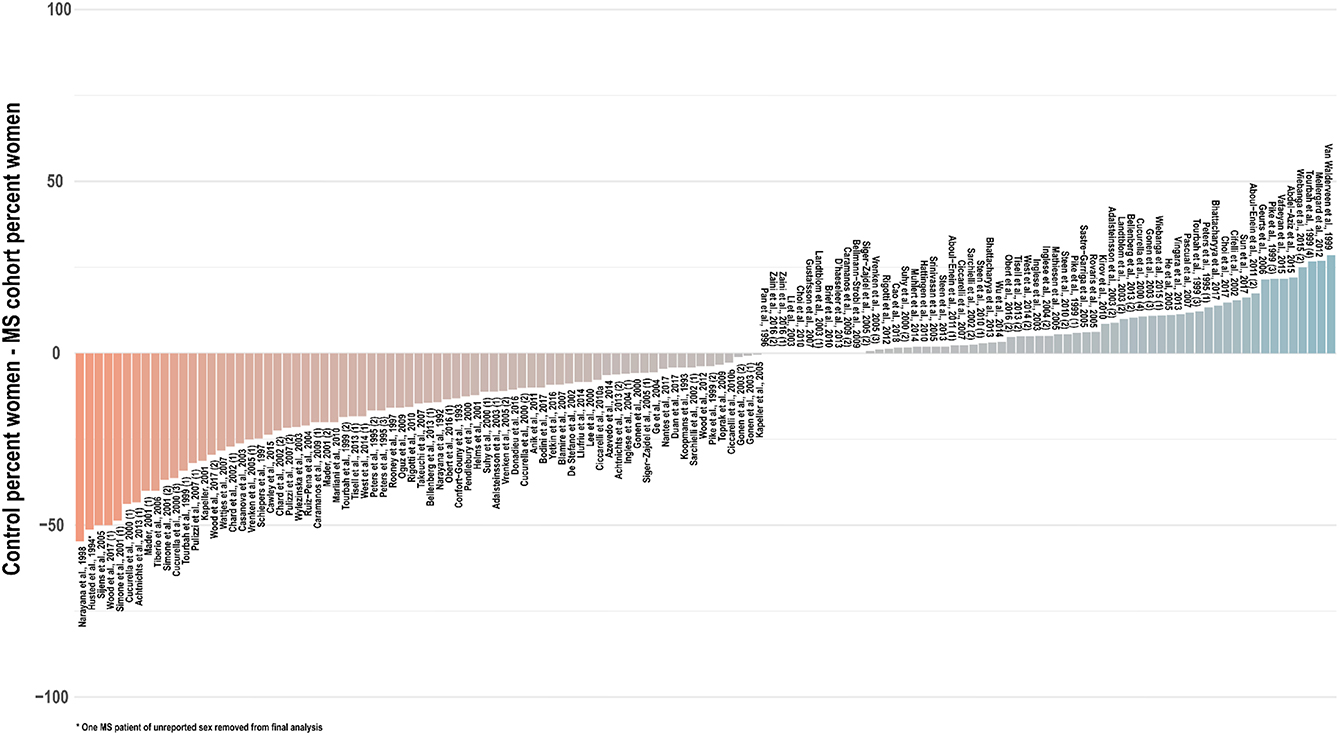
Figure 6. Cross-sectional analyses of relapsing, progressive, unspecified, and mixed subtypes of multiple sclerosis published between 1992 and 2018 have tended to feature control groups with a lower proportion of women than the patient groups with whom they are compared. An investigation of 134 cross-sectional analyses published between 1992 and 2018 that reported group sex ratios found that, on average, control groups contained 6 percentage points fewer women (range 55% fewer to 30% more) than experimentally compared groups of multiple sclerosis patients, with significant disparities from experimental groups in control for both proportion (t = −2.9, two-tailed p = 0.004) and absolute number (t = −2.6, p = 0.01) of tested women. Distinct analyses from the same publications denoted in parentheses. MS: multiple sclerosis.
Spectral Acquisition and Processing
Acquisition Methods
Most research on the brain 1H-MRS signatures of multiple sclerosis has been conducted between 1.5 T and 3 T, with only a handful of studies completed at higher field strengths, including 4 T (54, 135, 162, 188, 192, 207, 208) and 7 T (38, 104). 1H-MRS data exhibit a trend to higher signal to noise with static field strength due to enhanced spin polarization, in addition to higher spectral dispersion deriving from increased precession frequency. Notably, however, due in part to the influences of spatial inhomogeneity in static (B0) and radiofrequency (B1) field profile, increased field strength does not guarantee improved spectral quality (209).
The dearth of studies at fields >3 T may be particularly damning for research on multiple sclerosis physiology due to the difficulty of reliably measuring glutamate at low field. Histology research has previously implicated this molecule in key disease processes, suggesting that synaptic glutamate clearance is compromised in multiple sclerosis white matter (210) and that several molecular contributors to glutamate homeostasis are altered in multiple sclerosis lesions (211). Our ability to examine the role of glutamate in vivo by brain 1H-MRS is limited, however, by the probability that its major resonances from 2.04 to 2.35 ppm can be quantified independently of its metabolic partner glutamine, its own principal multiplets from 2.11 to 2.45 ppm (212). While some sequences may be optimized for the measurement of glutamate at 3 T (213, 214), quantification accuracy for this metabolite has been shown to increase at higher field (215).
As a result, the majority of 1H-MRS research examining the role of glutamate in multiple sclerosis has reported values of glutamate conflated with glutamine as glutamate-glutamine or “Glx,” a classification that has yielded a number of null between-group findings in mixed or relapsing-remitting multiple sclerosis thalamus (99, 149), hippocampus (149), acute (216, 217) and chronic (216) lesions, non-enhancing lesions (172), normal-appearing gray (115) and white (115, 172, 217) matter, and T1-isointense lesions (115), as well as in secondary progressive hippocampus (134), sensorimotor cortex (134), prefrontal cortex (134), normal-appearing white matter (172), and nonenhancing lesions (172) and primary progressive normal-appearing white matter (131). While null results have similarly been yielded in some regions and conditions by studies attempting to quantify glutamate separately from glutamine (69, 92, 106, 117, 149), at least one study has demonstrated alterations in glutamate but not glutamine in the normal-appearing white matter and enhancing lesions (92) of multiple sclerosis patients, suggesting that null findings in Glx could sometimes be influenced by variable but ultimately unremarkable glutamine levels obfuscating potentially systematic abnormalities in glutamate.
In addition to acquisition at higher field strengths to maximize spin polarization and spectral dispersion, studies optimized to quantify metabolites with fast-decaying multiplet resonances like glutamate and the inositols should be conducted at as low an echo time as possible to optimize the signal to noise ratio of these species' already low and broad spectral signatures. Among 197 publications surveyed from 1990 to 2018 that reported the use of 1H-MRS to investigate the brain or spinal tissue in at least one individual with multiple sclerosis, over 45% included sequences of echo times (TE) <40 ms. Among these, at least 26 publications (23, 24, 27, 35, 46, 53, 69, 77, 79, 90–93, 95, 106, 116, 138, 139, 147, 153, 154, 160, 172, 216–219) employed Stimulated Echo Acquisition Mode (STEAM) localization instead of the more commonly used Point-RESolved Spectroscopy (PRESS), of which the former facilitates lower echo times and enables a sharper volume profile at the expense of 50% signal loss relative to the latter. Other short- and long-TE spectral acquisition sequences used have included PRESS with spectral editing (MEscher-GArwood Point-RESolved Spectroscopy or MEGA-PRESS) for GABA (107, 134, 150), chemical shift imaging (CSI) with multiple quantum filtering (151, 152) or band-selective inversion (104) for glutathione, and diffusion-weighted PRESS (38, 103, 206) or STEAM (220), though the latter was used to probe diffusion properties rather than metabolite concentrations.
Almost half of the surveyed papers employed magnetic resonance spectroscopic imaging (MRSI) instead of single-voxel acquisition schemes, including echo-planar spectroscopic imaging (EPSI) (85, 89, 124, 144, 145, 221–223), and other CSI or spectroscopic imaging sequences encoded in two (25, 28, 30, 34, 36, 41, 43, 45, 50, 52, 54, 57, 60–62, 64–66, 68, 72, 73, 80, 81, 83, 87, 93, 94, 115, 119, 130, 131, 133, 135, 141, 159, 162–165, 167, 168, 174, 188, 191, 194, 204, 224–231) or three (102, 121, 122, 137, 202, 232, 233) spatial dimensions. MRSI offers the obvious advantage of enabling metabolic profiling over a large area of multiple tissue types, thereby enabling averaging over gray matter, white matter, and lesions within the same individual, enabling more robust estimates for the metabolic patterns of hypothetically pure tissue (102, 104, 163, 164). The ability to compare spectral outputs against compositional parameters of multi-voxel scans has also been exploited to calculate the water proton signal inherent in a hypothetical cerebrospinal fluid (CSF) voxel by regressing over the CSF partial volumes of multiple MRSI voxels to use the calculated water signal as an internal metabolite quantification reference (162). In addition, MRSI facilitates the investigation of possible regional disparities in disease-related abnormality, independent of lesion localization. A number of papers examining multiple brain regions have found multiple sclerosis to be associated with distinct metabolic abnormalities in different areas of the brain, among, for example, mixed voxels in posterior cingulate cortex, medial PFC, and left hippocampus (150); mixed voxels in sensorimotor cortex, prefrontal cortex, and hippocampus (134); cortical gray matter, thalamus, and hippocampus (106); and mixed voxels in cingulate cortex, parietal cortex, thalamus, and hippocampus (149).
Spectral Quality
The quality of a spectrum obtained by a 1H-MRS experiment is measured predominantly by two related metrics: full width at half maximum (FWHM) of singlet resonances (generally N-acetyl aspartate, creatine, and choline) and signal to noise ratio (SNR) measured from the same peaks.
Within the context of in vivo 1H-MRS, FWHM describes the frequency bandwidth covered at half-height by the singlet used to calculate it. Because a spectrum in the frequency domain represents the Fourier transform of the free induction decay (FID) measured in time domain from excited precessing spins, resonances represented by Lorentzian singlets in frequency domain reflect the exponential decay dynamics of their associated signals in time domain. In particular, the FWHM of a frequency-domain singlet increases with the rate at which its corresponding time-domain FID decays as a result of T2*, driven not only by chemical properties of the nucleus at hand but also by the degree of dephasing imposed by static field inhomogeneity from spatial disparities in the magnetic susceptibilities of local tissues.
SNR describes the amplitude of one or more singlet resonances relative to the standard deviation of peak amplitudes measured over the spectral noise floor; in proton spectroscopy measures this noise denominator is conventionally doubled (234). Its value depends on a number of factors, including the proton density of the species in question, the size of the measured voxel, the receive bandwidth for spectral acquisition, and the flip angle due to the effective B1 fields imposed by RF transmission. Because increasing the width of a spectral peak will reduce its amplitude at constant area, increased FWHM is associated with lower SNR for a metabolite of fixed concentration.
Spectral quality as measured by both FWHM and SNR has been shown to influence the apparent concentrations of metabolites as quantified by 1H-MRS. Simulations of metabolite spectra at 1.5 T, for example, have associated decreases in SNR with significant increases in the standard deviations of quantified concentrations in five commonly quantified metabolites (N-acetyl aspartate, creatine, choline, myoinositol, and glutamate-glutamine) (235). Because of spectral dispersion differences among measurements taken at different field strengths, these patterns may not be generalizable to those at higher static fields. Simulation experiments representing short-TE experiments in the human hippocampus at 4 T have, however, similarly shown that apparent concentration in at least thirteen metabolites is sensitive to both FWHM and especially SNR, with variable influence on each metabolite (236); simulations of both short-TE and editing experiments for GABA and glutathione at 7 T have also demonstrated metabolite-specific relationships between quantification error variance and these spectral quality parameters (237).
Few papers report group comparisons of FWHM in multiple sclerosis vs. control individuals. Water FWHM has been found to be similar between relapsing-remitting patients and controls in posterior cingulate cortex, medial prefrontal cortex, and left hippocampus (150). Within relapsing-remitting patients, metabolite spectral FWHM has also been found to be comparable across chronic lesions, normal-appearing white matter, and cortical gray matter (224). Other research, however, has noted increases in aggregate N-acetyl aspartate, creatine, and choline singlet FWHM in secondary progressive relative to relapsing-remitting patients in cortical gray matter as well as that of primary progressive patients in the thalamus, with values comparable across relapsing-remitting, secondary progressive, and primary progressive multiple sclerosis and control in the hippocampus as well as between multiple sclerosis patients taken together and control in all three regions (106). By contrast, significant differences in metabolite singlet FWHM were not reported among relapsing-remitting multiple sclerosis, secondary progressive multiple sclerosis, and control in normal-appearing white matter or white-matter lesions (172), or among relapsing-remitting, secondary progressive, and primary progressive patients and control in normal-appearing white matter (69).
Decreased SNR has been noted in relapsing-remitting and primary progressive patients relative to control in thalamus or hippocampus but not cortical gray matter, reflective of decreases in the amplitude of the N-acetyl aspartate singlet in multiple sclerosis groups (106). SNR has also been observed to be lower in an edematous lesion than in a comparable region of healthy white matter, though this difference may have been attributable to the smaller measured volume of the former (116). This interpretation is supported by findings of comparable SNR in equal volumes within chronic lesions, normal-appearing white matter, and cortical gray matter in multiple sclerosis patients (224) and in normal-appearing white matter among individuals with relapsing-remitting, secondary progressive, and no multiple sclerosis (172) or relapsing-remitting, primary progressive, secondary progressive, or no multiple sclerosis (69).
Notably, SNR decreases with diffusion due to signal dephasing in spins flowing parallel with the spatial axis of variation in a pair of otherwise balanced gradients. Exploited by diffusion-weighted imaging sequences to locate regions of abnormal tissue microstructure, this property may reduce SNR in voxels in which measured spins exhibit abnormally high diffusivity.
Finally, differential proportions of non-tissue relative to tissue water within a measured voxel, as in a previous work demonstrating higher partial volumes of CSF than control in a frontal cortex voxel from patients with progressive multiple sclerosis (238), may also affect its spectral quality when shim routines are optimized to water signal, which encompasses both CSF and tissue compartments, while metabolites are typically limited to areas of tissue only.
Macromolecule and Lipid Contributions to Spectroscopic Baseline
Complicating but also potentially complementing the measurement of small-molecule metabolites traditionally quantified by 1H-MRS are proton signatures from lipids and proteins. These resonances were once hypothesized to include myelin lipids, which at least one study did not support (239), and suggested to involve methyl and methylene protons from a number of amino acid types within polypeptide chains (240), possibly including those associated with myelin (216). Typically difficult to model and thus quantify and therefore often ignored except in efforts toward removal, these resonances have also exhibited some systematic differences between individuals with and without multiple sclerosis and may thus provide diagnostically useful information.
For example, lipid resonances from 0.8 to 1.5 ppm were qualitatively described as abnormally present in the normal-appearing tissue or lesions of multiple sclerosis patients (93). Resonances suggestive of lipids have additionally been spotted between 0.7 and 1.7 ppm in multiple sclerosis lesions while reported not to have been observed in controls (157). Significant enhancements in broad signals indicative of lipids have also been found in the center of a hyperintense lesion but not in brain tissue lateral to it; furthermore, abnormal lipid signals observed in patients were shown to attenuate to control levels during lesion evolution over the course of several months (24).
In addition, macromolecule resonances concluded to arise from non-lipid sources at 0.9 ppm and 1.3 ppm have exhibited elevations in acute lesions relative to chronic lesions and control white matter, while those at 2.1 and 3.0 ppm appeared to be normal (216), reminiscent of signal increases at 0.9 ppm and 1.3 ppm noted previously in acute plaques (95). While the 0.9 ppm region comprises resonances from both macromolecules and lipids, it has been occasionally found that modeled or measured lipid resonances do not sufficiently account for the amplitude of 0.9 ppm signals observed (95, 216). By contrast, mixed-tissue voxels in sensorimotor but not parietal cortex have exhibited lower macromolecule resonance intensities in multiple sclerosis patients than healthy control (107), though strong peaks from 0.8 to 1.5 ppm have also been observed in some predominantly gray-matter voxels from relapsing-remitting patients but not controls (241). Differences in macromolecular signature between white and gray matter are apparent within individuals with relapsing-remitting disease, whose broad resonances suggestive of macromolecules and lipids at 0.9, 1.2–1.4, and 2.0 ppm have been shown to differ between normal-appearing white matter and gray matter but not between chronic lesions and normal-appearing white matter (224). Other research has found no significant abnormalities in parametrically modeled macromolecule and lipid resonances at 1.7 or 1.2–1.4 ppm among relapsing-remitting normal-appearing white matter, non-enhancing lesions, and control white matter (48).
Because of the relative immobility of protons that inhabit very large molecules like lipids and polypeptides, these species are thought to exhibit shorter transverse relaxation times than those of small-molecule metabolites. This claim is supported by broad frequency-domain signals indicative of fast , by their disappearance at high relative to low echo-time acquisitions, and by relaxometry experiments in animals (242) and humans (240, 243). Many 1H-MRS studies of multiple sclerosis have been able to benefit from this property to minimize the issue of systematically differing macromolecule and lipid contributions to the spectral baseline by measuring at high (135+ ms) echo times (22, 24–26, 30, 31, 33, 34, 36, 37, 39–45, 47, 50–52, 55–62, 64–66, 71–75, 78–81, 83–86, 89, 94, 96, 98, 121–123, 129, 130, 133, 137, 141, 144, 145, 147, 153, 159, 165, 168, 174, 194, 202, 204, 221–223, 226–231, 244–247). Quantifying metabolites from high-TE spectra, however, in addition to exhibiting the problems inherent in reduced SNR, exacerbates the potentially confounding effects of T2 relaxation rates that may systematically differ among experiment groups, as will be discussed in section T2 Relaxation. Sequences at low echo time may alternatively minimize the lipid or macromolecule signals present in the baseline of acquired spectra by inversion preparation (54, 240, 248). This approach nulls the magnetization associated with T1 relaxation time constants resembling that expected for macromolecular resonances. Other studies have included measured or modeled lipids and/or macromolecules in their spectral fitting algorithms (28, 48, 95, 107, 136, 144, 167, 249).
Finally, additional research has attempted to account at once for the confounding influences of lipids, macromolecules, and other non-metabolite spectral irregularities by implementing one or more of the following procedures: fitting a baseline modeled by splines (23, 36, 61, 72, 83, 157) as also used in the popular quantification program LCModel (250), or polynomials (48, 64, 74, 94, 95, 130, 133, 225, 251); averaging a subset of FID points (87, 225); alternative semi-parametric or non-parametric baseline modeling schemes (62, 84, 202, 203); or other correction methods (26, 29, 37, 51, 65, 93, 135, 223); in concert with metabolite quantification procedures.
For the few studies that have employed spectroscopy to observe lactate (24, 47, 69, 90, 101, 142, 146, 153, 154, 157–159, 217, 230, 245) or edited GABA (107, 134, 150, 252, 253) in multiple sclerosis, accounting for the potential confounding presence of lipids or other macromolecules is particularly relevant for accurate quantification. The 1H-MRS resonance for lactate is a doublet at 1.32 ppm, within the range of both suspected macromolecule and lipid peaks previously observed in multiple sclerosis brain tissue. Though this doublet is quantifiable at TE high enough for the spectral signatures of overlapping lipids and macromolecules to have already exhibited more significant T2 decay, the influence of lipid resonances on lactate quantification has been previously reported at TE as long as 272 ms (174). Similarly, spectrally edited GABA difference signals isolated at 3.01 ppm from creatine, phosphocreatine, and glutathione by frequency-specific editing pulses to the J-coupled resonance at 1.89 ppm exhibit, in addition to contamination by the metabolite homocarnosine (254), co-edited macromolecular resonances, motivating the nomenclature “GABA+” in some of the papers that do not employ additional methods to address this confound, as in (150). Unwanted co-editing of macromolecules has been previously minimized by mirroring the editing pulse at the 1.89-ppm GABA peak around the expected frequency location of co-edited macromolecules (253, 255). The effectiveness of this strategy relies on certain assumptions and is vulnerable to radiofrequency pulse displacement and B0 field variation, sometimes motivating supplementary nullification of macromolecular resonances by a pre-sequence inversion pulse (252).
Spectral Quantitation
After 1H-MRS data are acquired and preprocessed, the signals associated with each metabolite in a spectrum are quantified as a first step to calculating the concentrations underlying them. This can be a complex task, as single metabolites are often represented by multiple resonances at different frequencies, and most resonances exhibit some degree of overlap with those of other metabolites. In addition, due to peak splitting in some resonances as a result of J-coupling, some nuclei present as visually complex shapes that are not only reduced in amplitude, decreasing the probability of effective separation from the noise floor, but also increased in spectral width, increasing the probability of overlap with signals from other molecules. Well-defined singlet resonances, such as those from the methyl protons of the N-acetyl aspartate acetyl moiety at 2.01 ppm, creatine at 3.03 ppm, and choline at 3.2 ppm, may be approximately quantified by integration under properly controlled baseline conditions. Supplementing these estimates with information derived from the additional non-singlet resonances of these metabolites, however, or parsing and quantifying metabolites defined solely by low-SNR multiplets that overlap with resonances from other nuclei, such as myoinositol, can become a mathematically intensive modeling problem. This is especially true when considerations of how to best define the spectral baseline are left flexible by imperfect information.
1H-MRS research on multiple sclerosis has historically exhibited a great variety of methods by which to tackle metabolite signal quantification. Among 183 papers published between 1990 and 2018 involving 1H-MRS examination of at least one individual with multiple sclerosis, 51 (27.9%) of them used commercial linear combination modeling package LCModel (250); 36 (19.7%) reported direct integration of key resonances without explicit fitting of basis functions; at least 28 (15.3%) employed software provided by the scanner vendor; 23 (12.6%) reported using other software tools (MRUI or JMRUI (256), TARQUIN (257), Gannet (258), and others); another 22 (12.0%) fit key peaks by simplified lineshapes (Gaussian, Lorentzian, or Voigt) before integrating; 13 (7.1%) employed alternate semi-parametric and parametric combination modeling and quantification schemes; and 10 (5.5%) quantified spectra by peak height alone (Figure 7). These methodological disparities are significant because different quantification methods may exhibit differential vulnerability to confound by variables like spectral overlap, macromolecule- and lipid-heavy baselines, accuracy of measured or simulated metabolite basis functions, and overall spectral quality.
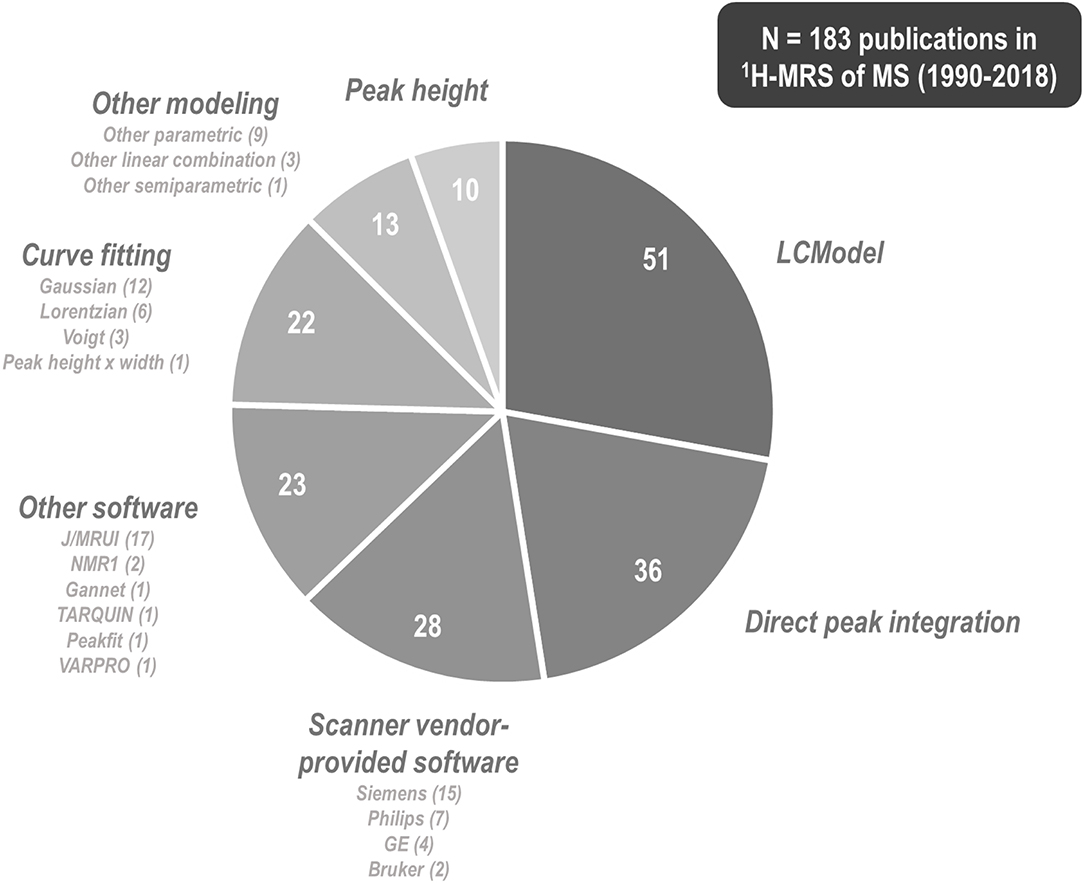
Figure 7. 1H-MRS research into multiple sclerosis has employed a plurality of methods and software programs for spectral quantification. Among 183 papers published between 1990 and 2018 that describe some method of proton magnetic resonance spectroscopy (1H-MRS) quantification for at least one individual with multiple sclerosis (MS), 51 (27.9%) of them used commercial linear combination modeling package LCModel, 36 (19.7%) reported direct integration of key resonances without explicit fitting of basis functions, at least 28 (15.3%) employed software provided by the scanner vendor, 23 (12.6%) reported using other software tools, another 22 (12.0%) fit key peaks by simple analytic functions before integrating, 13 (7.1%) employed alternate semi-parametric and parametric combination modeling and quantification schemes, and 10 (5.4%) quantified spectra by peak height alone. These methodological disparities are significant because different quantification methods may exhibit differential vulnerability to confound by variables like spectral overlap, macromolecule- and lipid-heavy baselines, accuracy of measured or simulated metabolite basis functions, and overall spectral quality.
For quantification algorithms requiring the fitting of measured, simulated, or analytic metabolite basis functions to acquired spectra, it is important that fit quality be quantified in order to determine the suitability of any outputs for inclusion in further analysis and interpretation. One common metric for fit quality assessment is the Cramér-Rao Lower Bound (CRLB; also called the Cramér-Rao Bound), which defines the lower bound of error standard deviation for a metabolite intensity calculated by a particular model fit, given Gaussian uncertainty surrounding a perfectly informed model (259). CRLB are sometimes reported as percentages of quantified metabolite intensity, which causes them to increase as estimated metabolite levels decrease. As has been argued previously, this is significant because many studies use CRLB as a filter for data quality before statistical analysis, cutting out those data points that do not meet a certain minimum threshold (generally 20–50%) for this metric (260). Similarly, in the event that CRLB exhibit systematic disparities between experimental groups, this practice may be problematic for 1H-MRS research into multiple sclerosis by differentially biasing the distribution of data points included in between-group comparisons.
In addition to lower metabolite concentrations, which by necessity will inflate CRLB calculated relative to quantity, decreased SNR, itself also a consequence of reduced metabolite concentration as argued in section Spectral Quality, will also tend to increase the error standard deviations of a model fit and therefore its lower bound. Simulation analysis on diffusion-weighted imaging data has demonstrated that the CRLB on calculated diffusivities decrease with increasing SNR (261). Additionally, examination of experimentally derived metabolite concentrations quantified from nearly identical conditions at 4 T and 7 T showed that average quantification CRLB decreased significantly while SNR nearly doubled from the former to the latter, though increases in spectral dispersion from 4 to 7 T were also cited as a contributing factor to this trend (209). A similar decrease in CRLB with increase in SNR was yielded in a diffusion-weighted 1H-MRS study conducted on multiple sclerosis patients at both 3 T and 7 T (262).
Similarly, increased FWHM effectively reduces spectral dispersion and therefore decreases the orthogonality of resonances to which model functions are applied for quantification by fitting. Mathematically, this is expected to increase the CRLB due to increased correlation between the shape of a resonance and that of others in its spectral environment (259). This theory is evidenced in practice by the aforementioned documentations of decreased CRLB with the greater spectral dispersions inherent in higher field strengths, as well as by additional evidence showing that the degree to which calculated CRLB underestimated actual sample variance decreased with spectral line width of the data (236).
As for FWHM and SNR, few studies report data supporting investigation of systematic differences in CRLB among groups differentially affected by multiple sclerosis. In one MRSI study, more than twice as many voxels from MS patients than control failed to meet the maximum CRLB criterion of 20% and were therefore rejected from analysis, though between-group comparisons of CRLB values before rejection were not reported (57). Another study reported much higher glutamate-glutamine CRLB in lesions and normal-appearing white matter than in cortical gray matter, attributed to lower measured concentrations in the first two tissue types, though, again, no cross-sectional analysis against control values was presented (224).
Metabolite Quantification
Correction for Cerebrospinal Fluid Volume and Voxel Water Molarity Estimation
Multiple sclerosis has been associated with multiple patterns of cortical tissue atrophy relative to age- and sex-matched controls (263). The resultant influence of differential voxel CSF on the absolute concentrations of brain metabolites can be characterized by a few methods. These include image segmentation (62, 84, 99–104, 107, 115, 117–119, 123, 124, 131, 134, 146, 149, 150, 162, 164, 167, 173, 188, 191, 203, 223, 233, 252, 253), compartmentalization by multiexponential modeling of T2 (67, 69, 70, 88, 92, 105, 106, 110, 116, 120, 132), or T1 relaxometry (135).
Less well documented are the potential effects of multiple sclerosis on brain tissue water molarity, important for using water as an internal metabolite quantification reference. Previous examination of this question has demonstrated no significant difference between individuals with and without relapsing-remitting multiple sclerosis in brain tissue water content in the thalamus (70) or normal-appearing white matter (120) but has shown evidence of greater tissue water content in contrast-enhancing lesions than in healthy control brain (116) and reductions in cortical gray-matter water fraction of both relapsing-remitting and secondary progressive patients relative to control (88). While some previous spectroscopy research on multiple sclerosis has used referencing by internal water for metabolite quantification (99, 103, 105, 107, 117–119, 124, 134, 146, 149, 150, 162, 174, 189, 224, 253, 254), the possible confounds of disease-based differences in tissue water molarity can be minimized through use of external referencing for metabolite quantification through water (70, 88, 120), N-acetyl aspartate (82, 109, 111–114, 122, 123, 126, 137, 186, 187, 192, 193, 203, 207, 208, 264, 265), acetate (167), or a mixture of reference metabolites (22, 29, 62, 84, 92, 100, 104, 191, 202, 233). While external referencing via scanning a phantom of known composition carries with it the need to additionally account for differences with the human head in radiofrequency coil load, this factor has been addressed experimentally by scanning the external reference together with the human participant and accounting for signal differences in metabolite and reference voxel location (88, 120); by treating a voxel of CSF, with associated corrections for B1 field differences, as an internalized external reference of pure water (50, 135); or by regressing against the CSF contents of multiple voxels to calculate a pure water reference for the brain regions under study (162, 188). Differences between human and phantom in the rate of signal decay by T1 and T2 relaxation must be additionally corrected for sequences of non-zero echo time and finite repetition time by extrapolation to 0 echo time and infinite repetition time based on either empirical assessment and/or use of literature values of T1 and T2.
Partial Volume Correction for Lesions
Multiple sclerosis lesions have been shown to exhibit multiple metabolic differences from non-lesioned or healthy brain tissue. Lesions of varying enhancement and chronicity have exhibited decreases in N-acetyl aspartate referenced to creatine (25, 34, 60, 78, 144) or otherwise (78, 117, 174); creatine-referenced choline (93, 143), and creatine (117) as well as increases in creatine-referenced choline (25, 34) relative to multiple sclerosis normal-appearing white matter. In particular, acute contrast-enhancing white-matter lesions have demonstrated apparent decreases in N-acetyl aspartate (117) as well as increases in creatine-referenced inositol (24). Chronic or T1-hypointense lesions have exhibited reduced N-acetyl aspartate (22, 115, 137), decreased creatine (22, 137), decreased (137) or increased (115) choline, and increased creatine-referenced myoinositol (148) or no metabolic differences (224) relative to multiple sclerosis normal-appearing white matter. T1-isointense lesions have demonstrated increases in creatine and choline (115) or no difference (137) in creatine, choline, or N-acetyl aspartate relative to multiple sclerosis normal-appearing white matter.
A number of studies control for these potentially confounding differences by avoiding visible lesions in the placement of a spectroscopy voxel within “normal-appearing” brain matter and/or applying manual or automatic image segmentation to the voxel once analyzed in order to numerically correct for lesion partial volume in statistical models. These two methods are limited, however, by the resolution and signal contrast of the imaging sequences employed to identify lesions ideally in the same session as spectroscopic data acquisition. 1H-MRS studies employing post-acquisition lesion identification have used a variety of imaging sequences for this purpose, including T1-weighted imaging with (27, 87, 118, 119, 131, 163, 216, 247) and only without (61, 65, 66, 83, 100, 102, 134, 149, 188, 252, 253) injectable contrast, FLuid-Attenuated Inversion Recovery (FLAIR) (103, 107, 121, 167, 168, 191, 233), proton density imaging (52, 61, 65, 83, 118, 121, 131, 163, 249), T2 weighting (27, 52, 61, 65, 66, 83, 103, 107, 108, 117–119, 121, 124, 134, 149, 163, 247), double inversion recovery (134), and alternative sequences applying both fluid attenuation for CSF nulling and magnetization transfer contrast for signal reduction in normal tissue relative to lesions (87, 146). Each of these methods uncovers a limited range of lesion types. While T1-weighted imaging without contrast may aid in the identification of chronic, hypointense T1-weighted “black holes,” for example, without the injection of contrast agent it is of limited use to identify active lesions marked by increased blood-brain barrier permeability and acute inflammation. On the other hand, T2-weighted FLAIR may be used to identify a more general range of lesions, but this is a broad category of heterogeneous cases whose metabolic signatures may differ based on T1-weighted contrast intensity. With this fact under consideration, a large proportion of 1H-MRS studies on multiple sclerosis have used multiple imaging methods in lesion identification and segmentation (27, 52, 61, 65, 66, 83, 87, 118, 119, 121, 131, 134, 149, 163, 247).
The most rigorous controls for lesion partial volume correction would take into account the range of heterogeneous lesion types potentially present in the brain tissue of an individual with multiple sclerosis. The metabolic composition of T1-weighted lesions has been shown to depend on, for example, their signal intensity relative to the surrounding tissue (22, 115, 233, 265); disparate patterns of metabolic abnormality have also been observed in different T1-weighted lesions depending on whether they are considered to be acute or chronic (77, 92, 148, 216) or contrast-enhancing vs. non-enhancing (245). It has furthermore been argued that active demyelinating lesions may also be characterized based on the presence and spatial arrangement of certain cell types, signaling molecules, and other features of immunopathology (266–269), classifications that have yet to be associated with MR-visible features. In addition, MR-invisible lesion-related biochemical heterogeneity may also be present within normal-appearing white matter: For example, despite not being distinguishable by imaging, normal-appearing white matter that later developed new lesions at 6-month follow-up has reportedly demonstrated higher creatine and choline than corresponding tissue that did not (233). Similarly, post-mortem verification of imaging data has demonstrated that upwards of 80% of gray-matter lesions may be invisible to even double-inversion-recovery imaging sequences (270, 271).
Gray Matter-White Matter Composition
Gray matter derives its name from the gray color taken by the oxidation of vascularized tissue after formalin fixation (272) and largely constitutes the cell bodies of neurons as well as surrounding glial cells. White matter, called so because of the white lipids comprising a major component thereof, represents the myelinated or oligodendrocyte-sheathed axons projecting from them. While both tissue types comprise neurons, oligodendrocytes and precursors, astrocytes, microglia, endothelium, vascular tissue, extracellular matrix components, and, in the case of multiple sclerosis lesion activity, immune cells like T cells as well as activated microglia and macrophages (273), these two tissue classifications exhibit distinctive metabolic signatures. Previous research has demonstrated, for example, significantly higher concentrations of N-acetyl aspartate, creatine, and choline in gray than in white matter (274). Differences in the relative proportions of gray and white matter in mixed-tissue voxels between individuals with and without multiple sclerosis may consequently obscure disease-associated disparities in metabolite concentration within each tissue type. The apparent diffusion coefficients (275) as well as T1 and T2 relaxation times of some major metabolites (276) have also been shown to differ between gray and white matter, implying that any such signal weighting imposed by a pulse sequence on these metabolites as quantified from a particular voxel will be influenced by its gray-white matter composition.
In addition, while ample evidence of abnormal concentrations of N-acetyl aspartate (54, 70, 83, 94, 100, 103, 104, 106, 115, 118, 119, 121, 122, 131–133), glutamate-glutamine (119, 131), choline (119, 122, 144), creatine (133), and inositols (106) in the gray matter of individuals with multiple sclerosis refutes the outdated notion that multiple sclerosis is a white-matter disease, some evidence from the 1H-MRS literature alone suggests differences in its relative effects on gray and white matter. While gray-white matter composition has been found to be similar in posterior cingulate cortex, medial prefrontal cortex, and left hippocampus between healthy controls and individuals with relapsing-remitting multiple sclerosis (150), as well as in a slab of voxels from central brain between controls and primary progressive multiple sclerosis (131), other research has shown decreases in total brain white but not gray matter fraction in secondary progressive multiple sclerosis relative to control (134). Research in imaging has suggested that rates of neurodegeneration in multiple sclerosis may differ not only by region (277) but also by tissue type (278–280), predicting voxel composition differences from control that could affect the spectroscopic analysis thereof.
Researchers using 1H-MRS to study multiple sclerosis have attempted to contend with this potential confound in a few different ways. Foremost among these is to restrict the voxel(s) from which spectra are acquired to either white or gray matter [see (23, 40, 90, 92, 105) for just a few examples], though this method reduces the maximum potential SNR via constraints to voxel size as well as promotes partial volume contamination in the event that measured volumes are not segmented and selectively excluded post-acquisition. Other investigations have used MRSI to measure mixed-tissue volumes and then segmentation to classify them as either white or gray matter (131, 233). A variant on this approach has been to regress metabolite signals from multiple voxels against percent of white or gray matter to derive “pure” white or gray-matter estimates (102, 104, 163, 164). Still others have acquired data from mixed-tissue voxels and included voxel composition as covariates in statistical analysis [for example, (103, 118)].
T1 Relaxation
Longitudinal or spin-lattice relaxation time constant T1 describes the nucleus-specific rate at which proton spins excited by a radiofrequency pulse relax exponentially back to thermodynamic equilibrium, affecting the amount of magnetization available for re-excitation and subsequent measurement (281). As T1 depends in part on features of the local chemical environment, consistent disparities in tissue T1 between individuals with and without multiple sclerosis may exist and systematically influence investigations of apparent metabolic abnormality in the former.
Brain tissue affected by multiple sclerosis may exhibit abnormal T1 relaxivity that NMR analysis has suggested could vary with tissue water content (282). Whole-brain mapping of water T1 has found, for example, higher modal water T1 in normal-appearing white matter as well as gray matter in MS patients relative to control, with secondary progressive patients exhibiting histogram peaks at higher T1 values than those of with either relapsing-remitting or primary progressive disease (283). Other research has associated longer T1 relaxation in multiple sclerosis lesions with lower concentrations of N-acetyl aspartate and increased inositol, potentially reflective of axonal damage and gliosis (265). This result was recapitulated in lesions, in which multiple sclerosis patients demonstrated prolongations of water T1 relative to control that correlated inversely with measured concentrations of N-acetyl aspartate, choline, and creatine (22), while another study found that T1 correlated positively with N-acetyl aspartate in patients with few focal lesions but negatively with choline in those with many (284). Water T1 values have been shown to increase in gray matter for progressive but not relapsing-remitting multiple sclerosis patients relative to healthy control, as well as in enhancing relative to non-enhancing lesions within both relapsing-remitting and progressive multiple sclerosis patients (285). Quantitative MRI (qMRI) measurements of water T1 have additionally demonstrated higher values than control in diffusely abnormal white matter even in the absence of T1 abnormality in normal-appearing white matter, further supporting the idea that the degree of relaxivity difference from control can be tissue-specific (284). Limited evidence suggests that multiple sclerosis pathology may differentially affect the T1 of water, dominated by a fluid compartment, and metabolites, typically bound to tissue compartments: One study of eight patients and eight controls, for instance, indicated that occipital and parietal lesions exhibited increases in water T1 but decreases in choline T1 relative to control white matter, even while the T1 of creatine, N-acetyl aspartate, and myoinositol did not change significantly (249).
The magnitude of influence by T1 relaxation on an experiment can be adjusted by altering long sequence intervals like repetition time TR, inversion time TI, and mixing time TM. A sizeable portion of 1H-MRS research on multiple sclerosis attempts to skirt the issue of T1 effects on metabolite quantification by employing pulse sequences with long repetition times. This strategy, however, is imperfect, as the T1 of not only water (286) but also metabolites (276) can be as long as one second or more in the brain, requiring repetition times of several seconds to avoid significant T1 weighting given the rule of thumb that as much as five times a species' T1 is required for what is considered an adequate return to equilibrium. Some studies reporting absolute concentration values attempt to explicitly consider the effects of T1 by including published T1 values for metabolites and/or water (29, 80, 91, 94, 96, 98, 100, 102, 103, 105, 107, 122, 123, 129, 130, 133, 135, 137, 149, 162, 167, 188, 191, 202, 229, 233, 252, 253) in their quantitation algorithms. This approach, however, does not necessarily account for potential disparities in relaxivity based on region, sequence, disease state, and other experiment-specific variables. Some research has attempted to maximize the applicability of literature values for T1 by taking into account voxel composition of gray matter, white matter, and/or CSF and water and/or metabolite T1 differences thereof (100, 107, 149, 162, 252, 253). Few studies to date empirically correct for these potential confounds by estimating them in-house for the cohort under study (92, 163, 164, 249, 265), examining their potential effects on the measurements acquired (55), or applying disease-specific T1 values from the literature to the experimental groups at hand (107).
T2 Relaxation
Transverse or spin-spin relaxation time constant T2 is an exponential decay constant that describes the rate at which the transverse magnetization of a proton sample shrinks over time as a result of dephasing from interactions among spins (pure T2) and spatial B0 field variation across the measurement volume (described by T2', the synthesis of which with T2 is called ). Like T1, T2 is a nucleus- and tissue-specific property that affects the apparent concentrations of measured metabolites by influencing the signal available for acquisition and quantification (281).
Previous research suggests that water T2 differs between individuals with and without multiple sclerosis. For example, multiple sclerosis normal-appearing white matter, diffusely abnormal or “dirty” white matter, non-enhancing lesions, and enhancing lesions have all demonstrated higher water T2 than the normal white matter of controls. Among lesions, the magnitude of this increase appeared to depend on contrast type, with black hole lesions exhibiting the highest water T2 and non-enhancing isointense or enhancing lesions exhibiting the lowest (287). In addition, relative to diffuse lesions, focal multiple sclerosis spinal lesions have demonstrated increased water T2, which correlated negatively with choline measured in the voxel (29), a finding corroborated in another study that found increases in both the coefficient and value of the long component of biexponential water T2 in contrast-enhancing multiple sclerosis ring lesions relative to control, the value of which correlated inversely with measured N-acetyl aspartate and creatine concentrations (116). Other research found that normal-appearing white matter water T2 correlated positively with N-acetyl aspartate concentration in relapsing-remitting multiple sclerosis patients with few visible lesions but not in those with many (284).
Observations of metabolite T2 alterations in multiple sclerosis, however, have been limited. Research in mostly gray matter mixed-tissue voxels has found minimal effect of relapsing-remitting and secondary progressive multiple sclerosis on metabolite T2 despite significant reductions in water T2 (88). Similarly, metabolite T2 were comparable between multiple sclerosis lesions and normal-appearing white matter despite expected increases in water T2 evinced by changes in image contrast; reductions from control in multiple sclerosis gray and white matter T2 estimates for N-acetyl aspartate, creatine, and choline also fell within the range of intra-subject variation (232). One study comparing apparent metabolite ratios measured by 1H-MRS at short and long echo times has suggested potential decreases in choline relative to creatine T2 in white-matter voxels that contained 25–50% lesion (55).
Postmortem relaxometry of spinal cord lesions supports the notion that pathological increases in lesion water T2 may reflect the degree of local demyelination (288), which may increase the fraction of voxel water protons available to diffuse through the extracellular space and contribute to a longer T2 component (116). On the other hand, observed decreases in metabolite T2 have been tentatively attributed to potential reductions in brain cell size from osmotic flight of intracellular water and compression by a denser local population of glia (191, 232), increasing the frequency of dephasing interactions among intracellular metabolite spins. Resonance-invariant change in T2 with disease is therefore not a physical necessity.
As previously discussed, macromolecules and lipids are considered to exhibit faster T2 decay than small-molecule metabolites. The presence of these compounds may therefore disproportionately influence metabolite concentrations at lower echo times, therefore confounding the T2 relaxation constants estimated from them. If macromolecular baselines are expected to differ between two groups, then, estimated T2 may also differ. This possibility has been raised as a potential confound underlying the investigation of age-related effects on metabolite T2 (289) and may thus also contribute to any apparent abnormalities in relaxivity found in multiple sclerosis if not properly controlled. The influence of this factor may be minimized, as mentioned in section Macromolecule and Lipid Contributions to the Spectroscopic Baseline, by building pulse sequences that properly null these signals for short-echo-time measurements or by accounting for them in subsequent analysis.
Since T2 represents the decay of proton signal due to dephasing following spin excitation, its influence on measured signals increases with echo time. One sequence for whole-brain N-acetyl aspartate measurement therefore minimizes this issue by effectively acquiring at zero echo time (113, 114, 125–128, 186, 187, 192, 193, 207, 208). Another way of minimizing the confounding influence of T2 on apparent metabolite concentrations has been, as in controlling for T1, to account for the T2 of water and/or metabolites by applying values from the literature (80, 84, 94, 96, 98, 105, 122, 123, 129, 130, 133, 137, 167, 188, 191, 202, 203, 227, 229), including to calculations accounting for the particular tissue composition of each voxel (107, 149, 162, 233, 252, 253). More precision may be offered by estimating T2 directly in the system at hand (29, 67, 70, 88, 92, 100, 101, 107, 116, 120, 135), though for maximum utility any such approach would be applied to all compounds under study.
B1 Transmit and Receive Sensitivity
In 1H-MRS, B1 refers to the strength of local magnetic fields imposed by radiofrequency waves emitted by either the transmit coil (transmit or ) or protons precessing on the transverse plane (receive or ). In addition to contributing to variance among participants or between metabolite signals acquired from in vivo and phantom scans, non-uniform B1 has been shown to disproportionately affect the intensities of coupled relative to singlet resonances (290). This confound is difficult to unravel in data post-processing and may impact the quantification of molecules like N-acetyl aspartate, glutamate, glutathione, and GABA, especially when they are referenced to metabolites with non-coupled spin systems, like creatine.
Both transmit and receive B1 inhomogeneity may also play a role in studies in which metabolites are quantified relative to a signal external to the voxel used for spectroscopy, such as the water signal from the ventricles or a separately measured metabolite phantom. Because individuals with multiple sclerosis can exhibit wider ventricles than those without (291), one may imagine a scenario in which periventricular cortical voxels are systematically located more peripherally in those with more progressed disease. Depending on the field profiles of the transmit pulses and receive coils used, such an offset may lead to either over- or underestimation of the metabolites at hand in this cohort, especially at higher field strengths at which increased Larmor frequency necessitates the use of radiofrequency pulses of a wavelength shorter than the diameter of the human skull. For example, a significant increase in SNR at the brain center relative to the periphery has been previously reported using a volume coil at 7 Tesla; correspondingly, peripheral B1 was measured to be more than 40% lower than that in the center (292). Correspondingly, post-acquisition correction for the effects of B1 transmit inhomogeneity on 1H-MRSI metabolite acquisitions at 7 T was shown to decrease the apparent concentration of NAA in the center of a phantom and increase it on the periphery (104). Such disparities must be accounted for in any quantification scheme that does not employ an internal standard within the same voxel as the metabolite in question, such as in external referencing to a phantom.
The possibility that multiple sclerosis pathology itself affects B1 field strength has received limited treatment in the proton spectroscopy literature, though it has been empirically considered in a cross-sectional comparison of chemical exchange saturation transfer (CEST) measurements of glutamate in the spinal cord of multiple sclerosis patients vs. controls, in which the two groups were shown to exhibit no differences in flip angle due to disparities in penetrance (293).
Heterogeneity in B1 receive or profiles has sometimes been corrected in post-acquisition spectral preprocessing using the sensitivity profile of the coil (64, 84). maps have similarly been measured for later correction of spectral intensities due to local differences in induced flip angle (104, 162, 188). In addition, differences in transmit and receive B1 sensitivity between signal acquisitions in vivo and in the phantoms used for absolute metabolite quantification have been estimated to enable appropriate comparison of in vivo relative to phantom signal ratios (70, 116). Finally, previous examinations of multiple sclerosis using 1H-MRS exhibit limited use of adiabatic pulses to improve B1 homogeneity (188).
Outlook and Conclusions
Since its first application in 1946, 1H-MRS has offered a safe and flexible means of noninvasively estimating the concentrations of various small-molecule metabolites in living tissue, including the brain. Though over 190 original research and case reports using 1H-MRS to examine the central nervous system metabolic signatures of multiple sclerosis have been published since 1990, the field continues to lack knowledge of a single metabolite alteration that can enable the identification of multiple sclerosis with sufficient sensitivity and specificity for appropriate clinical use.
An abundance of evidence exists, for example, that cortical N-acetyl aspartate in both gray and white matter drops with relapsing-remitting (Figure 1), secondary progressive (Figure 2), and primary progressive (Figure 3) multiple sclerosis, but even this effect, the most robust across the 1H-MRS literature on multiple sclerosis, is subtle and not always reproduced. Among 64 publications reporting comparisons with control in this metric for individuals with unspecified or mixed, relapsing-remitting, or progressive phenotypes in voxels that were not predominantly lesions, 22 publications did not reject the null hypothesis for comparisons in at least one tissue type, and 11 reported only null results, for creatine-referenced N-acetyl aspartate (Table 1).
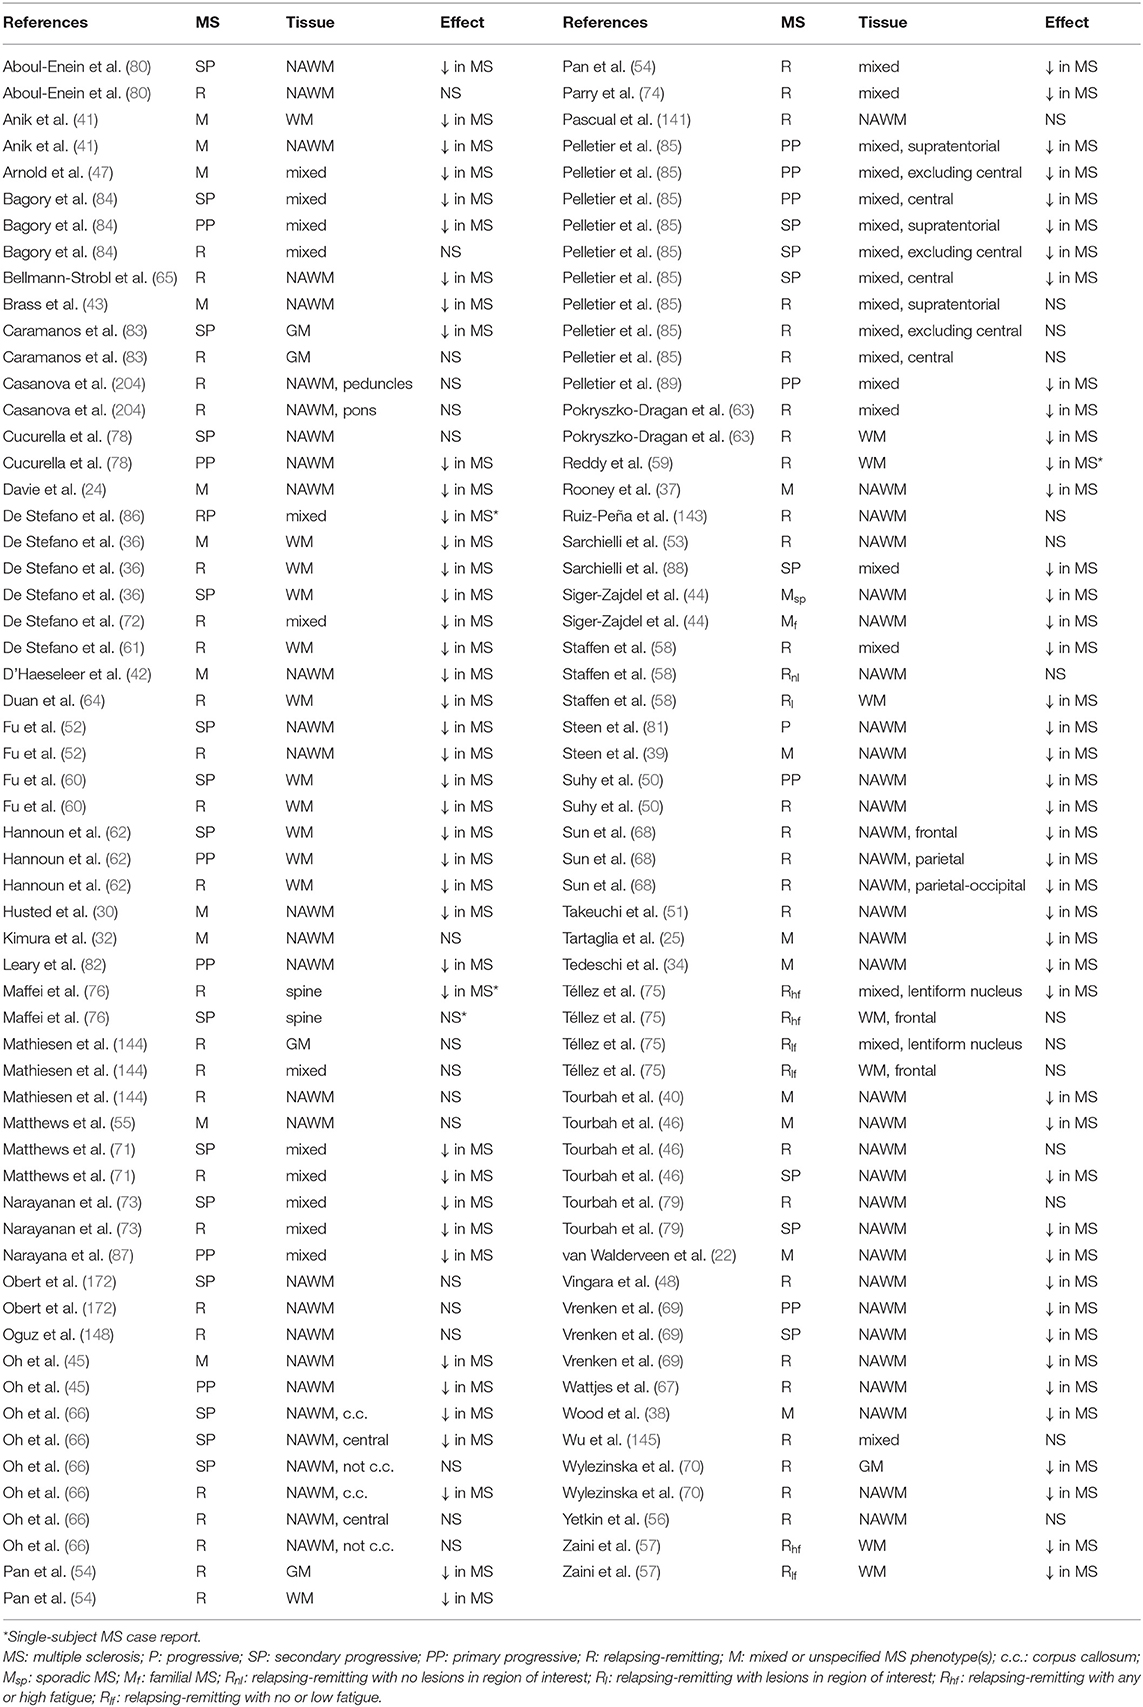
Table 1. Studies using 1H-MRS to examine difference from control in tNAA/tCr ratios in brain or spine non-lesion tissue.
Among those studies reporting significant between-group effects of disease on creatine-referenced N-acetyl aspartate, the largest effect size from a fixed-effects model (189) of studies conducted on individuals with various multiple sclerosis phenotypes was for comparisons involving progressive multiple sclerosis cohorts (including mixed or unspecified progressive, secondary progressive, and primary progressive), with a standardized mean difference (Hedges' g) of −1.50 in 25 comparisons over 16 publications reporting group sizes, means, and labeled standard deviations or errors for creatine-referenced N-acetyl aspartate as measured by 1H-MRS in voxels that were not predominantly lesions (Figure 8). This effect size is comparable to the standardized mean differences between secondary progressive cohorts and control, also reported as Hedges' g, found by Caramanos et al. (294) for absolute total N-acetyl aspartate concentrations reported in comparisons over studies on normal-appearing white matter (g = −0.96, N = 7, p = 0.039) and normal-appearing gray matter (g = −1.29, N = 4, p = 0.0522); our estimate is likely slightly larger than these published values due to its inclusion of studies examining primary progressive patients as well as white-matter voxels containing some lesioned tissue.
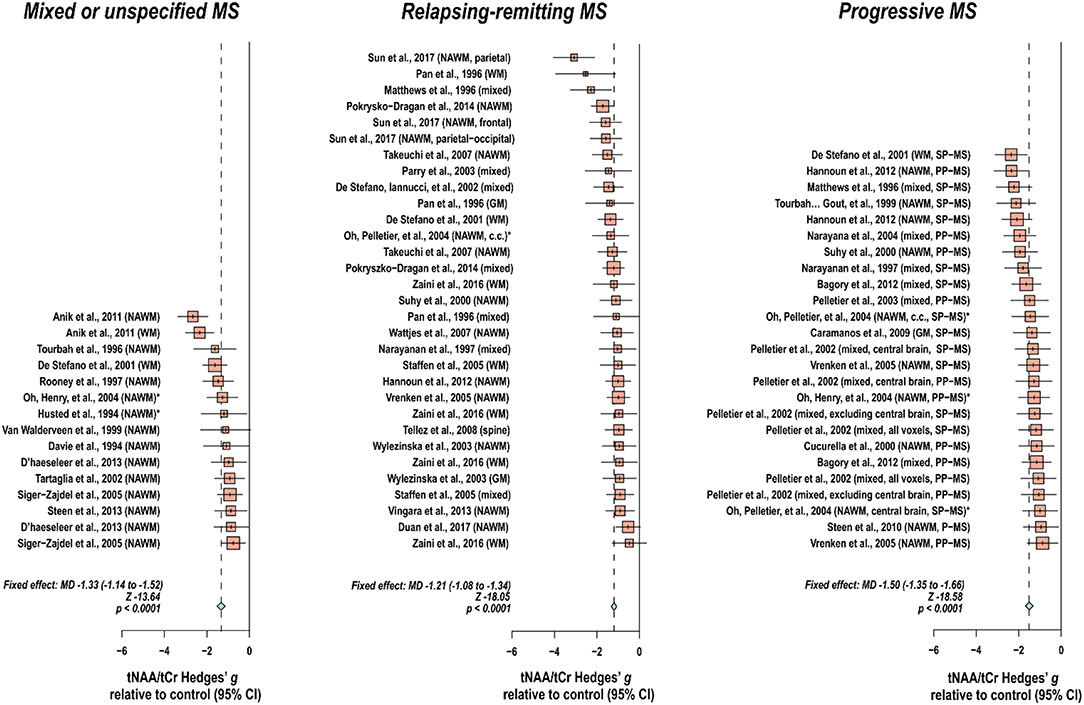
Figure 8. Effect sizes for disease state by multiple sclerosis phenotype in creatine-referenced N-acetyl aspartate as measured by 1H-MRS. Among 64 publications reporting comparisons with control in proton magnetic resonance spectroscopy (1H-MRS) N-acetyl aspartate referenced to creatine for individuals with unspecified or mixed, relapsing-remitting, or progressive MS phenotypes in non-lesion voxels, 22 publications did not reject the null hypothesis for comparisons in at least one tissue type (Table 1). Among those reporting significant between-group effects of disease on this parameter, the largest effect size from meta-analysis of studies conducted on individuals with various MS phenotypes was for comparisons involving progressive MS cohorts (including unspecified progressive, secondary progressive, and primary progressive), with a standardized mean difference (Hedges' g) of −1.50 in 25 comparisons over 16 publications reporting group sizes, means, and labeled standard deviations or errors for this metabolite in voxels that were not predominantly lesions. *Standard deviations calculated from group sizes and standard errors. MD: standardized mean difference, reported as Hedges' g; CI: Confidence interval; NAWM: normal-appearing white matter; WM: white matter; GM: gray matter; SP-MS: secondary progressive multiple sclerosis; PP-MS: primary progressive multiple sclerosis; c.c.: corpus callosum.
In contrast to this broad range of findings, 1H-MRS detection of 2-hydroxyglutarate for brain tumor characterization, a rare category of 1H-MRS clinical applications for which insurance reimbursement is sometimes considered (14), has previously demonstrated in at least one analysis all-or-nothing association with the presence of isocitrate dehydrogenase mutation status in gliomas (295), supporting, according to a 2018 meta-analysis of 14 studies, a pooled sensitivity of 95% (296). Even this application of 1H-MRS, however, is suboptimal for patients whose tumors have already undergone resection or radiotherapy and still not considered definitive in the absence of a biopsy (297).
In addition to appearing to lack a sufficiently reproducible effect size for application to rule-based diagnostics of single individuals, reductions in N-acetyl aspartate in normal-appearing or lesioned brain matter are also not specific to multiple sclerosis, also having been found in diabetes mellitus cortex (298), lupus gray and white matter (299), and HIV basal ganglia (300). Moreover, among conditions demonstrating lesion activity on magnetic resonance imaging for which 1H-MRS might serve as an auxiliary toward differential diagnosis, N-acetyl aspartate has similarly been reported to decrease in, among others, acute disseminated encephalomyelitis lesions (301) and lesioned tissue in patients with cerebral small vessel disease (SVD) (302). Along the same lines, one classification analysis of demyelinating lesions and gliomas based on N-acetyl aspartate alone incorrectly classified every demyelinating lesion, even while it demonstrated higher than chance accuracy to differentiate among glioma types (230). One notable exception to the low specificity of N-acetyl aspartate reductions to multiple sclerosis may be in the differentiation between multiple sclerosis and neuromyelitis optica (NMO), as NMO has demonstrated increased N-acetyl aspartate concentration relative to multiple sclerosis while not differing from control in white matter (64), recapitulating a previous report of normalcy in both white and gray matter (303). Additionally, as mentioned, a limited number of studies comparing multiple sclerosis subtypes have reported evidence suggesting greater decreases in N-acetyl aspartate in secondary progressive than relapsing-remitting white matter (36, 79, 80, 105, 120). Despite these counterexamples, taken together, the state of the current literature suggests that even the most reproduced finding of metabolic abnormality in the 1H-MRS literature on multiple sclerosis is currently not widely applicable as a diagnostic biomarker.
In a recent survey of the in vivo proton magnetic resonance spectroscopy community, “inconsistent or unreliable data quality/reproducibility” was weighted most heavily as the largest practical barrier to the wider clinical application of MRS. Evidence-based standards for generating high-quality spectroscopic data, as those reported by the same work (234), thus appear to represent a welcome point of methodological improvement that may bear fruit for improving the sensitivity and specificity of potential biomarkers derived from 1H-MRS, not just for multiple sclerosis diagnosis but for a variety of clinical applications. These include, among others, maximally short TE and long TR to minimize signal degradation and confound by relaxation effects, use of adiabatic pulse sequences like LASER, and spectral quantification based on model fits rather than reliance on scanner software or direct integration of spectral lineshapes (234).
Also promising to multiple sclerosis diagnostics may be the determination of a potential disease-specific signature of subtle alterations in many metabolites. While one aforementioned study boasted a 100% failure rate at acute demyelinating lesion identification when it employed a predictive algorithm built using linear discriminant analysis of N-acetyl aspartate concentration alone, the inclusion of additional inputs from choline, creatine, lactate, and lipids enabled a 100% cross-validation accuracy for demyelinating lesions and 99% cross-validation accuracy over the whole sample of lesions, glioblastomas, and astrocytomas (230). Similarly, analysis over multiple inputs has demonstrated superior accuracy over single-feature metrics in efforts to use patient demographics and existing magnetic resonance images to predict second attacks in clinically isolated syndrome (304). The addition of metabolite ratios among N-acetyl aspartate, choline, and creatine as measured by 1H-MRS slightly increased F1 score in linear discriminant analyses using age, disease duration, lesion load, and expanded disability status scale (EDSS) score to distinguish between clinically isolated syndrome and relapse-onset multiple sclerosis, between relapsing-remitting and primary progressive multiple sclerosis, and between relapsing-remitting and secondary progressive multiple sclerosis (305). With a continued explosion of free software libraries and packages enabling the straightforward implementation of a varied zoo of iterative classification and learning algorithms, like scikit-learn (306), PyTorch (307), TensorFlow (308), and others in Python and a number of packages in R (309), the influence of such approaches is likely to grow in coming years (310).
In the case of analysis pipelines that output intuitively interpretable models, like decision trees built on untransformed metabolite ratios, or classifiers that can be otherwise queried to determine the relative importance of particular features (311), some classification algorithms can not only offer practically useful diagnostic tools but also provide novel insights about the physiology of multiple sclerosis and reshape priorities regarding the metabolic targets of future investigations thereof. As with any analysis, however, the accuracy and generalizability of even the most sophisticated classifier depends on the precision and reproducibility, respectively, of its inputs. A systematically shorter T2 in white-matter metabolite resonances comprising the creatine signal of multiple sclerosis patients relative to control may, for example, enable a classifier to identify patients on the basis of higher apparent concentrations of creatine-referenced choline acquired from a long-TE scan. Regardless of the potentially even perfect cross-validation accuracy achievable by this classifier, because its inputs are artefactually based on creatine T2, which disproportionately affects those metabolite signals referenced to creatine and acquired at long echo time, and not on molecular concentrations, which are theoretically invariant to such sequence parameters, such a classifier could not be confidently generalized until the source of the original between-group difference—creatine T2 and not choline concentration—were appreciated with precision and subsequent clinical applications limited accordingly.
Such an appreciation of the intricate web of factors upon which a metabolite concentration obtained via proton spectroscopy rests, however, depends on thorough understanding and careful control of many subtleties in 1H-MRS experiment design, acquisition and processing, and spectral quantitation, as well as their incidental or necessary alteration with multiple sclerosis disease state. In practice, this means offering and demanding not only commonly accepted but also evidence-based standards for spectroscopic data acquisition, analysis, and reporting (234). It also means evaluating new data with as much an eye to the potential methodological confounds of proton spectroscopy as to the novelty or biological plausibility of the putative findings at hand. With such an appreciation for the many methodological details overviewed in the present review, the march toward suitable diagnostic biomarkers for multiple sclerosis may be a slow one, perhaps occasionally punctuated by stepwise advances in the quality or throughput of 1H-MRS acquisitions or the information complexity enabled by techniques for extracting clinically useful features thereof. Greater characterization and understanding of each step taken, however, increases the capacity of the field to self-correct in a meaningful direction, ultimately maximizing the probability of safe and accurate multiple sclerosis diagnostic pipelines supported by information derived from 1H-MRS.
Author Contributions
KS reviewed literature, tabulated data, performed statistical analysis, composed, edited, and approved manuscript. KL, DP, and CJ edited and approved manuscript.
Funding
This research was funded by the National Multiple Sclerosis Society (NMSS) grant In Vivo Metabolomics of Oxidative Stress with 7 Tesla Magnetic Resonance Spectroscopy (RG 5319). This publication was furthermore made possible by CTSA Grant Number UL1 TR000142 from the National Center for Advancing Translational Science (NCATS), components of the National Institutes of Health (NIH), and NIH Roadmap for Medical Research. Its contents are solely the responsibility of the authors and do not necessarily represent the official view of the NIH.
Conflict of Interest
The authors declare that the research was conducted in the absence of any commercial or financial relationships that could be construed as a potential conflict of interest.
References
1. Little WA. Conductivity and Magnetism: The Legacy of Felix Bloch: Proceedings of the Symposium, 27-28 October 1989, Stanford, USA. Singapore; Teaneck, NJ: World Scientific (1990). doi: 10.1142/9789814540537
2. Shaw D. Localization of metabolites in animal and human-tissues using P-31 - Topical Magnetic-Resonance (Tmr). J Comput Assist Tomo. (1981) 5:299–300. doi: 10.1097/00004728-198104000-00044
3. Dixon WT. Simple proton spectroscopic imaging. Radiology. (1984) 153:189–94. doi: 10.1148/radiology.153.1.6089263
4. Hilal SK, Maudsley AA, Ra JB, Simon HE, Roschmann P, Wittekoek S, et al. In vivo NMR imaging of sodium-23 in the human head. J Comput Assist Tomogr. (1985) 9:1–7. doi: 10.1097/00004728-198501000-00001
5. Bottomley PA. Noninvasive study of high-energy phosphate metabolism in human heart by depth-resolved 31P NMR spectroscopy. Science. (1985) 229:769–72. doi: 10.1126/science.4023711
6. Sijens PE, Wijrdeman HK, Moerland MA, Bakker CJ, Vermeulen JW, Luyten PR. Human breast cancer In vivo: H-1 and P-31 MR spectroscopy at 1.5 T. Radiology. (1988) 169:615–20. doi: 10.1148/radiology.169.3.2847230
7. Rosen BR, Fleming DM, Kushner DC, Zaner KS, Buxton RB, Bennet WP, et al. Hematologic bone marrow disorders: quantitative chemical shift MR imaging. Radiology. (1988) 169:799–804. doi: 10.1148/radiology.169.3.3187003
8. Thomas MA, Kurhanewicz J, Jajodia G, Karczmar G, Hubesch B, Matson GB, et al. 31P MR spectroscopy of human prostate In vivo. In: Proceedings of the International Society of Magnetic Resonance in Medicine. Amsterdam (1989). p. 297.
9. Boska MD, Meyerhoff DJ, Twieg DB, Karczmar GS, Matson GB, Weiner MW. Image-guided 31P magnetic resonance spectroscopy of normal and transplanted human kidneys. Kidney Int. (1990) 38:294–300. doi: 10.1038/ki.1990.199
10. Gomez-Anson B, MacManus DG, Parker GJ, Davie CA, Barker GJ, Moseley IF, et al. In vivo 1H-magnetic resonance spectroscopy of the spinal cord in humans. Neuroradiology. (2000) 42:515–7. doi: 10.1007/s002340000323
11. Oz G, Alger JR, Barker PB, Bartha R, Bizzi A, Boesch C, et al. Clinical proton MR spectroscopy in central nervous system disorders. Radiology. (2014) 270:658–79. doi: 10.1148/radiol.13130531
12. United HealthCare Services Inc., editor. Magnetic Resonance Spectroscopy (MRS). United HealthCare Commercial Medical Policy (2018).
15. Wallin MT, Culpepper WJ, Campbell JD, Nelson LM, Langer-Gould A, Marrie RA, et al. The prevalence of MS in the United States: a population-based estimate using health claims data. Neurology. (2019) 92:e1029–e1040. doi: 10.1212/WNL.0000000000007035
16. Rivera VM. Multiple sclerosis: a global concern with multiple challenges in an era of advanced therapeutic complex molecules and biological medicines. Biomedicines. (2018) 6:E112. doi: 10.3390/biomedicines6040112
17. Browne P, Chandraratna D, Angood C, Tremlett H, Baker C, Taylor BV, et al. Atlas of multiple sclerosis 2013: a growing global problem with widespread inequity. Neurology. (2013) 83:1022–24. doi: 10.1212/WNL.0000000000000768
18. Solomon AJ, Klein EP, Bourdette D. “Undiagnosing” multiple sclerosis: the challenge of misdiagnosis in MS. Neurology. (2012) 78:1986–91. doi: 10.1212/WNL.0b013e318259e1b2
19. Zuvich RL, McCauley JL, Pericak-Vance MA, Haines JL. Genetics and pathogenesis of multiple sclerosis. Semin Immunol. (2009) 21:328–33. doi: 10.1016/j.smim.2009.08.003
20. Stagg CJ, Rothman DL.Magnetic Resonance Spectroscopy: Tools for Neuroscience Research and Emerging Clinical Applications. Amsterdam: Elsevier/Academic Press (2014).
21. De Graaf RA. In vivo NMR Spectroscopy: Principles and Techniques. Chichester; Hoboken, NJ: John Wiley & Sons (2007).
22. van Walderveen MAA, Barkhof F, Pouwels PJW, van Schijndel RA, Polman CH, Castelijns JA. Neuronal damage in T1-hypointense multiple sclerosis lesions demonstrated In vivo using proton magnetic resonance spectroscopy. Ann Neurol. (1999) 46:79–87. doi: 10.1002/1531-8249(199907)46:1<79::AID-ANA12>3.0.CO;2-9
23. Roser W, Hagberg G, Mader I, Brunnschweiler H, Radue EW, Seelig J, et al. Proton MRS of gadolinium-enhancing MS plaques and metabolic changes in normal-appearing white matter. Magn Reson Med. (1995) 33:811–7. doi: 10.1002/mrm.1910330611
24. Davie CA, Hawkins CP, Barker GJ, Brennan A, Tofts PS, Miller DH, et al. Serial proton magnetic resonance spectroscopy in acute multiple sclerosis lesions. Brain. (1994) 117 (Pt 1): 49–58. doi: 10.1093/brain/117.1.49
25. Tartaglia MC, Narayanan S, De Stefano N, Arnaoutelis R, Antel SB, Francis SJ, et al. Choline is increased in pre-lesional normal appearing white matter in multiple sclerosis. J Neurol. (2002) 249:1382–90. doi: 10.1007/s00415-002-0846-6
26. Arnold DL, Riess GT, Matthews PM, Francis GS, Collins DL, Wolfson C, et al. Use of proton magnetic resonance spectroscopy for monitoring disease progression in multiple sclerosis. Ann Neurol. (1994) 36:76–82. doi: 10.1002/ana.410360115
27. Mader I, Roser W, Kappos L, Hagberg G, Seelig J, Radue EW, et al. Serial proton MR spectroscopy of contrast-enhancing multiple sclerosis plaques: absolute metabolic values over 2 years during a clinical pharmacological study. Am J Neuroradiol. (2000) 21:1220–7.
28. Vafaeyan H, Ebrahimzadeh SA, Rahimian N, Alavijeh SK, Madadi A, Faeghi F, et al. Quantification of diagnostic biomarkers to detect multiple sclerosis lesions employing (1)H-MRSI at 3T. Australas Phys Eng Sci Med. (2015) 38:611–8. doi: 10.1007/s13246-015-0390-1
29. Bellenberg B, Busch M, Trampe N, Gold R, Chan A, Lukas C. 1H-magnetic resonance spectroscopy in diffuse and focal cervical cord lesions in multiple sclerosis. Eur Radiol. (2013) 23:3379–92. doi: 10.1007/s00330-013-2942-7
30. Husted CA, Goodin DS, Hugg JW, Maudsley AA, Tsuruda JS, de Bie SH, et al. Biochemical alterations in multiple sclerosis lesions and normal-appearing white matter detected by In vivo 31P and 1H spectroscopic imaging. Ann Neurol. (1994) 36:157–65. doi: 10.1002/ana.410360207
31. Miller DH, Austin SJ, Connelly A, Youl BD, Gadian DG, McDonald WI. Proton magnetic resonance spectroscopy of an acute and chronic lesion in multiple sclerosis. Lancet. (1991) 337:58–9. doi: 10.1016/0140-6736(91)93383-K
32. Kimura H, Grossman RI, Lenkinski RE, Gonzalez-Scarano F. Proton MR spectroscopy and magnetization transfer ratio in multiple sclerosis: correlative findings of active versus irreversible plaque disease. AJNR Am J Neuroradiol. (1996) 17:1539–47.
33. Van Hecke P, Marchal G, Johannik K, Demaerel P, Wilms G, Carton H, et al. Human brain proton localized NMR spectroscopy in multiple sclerosis. Magnet Reson Med. (1991) 18:199–206. doi: 10.1002/mrm.1910180120
34. Tedeschi G, Bonavita S, McFarland HF, Richert N, Duyn JH, Frank JA. Proton MR spectroscopic imaging in multiple sclerosis. Neuroradiology. (2002) 44:37–42. doi: 10.1007/s002340100584
35. Landtblom AM, Thuomas KA, Sjödqvist L, Flodin U, Nyland FH, Söderfeldt B. Hypointensity in T2-weighted images of the basal ganglia in solvent-exposed patients with multiple sclerosis: clinical, MRI and CSF characteristics. Neurol Sci. (2003) 24:2–9. doi: 10.1007/s100720300014
36. De Stefano N, Narayanan S, Francis GS, Arnaoutelis R, Tartaglia MC, Antel JP, et al. Evidence of axonal damage in the early stages of multiple sclerosis and its relevance to disability. Arch Neurol. (2001) 58:65–70. doi: 10.1001/archneur.58.1.65
37. Rooney WD, Goodkin DE, Schuff N, Meyerhoff DJ, Norman D, Weiner MW. 1H MRSI of normal appearing white matter in multiple sclerosis. Mult Scler. (1997) 3:231–7. doi: 10.1177/135245859700300403
38. Wood ET, Ronen I, Techawiboonwong A, Jones CK, Barker PB, Calabresi P, et al. Investigating axonal damage in multiple sclerosis by diffusion tensor spectroscopy. J Neurosci. (2012) 32:6665–9. doi: 10.1523/JNEUROSCI.0044–12.2012
39. Steen C, D'Haeseleer M, Hoogduin JM, Fierens Y, Cambron M, Mostert JP, et al. Cerebral white matter blood flow and energy metabolism in multiple sclerosis. Mult Scler. (2013) 19:1282–9. doi: 10.1177/1352458513477228
40. Tourbah A, Stievenart JL, Iba-Zizen MT, Zannoli G, Lyon-Caen O, Cabanis EA. In vivo localized NMR proton spectroscopy of normal appearing white matter in patients with multiple sclerosis. J Neuroradiol. (1996) 23:49–55.
41. Anik Y, Demirci A, Efendi H, Bulut SS, Celebi I, Komsuoglu S. Evaluation of normal appearing white matter in multiple sclerosis: comparison of diffusion magnetic resonance, magnetization transfer imaging and multivoxel magnetic resonance spectroscopy findings with expanded disability status scale. Clin Neuroradiol. (2011) 21:207–15. doi: 10.1007/s00062-011-0091-4
42. D'Haeseleer M, Steen C, Hoogduin JM, van Osch MJ, Fierens Y, Cambron M, et al. Performance on paced auditory serial addition test and cerebral blood flow in multiple sclerosis. Acta Neurol Scand. (2013) 128:e26–9. doi: 10.1111/ane.12129
43. Brass SD, Narayanan S, Antel JP, Lapierre Y, Collins L, Arnold DL. Axonal damage in multiple sclerosis patients with high versus low expanded disability status scale score. Can J Neurol Sci. (2004) 31:225–8. doi: 10.1017/S0317167100053877
44. Siger-Zajdel M, Selmaj KW. Proton magnetic resonance spectroscopy of normal appearing white matter in familial and sporadic multiple sclerosis. J Neurol. (2005) 252:830–2. doi: 10.1007/s00415-005-0754-7
45. Oh J, Henry RG, Genain C, Nelson SJ, Pelletier D. Mechanisms of normal appearing corpus callosum injury related to pericallosal T1 lesions in multiple sclerosis using directional diffusion tensor and 1H MRS imaging. J Neurol Neurosurg Psychiatry. (2004) 75:1281–6. doi: 10.1136/jnnp.2004.039032
46. Tourbah A, Stievenart JL, Abanou A, Iba-Zizen MT, Hamard H, Lyon-Caen O, et al. Normal-appearing white matter in optic neuritis and multiple sclerosis: a comparative proton spectroscopy study. Neuroradiology. (1999) 41:738–43. doi: 10.1007/s002340050835
47. Arnold DL, Matthews PM, Francis G, Antel J. Proton magnetic resonance spectroscopy of human brain In vivo in the evaluation of multiple sclerosis: assessment of the load of disease. Magn Reson Med. (1990) 14:154–9. doi: 10.1002/mrm.1910140115
48. Vingara LK, Yu HJ, Wagshul ME, Serafin D, Christodoulou C, Pelczer I, et al. Metabolomic approach to human brain spectroscopy identifies associations between clinical features and the frontal lobe metabolome in multiple sclerosis. Neuroimage. (2013) 82:586–94. doi: 10.1016/j.neuroimage.2013.05.125
49. Marliani AF, Clementi V, Albini Riccioli L, Agati R, Carpenzano M, Salvi F, et al. Quantitative cervical spinal cord 3T proton MR spectroscopy in multiple sclerosis. AJNR Am J Neuroradiol. (2010) 31:180–4. doi: 10.3174/ajnr.A1738
50. Suhy J, Rooney WD, Goodkin DE, Capizzano AA, Soher BJ, Maudsley AA, et al. 1H MRSI comparison of white matter and lesions in primary progressive and relapsing-remitting MS. Mult Scler. (2000) 6:148–55. doi: 10.1177/135245850000600303
51. Takeuchi C, Ota K, Ono Y, Iwata M. Interferon beta-1b may reverse axonal dysfunction in multiple sclerosis. Neuroradiol J. (2007) 20:531–40. doi: 10.1177/197140090702000510
52. Fu L, Wolfson C, Worsley KJ, DeStefano N, Collins DL, Narayanan S, et al. Statistics for investigation of multimodal MR imaging data and an application to multiple sclerosis patients. NMR Biomed. (1996) 9:339–46. doi: 10.1002/(SICI)1099-1492(199612)9:8<339::AID-NBM422>3.0.CO;2-X
53. Sarchielli P, Presciutti O, Tarducci R, Gobbi G, Alberti A, Pelliccioli GP, et al. 1H MRS in patients with multiple sclerosis undergoing treatment with interferon beta-1a: results of a preliminary study. J Neurol Neurosur Psychiatry. (1998) 64:204–12. doi: 10.1136/jnnp.64.2.204
54. Pan JW, Hetherington HP, Vaughan JT, Mitchell G, Pohost GM, Whitaker JN. Evaluation of multiple sclerosis by 1H spectroscopic imaging at 4.1 T. Magn Reson Med. (1996) 36:72–7. doi: 10.1002/mrm.1910360113
55. Matthews PM, Francis G, Antel J, Arnold DL. Proton magnetic resonance spectroscopy for metabolic characterization of plaques in multiple sclerosis. Neurology. (1991) 41:1251–6. doi: 10.1212/WNL.41.8.1251
56. Yetkin MF, Mirza M, Donmez H. Monitoring interferon beta treatment response with magnetic resonance spectroscopy in relapsing remitting multiple sclerosis. Medicine. (2016) 95:e4782. doi: 10.1097/MD.0000000000004782
57. Zaini WH, Giuliani F, Beaulieu C, Kalra S, Hanstock C. Fatigue in multiple sclerosis: Assessing pontine involvement using proton MR spectroscopic imaging. PLoS ONE. (2016) 11:e0149622. doi: 10.1371/journal.pone.0149622
58. Staffen W, Zauner H, Mair A, Kutzelnigg A, Kapeller P, Stangl H, et al. Magnetic resonance spectroscopy of memory and frontal brain region in early multiple sclerosis. J Neuropsychiatry Clin Neurosci. (2005) 17:357–63. doi: 10.1176/jnp.17.3.357
59. Reddy H, Narayanan S, Matthews PM, Hoge RD, Pike GB, Duquette P, et al. Relating axonal injury to functional recovery in MS. Neurology. (2000) 54:236–239. doi: 10.1212/WNL.54.1.236
60. Fu L, Matthews PM, De Stefano N, Worsley KJ, Narayanan S, Francis GS, et al. Imaging axonal damage of normal-appearing white matter in multiple sclerosis. Brain. (1998) 121 (Pt 1):103–13. doi: 10.1093/brain/121.1.103
61. De Stefano N, Narayanan S, Francis SJ, Smith S, Mortilla M, Tartaglia MC, et al. Diffuse axonal and tissue injury in patients with multiple sclerosis with low cerebral lesion load and no disability. Arch Neurol. (2002) 59:1565–71. doi: 10.1001/archneur.59.10.1565
62. Hannoun S, Bagory M, Durand-Dubief F, Ibarrola D, Comte JC, Confavreux C, et al. Correlation of diffusion and metabolic alterations in different clinical forms of multiple sclerosis. PLoS ONE. (2012) 7:e32525. doi: 10.1371/journal.pone.0032525
63. Pokryszko-Dragan A, Bladowska J, Zimny A, Slotwinski K, Zagrajek M, Gruszka E, et al. Magnetic resonance spectroscopy findings as related to fatigue and cognitive performance in multiple sclerosis patients with mild disability. J Neurol Sci. (2014) 339:35–40. doi: 10.1016/j.jns.2014.01.013
64. Duan Y, Liu Z, Liu Y, Huang J, Ren Z, Sun Z, et al. Metabolic changes in normal-appearing white matter in patients with neuromyelitis optica and multiple sclerosis: a comparative magnetic resonance spectroscopy study. Acta Radiol. (2017) 58:1132–7. doi: 10.1177/0284185116683575
65. Bellmann-Strobl J, Stiepani H, Wuerfel J, Bohner G, Paul F, Warmuth C, et al. MR spectroscopy (MRS) and magnetisation transfer imaging (MTI), lesion load and clinical scores in early relapsing remitting multiple sclerosis: a combined cross-sectional and longitudinal study. Eur Radiol. (2009) 19:2066–74. doi: 10.1007/s00330-009-1364-z
66. Oh J, Pelletier D, Nelson SJ. Corpus callosum axonal injury in multiple sclerosis measured by proton magnetic resonance spectroscopic imaging. Arch Neurol. (2004) 61:1081–6. doi: 10.1001/archneur.61.7.1081
67. Wattjes MP, Harzheim M, Lutterbey GG, Klotz L, Schild HH, Traber F. Axonal damage but no increased glial cell activity in the normal-appearing white matter of patients with clinically isolated syndromes suggestive of multiple sclerosis using high-field magnetic resonance spectroscopy. AJNR Am J Neuroradiol. (2007) 28:1517–22. doi: 10.3174/ajnr.A0594
68. Sun J, Song H, Yang Y, Zhang K, Gao X, Li X, et al. Metabolic changes in normal appearing white matter in multiple sclerosis patients using multivoxel magnetic resonance spectroscopy imaging. Medicine. (2017) 96:e6534. doi: 10.1097/MD.0000000000006534
69. Vrenken H, Barkhof F, Uitdehaag BM, Castelijns JA, Polman CH, Pouwels PJ. MR spectroscopic evidence for glial increase but not for neuro-axonal damage in MS normal-appearing white matter. Magn Reson Med. (2005) 53:256–66. doi: 10.1002/mrm.20366
70. Wylezinska M, Cifelli A, Jezzard P, Palace J, Alecci M, Matthews PM. Thalamic neurodegeneration in relapsing-remitting multiple sclerosis. Neurology. (2003) 60:1949–54. doi: 10.1212/01.WNL.0000069464.22267.95
71. Matthews PM, Pioro E, Narayanan S, De Stefano N, Fu L, Francis G, et al. Assessment of lesion pathology in multiple sclerosis using quantitative MRI morphometry and magnetic resonance spectroscopy. Brain. (1996) 119 (Pt 3):715–22. doi: 10.1093/brain/119.3.715
72. De Stefano N, Iannucci G, Sormani MP, Guidi L, Bartolozzi ML, Comi G, et al. MR correlates of cerebral atrophy in patients with multiple sclerosis. J Neurol. (2002) 249:1072–7. doi: 10.1007/s00415-002-0790-5
73. Narayanan S, Fu L, Pioro E, De Stefano N, Collins DL, Francis GS, et al. Imaging of axonal damage in multiple sclerosis: spatial distribution of magnetic resonance imaging lesions. Ann Neurol. (1997) 41:385–91. doi: 10.1002/ana.410410314
74. Parry A, Corkill R, Blamire AM, Palace J, Narayanan S, Arnold D, et al. Beta interferon treatment does not always slow the progression of axonal injury in multiple sclerosis. J Neurol. (2003) 250:171–8. doi: 10.1007/s00415-003-0965-8
75. Téllez N, Alonso J, Rio J, Tintore M, Nos C, Montalban X, et al. The basal ganglia: a substrate for fatigue in multiple sclerosis. Neuroradiology. (2008) 50:17–23. doi: 10.1007/s00234-007-0304-3
76. Maffei M, Marliani AF, Salvi F, Clementi V, Agati R, Leonardi M. Metabolite changes in normal appearing cervical spinal cord in two patients with multiple sclerosis: a proton MR spectroscopic analysis. Neuroradiol J. (2008) 21:228–35. doi: 10.1177/197140090802100212
77. Falini A, Calabrese G, Filippi M, Origgi D, Lipari S, Colombo B, et al. Benign versus secondary-progressive multiple sclerosis: the potential role of proton MR spectroscopy in defining the nature of disability. AJNR Am J Neuroradiol. (1998) 19:223–9.
78. Cucurella MG, Rovira A, Rio J, Pedraza S, Tintore MM, Montalban X, et al. Proton magnetic resonance spectroscopy in primary and secondary progressive multiple sclerosis. NMR Biomed. (2000) 13:57–63. doi: 10.1002/(sici)1099-1492(200004)13:2<57::aid-nbm609>3.0.co;2-5
79. Tourbah A, Stievenart JL, Gout O, Fontaine B, Liblau R, Lubetzki C, et al. Localized proton magnetic resonance spectroscopy in relapsing remitting versus secondary progressive multiple sclerosis. Neurology. (1999) 53:1091. doi: 10.1212/WNL.53.5.1091
80. Aboul-Enein F, Krssak M, Hoftberger R, Prayer D, Kristoferitsch W. Reduced NAA-levels in the NAWM of patients with MS is a feature of progression. A study with quantitative magnetic resonance spectroscopy at 3 Tesla. PLoS ONE. (2010) 5:e11625. doi: 10.1371/journal.pone.0011625
81. Steen C, Wilczak N, Hoogduin JM, Koch M, De Keyser J. Reduced creatine kinase B activity in multiple sclerosis normal appearing white matter. PLoS ONE. (2010) 5:e10811. doi: 10.1371/journal.pone.0010811
82. Leary SM, Davie CA, Parker GJ, Stevenson VL, Wang L, Barker GJ, et al. 1H magnetic resonance spectroscopy of normal appearing white matter in primary progressive multiple sclerosis. J Neurol. (1999) 246:1023–6. doi: 10.1007/s004150050507
83. Caramanos Z, DiMaio S, Narayanan S, Lapierre Y, Arnold DL. (1)H-MRSI evidence for cortical gray matter pathology that is independent of cerebral white matter lesion load in patients with secondary progressive multiple sclerosis. J Neurol Sci. (2009) 282:72–9. doi: 10.1016/j.jns.2009.01.015
84. Bagory M, Durand-Dubief F, Ibarrola D, Comte JC, Cotton F, Confavreux C, et al. Implementation of an absolute brain 1H-MRS quantification method to assess different tissue alterations in multiple sclerosis. IEEE Trans Biomed Eng. (2012) 59:2687–94. doi: 10.1109/TBME.2011.2161609
85. Pelletier D, Nelson SJ, Grenier D, Lu Y, Genain C, Goodkin DE. 3-D echo planar (1)HMRS imaging in MS: metabolite comparison from supratentorial vs. central brain. Magn Reson Imaging. (2002) 20:599–606. doi: 10.1016/S0730-725X(02)00533-7
86. De Stefano N, Matthews PM, Narayanan S, Francis GS, Antel JP, Arnold DL. Axonal dysfunction and disability in a relapse of multiple sclerosis: longitudinal study of a patient. Neurology. (1997) 49:1138–41. doi: 10.1212/WNL.49.4.1138
87. Narayana PA, Wolinsky JS, Rao SB, He RJ, Mehta M PROMiSe Trial MRSI Group. Multicentre proton magnetic resonance spectroscopy imaging of primary progressive multiple sclerosis. Mult Scler J. (2004) 10:S73-S78. doi: 10.1191/1352458504ms1035oa
88. Sarchielli P, Presciutti O, Tarducci R, Gobbi G, Alberti A, Pelliccioli GP, et al. Localized 1H magnetic resonance spectroscopy in mainly cortical gray matter of patients with multiple sclerosis. J Neurol. (2002) 249:902–10. doi: 10.1007/s00415-002-0758-5
89. Pelletier D, Nelson SJ, Oh J, Antel JP, Kita M, Zamvil SS, et al. MRI lesion volume heterogeneity in primary progressive MS in relation with axonal damage and brain atrophy. J Neurol Neurosur Psychiatry. (2003) 74:950–2. doi: 10.1136/jnnp.74.7.950
90. Bitsch A, Bruhn H, Vougioukas V, Stringaris A, Lassmann H, Frahm J, et al. Inflammatory CNS demyelination: histopathologic correlation with In vivo quantitative proton MR spectroscopy. AJNR Am J Neuroradiol. (1999) 20:1619–27.
91. Schiepers C, Van Hecke P, Vandenberghe R, Van Oostende S, Dupont P, Demaerel P, et al. Positron emission tomography, magnetic resonance imaging and proton NMR spectroscopy of white matter in multiple sclerosis. Mult Scler. (1997) 3:8–17. doi: 10.1177/135245859700300102
92. Srinivasan R, Sailasuta N, Hurd R, Nelson S, Pelletier D. Evidence of elevated glutamate in multiple sclerosis using magnetic resonance spectroscopy at 3 T. Brain. (2005) 128:1016–25. doi: 10.1093/brain/awh467
93. Narayana PA, Doyle TJ, Lai D, Wolinsky JS. Serial proton magnetic resonance spectroscopic imaging, contrast-enhanced magnetic resonance imaging, and quantitative lesion volumetry in multiple sclerosis. Ann Neurol. (1998) 43:56–71. doi: 10.1002/ana.410430112
94. Sijens PE, Mostert JP, Irwan R, Potze JH, Oudkerk M, De Keyser J. Impact of fluoxetine on the human brain in multiple sclerosis as quantified by proton magnetic resonance spectroscopy and diffusion tensor imaging. Psychiatry Res. (2008) 164:274–82. doi: 10.1016/j.pscychresns.2007.12.014
95. Seeger U, Klose U, Mader I, Grodd W, Nagele T. Parameterized evaluation of macromolecules and lipids in proton MR spectroscopy of brain diseases. Magn Reson Med. (2003) 49:19–28. doi: 10.1002/mrm.10332
96. Davie CA, Silver NC, Barker GJ, Tofts PS, Thompson AJ, McDonald WI, et al. Does the extent of axonal loss and demyelination from chronic lesions in multiple sclerosis correlate with the clinical subgroup? J Neurol Neurosurg Psychiatry. (1999) 67:710–5. doi: 10.1136/jnnp.67.6.710
97. Lee MA, Blamire AM, Pendlebury S, Ho KH, Mills KR, Styles P, et al. Axonal injury or loss in the internal capsule and motor impairment in multiple sclerosis. Arch Neurol. (2000) 57:65–70. doi: 10.1001/archneur.57.1.65
98. Davie CA, Barker GJ, Webb S, Tofts PS, Thompson AJ, Harding AE, et al. Persistent functional deficit in multiple sclerosis and autosomal dominant cerebellar ataxia is associated with axon loss. Brain. (1995) 118 (Pt 6):1583–92. doi: 10.1093/brain/118.6.1583
99. Tisell A, Leinhard OD, Warntjes JB, Aalto A, Smedby O, Landtblom AM, et al. Increased concentrations of glutamate and glutamine in normal-appearing white matter of patients with multiple sclerosis and normal MR imaging brain scans. PLoS ONE. (2013) 8:e61817. doi: 10.1371/journal.pone.0061817
100. Azevedo CJ, Kornak J, Chu P, Sampat M, Okuda DT, Cree BA, et al. In vivo evidence of glutamate toxicity in multiple sclerosis. Ann Neurol. (2014) 76:269–78. doi: 10.1002/ana.24202
101. Mellergård J, Tisell A, Dahlqvist Leinhard O, Blystad I, Landtblom AM, Blennow K, et al. Association between change in normal appearing white matter metabolites and intrathecal inflammation in natalizumab-treated multiple sclerosis. PLoS ONE. (2012) 7:e44739. doi: 10.1371/journal.pone.0044739
102. Llufriu S, Kornak J, Ratiney H, Oh J, Brenneman D, Cree BA, et al. Magnetic resonance spectroscopy markers of disease progression in multiple sclerosis. JAMA Neurol. (2014) 71:840–7. doi: 10.1001/jamaneurol.2014.895
103. Bodini B, Branzoli F, Poirion E, García-Lorenzo D, Didier M, Maillart E, et al. Dysregulation of energy metabolism in multiple sclerosis measured In vivo with diffusion-weighted spectroscopy. Mult Scler J. (2017) 24:313–21. doi: 10.1177/1352458517698249
104. Srinivasan R, Ratiney H, Hammond-Rosenbluth KE, Pelletier D, Nelson SJ. MR spectroscopic imaging of glutathione in the white and gray matter at 7 T with an application to multiple sclerosis. Magn Reson Imaging. (2010) 28:163–70. doi: 10.1016/j.mri.2009.06.008
105. Gustafsson MC, Dahlqvist O, Jaworski J, Lundberg P, Landtblom AM. Low choline concentrations in normal-appearing white matter of patients with multiple sclerosis and normal MR imaging brain scans. AJNR Am J Neuroradiol. (2007) 28:1306–12. doi: 10.3174/ajnr.A0580
106. Geurts JJ, Reuling IE, Vrenken H, Uitdehaag BM, Polman CH, Castelijns JA, et al. MR spectroscopic evidence for thalamic and hippocampal, but not cortical, damage in multiple sclerosis. Magn Reson Med. (2006) 55:478–83. doi: 10.1002/mrm.20792
107. Nantes JC, Proulx S, Zhong J, Holmes SA, Narayanan S, Brown RA, et al. GABA and glutamate levels correlate with MTR and clinical disability: Insights from multiple sclerosis. Neuroimage. (2017) 157:705–15. doi: 10.1016/j.neuroimage.2017.01.033
108. Pendlebury ST, Lee MA, Blamire AM, Styles P, Matthews PM. Correlating magnetic resonance imaging markers of axonal injury and demyelination in motor impairment secondary to stroke and multiple sclerosis. Magn Reson Imaging. (2000) 18:369–78. doi: 10.1016/S0730-725X(00)00115-6
109. Ciccarelli O, Altmann DR, McLean MA, Wheeler-Kingshott CA, Wimpey K, Miller DH, et al. Spinal cord repair in MS: Does mitochondrial metabolism play a role? Neurology. (2010) 74:721–7. doi: 10.1212/WNL.0b013e3181d26968
110. Blamire AM, Cader S, Lee M, Palace J, Matthews PM. Axonal damage in the spinal cord of multiple sclerosis patients detected by magnetic resonance spectroscopy. Magn Reson Med. (2007) 58:880–5. doi: 10.1002/mrm.21382
111. Ciccarelli O, Toosy AT, De Stefano N, Wheeler-Kingshott CAM, Miller DH, Thompson AJ. Assessing neuronal metabolism In vivo by modeling imaging measures. J Neurosci. (2010) 30:15030–3. doi: 10.1523/JNEUROSCI.3330–10.2010
112. Ciccarelli O, Wheeler-Kingshott CA, McLean MA, Cercignani M, Wimpey K, Miller DH, et al. Spinal cord spectroscopy and diffusion-based tractography to assess acute disability in multiple sclerosis. Brain. (2007) 130:2220–31. doi: 10.1093/brain/awm152
113. Rigotti DJ, Gass A, Achtnichts L, Inglese M, Babb JS, Naegelin Y, et al. Multiple Sclerosis Severity Scale and whole-brain N-acetylaspartate concentration for patients' assessment. Mult Scler. (2012) 18:98–107. doi: 10.1177/1352458511415142
114. Achtnichts L, Gonen O, Rigotti DJ, Babb JS, Naegelin Y, Penner IK, et al. Global N-acetylaspartate concentration in benign and non-benign multiple sclerosis patients of long disease duration. Eur J Radiol. (2013) 82:e848–52. doi: 10.1016/j.ejrad.2013.08.037
115. Kapeller P, McLean MA, Griffin CM, Chard D, Parker GJ, Barker GJ, et al. Preliminary evidence for neuronal damage in cortical grey matter and normal appearing white matter in short duration relapsing-remitting multiple sclerosis: a quantitative MR spectroscopic imaging study. J Neurol. (2001) 248:131–8. doi: 10.1007/s004150170248
116. Helms G. Volume correction for edema in single-volume proton MR spectroscopy of contrast-enhancing multiple sclerosis lesions. Magn Reson Med. (2001) 46:256–63. doi: 10.1002/mrm.1186
117. Wiebenga OT, Klauser AM, Schoonheim MM, Nagtegaal GJ, Steenwijk MD, van Rossum JA, et al. Enhanced axonal metabolism during early natalizumab treatment in relapsing-remitting multiple sclerosis. AJNR Am J Neuroradiol. (2015) 36:1116–23. doi: 10.3174/ajnr.A4252
118. Tiberio M, Chard DT, Altmann DR, Davies G, Griffin CM, McLean MA, et al. Metabolite changes in early relapsing-remitting multiple sclerosis. A two year follow-up study. J Neurol. (2006) 253:224–30. doi: 10.1007/s00415-005-0964-z
119. Chard DT, Griffin CM, McLean MA, Kapeller P, Kapoor R, Thompson AJ, et al. Brain metabolite changes in cortical grey and normal-appearing white matter in clinically early relapsing-remitting multiple sclerosis. Brain. (2002) 125:2342–52. doi: 10.1093/brain/awf240
120. Sarchielli P, Presciutti O, Pelliccioli GP, Tarducci R, Gobbi G, Chiarini P, et al. Absolute quantification of brain metabolites by proton magnetic resonance spectroscopy in normal-appearing white matter of multiple sclerosis patients. Brain. (1999) 122 (Pt 3):513–21. doi: 10.1093/brain/122.3.513
121. Adalsteinsson E, Langer-Gould A, Homer RJ, Rao A, Sullivan EV, Lima CA, et al. Gray matter N-acetyl aspartate deficits in secondary progressive but not relapsing-remitting multiple sclerosis. AJNR Am J Neuroradiol. (2003) 24:1941–5.
122. Inglese M, Liu S, Babb JS, Mannon LJ, Grossman RI, Gonen O. Three-dimensional proton spectroscopy of deep gray matter nuclei in relapsing-remitting MS. Neurology. (2004) 63:170–2. doi: 10.1212/01.WNL.0000133133.77952.7C
123. Inglese M, Li BS, Rusinek H, Babb JS, Grossman RI, Gonen O. Diffusely elevated cerebral choline and creatine in relapsing-remitting multiple sclerosis. Magn Reson Med. (2003) 50:190–5. doi: 10.1002/mrm.10481
124. Donadieu M, Le Fur Y, Lecocq A, Maudsley AA, Gherib S, Soulier E, et al. Metabolic voxel-based analysis of the complete human brain using fast 3D-MRSI: Proof of concept in multiple sclerosis. J Magn Reson Imaging. (2016) 44:411–9. doi: 10.1002/jmri.25139
125. Inglese M, Ge Y, Filippi M, Falini A, Grossman RI, Gonen O. Indirect evidence for early widespread gray matter involvement in relapsing–remitting multiple sclerosis. NeuroImage. (2004) 21:1825–9. doi: 10.1016/j.neuroimage.2003.12.008
126. Pulizzi A, Rovaris M, Judica E, Sormani MP, Martinelli V, Comi G, et al. Determinants of disability in multiple sclerosis at various disease stages: a multiparametric magnetic resonance study. Arch Neurol. (2007) 64:1163–8. doi: 10.1001/archneur.64.8.1163
127. Gonen O, Catalaa I, Babb JS, Ge Y, Mannon LJ, Kolson DL, et al. Total brain N-acetylaspartate - A new measure of disease load in MS. Neurology. (2000) 54:15–9. doi: 10.1212/WNL.54.1.15
128. Rigotti DJ, Inglese M, Kirov II, Gorynski E, Perry NN, Babb JS, et al. Two-year serial whole-brain N-acetyl-L-aspartate in patients with relapsing-remitting multiple sclerosis. Neurology. (2012) 78:1383–9. doi: 10.1212/WNL.0b013e318253d609
129. Davie CA, Barker GJ, Thompson AJ, Tofts PS, McDonald WI, Miller DH. 1H magnetic resonance spectroscopy of chronic cerebral white matter lesions and normal appearing white matter in multiple sclerosis. J Neurol Neurosurg Psychiatry. (1997) 63:736–42. doi: 10.1136/jnnp.63.6.736
130. Sijens PE, Mostert JP, Oudkerk M, De Keyser J. (1)H MR spectroscopy of the brain in multiple sclerosis subtypes with analysis of the metabolite concentrations in gray and white matter: initial findings. Eur Radiol. (2006) 16:489–95. doi: 10.1007/s00330-005-2839-1
131. Sastre-Garriga J, Ingle GT, Chard DT, Ramio-Torrenta L, McLean MA, Miller DH, et al. Metabolite changes in normal-appearing gray and white matter are linked with disability in early primary progressive multiple sclerosis. Arch Neurol. (2005) 62:569–73. doi: 10.1001/archneur.62.4.569
132. Cifelli A, Arridge M, Jezzard P, Esiri MM, Palace J, Matthews PM. Thalamic neurodegeneration in multiple sclerosis. Ann Neurol. (2002) 52:650–3. doi: 10.1002/ana.10326
133. Sijens PE, Irwan R, Potze JH, Mostert JP, De Keyser J, Oudkerk M. Analysis of the human brain in primary progressive multiple sclerosis with mapping of the spatial distributions using 1H MR spectroscopy and diffusion tensor imaging. Eur Radiol. (2005) 15:1686–93. doi: 10.1007/s00330-005-2775-0
134. Cawley N, Solanky BS, Muhlert N, Tur C, Edden RA, Wheeler-Kingshott CA, et al. Reduced gamma-aminobutyric acid concentration is associated with physical disability in progressive multiple sclerosis. Brain. (2015) 138:2584–95. doi: 10.1093/brain/awv209
135. Pan JW, Twieg DB, Hetherington HP. Quantitative spectroscopic imaging of the human brain. Magn Reson Med. (1998) 40:363–9. doi: 10.1002/mrm.1910400305
136. Abdel-Aziz K, Schneider T, Solanky BS, Yiannakas MC, Altmann DR, Wheeler-Kingshott CA, et al. Evidence for early neurodegeneration in the cervical cord of patients with primary progressive multiple sclerosis. Brain. (2015) 138:1568–82. doi: 10.1093/brain/awv086
137. He J, Inglese M, Li BS, Babb JS, Grossman RI, Gonen O. Relapsing-remitting multiple sclerosis: metabolic abnormality in nonenhancing lesions and normal-appearing white matter at MR imaging: initial experience. Radiology. (2005) 234:211–7. doi: 10.1148/radiol.2341031895
138. Koopmans RA, Li DK, Zhu G, Allen PS, Penn A, Paty DW. Magnetic resonance spectroscopy of multiple sclerosis: in-vivo detection of myelin breakdown products. Lancet. (1993) 341:631–2. doi: 10.1016/0140-6736(93)90391-S
139. Rozewicz L, Langdon DW, Davie CA, Thompson AJ, Ron M. Resolution of left hemisphere cognitive dysfunction in multiple sclerosis with magnetic resonance correlates: a case report. Cogn Neuropsychiatry. (1996) 1:17–26. doi: 10.1080/135468096396677
140. Kocevar G, Stamile C, Hannoun S, Roch JA, Durand-Dubief F, Vukusic S, et al. Weekly follow up of acute lesions in three early multiple sclerosis patients using MR spectroscopy and diffusion. J Neuroradiol. (2018) 45:108–13. doi: 10.1016/j.neurad.2017.06.010
141. Pascual AM, Martinez-Bisbal MC, Bosca I, Valero C, Coret F, Martinez-Granados B, et al. Axonal loss is progressive and partly dissociated from lesion load in early multiple sclerosis. Neurology. (2007) 69:63–7. doi: 10.1212/01.wnl.0000265054.08610.12
142. Albini Riccioli L, Marliani AF, Clementi V, Bartolomei I, Agati R, Leonardi M. Evolutive study of relapsing-remitting multiple sclerosis with cervical proton magnetic resonance spectroscopy. A case report. Neuroradiol J. (2008) 21:511–7. doi: 10.1177/197140090802100407
143. Ruiz-Pena JL, Pinero P, Sellers G, Argente J, Casado A, Foronda J, et al. Magnetic resonance spectroscopy of normal appearing white matter in early relapsing-remitting multiple sclerosis: correlations between disability and spectroscopy. BMC Neurol. (2004) 4:8. doi: 10.1186/1471-2377-4-8
144. Mathiesen HK, Tscherning T, Sorensen PS, Larsson HB, Rostrup E, Paulson OB, et al. Multi-slice echo-planar spectroscopic MR imaging provides both global and local metabolite measures in multiple sclerosis. Magn Reson Med. (2005) 53:750–9. doi: 10.1002/mrm.20407
145. Wu X, Hanson LG, Skimminge A, Sorensen PS, Paulson OB, Mathiesen HK, et al. Cortical N-acetyl aspartate is a predictor of long-term clinical disability in multiple sclerosis. Neurol Res. (2014) 36:701–8. doi: 10.1179/1743132813Y.0000000312
146. Sharma R. Serial amino-neurochemicals analysis in progressive lesion analysis of multiple sclerosis by magnetic resonance imaging and proton magnetic resonance spectroscopic imaging. Magn Reson Med Sci. (2002) 1:169–73. doi: 10.2463/mrms.1.169
147. Davie CA, Hawkins CP, Barker GJ, Brennan A, Tofts PS, Miller DH, et al. Detection of myelin breakdown products by proton magnetic resonance spectroscopy. Lancet. (1993) 341:630–1. doi: 10.1016/0140-6736(93)90390-3
148. Oguz KK, Kurne A, Aksu AO, Karabulut E, Serdaroglu A, Teber S, et al. Assessment of citrullinated myelin by 1H-MR spectroscopy in early-onset multiple sclerosis. AJNR Am J Neuroradiol. (2009) 30:716–21. doi: 10.3174/ajnr.A1425
149. Muhlert N, Atzori M, De Vita E, Thomas DL, Samson RS, Wheeler-Kingshott CA, et al. Memory in multiple sclerosis is linked to glutamate concentration in grey matter regions. J Neurol Neurosurg Psychiatry. (2014) 85:833–9. doi: 10.1136/jnnp-2013-306662
150. Cao G, Edden RAE, Gao F, Li H, Gong T, Chen W, et al. Reduced GABA levels correlate with cognitive impairment in patients with relapsing-remitting multiple sclerosis. Eur Radiol. (2018) 28:1140–8. doi: 10.1007/s00330-017-5064-9
151. Choi IY, Lee P, Hughes AJ, Denney DR, Lynch SG. Longitudinal changes of cerebral glutathione (GSH) levels associated with the clinical course of disease progression in patients with secondary progressive multiple sclerosis. Mult Scler. (2017) 23:956–62. doi: 10.1177/1352458516669441
152. Choi IY, Lee SP, Denney DR, Lynch SG. Lower levels of glutathione in the brains of secondary progressive multiple sclerosis patients measured by 1H magnetic resonance chemical shift imaging at 3 T. Mult Scler. (2011) 17:289–96. doi: 10.1177/1352458510384010
153. Zaaraoui W, Rico A, Audoin B, Reuter F, Malikova I, Soulier E, et al. Unfolding the long-term pathophysiological processes following an acute inflammatory demyelinating lesion of multiple sclerosis. Magn Reson Imaging. (2010) 28:477–86. doi: 10.1016/j.mri.2009.12.011
154. Hanefeld F, Bauer HJH, -Christen J, Kruse B, Bruhn H, Frahm J.. Multiple sclerosis in childhood: report of 15 cases. Brain Dev. (1991) 13:410–6. doi: 10.1016/S0387-7604(12)80038-6
155. Hirsch JA, Lenkinski RE, Grossman RI. MR spectroscopy in the evaluation of enhancing lesions in the brain in multiple sclerosis. AJNR Am J Neuroradiol. (1996) 17:1829–36.
156. Kendi AT, Tan FU, Kendi M, Yilmaz S, Huvaj S, Tellioglu S. MR spectroscopy of cervical spinal cord in patients with multiple sclerosis. Neuroradiology. (2004) 46:764–9. doi: 10.1007/s00234-004-1231-1
157. Larsson HB, Christiansen P, Jensen M, Frederiksen J, Heltberg A, Olesen J, et al. Localized In vivo proton spectroscopy in the brain of patients with multiple sclerosis. Magn Reson Med. (1991) 22:23–31. doi: 10.1002/mrm.1910220104
158. Hiehle JF Jr, Grossman RI, Ramer KN, Gonzalez-Scarano F, Cohen JA. Magnetization transfer effects in MR-detected multiple sclerosis lesions: comparison with gadolinium-enhanced spin-echo images and nonenhanced T1-weighted images. AJNR Am J Neuroradiol. (1995) 16:69–77.
159. Back T, Mockel R, Hirsch JG, Gaa J, Oertel WH, Hennerici MG, et al. Combined MR measurements of magnetization transfer, tissue diffusion and proton spectroscopy. A feasibility study with neurological cases. Neurol Res. (2003) 25:292–300. doi: 10.1179/016164103101201373
160. Narayana PA, Wolinsky JS, Jackson EF, McCarthy M. Proton MR spectroscopy of gadolinium-enhanced multiple sclerosis plaques. J Magn Reson Imaging. (1992) 2:263–70. doi: 10.1002/jmri.1880020303
161. Datta G, Violante IR, Scott G, Zimmerman K, Santos-Ribeiro A, Rabiner EA, et al. Translocator positron-emission tomography and magnetic resonance spectroscopic imaging of brain glial cell activation in multiple sclerosis. Mult Scler. (2017) 23:1469–78. doi: 10.1177/1352458516681504
162. Pan JW, Krupp LB, Elkins LE, Coyle PK. Cognitive dysfunction lateralizes with NAA in multiple sclerosis. Appl Neuropsychol. (2001) 8:155–60. doi: 10.1207/S15324826AN0803_4
163. Okuda DT, Srinivasan R, Oksenberg JR, Goodin DS, Baranzini SE, Beheshtian A, et al. Genotype-Phenotype correlations in multiple sclerosis: HLA genes influence disease severity inferred by 1HMR spectroscopy and MRI measures. Brain. (2009) 132:250–9. doi: 10.1093/brain/awn301
164. Baranzini SE, Srinivasan R, Khankhanian P, Okuda DT, Nelson SJ, Matthews PM, et al. Genetic variation influences glutamate concentrations in brains of patients with multiple sclerosis. Brain. (2010) 133:2603–11. doi: 10.1093/brain/awq192
165. Assaf Y, Chapman J, Ben-Bashat D, Hendler T, Segev Y, Korczyn AD, et al. White matter changes in multiple sclerosis: correlation of q-space diffusion MRI and 1H MRS. Magn Reson Imaging. (2005) 23:703–10. doi: 10.1016/j.mri.2005.04.008
166. Cader S, Johansen-Berg H, Wylezinska M, Palace J, Behrens TE, Smith S, et al. Discordant white matter N-acetylasparate and diffusion MRI measures suggest that chronic metabolic dysfunction contributes to axonal pathology in multiple sclerosis. Neuroimage. (2007) 36:19–27. doi: 10.1016/j.neuroimage.2007.02.036
167. Hattingen E, Magerkurth J, Pilatus U, Hubers A, Wahl M, Ziemann U. Combined (1)H and (31)P spectroscopy provides new insights into the pathobiochemistry of brain damage in multiple sclerosis. NMR Biomed. (2011) 24:536–46. doi: 10.1002/nbm.1621
168. Sijens PE, Irwan R, Potze JH, Mostert JP, De Keyser J, Oudkerk M. Relationships between brain water content and diffusion tensor imaging parameters (apparent diffusion coefficient and fractional anisotropy) in multiple sclerosis. Eur Radiol. (2006) 16:898–904. doi: 10.1007/s00330-005-0033-0
169. Thompson AJ, Baranzini SE, Geurts J, Hemmer B, Ciccarelli O. Multiple sclerosis. Lancet. (2018) 391:1622–36. doi: 10.1016/S0140-6736(18)30481-1
170. He J, Grossman RI, Ge Y, Mannon LJ. Enhancing patterns in multiple sclerosis: evolution and persistence. AJNR Am J Neuroradiol. (2001) 22:664–9.
171. Bakshi R, Hutton GJ, Miller JR, Radue EW. The use of magnetic resonance imaging in the diagnosis and long-term management of multiple sclerosis. Neurology. (2004) 63:S3–11. doi: 10.1212/WNL.63.11_suppl_5.S3
172. Obert D, Helms G, Sattler MB, Jung K, Kretzschmar B, Bahr M, et al. Brain Metabolite changes in patients with relapsing-remitting and secondary progressive multiple sclerosis: A two-year follow-up study. PLoS ONE. (2016) 11:e0162583. doi: 10.1371/journal.pone.0162583
173. MacMillan EL, Tam R, Zhao Y, Vavasour IM, Li DK, Oger J, et al. Progressive multiple sclerosis exhibits decreasing glutamate and glutamine over two years. Mult Scler. (2016) 22:112–6. doi: 10.1177/1352458515586086
174. Peters AR, Geelen JA, den Boer JA, Prevo RL, Minderhoud JM, Gravenmade EJ. A study of multiple sclerosis patients with magnetic resonance spectroscopic imaging. Mult Scler. (1995) 1:25–31. doi: 10.1177/135245859500100105
175. Lublin FD, Reingold SC. Defining the clinical course of multiple sclerosis: results of an international survey. National Multiple Sclerosis Society (USA) Advisory Committee on clinical trials of new agents in multiple sclerosis. Neurology. (1996) 46:907–11. doi: 10.1212/WNL.46.4.907
176. Lublin FD, Reingold SC, Cohen JA, Cutter GR, Sorensen PS, Thompson AJ, et al. Defining the clinical course of multiple sclerosis: the 2013 revisions. Neurology. (2014) 83:278–86. doi: 10.1212/WNL.0000000000000560
177. Sedel F, Papeix C, Bellanger A, Touitou V, Lebrun-Frenay C, Galanaud D, et al. High doses of biotin in chronic progressive multiple sclerosis: a pilot study. Mult Scler Relat Disord. (2015) 4:159–69. doi: 10.1016/j.msard.2015.01.005
178. Hawker K. Progressive multiple sclerosis: characteristics and management. Neurol Clin. (2011) 29:423–34. doi: 10.1016/j.ncl.2011.01.002
179. Thompson AJ, Polman CH, Miller DH, McDonald WI, Brochet B, Filippi MMX, et al. Primary progressive multiple sclerosis. Brain. (1997) 120 (Pt 6):1085–96. doi: 10.1093/brain/120.6.1085
180. Brex PA, Gomez-Anson B, Parker GJ, Molyneux PD, Miszkiel KA, Barker GJ, et al. Proton MR spectroscopy in clinically isolated syndromes suggestive of multiple sclerosis. J Neurol Sci. (1999) 166:16–22. doi: 10.1016/S0022-510X(99)00105-7
181. Filippi M, Bozzali M, Rovaris M, Gonen O, Kesavadas C, Ghezzi A, et al. Evidence for widespread axonal damage at the earliest clinical stage of multiple sclerosis. Brain. (2003) 126:433–7. doi: 10.1093/brain/awg038
182. Fernando KT, McLean MA, Chard DT, MacManus DG, Dalton CM, Miszkiel KA, et al. Elevated white matter myo-inositol in clinically isolated syndromes suggestive of multiple sclerosis. Brain. (2004) 127:1361–9. doi: 10.1093/brain/awh153
183. Wattjes MP, Harzheim M, Lutterbey GG, Bogdanow M, Schild HH, Traber F. High field MR imaging and 1H-MR spectroscopy in clinically isolated syndromes suggestive of multiple sclerosis: correlation between metabolic alterations and diagnostic MR imaging criteria. J Neurol. (2008) 255:56–63. doi: 10.1007/s00415-007-0666-9
184. Stromillo ML, Giorgio A, Rossi F, Battaglini M, Hakiki B, Malentacchi G, et al. Brain metabolic changes suggestive of axonal damage in radiologically isolated syndrome. Neurology. (2013) 80:2090–4. doi: 10.1212/WNL.0b013e318295d707
185. Labiano-Fontcuberta A, Mato-Abad V, Alvarez-Linera J, Hernandez-Tamames JA, Martinez-Gines ML, Aladro Y, et al. Normal-appearing brain tissue analysis in radiologically isolated syndrome using 3 T MRI. Medicine. (2016) 95:e4101. doi: 10.1097/MD.0000000000004101
186. Rigotti DJ, Gonen O, Grossman RI, Babb JS, Falini A, Benedetti B, et al. Global N-acetylaspartate declines even in benign multiple sclerosis. Am J Neuroradiol. (2011) 32:204–9. doi: 10.3174/ajnr.A2254
187. Rovaris M, Gallo A, Falini A, Benedetti B, Rossi P, Comola M, et al. Axonal injury and overall tissue loss are not related in primary progressive multiple sclerosis. Arch Neurol. (2005) 62:898–902. doi: 10.1001/archneur.62.6.898
188. Pan JW, Coyle PK, Bashir K, Whitaker JN, Krupp LB, Hetherington HP. Metabolic differences between multiple sclerosis subtypes measured by quantitative MR spectroscopy. Mult Scler. (2002) 8:200–6. doi: 10.1191/1352458502ms802oa
189. Schwarzer G. meta: an R package for meta-analysis. R News. (2007) 7:40–7. Available online at: https://www.researchgate.net/publication/285729385_meta_An_R_Package_for_Meta-Analysis
190. Walter SD, Yao X. Effect sizes can be calculated for studies reporting ranges for outcome variables in systematic reviews. J Clin Epidemiol. (2007) 60:849–52. doi: 10.1016/j.jclinepi.2006.11.003
191. Kirov II, Patil V, Babb JS, Rusinek H, Herbert J, Gonen O. MR spectroscopy indicates diffuse multiple sclerosis activity during remission. J Neurol Neurosurg Psychiatry. (2009) 80:1330–6. doi: 10.1136/jnnp.2009.176263
192. Ge Y, Gonen O, Inglese M, Babb JS, Markowitz CE, Grossman RI. Neuronal cell injury precedes brain atrophy in multiple sclerosis. Neurology. (2004) 62:624–7. doi: 10.1212/WNL.62.4.624
193. Gonen O, Oberndorfer TA, Inglese M, Babb JS, Herbert J, Grossman RI. Reproducibility of three whole-brain N-acetylaspartate decline cohorts in relapsing-remitting multiple sclerosis. AJNR Am J Neuroradiol. (2007) 28:267–71.
194. Tartaglia MC, Narayanan S, Francis SJ, Santos AC, De Stefano N, Lapierre Y, et al. The relationship between diffuse axonal damage and fatigue in multiple sclerosis. Arch Neurol. (2004) 61:201–7. doi: 10.1001/archneur.61.2.201
195. Bove R, Chitnis T. Sexual disparities in the incidence and course of MS. Clin Immunol. (2013) 149:201–10. doi: 10.1016/j.clim.2013.03.005
196. Weatherby SJ, Mann CL, Davies MB, Fryer AA, Haq N, Strange RC, et al. A pilot study of the relationship between gadolinium-enhancing lesions, gender effect and polymorphisms of antioxidant enzymes in multiple sclerosis. J Neurol. (2000) 247:467–70. doi: 10.1007/s004150070179
197. Pozzilli C, Tomassini V, Marinelli F, Paolillo A, Gasperini C, Bastianello S. ‘Gender gap’ in multiple sclerosis: magnetic resonance imaging evidence. Eur J Neurol. (2003) 10:95–7. doi: 10.1046/j.1468–1331.2003.00519.x
198. Tomassini V, Onesti E, Mainero C, Giugni E, Paolillo A, Salvetti M, et al. Sex hormones modulate brain damage in multiple sclerosis: MRI evidence. J Neurol Neurosurg Psychiatry. (2005) 76:272–5. doi: 10.1136/jnnp.2003.033324
199. van Walderveen MA, Lycklama A Nijeholt GJ, Ader HJ, Jongen PJ, Polman CH, Castelijns JA, et al. Hypointense lesions on T1-weighted spin-echo magnetic resonance imaging: relation to clinical characteristics in subgroups of patients with multiple sclerosis. Arch Neurol. (2001) 58:76–81. doi: 10.1001/archneur.58.1.76
200. Antulov R, Weinstock-Guttman B, Cox JL, Hussein S, Durfee J, et al. Gender-related differences in MS: a study of conventional and nonconventional MRI measures. Mult Scler. (2009) 15:345–54. doi: 10.1177/1352458508099479
201. Fazekas F, Enzinger C, Wallner-Blazek M, Ropele S, Pluta-Fuerst A, Fuchs S. Gender differences in MRI studies on multiple sclerosis. J Neurol Sci. (2009) 286:28–30. doi: 10.1016/j.jns.2009.07.025
202. Li BS, Regal J, Soher BJ, Mannon LJ, Grossman RI, Gonen O. Brain metabolite profiles of T1-hypointense lesions in relapsing-remitting multiple sclerosis. AJNR Am J Neuroradiol. (2003) 24:68–74.
203. Pfueller CF, Brandt AU, Schubert F, Bock M, Walaszek B, Waiczies H, et al. Metabolic changes in the visual cortex are linked to retinal nerve fiber layer thinning in multiple sclerosis. PLoS ONE. (2011) 6:e18019. doi: 10.1371/journal.pone.0018019
204. Casanova B, Martinez-Bisbal MC, Valero C, Celda B, Marti-Bonmati L, Pascual A, et al. Evidence of Wallerian degeneration in normal appearing white matter in the early stages of relapsing-remitting multiple sclerosis: a HMRS study. J Neurol. (2003) 250:22–8. doi: 10.1007/s00415-003-0928-0
205. Pardini M, Botzkowski D, Muller S, Vehoff J, Kuhle J, Ruberte E, et al. The association between retinal nerve fibre layer thickness and N-acetyl aspartate levels in multiple sclerosis brain normal-appearing white matter: a longitudinal study using magnetic resonance spectroscopy and optical coherence tomography. Eur J Neurol. (2016) 23:1769–74. doi: 10.1111/ene.13116
206. Wood ET, Ercan E, Sati P, Cortese ICM, Ronen I, Reich DS. Longitudinal MR spectroscopy of neurodegeneration in multiple sclerosis with diffusion of the intra-axonal constituent N-acetylaspartate. Neuroimage Clin. (2017) 15:780–8. doi: 10.1016/j.nicl.2017.06.028
207. Bonneville F, Moriarty DM, Li BSY, Babb JS, Grossman RI, Gonen O. Whole-brain N-acetylaspartate concentration: correlation with T2-weighted lesion volume and expanded disability status scale score in cases of relapsing-remitting multiple sclerosis. Am J Neuroradiol. (2002) 23:371–375.
208. Gonen O, Moriarty DM, Li BSY, Babb JS, He J, Listerud J, et al. Relapsing-remitting multiple sclerosis and whole-brain N-acetylaspartate measurement: evidence for different clinical cohorts—Initial observations. Radiology. (2002) 225:261–8. doi: 10.1148/radiol.2243011260
209. Tkac I, Oz G, Adriany G, Ugurbil K, Gruetter R. In vivo H-1 NMR spectroscopy of the human brain at high magnetic fields: metabolite quantification at 4T vs. 7T. Magnet Reson Med. (2009) 62:868–79. doi: 10.1002/mrm.22086
210. Pitt D, Nagelmeier IE, Wilson HC, Raine CS. Glutamate uptake by oligodendrocytes: Implications for excitotoxicity in multiple sclerosis. Neurology. (2003) 61:1113–20. doi: 10.1212/01.WNL.0000090564.88719.37
211. Werner P, Pitt D, Raine CS. Multiple sclerosis: altered glutamate homeostasis in lesions correlates with oligodendrocyte and axonal damage. Ann Neurol. (2001) 50:169–80. doi: 10.1002/ana.1077
212. Govindaraju V, Young K, Maudsley AA. Proton NMR chemical shifts and coupling constants for brain metabolites. NMR Biomed. (2000) 13:129–53. doi: 10.1002/1099-1492(200005)13:3<129::AID-NBM619>3.0.CO;2-V
213. Yang S, Hu J, Kou Z, Yang Y. Spectral simplification for resolved glutamate and glutamine measurement using a standard STEAM sequence with optimized timing parameters at 3:4, 4. 7:7, and 9.4T. Magn Reson Med. (2008) 59:236–44. doi: 10.1002/mrm.21463
214. Wijtenburg SA, Knight-Scott J. Very short echo time improves the precision of glutamate detection at 3T in H-1 magnetic resonance spectroscopy. J Magn Reson Imaging. (2011) 34:645–52. doi: 10.1002/jmri.22638
215. Gussew A, Rzanny R, Scholle HC, Kaiser WA, Reichenbach JR. Quantitation of glutamate in the brain by using MR proton spectroscopy at 1.5 T and 3 T. Rofo. (2008) 180:722–32. doi: 10.1055/s-2008-1027422
216. Mader I, Seeger U, Weissert R, Klose U, Naegele T, Melms A, et al. Proton MR spectroscopy with metabolite-nulling reveals elevated macromolecules in acute multiple sclerosis. Brain. (2001) 124:953–61. doi: 10.1093/brain/124.5.953
217. Confortgouny S, Viondury J, Nicoli F, Dano P, Donnet A, Grazziani N, et al. A multiparametric data analysis showing the potential of localized proton MR spectroscopy of the brain in the metabolic characterization of neurological diseases. J Neurol Sci. (1993) 118:123–33. doi: 10.1016/0022-510X(93)90101-4
218. Tourbah A, Stievenart JL, Edan G, Abanou A, Dormont D, Lyon-Caen O. Acute demyelination: an insight into the effect of mitoxantrone on CNS lesions. J Neuroradiol. (2005) 32:63–6. doi: 10.1016/S0150-9861(05)83025-1
219. Bruhn H, Frahm J, Merboldt KD, Hanicke W, Hanefeld F, Christen HJ, et al. Multiple sclerosis in children: cerebral metabolic alterations monitored by localized proton magnetic resonance spectroscopy in vivo. Ann Neurol. (1992) 32:140–50. doi: 10.1002/ana.410320205
220. Horsfield MA, Lai M, Webb SL, Barker GJ, Tofts PS, Turner R, et al. Apparent diffusion coefficients in benign and secondary progressive multiple sclerosis by nuclear magnetic resonance. Magn Reson Med. (1996) 36:393–400. doi: 10.1002/mrm.1910360310
221. Blinkenberg M, Mathiesen HK, Tscherning T, Jonsson A, Svarer C, Holm S, et al. Cerebral metabolism, magnetic resonance spectroscopy and cognitive dysfunction in early multiple sclerosis: an exploratory study. Neurol Res. (2012) 34:52–8. doi: 10.1179/1743132811Y.0000000059
222. Cox D, Pelletier D, Genain C, Majumdar S, Lu Y, Nelson S, et al. The unique impact of changes in normal appearing brain tissue on cognitive dysfunction in secondary progressive multiple sclerosis patients. Mult Scler. (2004) 10:626–9. doi: 10.1191/1352458504ms1095oa
223. Heide AC, Kraft GH, Slimp JC, Gardner JC, Posse S, Serafini S, et al. Cerebral N-acetylaspartate is low in patients with multiple sclerosis and abnormal visual evoked potentials. AJNR Am J Neuroradiol. (1998) 19:1047–54.
224. Fleischer V, Kolb R, Groppa S, Zipp F, Klose U, Groger A. Metabolic patterns in chronic multiple sclerosis lesions and normal-appearing white matter: intraindividual comparison by using 2D MR spectroscopic imaging. Radiology. (2016) 281:536–43. doi: 10.1148/radiol.2016151654
225. Sajja BR, Narayana PA, Wolinsky JS, Ahn CW PROMiSe Trial MRSI Group. Longitudinal magnetic resonance spectroscopic imaging of primary progressive multiple sclerosis patients treated with glatiramer acetate: multicenter study. Mult Scler. (2008) 14:73–80. doi: 10.1177/1352458507079907
226. Khan O, Shen YM, Caon C, Bao F, Ching W, Reznar M, et al. Axonal metabolic recovery and potential neuroprotective effect of glatiramer acetate in relapsing-remitting multiple sclerosis. Mult Scler. (2005) 11:646–51. doi: 10.1191/1352458505ms1234oa
227. Rahimian N, Rad HS, Firouznia K, Ebrahimzadeh SA, Meysamie A, Vafaiean H, et al. Magnetic resonance spectroscopic findings of chronic lesions in two subtypes of multiple sclerosis: primary progressive versus relapsing remitting. Iran J Radiol. (2013) 10:128–32. doi: 10.5812/iranjradiol.11336
228. Pike GB, de Stefano N, Narayanan S, Francis GS, Antel JP, Arnold DL. Combined magnetization transfer and proton spectroscopic imaging in the assessment of pathologic brain lesions in multiple sclerosis. Am J Neuroradiol. (1999) 20:829–37.
229. Aboulenein-Djamshidian F, Krssak M, Serbecic N, Rauschka H, Beutelspacher S, Kukurova IJ, et al. CROP - The clinico-radiologico-ophthalmological paradox in multiple sclerosis: are patterns of retinal and MRI changes heterogeneous and thus not predictable? PLoS ONE. (2015) 10:e0142272. doi: 10.1371/journal.pone.0142272
230. De Stefano N, Caramanos Z, Preul MC, Francis G, Antel JP, Arnold DL. In vivo differentiation of astrocytic brain tumors and isolated demyelinating lesions of the type seen in multiple sclerosis using 1H magnetic resonance spectroscopic imaging. Ann Neurol. (1998) 44:273–8. doi: 10.1002/ana.410440222
231. Khan O, Shen Y, Bao F, Caon C, Tselis A, Latif Z, et al. Long-term study of brain 1H-MRS study in multiple sclerosis: effect of glatiramer acetate therapy on axonal metabolic function and feasibility of long-term H-MRS monitoring in multiple sclerosis. J Neuroimaging. (2008) 18:314–9. doi: 10.1111/j.1552–6569.2007.00206.x
232. Kirov II, Liu S, Fleysher R, Fleysher L, Babb JS, Herbert J, et al. Brain metabolite proton T2 mapping at 3.0 T in relapsing-remitting multiple sclerosis. Radiology. (2010) 254:858–66. doi: 10.1148/radiol.09091015
233. Kirov II, Liu S, Tal A, Wu WE, Davitz MS, Babb JS, et al. Proton MR spectroscopy of lesion evolution in multiple sclerosis: steady-state metabolism and its relationship to conventional imaging. Hum Brain Mapp. (2017) 38:4047–63. doi: 10.1002/hbm.23647
234. Wilson M, Andronesi O, Barker PB, Bartha R, Bizzi A, Bolan PJ, et al. Methodological consensus on clinical proton MRS of the brain: review and recommendations. Magn Reson Med. (2019) 82:527–50. doi: 10.1002/mrm.27742
235. Kanowski M, Kaufmann J, Braun J, Bernarding J, Tempelmann C. Quantitation of simulated short echo time 1H human brain spectra by LCModel and AMARES. Magn Reson Med. (2004) 51:904–12. doi: 10.1002/mrm.20063
236. Bartha R. Effect of signal-to-noise ratio and spectral linewidth on metabolite quantification at 4 T. NMR Biomed. (2007) 20:512–21. doi: 10.1002/nbm.1122
237. Swanberg KM, Prinsen H, Juchem C. Spectral quality differentially affects apparent metabolite concentrations as estimated by linear combination modeling of In vivo magnetic resonance spectroscopy data at 7 Tesla. In: Proceedings of the International Society for Magnetic Resonance in Medicine. Montréal, QC (2019). p. 4237.
238. Swanberg KM, Prinsen H, Kurada AV, Fulbright RK, Pitt D, Destefano K, et al. Towards In vivo neurochemical profiling of multiple sclerosis with MR spectroscopy at 7 Tesla: apparent increase in frontal cortex water T2 in aged individuals with progressive multiple sclerosis stabilizes in biexponential model constrained by tissue partial volumes. In: Proceedings of the International Society for Magnetic Resonance in Medicine. Paris (2018). p. 0161.
239. Behar KL, Ogino T. Characterization of macromolecule resonances in the H-1-NMR spectrum of rat-brain. Magnet Reson Med. (1993) 30:38–44. doi: 10.1002/mrm.1910300107
240. Behar KL, Rothman DL, Spencer DD, Petroff OAC Analysis of macromolecule resonances in H-1-NMR spectra of human brain. Magnet Reson Med. (1994) 32:294–302. doi: 10.1002/mrm.1910320304
241. Sharma R, Narayana PA, Wolinsky JS. Grey matter abnormalities in multiple sclerosis: proton magnetic resonance spectroscopic imaging. Mult Scler. (2001) 7:221–6. doi: 10.1191/135245801680209312
242. Lopez-Kolkovsky AL, Meriaux S, Boumezbeur F. Metabolite and macromolecule T-1 and T-2 relaxation times in the rat brain In vivo at 17.2T. Magnet Reson Med. (2016) 75:503–514. doi: 10.1002/mrm.25602
243. Opstad KS, Griffiths JR, Bell BA, Howe FA. Apparent T-2 relaxation times of lipid and macromolecules: a study of high-grade tumor spectra. J Magn Reson Imaging. (2008) 27:178–84. doi: 10.1002/jmri.21223
244. Gadea M, Martinez-Bisbal MC, Marti-Bonmati L, Espert R, Casanova B, Coret F, et al. Spectroscopic axonal damage of the right locus coeruleus relates to selective attention impairment in early stage relapsing-remitting multiple sclerosis. Brain. (2004) 127:89–98. doi: 10.1093/brain/awh002
245. Simone IL, Tortorella C, Federico F, Liguori M, Lucivero V, Giannini P, et al. Axonal damage in multiple sclerosis plaques: a combined magnetic resonance imaging and H-1-magnetic resonance spectroscopy study. J Neurol Sci. (2001) 182:143–50. doi: 10.1016/S0022-510X(00)00464-0
246. Enzinger C, Ropele S, Strasser-Fuchs S, Kapeller P, Schmidt H, Poltrum B, et al. Lower levels of N-acetylaspartate in multiple sclerosis patients with the apolipoprotein epsilon 4 allele. Arch Neurol. (2003) 60:65–70. doi: 10.1001/archneur.60.1.65
247. Toprak MK, Cakir B, Ulu EM, Arat Z, Benli US, Can U, et al. The effects of interferon beta-1a on proton MR spectroscopic imaging in patients with multiple sclerosis, a controlled study, preliminary results. Int J Neurosci. (2008) 118:1645–58. doi: 10.1080/00207450802309680
248. Prinsen H, de Graaf RA, Mason GF, Pelletier D, Juchem C. Reproducibility measurement of glutathione, GABA, and glutamate: Towards in vivo neurochemical profiling of multiple sclerosis with MR spectroscopy at 7T. J Magn Reson Imaging. (2017) 45:187–98. doi: 10.1002/jmri.25356
249. Brief EE, Vavasour IM, Laule C, Li DK, Mackay AL. Proton MRS of large multiple sclerosis lesions reveals subtle changes in metabolite T(1) and area. NMR Biomed. (2010) 23:1033–7. doi: 10.1002/nbm.1527
250. Provencher SW. Estimation of metabolite concentrations from localized in-vivo proton NMR-spectra. Magnet Reson Med. (1993) 30:672–9. doi: 10.1002/mrm.1910300604
251. Kim YG, Choi GH, Kim DH, Kim YD, Kang YK, Kim JK. In vivo proton magnetic resonance spectroscopy of human spinal mass lesions. J Spinal Disord Tech. (2004) 17:405–11. doi: 10.1097/01.bsd.0000124762.36865.9f
252. Bhattacharyya PK, Phillips MD, Stone LA, Bermel RA, Lowe MJ. Sensorimotor cortex gamma-aminobutyric acid concentration correlates with impaired performance in patients with MS. AJNR Am J Neuroradiol. (2013) 34:1733–9. doi: 10.3174/ajnr.A3483
253. Bhattacharyya PK, Phillips MD, Stone LA, Lowe MJ. Activation volume vs BOLD signal change as measures of fMRI activation—Its impact on GABA - fMRI activation correlation. Magn Reson Imaging. (2017) 42:123–9. doi: 10.1016/j.mri.2017.06.009
254. Rothman DL, Behar KL, Prichard JW, Petroff OAC. Homocarnosine and the measurement of neuronal pH in patients with epilepsy. Magnet Reson Med. (1997) 38:924–9. doi: 10.1002/mrm.1910380611
255. Henry PG, Dautry C, Hantraye P, Bloch G. Brain GABA editing without macromolecule contamination. Magn Reson Med. (2001) 45:517–20. doi: 10.1002/1522-2594(200103)45:3<517::AID-MRM1068>3.0.CO;2-6
256. Mocioiu V, Ortega-Martorell S, Olier I, Jablonski M, Starcukova J, Lisboa P, et al. From raw data to data-analysis for magnetic resonance spectroscopy - the missing link: jMRUI2XML. BMC Bioinformatics. (2015) 16:378. doi: 10.1186/s12859-015-0796-5
257. Wilson M, Reynolds G, Kauppinen RA, Arvanitis TN, Peet AC. A constrained least-squares approach to the automated quantitation of In vivo (1)H magnetic resonance spectroscopy data. Magn Reson Med. (2011) 65:1–12. doi: 10.1002/mrm.22579
258. Edden RAE, Puts NAJ, Harris AD, Barker PB, Evans CJ. Gannet: a batch-processing tool for the quantitative analysis of gamma-aminobutyric acid-edited MR spectroscopy spectra. J Magn Reson Imaging. (2014) 40:1445–52. doi: 10.1002/jmri.24478
259. Cavassila S, Deval S, Huegen C, van Ormondt D, Graveron-Demilly D. Cramer-Rao bounds: an evaluation tool for quantitation. NMR Biomed. (2001) 14:278–83. doi: 10.1002/nbm.701
260. Kreis R. The trouble with quality filtering based on relative cramer-rao lower bounds. Magn Reson Med. (2016) 75:15–8. doi: 10.1002/mrm.25568
261. Wang Y, Song S-K. Optimizing diffusion weighting scheme by Cramer-Rao Lower Bound Analysis and Monte Carlo Simulation. In: Proceedings of the International Society for Magnetic Resonance in Medicine. Melbourne (2012). p. 3542.
262. Wood ET, Ercan AE, Branzoli F, Webb A, Sati P, Reich DS, et al. Reproducibility and optimization of In vivo human diffusion-weighted MRS of the corpus callosum at 3 T and 7 T. NMR Biomed. (2015) 28:976–87. doi: 10.1002/nbm.3340
263. Steenwijk MD, Geurts JJ, Daams M, Tijms BM, Wink AM, Balk LJ, et al. Cortical atrophy patterns in multiple sclerosis are non-random and clinically relevant. Brain. (2016) 139:115–26. doi: 10.1093/brain/awv337
264. Benedetti B, Rovaris M, Rocca MA, Caputo D, Zaffaroni M, Capra R, et al. in-vivo evidence for stable neuroaxonal damage in the brain of patients with benign multiple sclerosis. Mult Scler. (2009) 15:789–94. doi: 10.1177/1352458509103714
265. Brex PA, Parker GJM, Leary SM, Molyneux PD, Barker GJ, Davie CA, et al. Lesion heterogeneity in multiple sclerosis: a study of the relations between appearances on T1 weighted images, T1 relaxation times, and metabolite concentrations. J Neurol Neurosur Psychiatry. (2000) 68:627–32. doi: 10.1136/jnnp.68.5.627
266. Lucchinetti C, Bruck W, Parisi J, Scheithauer B, Rodriguez M, Lassmann H. Heterogeneity of multiple sclerosis lesions: implications for the pathogenesis of demyelination. Ann Neurol. (2000) 47:707–17. doi: 10.1002/1531-8249(200006)47:6<707::AID-ANA3>3.0.CO;2-Q
267. Stork L, Ellenberger D, Beissbarth T, Friede T, Lucchinetti CF, Bruck W, et al. Differences in the reponses to apheresis therapy of patients with 3 histopathologically classified immunopathological patterns of multiple sclerosis. JAMA Neurol. (2018) 75:428–35. doi: 10.1001/jamaneurol.2017.4842
268. Jarius S, Konig FB, Metz I, Ruprecht K, Paul F, Bruck W, et al. Pattern II and pattern III MS are entities distinct from pattern I MS: evidence from cerebrospinal fluid analysis. J Neuroinflammation. (2017) 14:171. doi: 10.1186/s12974-017-0929-z
269. Metz I, Weigand SD, Popescu BF, Frischer JM, Parisi JE, Guo Y, et al. Pathologic heterogeneity persists in early active multiple sclerosis lesions. Ann Neurol. (2014) 75:728–38. doi: 10.1002/ana.24163
270. Geurts JJ, Calabrese M, Fisher E, Rudick RA. Measurement and clinical effect of grey matter pathology in multiple sclerosis. Lancet Neurol. (2012) 11:1082–92. doi: 10.1016/S1474-4422(12)70230-2
271. Seewann A, Kooi EJ, Roosendaal SD, Pouwels PJ, Wattjes MP, van der Valk P, et al. Postmortem verification of MS cortical lesion detection with 3D DIR. Neurology. (2012) 78:302–8. doi: 10.1212/WNL.0b013e31824528a0
272. Pina-Oviedo S, Ortiz-Hidalgo C, Ayala AG. Human colors-The rainbow garden of pathology: what gives normal and pathologic tissues their color? Arch Pathol Lab Med. (2017) 141:445–62. doi: 10.5858/arpa.2016-0274-SA
273. Mallucci G, Peruzzotti-Jametti L, Bernstock JD, Pluchino S. The role of immune cells, glia and neurons in white and gray matter pathology in multiple sclerosis. Prog Neurobiol. (2015) 127–128:1–22. doi: 10.1016/j.pneurobio.2015.02.003
274. Wang Y, Li SJ. Differentiation of metabolic concentrations between gray matter and white matter of human brain by In vivo 1H magnetic resonance spectroscopy. Magn Reson Med. (1998) 39:28–33. doi: 10.1002/mrm.1910390107
275. Najac C, Branzoli F, Ronen I, Valette J. Brain intracellular metabolites are freely diffusing along cell fibers in grey and white matter, as measured by diffusion-weighted MR spectroscopy in the human brain at 7 T. Brain Struct Funct. (2016) 221:1245–54. doi: 10.1007/s00429-014-0968-5
276. Mlynarik V, Gruber S, Moser E. Proton T-1 and T-2 relaxation times of human brain metabolites at 3 Tesla. NMR Biomed. (2001) 14:325–31. doi: 10.1002/nbm.713
277. Eshaghi A, Marinescu RV, Young AL, Firth NC, Prados F, Jorge Cardoso M, et al. Progression of regional grey matter atrophy in multiple sclerosis. Brain. (2018) 141:1665–77. doi: 10.1093/brain/awy088
278. Chard DT, Griffin CM, Rashid W, Davies GR, Altmann DR, Kapoor R, et al. Progressive grey matter atrophy in clinically early relapsing-remitting multiple sclerosis. Mult Scler. (2004) 10:387–91. doi: 10.1191/1352458504ms1050oa
279. Raz E, Cercignani M, Sbardella E, Totaro P, Pozzilli C, Bozzali M, et al. Gray- and white-matter changes 1 year after first clinical episode of multiple sclerosis: MR imaging. Radiology. (2010) 257:448–54. doi: 10.1148/radiol.10100626
280. Fakhredin RB, Saade C, Kerek R, El-Jamal L, Khoury SJ, El-Merhi F. Imaging in multiple sclerosis: a new spin on lesions. J Med Imag Radiat Oncol. (2016) 60:577–86. doi: 10.1111/1754–9485.12498
281. Landheer K, Schulte RF, Treacy MS, Swanberg KM, Juchem C. Theoretical description of modern 1H In vivo magnetic resonance spectroscopic pulse sequences. J Magn Reson Imaging. (2019). doi: 10.1002/jmri.26846. [Epub ahead of print].
282. Sappey-Marinier D. High-resolution NMR spectroscopy of cerebral white matter in multiple sclerosis. Magn Reson Med. (1990) 15:229–39. doi: 10.1002/mrm.1910150206
283. Vrenken H, Geurts JJ, Knol DL, van Dijk LN, Dattola V, Jasperse B, et al. Whole-brain T1 mapping in multiple sclerosis: global changes of normal-appearing gray and white matter. Radiology. (2006) 240:811–20. doi: 10.1148/radiol.2403050569
284. West J, Aalto A, Tisell A, Leinhard OD, Landtblom AM, Smedby O, et al. Normal appearing and diffusely abnormal white matter in patients with multiple sclerosis assessed with quantitative MR. PLoS ONE. (2014) 9:e95161. doi: 10.1371/journal.pone.0095161
285. Jurcoane A, Wagner M, Schmidt C, Mayer C, Gracien RM, Hirschmann M, et al. Within-lesion differences in quantitative MRI parameters predict contrast enhancement in multiple sclerosis. J Magn Reson Imaging. (2013) 38:1454–61. doi: 10.1002/jmri.24107
286. Wright PJ, Mougin OE, Totman JJ, Peters AM, Brookes MJ, Coxon R, et al. Water proton T1 measurements in brain tissue at 7:3, and 1.5 T using IR-EPI, IR-TSE, and MPRAGE: results and optimization. MAGMA. (2008) 21:121–30. doi: 10.1007/s10334-008-0104-8
287. Papanikolaou N, Papadaki E, Karampekios S, Spilioti M, Maris T, Prassopoulos P, et al. T2 relaxation time analysis in patients with multiple sclerosis: correlation with magnetization transfer ratio. Eur Radiol. (2004) 14:115–22. doi: 10.1007/s00330-003-1946-0
288. Bot JC, Barkhof F. Spinal-cord MRI in multiple sclerosis: conventional and nonconventional MR techniques. Neuroimaging Clin N Am. (2009) 19:81–99. doi: 10.1016/j.nic.2008.09.005
289. Jiru F, Skoch A, Wagnerova D, Dezortova M, Viskova J, Profant O, et al. The age dependence of T2 relaxation times of N-acetyl aspartate, creatine and choline in the human brain at 3 and 4T. NMR Biomed. (2016) 29:284–92. doi: 10.1002/nbm.3456
290. Snyder J, Thompson RB, Wild JM, Wilman AH. Strongly coupled versus uncoupled spin response to radio frequency interference effects: application to glutamate and glutamine in spectroscopic imaging. NMR Biomed. (2008) 21:402–9. doi: 10.1002/nbm.1214
291. Lutz T, Bellenberg B, Schneider R, Weiler F, Koster O, Lukas C. Central atrophy early in multiple sclerosis: third ventricle volumetry versus planimetry. J Neuroimaging. (2017) 27:348–54. doi: 10.1111/jon.12410
292. Vaughan JT, Garwood M, Collins CM, Liu W, DelaBarre L, Adriany G, et al. 7T vs. 4T: RF power, homogeneity, and signal-to-noise comparison in head images. Magn Reson Med. (2001) 46:24–30. doi: 10.1002/mrm.1156
293. Dula AN, Pawate S, Dethrage LM, Conrad BN, Dewey BE, Barry RL, et al. Chemical exchange saturation transfer of the cervical spinal cord at 7T. NMR Biomed. (2016) 29:1249–57. doi: 10.1002/nbm.3581
294. Caramanos Z, Narayanan S, Arnold DL. 1H-MRS quantification of tNA and tCr in patients with multiple sclerosis: a meta-analytic review. Brain. (2005) 128:2483–506. doi: 10.1093/brain/awh640
295. Choi C, Ganji SK, DeBerardinis RJ, Hatanpaa KJ, Rakheja D, Kovacs Z, et al. 2-hydroxyglutarate detection by magnetic resonance spectroscopy in IDH-mutated patients with gliomas. Nat Med. (2012) 18:624–9. doi: 10.1038/nm.2682
296. Suh CH, Kim HS, Jung SC, Choi CG, Kim SJ. 2-hydroxyglutarate MR spectroscopy for prediction of isocitrate dehydrogenase mutant glioma: A systemic review and meta-analysis using individual patient data. Neuro Oncol. (2018) 20:1573–83. doi: 10.1093/neuonc/noy113
297. Andronesi OC. Precision oncology in the era of radiogenomics: the case of D-2HG as an imaging biomarker for mutant IDH gliomas. Neuro Oncol. (2018) 20:865–7. doi: 10.1093/neuonc/noy085
298. Wu GY, Zhang Q, Wu JL, Jing L, Tan Y, Qiu TC, et al. Changes in cerebral metabolites in type 2 diabetes mellitus: a meta-analysis of proton magnetic resonance spectroscopy. J Clin Neurosci. (2017) 45:9–13. doi: 10.1016/j.jocn.2017.07.017
299. Zimny A, Szmyrka-Kaczmarek M, Szewczyk P, Bladowska J, Pokryszko-Dragan A, Gruszka E, et al. In vivo evaluation of brain damage in the course of systemic lupus erythematosus using magnetic resonance spectroscopy, perfusion-weighted and diffusion-tensor imaging. Lupus. (2014) 23:10–9. doi: 10.1177/0961203313511556
300. Bairwa D, Kumar V, Vyas S, Das BK, Srivastava AK, Pandey RM, et al. Case control study: magnetic resonance spectroscopy of brain in HIV infected patients. BMC Neurol. (2016) 16:99. doi: 10.1186/s12883-016-0628-x
301. Bizzi A, Ulug AM, Crawford TO, Passe T, Bugiani M, Bryan RN, et al. Quantitative proton MR spectroscopic imaging in acute disseminated encephalomyelitis. AJNR Am J Neuroradiol. (2001) 22:1125–30.
302. Nitkunan A, Charlton RA, Barrick TR, McIntyre DJ, Howe FA, Markus HS. Reduced N-acetylaspartate is consistent with axonal dysfunction in cerebral small vessel disease. NMR Biomed. (2009) 22:285–91. doi: 10.1002/nbm.1322
303. de Seze J, Blanc F, Kremer S, Collongues N, Fleury M, Marcel C, et al. Magnetic resonance spectroscopy evaluation in patients with neuromyelitis optica. J Neurol Neurosurg Psychiatry. (2010) 81:409–11. doi: 10.1136/jnnp.2008.168070
304. Wottschel V, Alexander DC, Kwok PP, Chard DT, Stromillo ML, De Stefano N, et al. Predicting outcome in clinically isolated syndrome using machine learning. Neuroimage Clin. (2015) 7:281–7. doi: 10.1016/j.nicl.2014.11.021
305. Ion-Margineanu A, Kocevar G, Stamile C, Sima DM, Durand-Dubief F, Van Huffel S, et al. Machine learning approach for classifying multiple sclerosis courses by combining clinical data with lesion loads and magnetic resonance metabolic features. Front Neurosci. (2017) 11:398. doi: 10.3389/fnins.2017.00398
306. Pedregosa F, Varoquaux G, Gramfort A, Michel V, Thirion B, Grisel O, et al. Scikit-learn: machine learning in python. J Mach Learn Res. (2011) 12:2825–30. Available online at: https://hal.inria.fr/hal-00650905v1/document
307. Paszke A, Gross S, Chintala S, Chanan G, Yang E, DeVito Z, et al. Automatic differentiation in PyTorch. In: NIPS 2017 Workshop Autodiff. Long Beach, CA (2017).
308. Abadi M, Agarwal A, Barham P, Brevdo E, Chen Z, Citro C, et al. TensorFlow: Large-Scale Machine Learning on Heterogeneous Systems. Software Available online at: www.tensorflow.org (2015).
309. R Development Core Team. R: A Language and Environment for Statistical Computing. R Foundation for Statistical Computing, Vienna, Austria (2010).
310. Kurada AV, Swanberg KM, Prinsen H, Juchem C. Diagnosis of multiple sclerosis subtype through machine learning analysis of frontal cortex metabolite profiles. In: Proceedings of the International Society for Magnetic Resonance in Medicine. Montréal, QC (2019). p. 4871.
Keywords: multiple sclerosis, in vivo proton magnetic resonance spectroscopy 1H-MRS, biomarker, longitudinal relaxation T1, transverse relaxation T2, spectroscopic baseline, absolute quantification, macromolecules
Citation: Swanberg KM, Landheer K, Pitt D and Juchem C (2019) Quantifying the Metabolic Signature of Multiple Sclerosis by in vivo Proton Magnetic Resonance Spectroscopy: Current Challenges and Future Outlook in the Translation From Proton Signal to Diagnostic Biomarker. Front. Neurol. 10:1173. doi: 10.3389/fneur.2019.01173
Received: 05 August 2019; Accepted: 21 October 2019;
Published: 15 November 2019.
Edited by:
Valentina Tomassini, Cardiff University, United KingdomReviewed by:
Nils Muhlert, University of Manchester, United KingdomJulián Benito León, University Hospital October 12, Spain
Copyright © 2019 Swanberg, Landheer, Pitt and Juchem. This is an open-access article distributed under the terms of the Creative Commons Attribution License (CC BY). The use, distribution or reproduction in other forums is permitted, provided the original author(s) and the copyright owner(s) are credited and that the original publication in this journal is cited, in accordance with accepted academic practice. No use, distribution or reproduction is permitted which does not comply with these terms.
*Correspondence: Kelley M. Swanberg, k.swanberg@columbia.edu