 Hsin-Chieh Yang1†
 Raj Swaroop Lavadi1
 Andrew D. Sauerbeck2,3Michael Wallendorf4
 Terrance T. Kummer2,3,5
 Sheng-Kwei Song1,3
 Tsen-Hsuan Lin1*†
- 1Department of Radiology, Washington University School of Medicine, St. Louis, MO, United States
- 2Department of Neurology, Washington University School of Medicine, St. Louis, MO, United States
- 3Hope Center for Neurological Disorders, Washington University School of Medicine, St. Louis, MO, United States
- 4Department of Biostatistics, Washington University School of Medicine, St. Louis, MO, United States
- 5VA Medical Center, St. Louis, MO, United States
Introduction: Traumatic optic neuropathy (TON) is the optic nerve injury secondary to brain trauma leading to visual impairment and vision loss. Current clinical visual function assessments often fail to detect TON due to slow disease progression and clinically silent lesions resulting in potentially delayed or missed treatment in patients with traumatic brain injury (TBI).
Methods: Diffusion basis spectrum imaging (DBSI) is a novel imaging modality that can potentially fill this diagnostic gap. Twenty-two, 16-week-old, male mice were equally divided into a sham or TBI (induced by moderate Closed-Head Impact Model of Engineered Rotational Acceleration device) group. Briefly, mice were anesthetized with isoflurane (5% for 2.5 min followed by 2.5% maintenance during injury induction), had a helmet placed over the head, and were placed in a holder prior to a 2.1-joule impact. Serial visual acuity (VA) assessments, using the Virtual Optometry System, and DBSI scans were performed in both groups of mice. Immunohistochemistry (IHC) and histological analysis of optic nerves was also performed after in vivo MRI.
Results: VA of the TBI mice showed unilateral or bilateral impairment. DBSI of the optic nerves exhibited bilateral involvement. IHC results of the optic nerves revealed axonal loss, myelin injury, axonal injury, and increased cellularity in the optic nerves of the TBI mice. Increased DBSI axon volume, decreased DBSI λ||, and elevated DBSI restricted fraction correlated with decreased SMI-312, decreased SMI-31, and increased DAPI density, respectively, suggesting that DBSI can detect coexisting pathologies in the optic nerves of TBI mice.
Conclusion: DBSI provides an imaging modality capable of detecting subclinical changes of indirect TON in TBI mice.
Introduction
Traumatic brain injury (TBI) results in several, burdensome, ocular pathologies. A substantial proportion of patients with TBI experience visual problems resulting from optic neuropathy (1–5). Optic neuropathy in TBI can be direct or indirect. Direct traumatic optic neuropathy (TON) results from anatomical disruption of the optic nerve, whereas indirect TON originates from optic nerve stretch during a head injury. The latter can also occur due to secondary injury to the retinal ganglion cell axons (6, 7). Preclinical studies have showed that repeated mild TBI results in loss of the retinal nerve fiber layer and the inner plexiform layer (8–10). Changes in the pupillary diameter have also been noted following TBI, suggesting its neurovascular implications on the visual pathway in TBI (10). These changes may potentially root from a systemic and local dopaminergic disruption of the retina following TBI (10), and hemorrhage or edema (11–14). Both direct and indirect TON can contribute to optic nerve damage and a clear distinction is not always straightforward given that the optic nerve is vulnerable to multiple insults, such as the transmission of force or transient ischemia (12, 14).
TON is not commonly diagnosed due to slow disease progression, and undetected subclinical visual dysfunction. Missed diagnosis of indirect TON could lead to delayed or inappropriate treatment and subsequent reduction in visual function. Thus, an accurate and timely diagnosis of indirect TON is an unmet clinical need in treating patients with TBI. However, diagnosis of indirect TON is incomplete because standard visual functional assessments have limitations for appropriately reflecting optic nerve pathology (3, 15, 16). Tests such as optical coherence tomography (OCT) are also limited in detecting indirect TON as the accuracy of the retinal nerve fiber layer thickness can be confounded by inflammation-associated swelling in TBI (17). In addition, OCT cannot assess the posterior segment of the optic nerve, the most likely location of injury in indirect TON (12, 18).
To assess the posterior segment of the optic nerve, conventional magnetic resonance imaging (MRI) and diffusion tensor imaging (DTI) have seen increased application providing a comprehensive assessment of the visual system and related intracranial pathologies (19–21). However, both conventional MRI and DTI lack the needed specificity for the underlying pathologies in optic nerves (e.g., T2-hyperintense lesions can reflect demyelination, inflammation, or both, and changes in fractional anisotropy and apparent diffusion coefficient can result from axonal injury, demyelination, and/or inflammation) (20, 22–25).
To overcome the limitations of conventional MRI and DTI, diffusion basis spectrum imaging (DBSI) has been developed to detect, differentiate, and quantify coexisting pathologies (26), and to assess treatment efficacy (27, 28) in the optic nerve of a mouse model of multiple sclerosis. Aside from the application in optic nerve, DBSI has also demonstrated the ability to detect spinal cord axonal loss in patients with cervical spondylotic myelopathy (29, 30) and a mouse model of spinal cord injury (31) in the presence of tissue swelling. Thus, DBSI may hold the potential to specifically assess coexisting pathologies and reflect the corresponding severity of the underlying white-matter pathological components. In this study, DBSI was used to image the optic nerves of the murine moderate Closed-Head Impact Model of Engineered Rotational Acceleration (modCHIMERA) (32) to detect indirect TON and assess the progression of optic nerve pathology.
Methods
All experimental procedures were approved by the Washington University Institutional Animal Care and Use Committee (IACUC) and performed according to the Public Health Service Policy on Humane Care and Use of Laboratory Animals (33).
Experimental design
Twenty-two male C57BL/6 mice at age of 16 weeks old (The Jackson Laboratory, Bar Harbor, ME) were housed and maintained in the Washington University animal facility and subjected to a 12-h light/dark cycle. Eleven mice (five for in vivo and six for ex vivo) were injured as previously described using the modCHIMERA model (32). Briefly, mice were anesthetized with isoflurane (5% for 2.5 min followed by 2.5% maintenance during injury induction), had a helmet placed over the head, and were placed into a holder prior to a 2.1-joule impact (moderate—severe TBI) (32). The sham control group consisted of 11 (five for in vivo and six for ex vivo) mice undergoing the exact procedure without impact.
In vivo cohort (n = 5 for each group): Visual acuity assessment and DBSI scans were performed at 1, 3, 7, and 30 days after impact or sham operation. At the end of the DBSI time course, the TBI and sham mice were deeply anesthetized and underwent perfusion-fixation via the left cardiac ventricle with phosphate buffered saline (PBS), followed by 4% paraformaldehyde (PFA). Brains were excised and stored in 4% PFA at 4°C for 24 h and then transferred to PBS for paraffin embedding processing. Ex vivo cohort (n = 6 for each group): 3 days after impact or sham operation, mice were perfusion-fixed with 4% paraformaldehyde in PBS. After removing the skull, brain specimens were left in 4% paraformaldehyde for overnight at 4°C and then transferred to a 3-ml syringe filling with PBS for the ex vivo scan. After the ex vivo scan, the batch of the ex vivo cohort was processed with the same paraffin embedding processing protocol as the in vivo cohort.
Visual acuity (for in vivo cohort only)
Mouse visual acuity (VA) was assessed using the Virtual Optometry System (Optometry, Cerebral Mechanics, Inc., Canada). Briefly, the virtual rotating columns were projected on the LCD monitors with different spatial frequencies in cycles/degree (c/d). The mouse head movement in response to the rotating virtual columns was noted. The VA was defined as the highest spatial frequency the mouse was able to respond to the virtual rotating columns. The spatial frequency was changed starting from 0.1 c/d with a step size of 0.05 c/d until the mouse stopped responding. When VA ≤ 0.25 c/d, the mouse was considered to develop impaired VA, as defined by previous studies (26, 27, 34, 35). VA was performed right before each in vivo MRI scan session.
Magnetic resonance imaging
In vivo and ex vivo magnetic resonance imaging (MRI) experiments were performed on a 4.7-T Agilent DirectDrive™ small-animal MRI system (Agilent Technologies, Santa Clara, CA) equipped with a Magnex/Agilent HD imaging gradient coil (Magnex/Agilent, Oxford, United Kingdom). In vivo DBSI protocol: Mice were anesthetized with ~1% isoflurane/oxygen during scans. Breathing rate was monitored and body temperature was maintained at 37° C with a small animal physiological monitoring and control unit (SA Instruments, Stony Brook, NY). An actively decoupled 1.7-cm receive coil (36) was placed on top of the mouse head for MR signal reception. The animal holder assembly, containing the receive coil and monitoring accessories, was placed inside an 8-cm actively decoupled volume transmit coil, in a 12-cm cradle to be placed inside the magnet. 25-direction diffusion-weighted measurements were performed by a multi-echo spin-echo diffusion-weighting imaging sequence (37) with the following parameters: repetition time (TR) = 1.5 s; echo time (TE) = 35 ms; inter-echo delay = 20.7 ms; field of view (FOV) = 22.5 × 22.5 mm2; matrix size = 192 × 192 (zero-filled to 384 × 384), slice thickness = 1 mm, max; b value = 2,200 s/mm2, Δ = 18 ms; δ = 6 ms; total scan time = 124 min (26). Ex vivo DBSI protocol: The sample syringe was inserted into the solenoid surface coil to cover the whole brain. 99-direction diffusion-weighted measurements were performed by a multi-echo spin-echo diffusion-weighting imaging sequence (37) with the following parameters: TR = 3.0 s, TE = 31.5 ms, inter-echo delay = 23.4 ms, Δ = 18 ms, δ = 6 ms, maximal b-value = 3,000 s/mm2, with the same FOV = 15 × 15 mm2, slice thickness = 1 mm, and matrix size = 128 × 128 (zero-filled to 256 × 256). Total scan time was 10 h and 33 min.
Imaging mouse optic nerve
The imaging site was at the pre-chiasmic segment of the optic nerve exhibiting symmetric left and right optic nerves in the axial view of the mouse brain. To maintain the consistency of imaging location, the multi-axial scout images were used to define mid-sagittal image slice (Supplementary Figure S1A). Mid-sagittal scout image with diffusion-weighting along the slice-selection direction was used to visualize corpus callosum (Supplementary Figure S1B, light blue arrow) and the optic nerve (Supplementary Figure S1B, green arrow). The reference axial image slice (Supplementary Figure S1B, red rectangle) was acquired perpendicular to the optic nerve, and the genu of corpus callosum was in the reference axial image slice (Supplementary Figure S1B, red rectangle). The cross-sectional optic nerves were at the final axial image with minimal confounding effects from cerebrospinal fluid (Supplementary Figure S1C).
Diffusion MRI data analysis
Diffusion-weighted (DW) data were denoised (38) and converted into nifti format. The nifti-format DW data were analyzed with a lab-developed DBSI software package to perform DBSI multi-tensor analysis (20, 39). For optic nerve white matter tracts (coherent fiber bundles), the diffusion-weighted imaging data was modeled according to Equation 1:
The quantities and are the signal and b-value of the kth diffusion gradient; is the angle between the kth diffusion gradient and the principal direction of the anisotropic tensor; and are the axial and radial diffusivities of the anisotropic tensor, respectively; is the signal intensity fraction for the anisotropic tensor; a and b are the low and high diffusivity limits for the isotropic diffusion spectrum, reflecting cellularity and edema, respectively, . DBSI-derived represents optic nerve white-matter tract density in an image voxel. DBSI-derived λ|| and λ⊥ reflect residual axon and myelin integrity, respectively: ↓ λ|| ≈ axonal injury and ↑ λ⊥ ≈ myelin damage (20, 39–41). As dictated by previous experimental findings, the restricted isotropic diffusion fraction reflecting cellularity in mouse optic nerves is derived by the summation of at 0 ≤ apparent diffusion coefficient (ADC) ≤ 0.6 μm2/ms. The summation of the remaining at 0.6 < ADC ≤ 2 (for ex vivo) and 0.6 < ADC ≤ 3 (for in vivo) μm2/ms represents non-restricted isotropic diffusion, which putatively denotes vasogenic edema and cerebrospinal fluid (20, 39–41).
Regions of interest (ROI) were manually drawn in the center of each optic nerve on the diffusion-weighted image, which corresponded to the diffusion gradient direction perpendicular to optic nerves, to minimize partial volume effects. ROIs were then transferred to the parametric maps to calculate the mean for each of the DBSI metrics.
ROI for DBSI-derived axon volume
Separate ROIs encompassing the whole optic nerve for axon volume calculation were drawn on the diffusion weighted images (DWI) orthogonal to the optic nerve, which were larger than the ROIs for DBSI metrics. The fiber fraction was measured of this larger ROI. DBSI-derived axon volume was calculated from the optic nerve volume (the entire ROIs on DWIs) multiplying by corresponding DBSI fiber fraction of this larger ROI.
Immunohistochemistry
Optic nerve pairs with chiasm were dissected (Supplementary Figure S2A) and embedded in 2% agar first (42). The agar block was embedded with liquid paraffin and the optic nerve was placed at the bottom of the embedding mold. The paraffin blocks were then sectioned from the optic chiasm at 20-μm thickness. Once passing the region of the optic chiasm, the sectioning thickness was reduced to 5-μm for 40 slices. The sectioning region reached the MRI imaging region (Supplementary Figure S2A, yellow rectangle), and the cross-sectional left and right optic nerves were shown as two circles (Supplementary Figure S2B, red arrows). The paraffin sectioning slices were deparaffinized and rehydrated for immunohistochemistry (IHC) analysis. Three nerves were damaged during the extraction process, and the other 41 nerves were used for paraffin embedding process. Sections were blocked with 5% normal goat serum and 1% bovine serum albumin in PBS for 30 min at room temperature to prevent non-specific binding. Slides were then incubated overnight at 4°C with primary antibody and then 1 h at room temperature with the appropriate secondary antibody. Primary antibodies used were anti-total neurofilament (SMI-312, staining both injured and intact axons, BioLegend, 1:300), anti-phosphorylated neurofilament (SMI-31, reflecting intact axons, BioLegend, 1:300), and anti-myelin basic protein (MBP, assessing myelin sheaths, Sigma, 1:300). Secondary antibodies were goat anti-mouse or goat anti-rabbit (Invitrogen, 1:240), which were conjugated to either Alexa 488 for SMI-31, SMI-312, or MBP. Slides were mounted with Vectashield Mounting Medium for DAPI (4′, 6-dianidino-2-phenylindole, detecting cell nuclei, Vector Laboratory Inc., Burlingame, CA) and coverslipped. Images were acquired on a Nikon Eclipse 80i fluorescence microscope with MetaMorph software (Universal Imaging Corporation, Sunnyvale, CA) at 100× magnifications.
Histological data analysis
The whole field of SMI-31, MBP, and DAPI staining images at 100× magnification was captured with the same fluorescent light intensity and exposure time. All captured images were converted to 8-bit grayscale and analyzed using threshold, edge enhancement, analyze particles, and gray level watershed segmentation functions of ImageJ.1
Statistical analysis
The correlations of histology and VA data with DBSI measurements were analyzed by a mixed random effect regression that accounted within mouse correlation between eye measurements. MRI measurements were taken from all eyes of sham and TBI mice. A mixed two-way ANOVA was performed between sham and TBI groups for comparing DBSI, DTI, and histology data. The correlation of histology data and DBSI measurements was analyzed by using Pearson Correlation Coefficients.
Results
Inconsistency between visual acuity and in vivo DBSI assessments
VA of TBI mice was unilaterally or bilaterally affected (Figure 1). At 1 day after TBI, VA was impaired in 3 out of 10 eyes and progressed to 9 out of 10 impaired eyes at 3 days after TBI. VA improved to impairment in 4 out of 10 and 3 out of 10 eyes at 7 and 30 days after TBI, respectively (Figure 1). DBSI metrics of optic nerves, however, were bilaterally affected with decreased DBSI-λ||, elevated DBSI-λ⊥, increased DBSI restricted (putative inflammatory cellularity) fraction, and decreased fiber fraction at 1, 3, 7, and 30 days after TBI (Table 1).
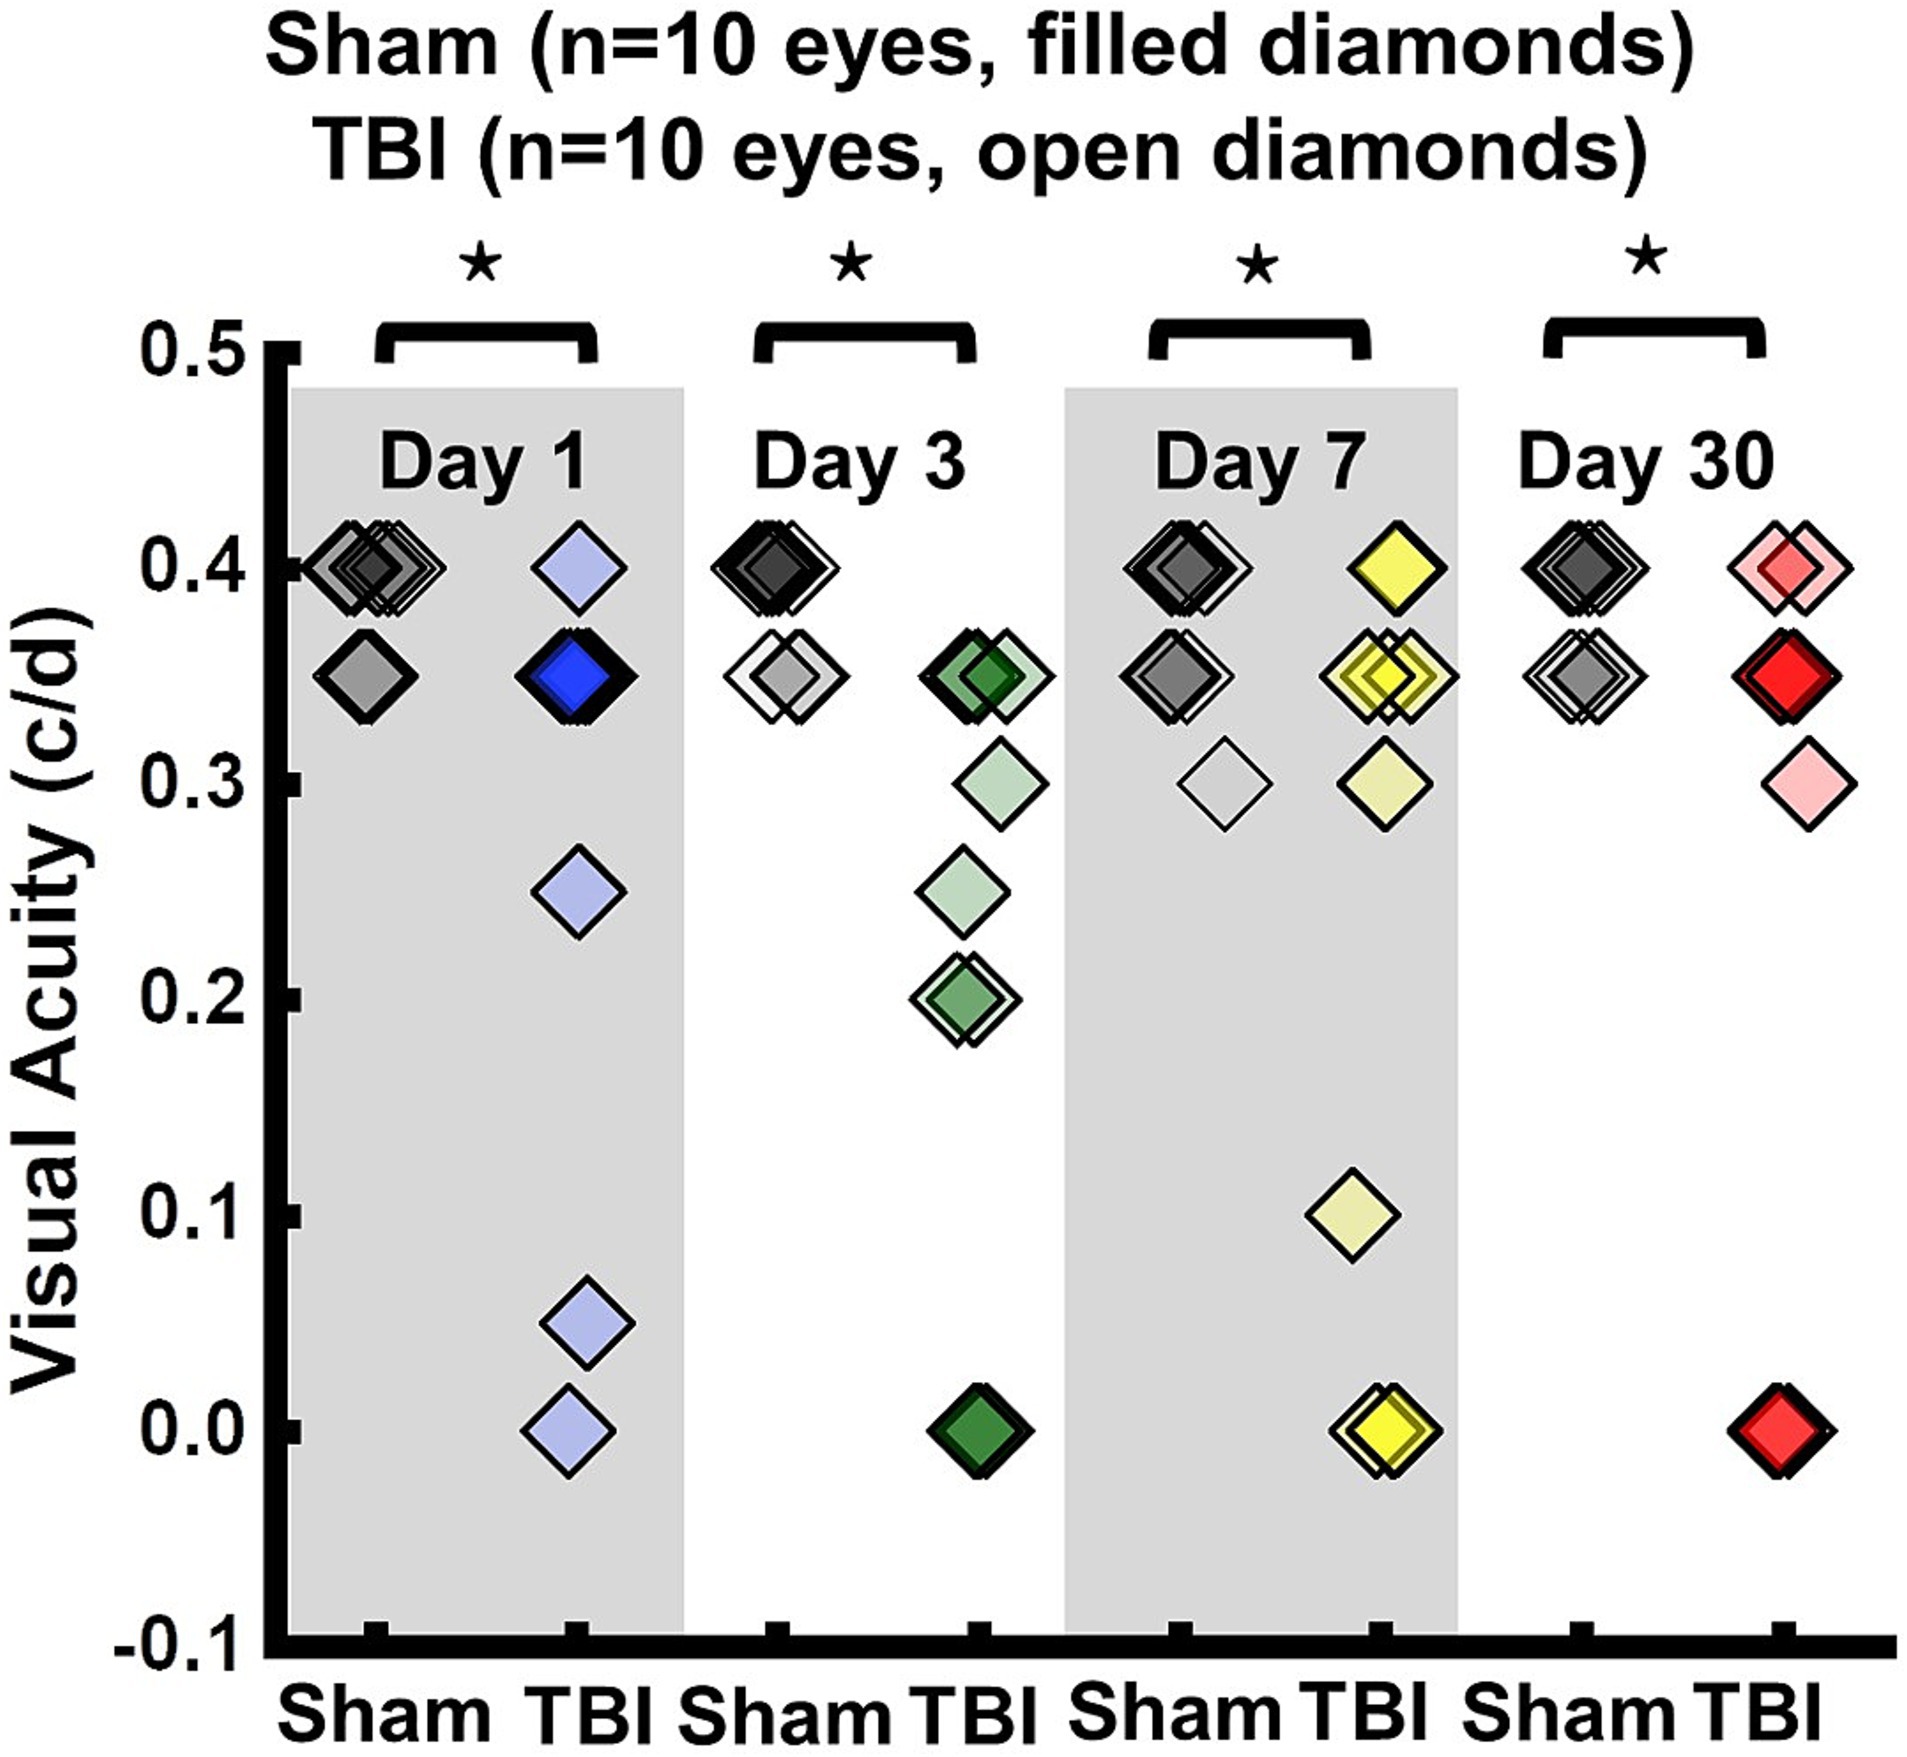
Figure 1. Longitudinal visual acuity (VA) of sham (filled diamonds) and TBI (open diamonds) eyes 1, 3, 7, and 30 days after TBI. VA was impaired in 3 out of 10 eyes, 9 out of 10 eyes, 4 out of 10 eyes, and 3 out of 10 eyes, at 1, 3, 7, and 30 days after TBI, respectively. ⋆ indicates p < 0.05.
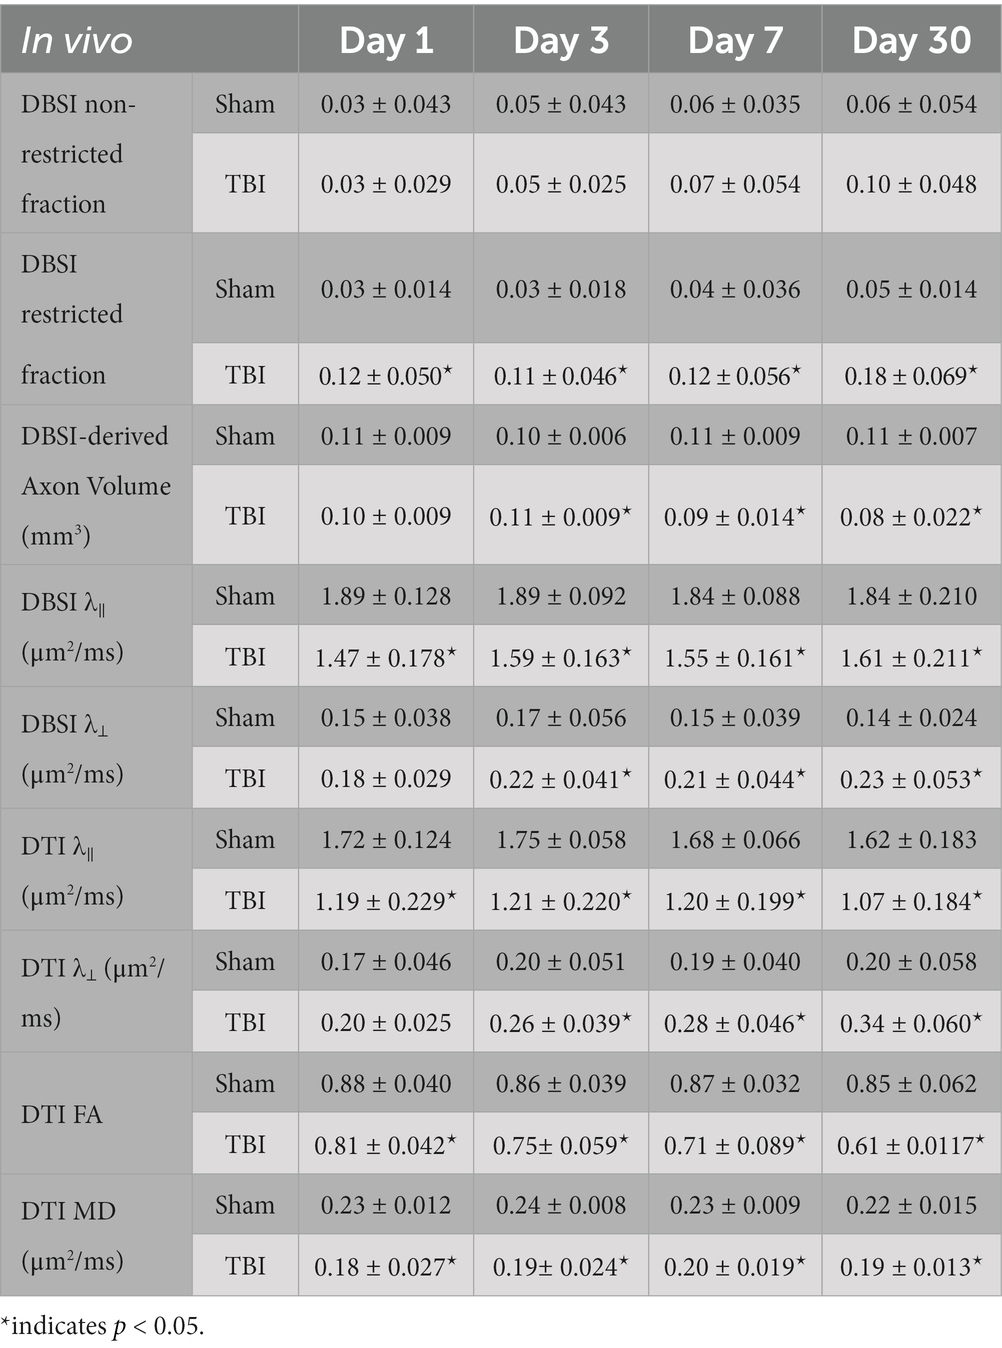
Table 1. Quantitative longitudinal DBSI/DTI results of sham and TBI optic nerves.
Representative DBSI metrics and VA from one sham mouse at 1, 3, 7, and 30 days after sham operation demonstrated that DBSI metrics describe normal nerve structure, consistent with normal VA (Figure 2). Comparing to sham optic nerves, the increased DBSI restricted fraction (Figures 3E–H), decreased fiber fraction (Figures 3I–L), and decreased DBSI-λ|| in the representative TBI mouse optic nerves at 1, 3, 7, and 30 days after injury, suggesting increased cellularity, reduced axonal density, and axonal injury. The increased DBSI-λ⊥ was shown at 3, 7, and 30 days after injury (Figures 3R–T), indicating myelin injury in the TBI optic nerves. In addition, the increased non-restricted fraction and optic nerve shrinkage were shown at 30 days after injury (Figures 3D,H,L,P,T), reflecting vasogenic edema and atrophy. Moreover, the volume of the optic nerve was 0.117 (left) and 0.151 (right) mm3 vs. 0.148 (left) and 0.172 (right) mm3 at 1 and 3 days after injury, respectively, while the fiber fraction remained unchanged (Figures 3I,J), suggesting cytotoxic edema of the optic nerves at the acute stage after TBI. The corresponding VA in TBI was inconsistent with optic nerve pathologies (Figure 3).
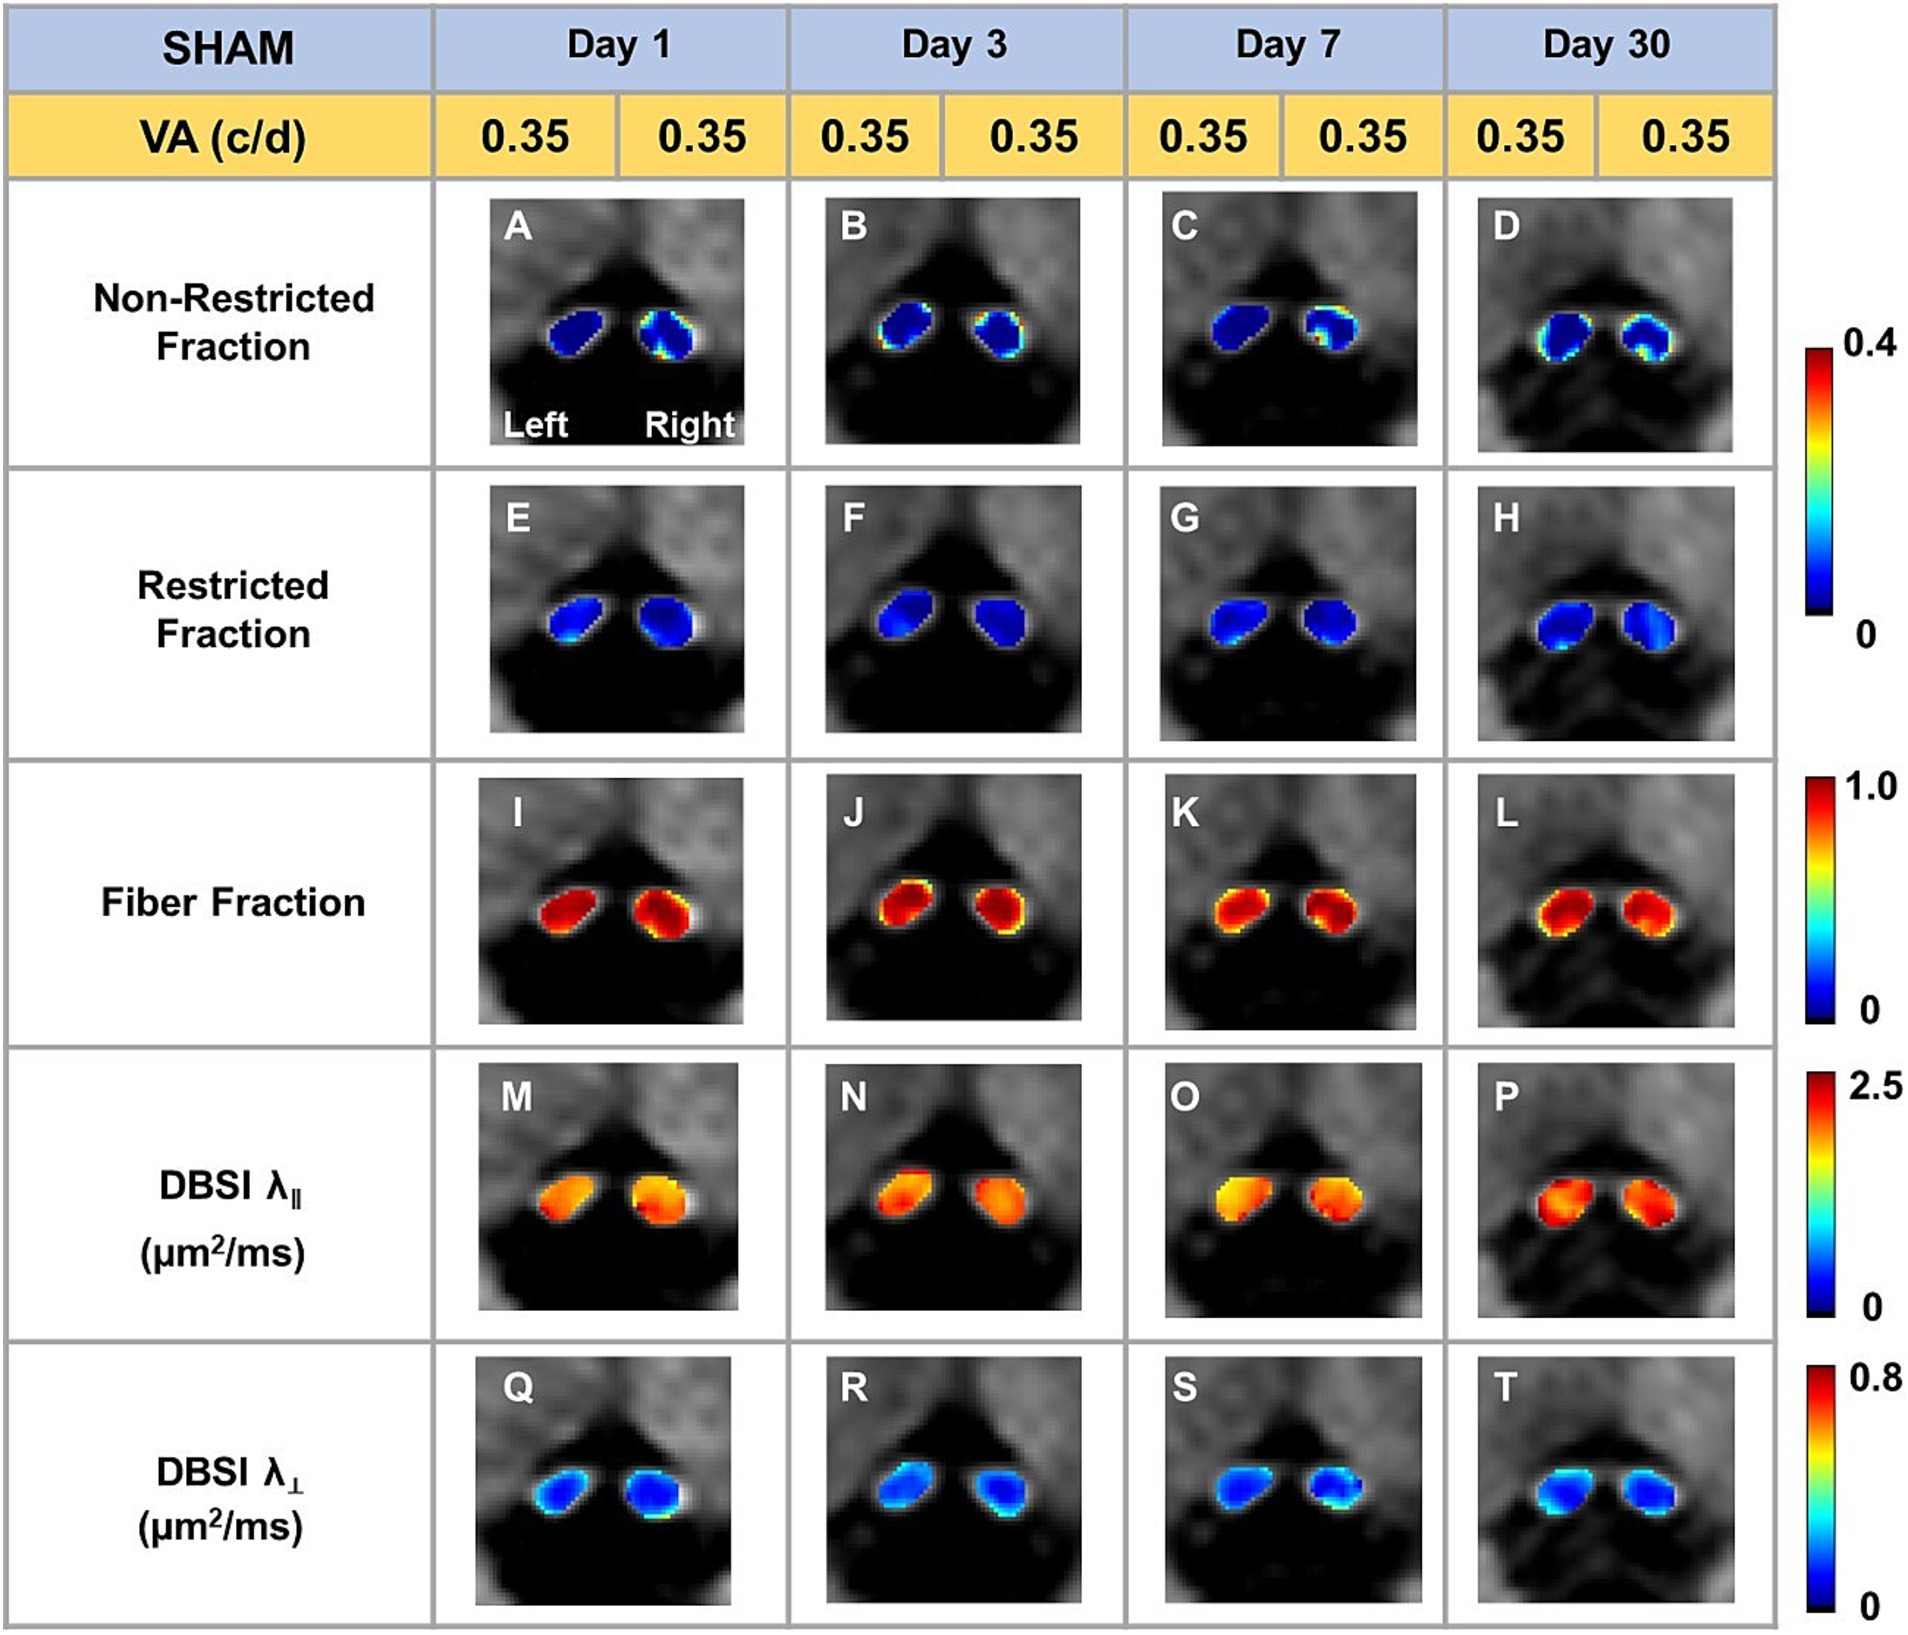
Figure 2. Representative DBSI metrics were overlaid on gray-scale diffusion-weighted images of sham optic nerves. DBSI non-restricted fraction (A–D), restricted fraction (E–H), Fiber fraction (I–L), DBSI axial diffusivity (λ‖) (M–P), and DBSI radial diffusivity (λ┴) (Q–T) were consistent at, 1, 3, 7, and 30 days after TBI. The corresponding VA was at the normal score all the time.
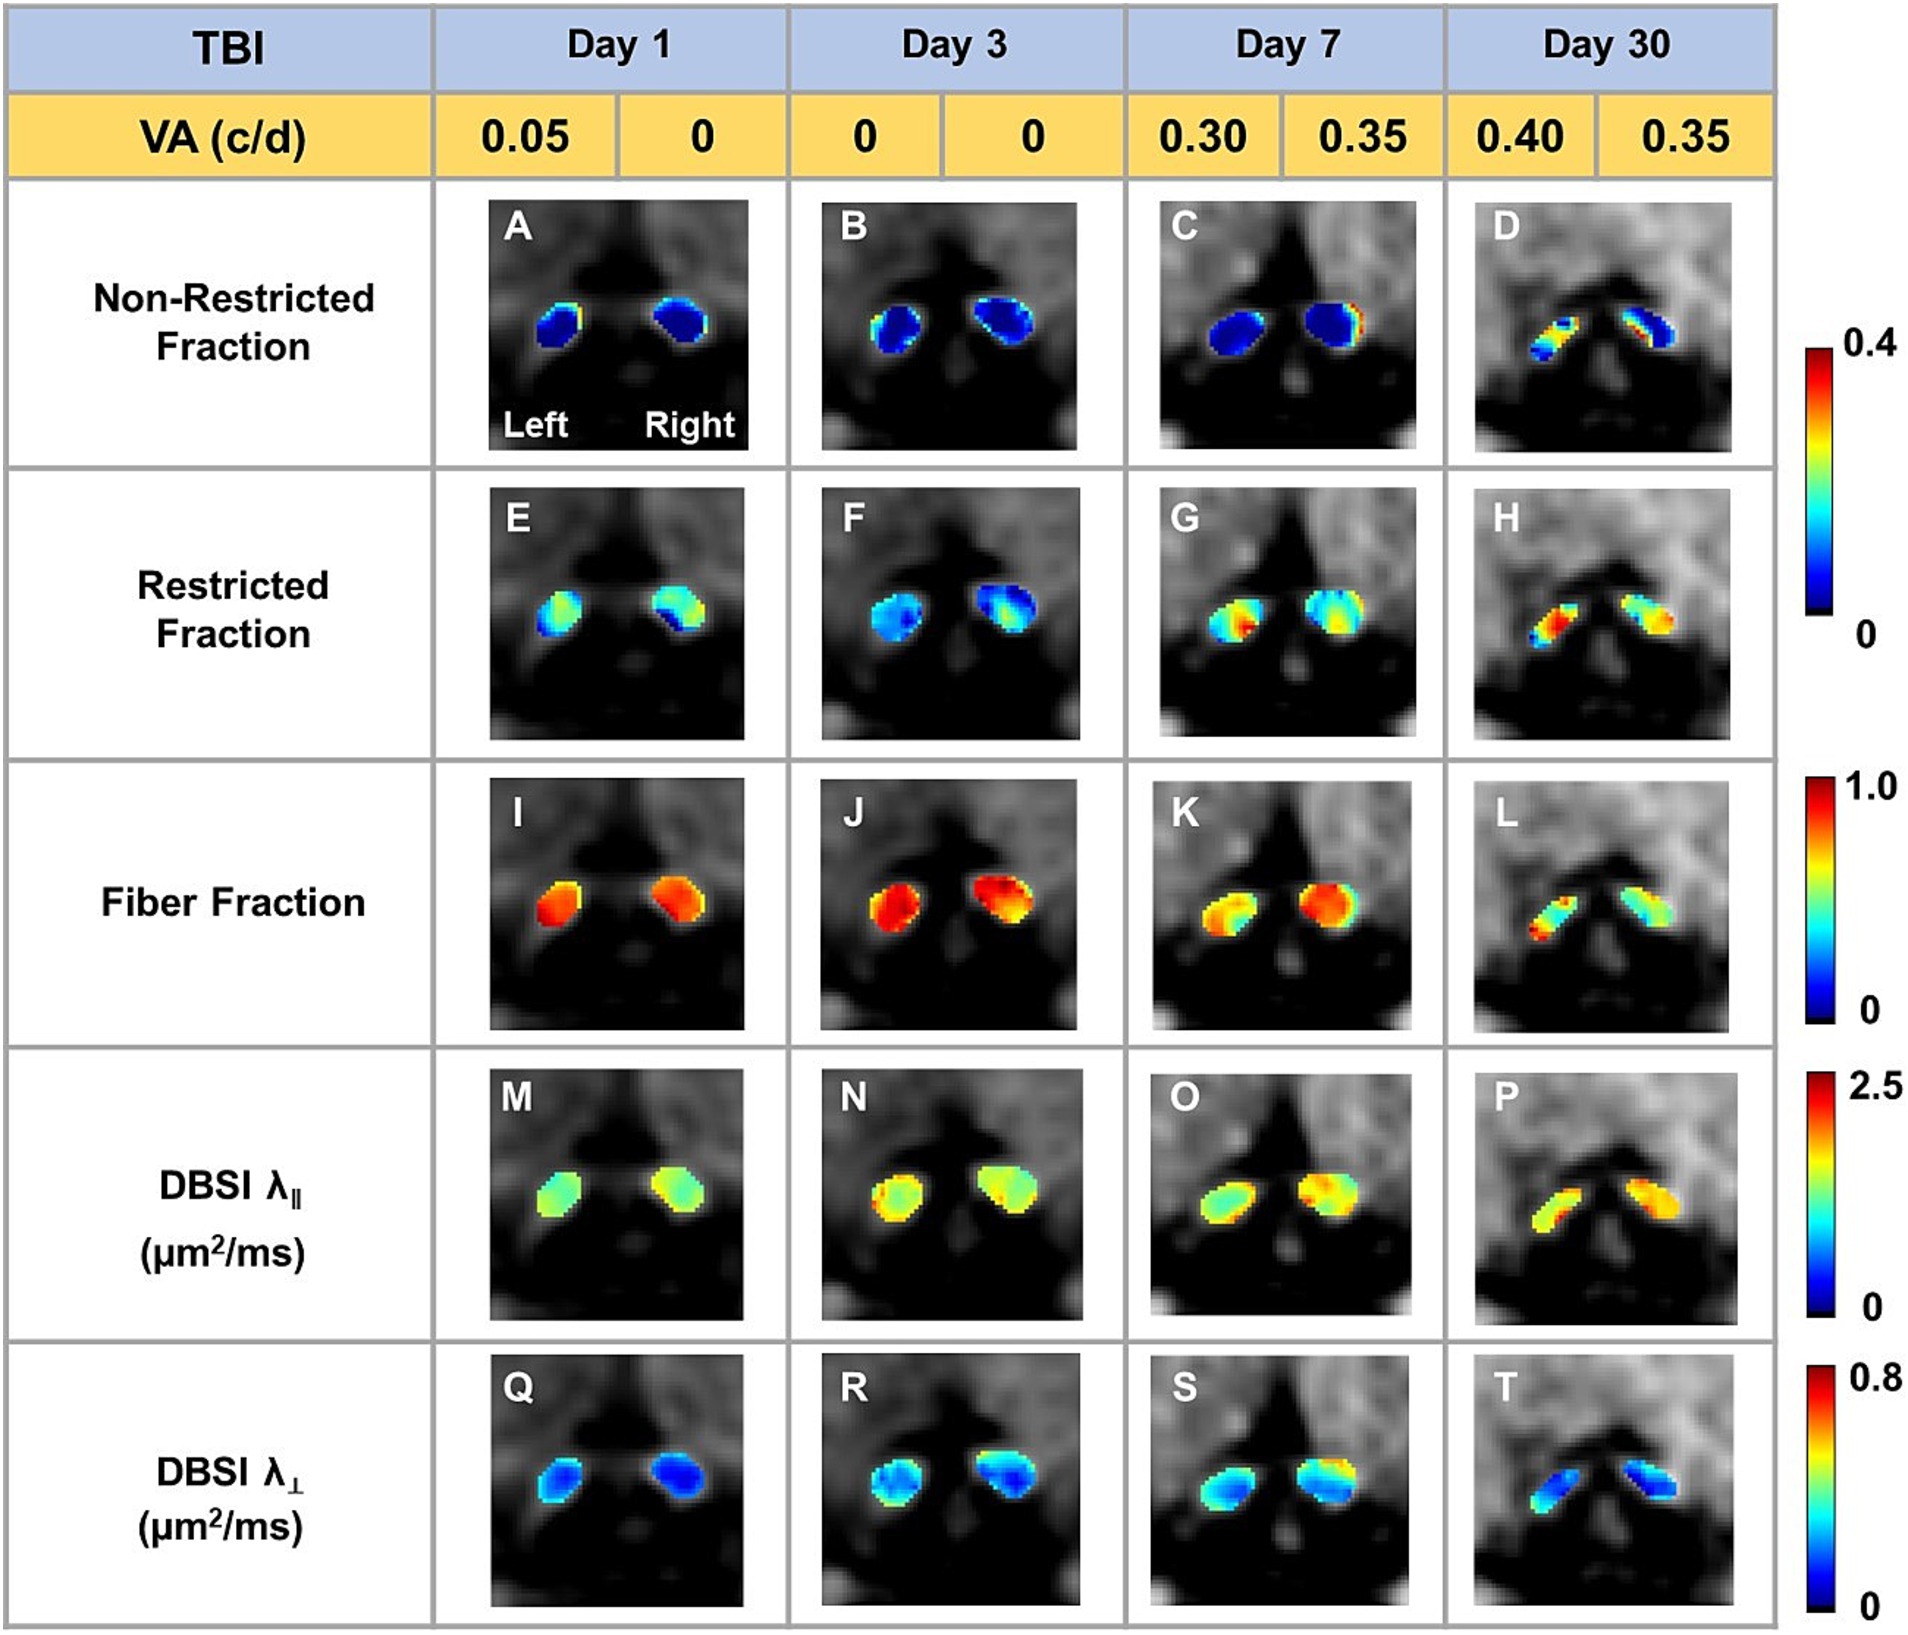
Figure 3. Representative DBSI metrics were overlaid on gray-scale diffusion-weighted images of TBI optic nerves. Compared to sham optic nerves in Figure 2, elevated DBSI restricted fraction (E–H), reduced fiber fraction (I–L), reduced DBSI axial diffusivity (λ‖) (M–P), and increased DBSI radial diffusivity (λ┴) (Q–T) were shown at 1, 3, 7, and 30 days after TBI. The corresponding VA was not consistent with DBSI metrics.
In vivo DBSI metrics reflected coexisting pathologies in the TON optic nerve
DBSI metrics could reflect coexisting pathologies in the optic nerve of TBI mice during the observation period up to 30 days after TBI. Comparing to sham mice, the DBSI non-restricted fraction (putative biomarker of vasogenic edema) was not significantly different from 1, 3, 7, and 30 days after TBI (Figure 4A; Table 1). DBSI restricted fraction (Figure 4B; Table 1) elevated, compared to sham mice, by 300% (0.12 ± 0.050 vs. 0.03 ± 0.014, TBI vs. sham, p < 0.05), 267% (0.11 ± 0.046 vs. 0.03 ± 0.018, TBI vs. sham, p < 0.05), 200% (0.12 ± 0.056 vs. 0.04 ± 0.036, TBI vs. sham, p < 0.05), and 260% (0.18 ± 0.069 vs. 0.05 ± 0.014, TBI vs. sham, p < 0.05) at 1, 3, 7, and 30 days, respectively, after TBI. DBSI-λ|| (Figure 4C; Table 1) decreased by 22% (1.89 ± 0.128 vs. 1.47 ± 0.178 μm2/ms, Sham vs. TBI, p < 0.05), 16% (1.89 ± 0.092 vs. 1.59 ± 0.638 μm2/ms, Sham vs. TBI, p < 0.05), 15% (1.84 ± 0.088 vs. 1.55 ± 0.161 μm2/ms, Sham vs. TBI, p < 0.05), and 13% (1.84 ± 0.210 vs. 1.61 ± 0.211 μm2/ms, Sham vs. TBI, p < 0.05) at 1, 3, 7, and 30 days, respectively, after TBI. DBSI-λ⊥ (Figure 4D; Table 1) increased by 16% (0.15 ± 0.038 vs. 0.18 ± 0.029 μm2/ms, Sham vs. TBI, p = 0.13), 30% (0.17 ± 0.056 vs. 0.22 ± 0.041 μm2/ms, Sham vs. TBI, p < 0.05), 29% (0.15 ± 0.039 vs. 0.21 ± 0.044 μm2/ms, Sham vs. TBI, p < 0.05), and 34% (0.14 ± 0.024 vs. 0.23 ± 0.053 μm2/ms, Sham vs. TBI, p < 0.05) at 1, 3, 7, and 30 days, respectively, after TBI.
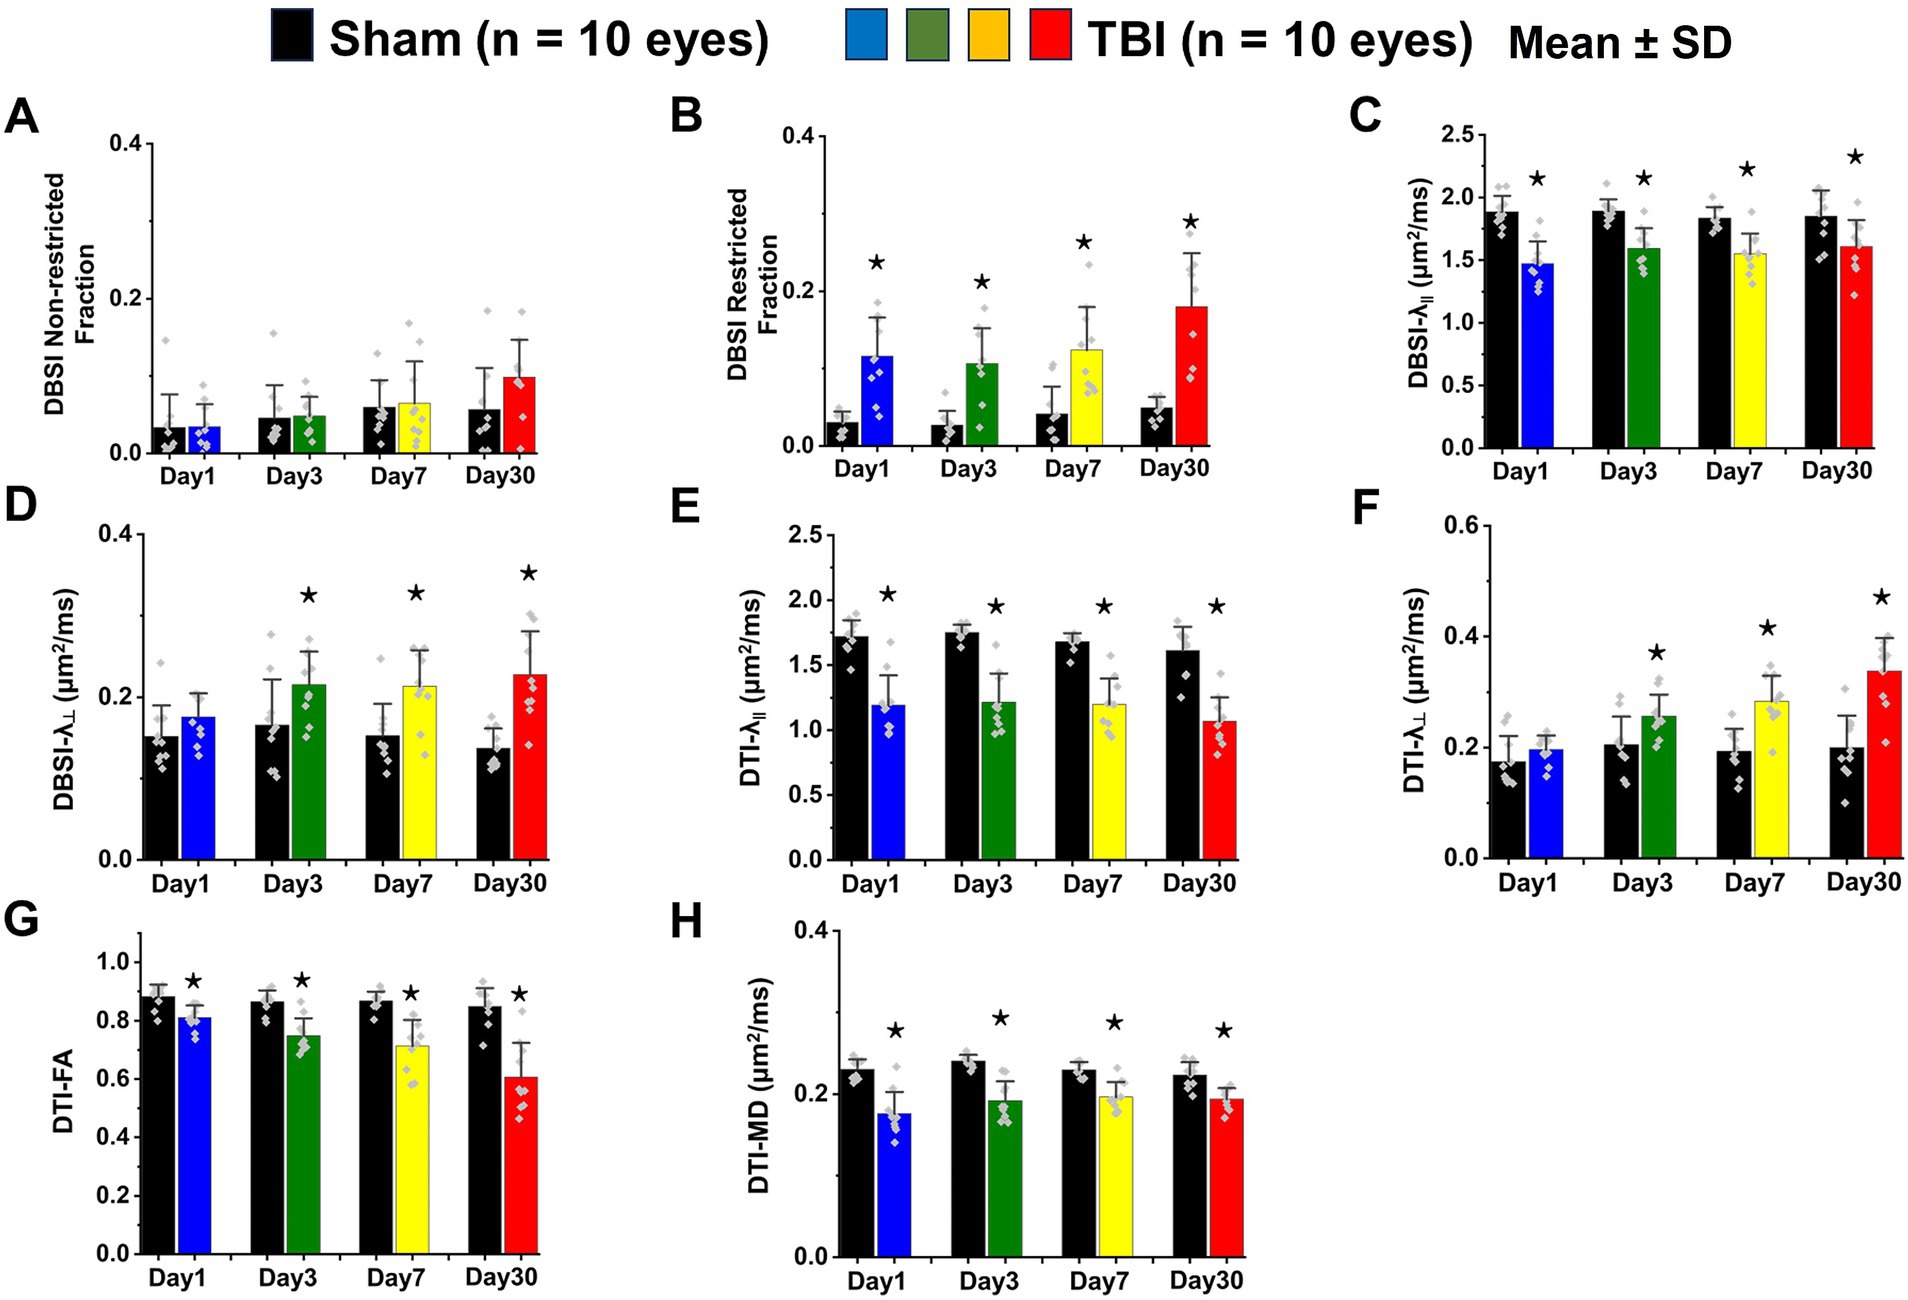
Figure 4. Bar graphs of DBSI (A–D) and DTI (E–H) metrics. ⋆ indicates p < 0.05.
In vivo DTI metrics were confounded by coexisting pathologies in the TON optic nerve
In contrast to DBSI metrics, DTI-λ|| (Figure 4E; Table 1) and DTI-λ⊥ (Figure 4F; Table 1) showed an exaggerated decrease and increase, respectively, suggesting DTI-derived axonal injury and myelin injury were confounded by inflammation and axonal loss. Comparing to the sham mouse optic nerve, reduced DTI fractional anisotropy (FA; Figure 4G; Table 1) and DTI mean diffusivity (MD, Figure 4H; Table 1) reflected the combined effects of axonal injury, inflammation, and axonal loss.
In vivo DBSI detected axonal loss in the TON optic nerve
DBSI-derived fiber fraction may reflect apparent fiber (i.e., axon) density that is confounded by dilution effects from other pathological components. DBSI-derived fiber fraction decreased by 7% (0.81 ± 0.060 vs. 0.76 ± 0.038, Sham vs. TBI, p < 0.05), 1% (0.77 ± 0.031 vs. 0.76 ± 0.024, Sham vs. TBI, p = 0.29), 6% (0.76 ± 0.044 vs. 0.72 ± 0.065, Sham vs. TBI, p = 0.10), and 20% (0.81 ± 0.082 vs. 0.61 ± 0.107, Sham vs. TBI, p < 0.05) at 1, 3, 7, and 30 days, respectively, after TBI. To quantify the extent of axons, a quantitative metric was developed to remove the dilution effects resulting from vasogenic edema and other complications. The metric was developed by multiplying DBSI anisotropic fiber fraction with optic nerve volume (assessed by conventional or diffusion-weighted MRI) resulting in a metric reflecting axon content with, i.e., axon (fiber) volume (Figure 5A). The nerve volume assessed using diffusion-weighted images with DW direction perpendicular to the fiber tract changed 4% (0.13 ± 0.011 vs. 0.14 ± 0.011 mm3, Sham vs. TBI, p = 0.03), 12% (0.13 ± 0.006 vs. 0.15 ± 0.011 mm3, Sham vs. TBI, p < 0.05), −17% (0.15 ± 0.011 vs. 0.12 ± 0.017 mm3, Sham vs. TBI, p < 0.05), and − 15% (0.14 ± 0.018 vs. 0.12 ± 0.016 mm3, Sham vs. TBI, p < 0.05) at 1, 3, 7, and 30 days, respectively, after TBI (Table 1). DBSI-derived axon volume decreased 2% (0.11 ± 0.009 vs. 0.10 ± 0.009 mm3, Sham vs. TBI, p = 0.58), −10% (0.10 ± 0.006 vs. 0.11 ± 0.009 mm3, Sham vs. TBI, p < 0.05), 21% (0.11 ± 0.009 vs. 0.09 ± 0.014 mm3, Sham vs. TBI, p < 0.05), and 30% (0.11 ± 0.007 vs. 0.08 ± 0.022 mm3, Sham vs. TBI, p < 0.05) at 1, 3, 7, and 30 days, respectively, after TBI (Figure 5B; Table 1).
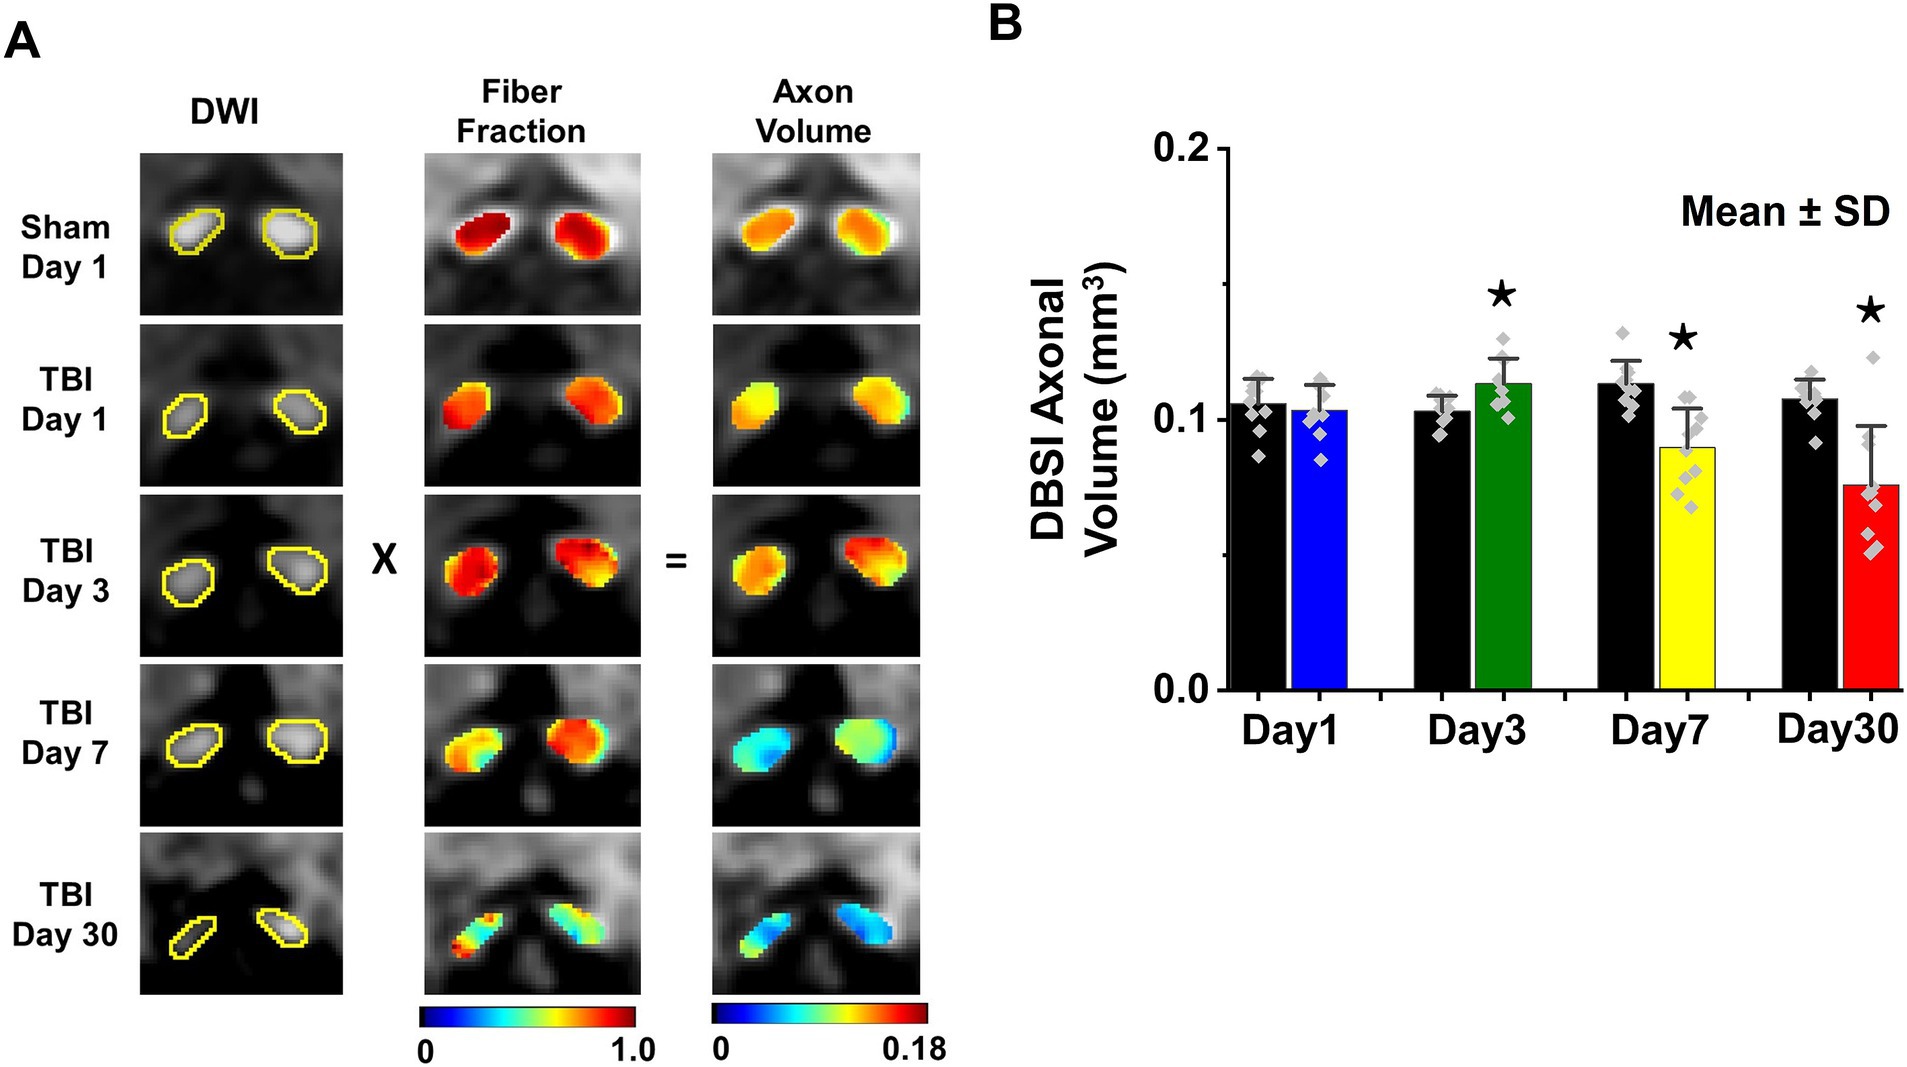
Figure 5. DBSI-axonal volume (unit in mm3) was derived by multiplying nerve volume (unit in mm3) with fiber fraction (A). DBSI-derived axonal volume of sham and TBI optic nerves from 1, 3, 7, and 30 (B). ⋆ indicates p < 0.05.
Optic nerve axonal injury at 3 days after TBI (ex vivo cohort)
DBSI non-restricted fraction was not significant differences between the sham and TBI group (Table 2). DBSI restricted fraction (Table 2) was elevated, compared to sham mice, by 47% (0.19 ± 0.055 vs. 0.10 ± 0.055, TBI vs. sham, p < 0.05). DBSI-λ|| (Table 2) decreased by 28% (0.74 ± 0.090 vs. 0.53 ± 0.070 μm2/ms, Sham vs. TBI, p < 0.05). DBSI-λ⊥ (Table 2) increased by 50% (0.06 ± 0.026 vs. 0.09 ± 0.017 μm2/ms, Sham vs. TBI, p < 0.05). DBSI fiber fraction decreased by 9% (0.68 ± 0.050 vs. 0.62 ± 0.096 μm2/ms, Sham vs. TBI, p = 0.06). The nerve volume assessed using diffusion-weighted images with DW direction perpendicular to the fiber tract changed by 10% (0.10 ± 0.012 vs. 0.09 ± 0.018 mm3, Sham vs. TBI, p = 0.13). DBSI-derived axon volume (Table 2) exhibited a 14% decrease (0.07 ± 0.009 vs. 0.06 ± 0.015 mm3, Sham vs. TBI, p < 0.05). Comparing DBSI metrics, DTI-λ|| (Table 2) and DTI-λ⊥ (Table 2) showed an exaggerated decrease and increase, respectively. Comparing to the sham mouse optic nerve, reduced DTI-FA (Table 2) and DTI-MD (Table 2) were observed.
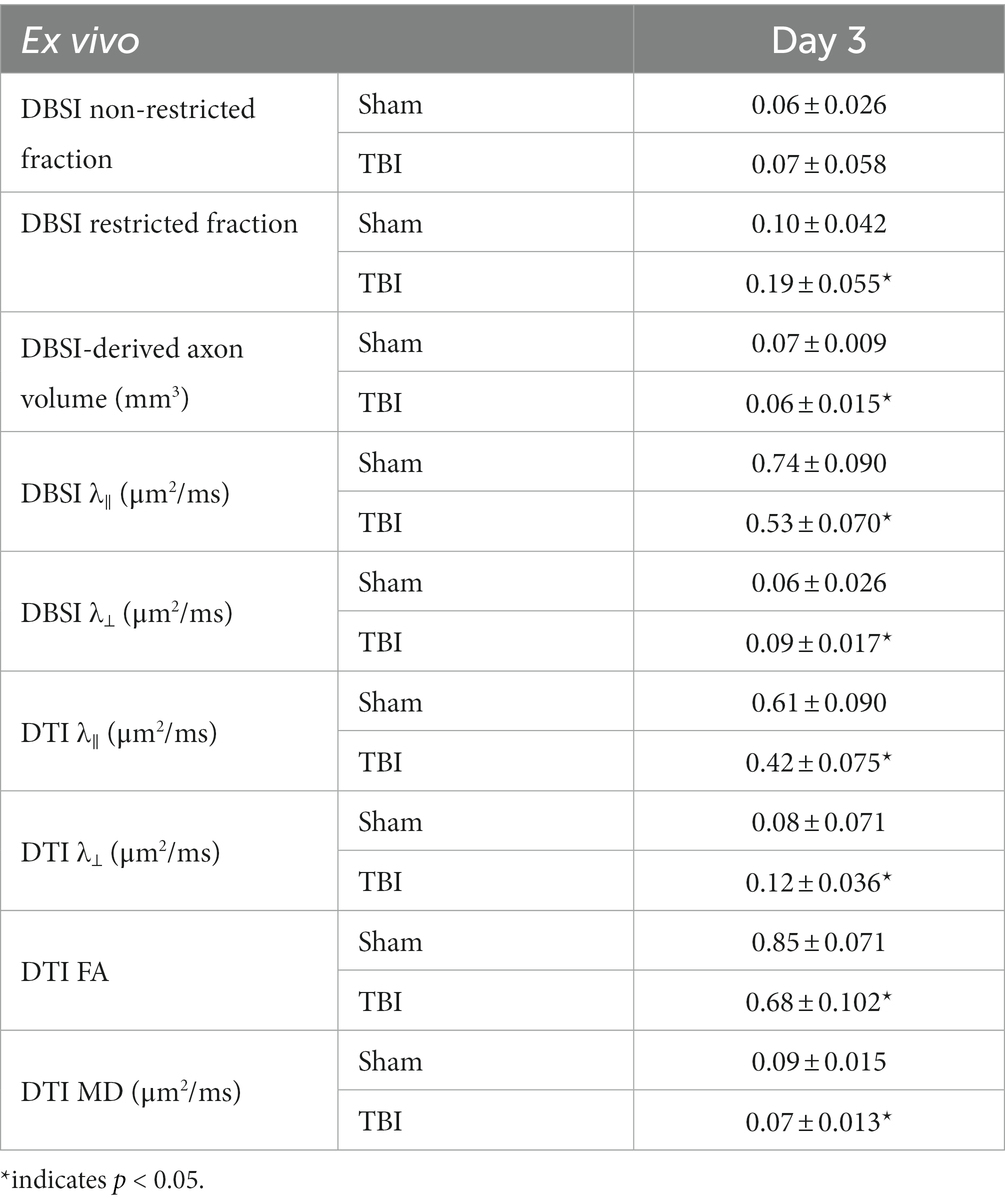
Table 2. Quantitative DBSI/DTI results of sham and TBI optic nerves at Day 3 (ex vivo cohort).
Representative IHC results revealed axonal loss (reduced SMI-312 area; Figures 6A,E), demyelination (reduced MBP area fraction; Figures 6B,F), severe axonal swelling (Figures 6E–G, white arrows), axonal injury (reduced SMI-31 density; Figures 6B,C,G) and increased cellularity (increased DAPI density; Figures 6D,H) in the optic nerves of the TBI mice. The correlations of DBSI-derived axon volume (Figure 6I, r2 = 0.4918, p = 0.0002), DBSI λ⊥ (Figure 6J, r2 = 0.4393, p = 0.0006), DBSI λ|| (Figure 6K, r2 = 0.4641, p = 0.0003), and DBSI restricted fraction (Figure 6L, r2 = 0.4823, p = 0.0002) were consistent with SMI-312 area, MBP area fraction, SMI-31 density, and DAPI density, suggesting that DBSI biomarkers reflect coexisting pathologies of the optic nerves in the TBI mice. The reduced SMI-312 area (0.064 ± 0.013 vs. 0.045 ± 0.001 mm2, Sham vs. TBI, p < 0.05; Table 3), and MBP area fraction (0.25 ± 0.03 vs. 0.18 ± 0.05, Sham vs. TBI, p < 0.05; Table 3), SMI-31 density (189,969 ± 24,492 vs. 108,139 ± 42,917 #/mm2, Sham vs. TBI, p < 0.05; Table 3) in the TBI group suggested axonal loss, demyelination, and axonal injury in their optic nerves. The increased DAPI density (690 ± 109 vs. 864 ± 129 #/mm2, Sham vs. TBI, p < 0.05; Table 3) in the TBI group suggested area increased cellularity in the TBI optic nerves.
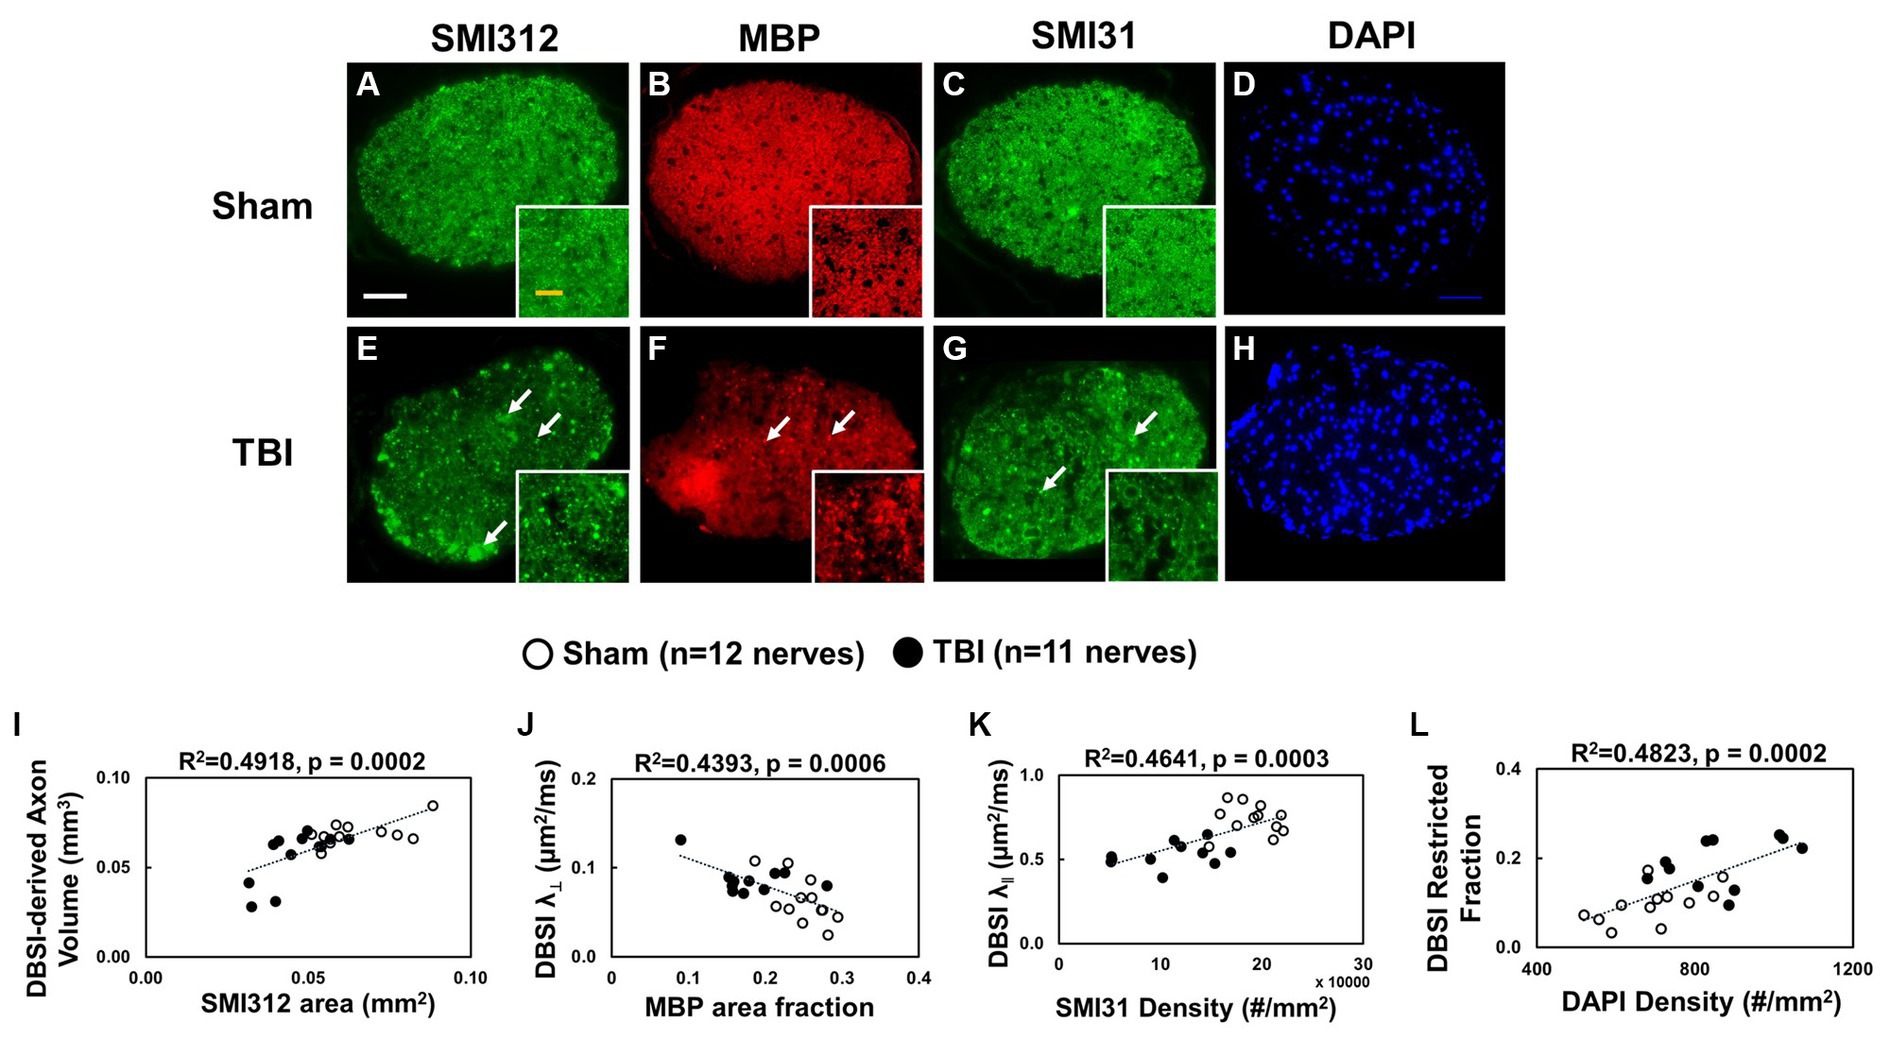
Figure 6. Representative 100× IHC from one sham (A–D) and one TBI (E–H) optic nerve (tissues were processed after ex vivo DBSI, 3 days after impact). The correlation of SMI-312 area, MBP area fraction, SMI-31 and DAPI density with DBSI-derived axon volume (I), DBSI λ⊥ (J), DBSI λ|| (K), and DBSI restricted isotropic fraction (L) suggested that DBSI was able to reflect the severity of axonal loss, myelination, axonal integrity, and inflammatory-increased cellularity, respectively. White scale bar: 50 μm; Yellow scale bar: 25 μm.
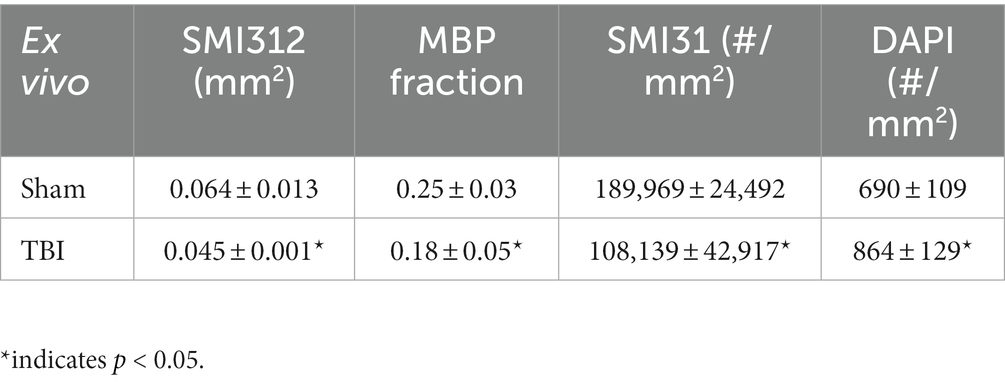
Table 3. Quantitative IHC results of sham and TBI optic nerves at Day 3 (ex vivo cohort).
IHC of optic nerves at the end of longitudinal MRI
Representative IHC of optic nerves revealed axonal loss (reduced SMI-312 intensity; Figures 7A,E), myelin injury (reduced MBP area fraction; Figures 7B,F), axonal injury (reduced SMI-31 density; Figures 7C,G), and increased cellularity (increased DAPI density; Figures 7D,H) in the optic nerves of TBI mice. The correlations of DBSI-derived axon volume (Figure 7I, r2 = 0.661, p = 0.0026), DBSI λ⊥ (Figure 7J, r2 = 0.3456, p = 0.07), DBSI λ|| (Figure 7K, r2 = 0.7065, p = 0.0023), and DBSI restricted fraction (Figure 7L, r2 = 0.5841, p = 0.01) was consistent with SMI-312 area, MBP intensity, SMI-31 density, and DAPI density, suggesting that DBSI reflected coexisting pathologies in the optic nerves of TBI mice. The reduced SMI-312 area (0.088 ± 0.015 vs. 0.053 ± 0.007 mm2, Sham vs. TBI, p < 0.05; Table 4), MBP area fraction (0.27 ± 0.04 vs. 0.20 ± 0.05, Sham vs. TBI, p < 0.05; Table 4), SMI-31 density (125,197 ± 37,281 vs. 74,336 ± 42,548 #/mm2, Sham vs. TBI, p < 0.05; Table 4) in the TBI group suggested axonal loss, demyelination, and axonal injury in the TBI optic nerves. The increased DAPI density (479 ± 92 vs. 745 ± 133 #/mm2, Sham vs. TBI, p < 0.05; Table 4) in the TBI group suggested increased cellularity in the TBI optic nerves.
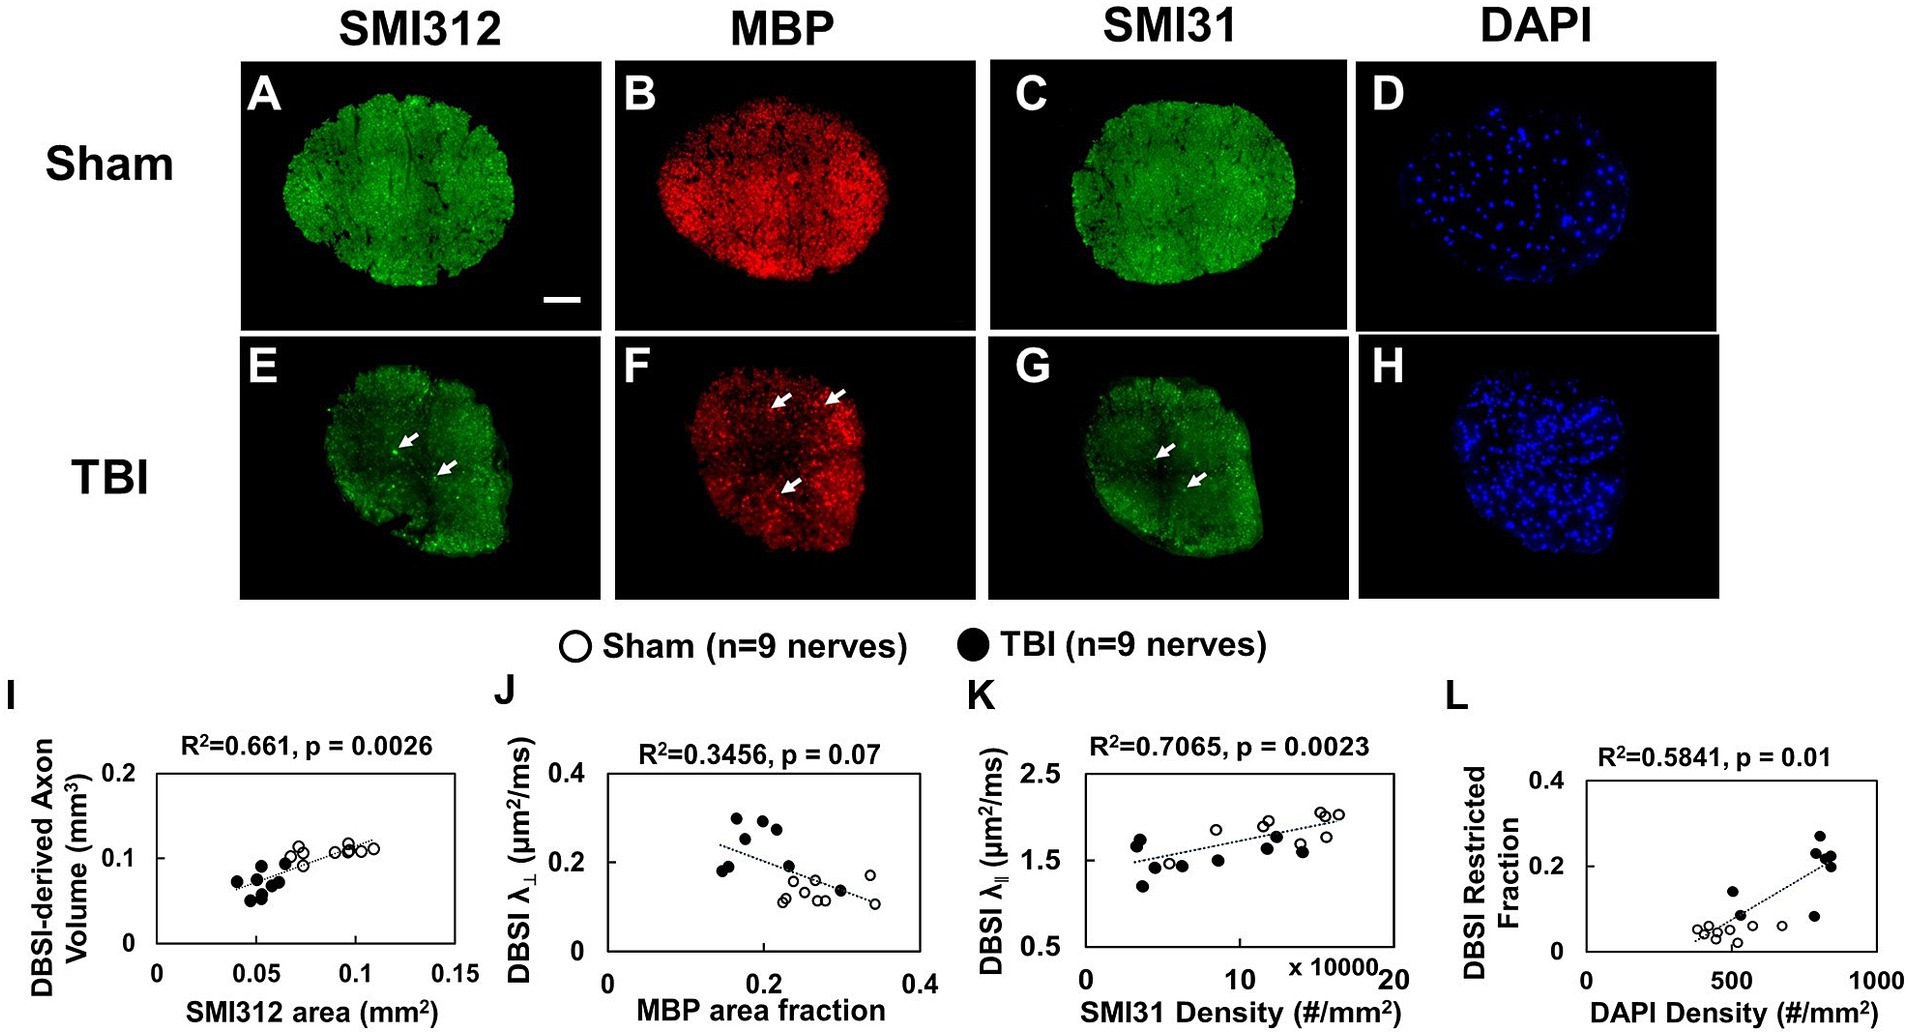
Figure 7. Representative 100× IHC from one sham (A–D) and one TBI (E–H) optic nerve (tissues were saved right after in vivo DBSI, 30 days after impact). The correlation of SMI-312 area, MBP area fraction, SMI-31 and DAPI density with DBSI-derived axon volume (I), DBSI λ⊥ (J), DBSI λ|| (K), and DBSI restricted isotropic fraction (L) suggested that DBSI was able to reflect the severity of axonal loss, myelination, axonal integrity, and inflammatory-increased cellularity, respectively. White scale bar: 50 μm.
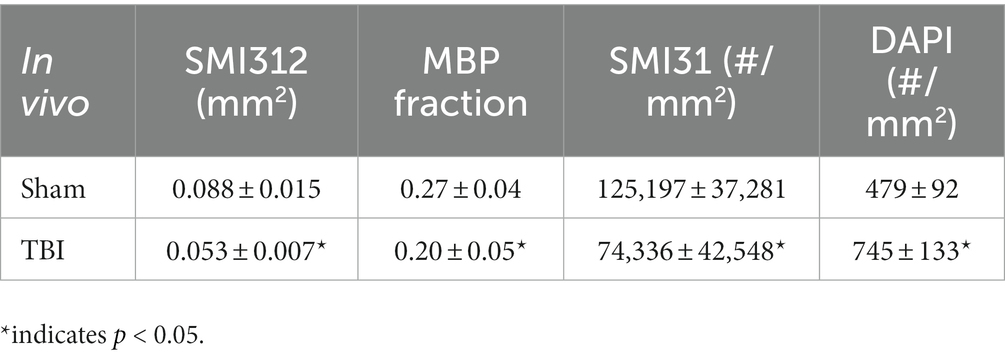
Table 4. Quantitative IHC results of sham and TBI optic nerves at Day 30 (in vivo cohort).
Discussion
In the current study, longitudinal DBSI and VA assessments were performed to investigate optic nerve pathology at 1, 3, 7, and 30 days after TBI. The results suggested that DBSI detected axonal injury, myelin damage, axonal loss, and inflammatory cellularity in the optic nerves of mice with TBI. The axonal loss identified in this study indicates that axonal volume is a valid marker of axonal extent. This study shows that optic nerve changes induced by TBI can be reproduced in the modCHIMERA TBI mice.
To evaluate the indirect TON, VA examinations were performed. Previously, it was identified that VA was sensitive to identify the onset of acute optic neuritis in myelin oligodendrocyte glycoprotein (MOG)-induced experimental autoimmune encephalomyelitis (EAE) mice (26, 28, 34, 35). In the current study, VA of TBI mice was unilaterally or bilaterally affected (Figure 1), but coexisting pathologies were detected in both optic nerves (Figure 3; Table 1). The current data indicated that VA does not reflect the optic nerve pathology of indirect TON in modCHIMERA mice. VA impairment in these mice may be confounded by psychophysical deficits in the modCHIMERA model as suggested by previously reported social and motor deficits (32), although the motor deficits are short lived.
Optic neuritis is one of the prominent and early pathologies of EAE mice (43). In acute EAE mice, change in VA was consistent with optic nerve pathology before chronic neurological deficits interfered with the optomotor reflex assessment (26, 34, 35). In indirect TON, a compensatory mechanism might play a role in the normalization of VA in the chronic stage (44). Therefore, VA may not be sensitive enough for visual function evaluation in indirect TON of TBI mouse models. For a more accurate assessment of visual function in indirect TON, behavioral independent assessments would improve the analyses.
Optic nerve pathologies in indirect TON include cytotoxic edema, vasogenic edema, and inflammation with activated microglia and macrophages (45, 46), followed by Wallerian degeneration (47, 48). Decreased apparent diffusion coefficient has been shown to associate with optic nerve injury and to be used as a surrogate marker of sight loss in unconscious patients (49). The decreased axial and mean diffusivity, believed to reflect damage of the axolemma and axonal swelling, has been proposed to serve as a biomarker of axonal damage and as a predictor of initial visual acuity and potential visual recovery in patients with TON (6). The current findings in TBI mice are consistent with TON patients exhibiting decreased DTI and DBSI derived axial diffusivity although the decreased axial diffusivity was seen in optic nerves of normal and impaired visual acuity in TBI mice. The results suggest the presence of subclinical optic nerve pathologies that may escape timely detection and treatment in TON.
A previous study has identified that DBSI derived axon volume detected axonal loss in the presence of white matter tract swelling (26). Another marker of axonal swelling is decreased radial diffusivity, as a result of axonal crowding (6). The clinical correlation of nerve swelling is questionable and seems unpredictable. Stahl et al. presented a 21-year-old male patient with right-sided visual loss after sustaining a penetrating orbital trauma, with minimal ocular trauma, from a metal rod (49). The MRI showed a unilateral reduction of the subarachnoid space of the optic nerve on the affected side, with a normal optic nerve diameter. The patient had permanent visual loss. Becker et al. presented a case whereby a patient suffered from a skull base fracture and had axonal injury of the optic nerve (21). DWI showed widening of the left optic nerve at the level of the orbital apex. This patient also had permanent visual loss.
DBSI quantitatively assesses axonal volume that is capable of quantifying the cytotoxic edema induced axonal swelling without being confounded by extra-fiber swelling resulting from inflammatory cell infiltration and vasogenic edema (assessed by non-restricted diffusion). This has been consistent with our previous study showing DBSI quantified axonal loss in the presence of nerve swelling in acute spinal cord injury (31). Thus, DBSI complements the conventional MRI measured cross-sectional areas of optic nerves and spinal cords by quantitatively distinguishing and assessing intra- and extra-fiber swelling.
In this study, it was identified that significantly increased nerve volume can be attributed to increased DBSI restricted fraction (extra-axonal swelling), increased DBSI axon volume (intra-axonal swelling), unchanged DBSI fiber fraction (axonal density), and unchanged DBSI non-restricted fraction (extra-axonal swelling, i.e., vasogenic edema) at 3 days after TBI. For the in vivo cohort, the acute nerve swelling can be partially attributed to the axonal swelling (i.e., cytotoxic edema) as reflected by the increased DBSI-derived axonal volume at 3 days after TBI. To further investigate the cytotoxic-edema impact of DBSI-derived axonal volume at 3 days after TBI, the ex vivo cohort was used to validate the correlation between DBSI and histology (Figure 7; Table 2) since histological fixation typically dehydrates and shrinks the processed tissue, masking vasogenic edema induced tissue swelling (50). The ex vivo brain samples underwent 24-h 4% PFA fixation, then transferred to the PBS solution prior to the DBSI scan. The ex vivo nerve volume at 3 days after TBI was examined for detecting cytotoxic edema with minimized contribution of vasogenic edema. DBSI-derived axonal volume at 3 days after TBI detected axonal loss consistent with the histological results (Figure 7).
Although DTI metrics may not reflect the true axonal and myelin pathologies due to confounds from coexisting pathologies such as inflammatory cell infiltration and vasogenic edema as previously reported (22–25). Current longitudinal diffusion-weighted MRI examination of optic nerves in mice revealed the same trend of both DTI and DBSI derived axial (λ||, decreased comparing with that of sham) and radial (λ⊥, increased comparing with that of sham) diffusivity in TBI mice, suggesting axonal and myelin injury. This is consistent with a previously reported retrospective investigation on the diffusion-weighted MRI signal intensity of the optic nerve in 29 patients with TON (51), where a hyperintense signal was seen in injured eyes. The current study revealed an increased DTI λ⊥ and DBSI λ⊥ from days 1 to 30 after TBI, suggesting myelin injury. This is consistent with the reduced MBP area fraction at 3 and 30 days after TBI. A similar extent of myelin injury was identified by Qiu et al., who examined NF-1 and MBP in a repetitive mild TBI mouse model 7-months after injury and found significantly reduced expression of both proteins when compared with sham animals (52). Khan et al. reported similar observations in their repetitive TBI mice model (53).
Although the current study did not examine the retinal pathology or a specific mechanism of TON along the entire optic nerve tract, the localized findings are encouraging and validate the utility of DBSI to detect and distinguish optic nerve injury types and components. The results demonstrated the presence of TON in modCHIMERA-induced TBI mice. Future studies may consider exploring the intersegmental changes of the optic nerve in a TBI animal model (6, 51) and variations in injury patterns using DBSI and resting state functional imaging (54, 55). The results from the current study should be interpreted under the context of the limitations of modCHIMERA-induced TBI in mice (32). This study may serve as a catalyst to encourage bench-to-bedside efforts to detect TON using a novel imaging modality and potentially reduce the burden of TON in patients with TBI.
Conclusion
DBSI and DTI suggested subclinical injury of indirect TON in TBI mice. However, DTI-derived metrics are confounded by coexisting pathologies, lacking the needed accuracy or specificity in detecting optic nerve injuries. DBSI is capable of detecting and distinguishing coexisting optic nerve pathologies. DBSI is potentially more effective for detecting the clinically silent optic nerve pathologies in indirect TON. Thus, DBSI may serve as an outcome measure of TON.
Data availability statement
The raw data supporting the conclusions of this article will be made available by the authors, without undue reservation.
Ethics statement
The animal study was approved by Washington University Institutional Animal Care and Use Committee. The study was conducted in accordance with the local legislation and institutional requirements.
Author contributions
H-CY: Data curation, Investigation, Validation, Visualization, Writing – original draft, Writing – review & editing. RL: Data curation, Validation, Writing – original draft, Writing – review & editing. AS: Data curation, Methodology, Writing – review & editing. MW: Data curation, Methodology, Writing – review & editing. TK: Writing – review & editing. S-KS: Conceptualization, Validation, Writing – original draft, Writing – review & editing, Funding acquisition. T-HL: Conceptualization, Data curation, Investigation, Methodology, Project administration, Resources, Software, Supervision, Validation, Visualization, Writing – original draft, Writing – review & editing.
Funding
The author(s) declare financial support was received for the research, authorship, and/or publication of this article. This study was supported in part by the grants from the National Institute of Health R01-NS047592, R01-NS121612, R01-NS116091, and U01-EY025500, National Multiple Sclerosis Society (NMSS) RG 4549A4/1, Missouri Spinal Cord Injury Research Program, and VA Merit Award 1I01BX005204-01.
Conflict of interest
The authors declare that the research was conducted in the absence of any commercial or financial relationships that could be construed as a potential conflict of interest.
Publisher’s note
All claims expressed in this article are solely those of the authors and do not necessarily represent those of their affiliated organizations, or those of the publisher, the editors and the reviewers. Any product that may be evaluated in this article, or claim that may be made by its manufacturer, is not guaranteed or endorsed by the publisher.
Supplementary material
The Supplementary material for this article can be found online at: https://www.frontiersin.org/articles/10.3389/fneur.2023.1269817/full#supplementary-material
Footnotes
References
1. Goodrich, GL, Flyg, HM, Kirby, JE, Chang, CY, and Martinsen, GL. Mechanisms of TBI and visual consequences in military and veteran populations. Optom Vis Sci. (2013) 90:105–12. doi: 10.1097/OPX.0b013e31827f15a1
2. Goodrich, GL, Kirby, J, Cockerham, G, Ingalla, SP, and Lew, HL. Visual function in patients of a polytrauma rehabilitation center: a descriptive study. J Rehabil Res Dev. (2007) 44:929–36. doi: 10.1682/JRRD.2007.01.0003
3. Chen, YJ, Liang, CM, Tai, MC, Chang, YH, Lin, TY, Chung, CH, et al. Longitudinal relationship between traumatic brain injury and the risk of incident optic neuropathy: a 10-year follow-up nationally representative Taiwan survey. Oncotarget. (2017) 8:86924–33. doi: 10.18632/oncotarget.21008
4. Houston, KE, Paschalis, EI, Angueira, DC, Bronstad, PM, Barrett, AM, and Iaccarino, MA. Restoration of vision after brain injury using magnet glasses. Am J Phys Med Rehabil. (2017) 96:e70–4. doi: 10.1097/PHM.0000000000000592
5. Chen, B, Zhang, H, Zhai, Q, Li, H, Wang, C, and Wang, Y. Traumatic optic neuropathy: a review of current studies. Neurosurg Rev. (2022) 45:1895–913. doi: 10.1007/s10143-021-01717-9
6. Bodanapally, UK, Kathirkamanathan, S, Geraymovych, E, Mirvis, SE, Choi, AY, McMillan, AB, et al. Diagnosis of traumatic optic neuropathy: application of diffusion tensor magnetic resonance imaging. J Neuroophthalmol. (2013) 33:128–33. doi: 10.1097/WNO.0b013e3182842553
7. Walsh, FB, Pathological-Clinical Correlations. I. Indirect trauma to the optic nerves and chiasm. II. Certain cerebral involvements associated with defective blood supply. Investig Ophthalmol. (1966) 5:433–49.
8. Mohan, K, Kecova, H, Hernandez-Merino, E, Kardon, RH, and Harper, MM. Retinal ganglion cell damage in an experimental rodent model of blast-mediated traumatic brain injury. Invest Ophthalmol Vis Sci. (2013) 54:3440–50. doi: 10.1167/iovs.12-11522
9. Tzekov, R, Quezada, A, Gautier, M, Biggins, D, Frances, C, Mouzon, B, et al. Repetitive mild traumatic brain injury causes optic nerve and retinal damage in a mouse model. J Neuropathol Exp Neurol. (2014) 73:345–61. doi: 10.1097/NEN.0000000000000059
10. Tyler, CW, and Likova, LT. Brain trauma impacts retinal processing: photoreceptor pathway interactions in traumatic light sensitivity. Doc Ophthalmol. (2022) 144:179–90. doi: 10.1007/s10633-022-09871-1
11. Kumaran, AM, Sundar, G, and Chye, LT. Traumatic optic neuropathy: a review. Craniomaxillofac Trauma Reconstr. (2015) 8:31–41. doi: 10.1055/s-0034-1393734
12. Yu-Wai-Man, P. Traumatic optic neuropathy-clinical features and management issues. Taiwan J Ophthalmol. (2015) 5:3–8. doi: 10.1016/j.tjo.2015.01.003
13. Burke, EG, Cansler, SM, and Evanson, NK. Indirect traumatic optic neuropathy: modeling optic nerve injury in the context of closed head trauma. Neural Regen Res. (2019) 14:593–4. doi: 10.4103/1673-5374.247463
14. Li, Y, Singman, E, McCulley, T, Wu, C, and Daphalapurkar, N. The biomechanics of indirect traumatic optic neuropathy using a computational head model with a Biofidelic orbit. Front Neurol. (2020) 11:346. doi: 10.3389/fneur.2020.00346
15. Chalela, JA. Traumatic optic neuropathy: the forgotten concussion. Mil Med. (2023) 188:398–400. doi: 10.1093/milmed/usac060
16. Singman, EL, Daphalapurkar, N, White, H, Nguyen, TD, Panghat, L, Chang, J, et al. Indirect traumatic optic neuropathy. Mil Med Res. (2016) 3:2. doi: 10.1186/s40779-016-0069-2
17. Klimo, KR, Stern-Green, EA, Shelton, E, Day, E, Jordan, L, Robich, M, et al. Structure and function of retinal ganglion cells in subjects with a history of repeated traumatic brain injury. Front Neurol. (2022) 13:963587. doi: 10.3389/fneur.2022.963587
18. Minakaran, N, de Carvalho, ER, Petzold, A, and Wong, SH. Optical coherence tomography (OCT) in neuro-ophthalmology. Eye. (2021) 35:17–32. doi: 10.1038/s41433-020-01288-x
19. Gala, F. Magnetic resonance imaging of optic nerve. Indian J Radiol Imaging. (2015) 25:421–38. doi: 10.4103/0971-3026.169462
20. Wang, Y, Wang, Q, Haldar, JP, Yeh, FC, Xie, M, Sun, P, et al. Quantification of increased cellularity during inflammatory demyelination. Brain. (2011) 134:3590–601. doi: 10.1093/brain/awr307
21. Becker, M, Masterson, K, Delavelle, J, Viallon, M, Vargas, MI, and Becker, CD. Imaging of the optic nerve. Eur J Radiol. (2010) 74:299–313. doi: 10.1016/j.ejrad.2009.09.029
22. Kuroiwa, T, Nagaoka, T, Ueki, M, Yamada, I, Miyasaka, N, Akimoto, H, et al. Correlations between the apparent diffusion coefficient, water content, and ultrastructure after induction of vasogenic brain edema in cats. J Neurosurg. (1999) 90:499–503. doi: 10.3171/jns.1999.90.3.0499
23. Pasternak, O, Sochen, N, Gur, Y, Intrator, N, and Assaf, Y. Free water elimination and mapping from diffusion MRI. Magn Reson Med. (2009) 62:717–30. doi: 10.1002/mrm.22055
24. Naismith, RT, Xu, J, Tutlam, NT, Scully, PT, Trinkaus, K, Snyder, AZ, et al. Increased diffusivity in acute multiple sclerosis lesions predicts risk of black hole. Neurology. (2010) 74:1694–701. doi: 10.1212/WNL.0b013e3181e042c4
25. Anderson, AW, Xie, J, Pizzonia, J, Bronen, RA, Spencer, DD, and Gore, JC. Effects of cell volume fraction changes on apparent diffusion in human cells. Magn Reson Imaging. (2000) 18:689–95. doi: 10.1016/S0730-725X(00)00147-8
26. Lin, TH, Chiang, CW, Perez-Torres, CJ, Sun, P, Wallendorf, M, Schmidt, RE, et al. Diffusion MRI quantifies early axonal loss in the presence of nerve swelling. J Neuroinflammation. (2017) 14:78. doi: 10.1186/s12974-017-0852-3
27. Lin, TH, Zhan, J, Song, C, Wallendorf, M, Sun, P, Niu, X, et al. Diffusion basis Spectrum imaging detects axonal loss after transient dexamethasone treatment in optic neuritis mice. Front Neurosci. (2020) 14:592063. doi: 10.3389/fnins.2020.592063
28. Yang, R, Lin, TH, Zhan, J, Lai, S, Song, C, Sun, P, et al. Diffusion basis spectrum imaging measures anti-inflammatory and neuroprotective effects of fingolimod on murine optic neuritis. Neuroimage Clin. (2021) 31:102732. doi: 10.1016/j.nicl.2021.102732
29. Murphy, RK, Sun, P, Xu, J, Wang, Y, Sullivan, S, Gamble, P, et al. Magnetic resonance imaging biomarker of axon loss reflects cervical Spondylotic myelopathy severity. Spine. (2016) 41:751–6. doi: 10.1097/BRS.0000000000001337
30. Zhang, JK, Jayasekera, D, Song, C, Greenberg, JK, Javeed, S, Dibble, CF, et al. Diffusion basis Spectrum imaging provides insights into cervical Spondylotic myelopathy pathology. Neurosurgery. (2023) 92:102–9. doi: 10.1227/neu.0000000000002183
31. Lin, TH, Sun, P, Hallman, M, Hwang, FC, Wallendorf, M, Ray, WZ, et al. Noninvasive quantification of axonal loss in the presence of tissue swelling in traumatic spinal cord injury mice. J Neurotrauma. (2019) 36:2308–15. doi: 10.1089/neu.2018.6016
32. Sauerbeck, AD, Fanizzi, C, Kim, JH, Gangolli, M, Bayly, PV, Wellington, CL, et al. modCHIMERA: a novel murine closed-head model of moderate traumatic brain injury. Sci Rep. (2018) 8:7677. doi: 10.1038/s41598-018-25737-6
33. Garber, JCB, Bielitzki, RW, Clayton, JT, Donovan, LA, Hendriksen, JC, Kohn, CF, et al. Guide for the care and use of laboratory animals. Washington (DC). The National Academies Press (2011).
34. Lin, TH, Kim, JH, Perez-Torres, C, Chiang, CW, Trinkaus, K, Cross, AH, et al. Axonal transport rate decreased at the onset of optic neuritis in EAE mice. NeuroImage. (2014) 100:244–53. doi: 10.1016/j.neuroimage.2014.06.009
35. Lin, TH, Spees, WM, Chiang, CW, Trinkaus, K, Cross, AH, and Song, SK. Diffusion fMRI detects white-matter dysfunction in mice with acute optic neuritis. Neurobiol Dis. (2014) 67:1–8. doi: 10.1016/j.nbd.2014.02.007
36. Garbow, JR, McIntosh, C, and Conradi, MS. Actively decoupled transmit-receive coil-pair for mouse brain MRI. Concepts Magn Reson Part B Magn Reson Eng. (2008) 33B:252–9. doi: 10.1002/cmr.b.20124
37. Tu, TW, Kim, JH, Wang, J, and Song, SK. Full tensor diffusion imaging is not required to assess the white-matter integrity in mouse contusion spinal cord injury. J Neurotrauma. (2010) 27:253–62. doi: 10.1089/neu.2009.1026
38. Haldar, JP, Wedeen, VJ, Nezamzadeh, M, Dai, GP, Weiner, MW, Schuff, N, et al. Improved diffusion imaging through SNR-enhancing joint reconstruction. Magn Reson Med. (2013) 69:277–89. doi: 10.1002/mrm.24229
39. Wang, Y, Sun, P, Wang, Q, Trinkaus, K, Schmidt, RE, Naismith, RT, et al. Differentiation and quantification of inflammation, demyelination and axon injury or loss in multiple sclerosis. Brain. (2015) 138:1223–38. doi: 10.1093/brain/awv046
40. Chiang, CW, Wang, Y, Sun, P, Lin, TH, Trinkaus, K, Cross, AH, et al. Quantifying white matter tract diffusion parameters in the presence of increased extra-fiber cellularity and vasogenic edema. NeuroImage. (2014) 101:310–9. doi: 10.1016/j.neuroimage.2014.06.064
41. Wang, X, Cusick, MF, Wang, Y, Sun, P, Libbey, JE, Trinkaus, K, et al. Diffusion basis spectrum imaging detects and distinguishes coexisting subclinical inflammation, demyelination and axonal injury in experimental autoimmune encephalomyelitis mice. NMR Biomed. (2014) 27:843–52. doi: 10.1002/nbm.3129
42. Blewitt, ES, Pogmore, T, and Talbot, IC. Double embedding in agar paraffin wax as an aid to orientation of mucosal biopsies. J Clin Pathol. (1982) 35:365–5. doi: 10.1136/jcp.35.3.365-b
43. Redler, Y, and Levy, M. Rodent models of optic neuritis. Front Neurol. (2020) 11:580951. doi: 10.3389/fneur.2020.580951
44. Hylin, MJ, Kerr, AL, and Holden, R. Understanding the mechanisms of recovery and/or compensation following injury. Neural Plast. (2017) 2017:7125057. doi: 10.1155/2017/7125057
45. Corps, KN, Roth, TL, and McGavern, DB. Inflammation and neuroprotection in traumatic brain injury. JAMA Neurol. (2015) 72:355–62. doi: 10.1001/jamaneurol.2014.3558
46. Unterberg, AW, Stover, J, Kress, B, and Kiening, KL. Edema and brain trauma. Neuroscience. (2004) 129:1021–9. doi: 10.1016/j.neuroscience.2004.06.046
47. Maxwell, WL, Bartlett, E, and Morgan, H. Wallerian degeneration in the optic nerve stretch-injury model of traumatic brain injury: a stereological analysis. J Neurotrauma. (2015) 32:780–90. doi: 10.1089/neu.2014.3369
48. Au, NPB, and Ma, CHE. Neuroinflammation, microglia and implications for retinal ganglion cell survival and axon regeneration in traumatic optic neuropathy. Front Immunol. (2022) 13:860070. doi: 10.3389/fimmu.2022.860070
49. Stahl, A, and Hosten, N. Trauma to the eye: diffusion restriction on MRI as a surrogate marker for blindness. Tomography. (2023) 9:413–9. doi: 10.3390/tomography9010033
50. Wehrl, HF, Bezrukov, I, Wiehr, S, Lehnhoff, M, Fuchs, K, Mannheim, JG, et al. Assessment of murine brain tissue shrinkage caused by different histological fixatives using magnetic resonance and computed tomography imaging. Histol Histopathol. (2015) 30:601–13. doi: 10.14670/HH-30.601
51. Bodanapally, UK, Shanmuganathan, K, Shin, RK, Dreizin, D, Katzman, L, Reddy, RP, et al. Hyperintense optic nerve due to diffusion restriction: diffusion-weighted imaging in traumatic optic neuropathy. AJNR Am J Neuroradiol. (2015) 36:1536–41. doi: 10.3174/ajnr.A4290
52. Qiu, J, Boucher, M, Conley, G, Li, Y, Zhang, J, Morriss, N, et al. Traumatic brain injury-related optic nerve damage. J Neuropathol Exp Neurol. (2022) 81:344–55. doi: 10.1093/jnen/nlac018
53. Khan, RS, Ross, AG, Aravand, P, Dine, K, Selzer, EB, and Shindler, KS. RGC and vision loss from traumatic optic neuropathy induced by repetitive closed head trauma is dependent on timing and force of impact. Transl Vis Sci Technol. (2021) 10:8. doi: 10.1167/tvst.10.1.8
54. Sujanthan, S, Shmuel, A, and Mendola, JD. Visually driven functional MRI techniques for characterization of optic neuropathy. Front Hum Neurosci. (2022) 16:943603. doi: 10.3389/fnhum.2022.943603
Keywords: traumatic optic neuropathy, traumatic brain injury, diffusion MRI, diffusion basis spectrum imaging, axonal loss, inflammation, modCHIMERA
Citation: Yang H-C, Lavadi RS, Sauerbeck AD, Wallendorf M, Kummer TT, Song S-K and Lin T-H (2023) Diffusion basis spectrum imaging detects subclinical traumatic optic neuropathy in a closed-head impact mouse model of traumatic brain injury. Front. Neurol. 14:1269817. doi: 10.3389/fneur.2023.1269817
Edited by:
Giuseppe Lazzarino, University of Catania, ItalyReviewed by:
Athanasios Alexandris, Johns Hopkins University, United StatesOmar Narvaez, University of Eastern Finland, Finland
Copyright © 2023 Yang, Lavadi, Sauerbeck, Wallendorf, Kummer, Song and Lin. This is an open-access article distributed under the terms of the Creative Commons Attribution License (CC BY). The use, distribution or reproduction in other forums is permitted, provided the original author(s) and the copyright owner(s) are credited and that the original publication in this journal is cited, in accordance with accepted academic practice. No use, distribution or reproduction is permitted which does not comply with these terms.
*Correspondence: Tsen-Hsuan Lin, tsenhsuanlin@wustl.edu
†Present addresses: Hsin-Chieh Yang, Chemistry, Washington University in St. Louis, St. Louis, MO, United States; Tsen-Hsuan Lin, Bioimaging, GSK, Collegeville, PA, United States