 Ivo J. Lutke Schipholt1,2*†
 Gwendolyne G. M. Scholten-Peeters1,†
 Meghan A. Koop1,†
 Michel W. Coppieters1,3,†
 Ronald Boellaard4,†
 Elsmarieke van de Giessen4,5,†Bastiaan C. ter Meulen6,7,†
 Marieke Coenen8,†Carmen Vleggeert-Lankamp9,†Paul R. Depaauw10Bart N. M. van Berckel3,†
 Adriaan A. Lammerstma4,11,†
 Maqsood Yaqub3,†
- 1Department of Human Movement Sciences, Faculty of Behavioural and Movement Sciences, Amsterdam Movement Sciences - Program Musculoskeletal Health, Vrije Universiteit Amsterdam, Amsterdam, Netherlands
- 2Laboratory Medical Immunology, Department of Clinical Chemistry, Amsterdam University Medical Centre, Location VUmc, Amsterdam, Netherlands
- 3School of Health Sciences and Social Work, Griffith University, Brisbane/Gold Coast, QLD, Australia
- 4Department of Radiology and Nuclear Medicine, Vrije Universiteit Amsterdam, Amsterdam University Medical Centre, Location VUmc, Amsterdam, Netherlands
- 5Department of Radiology & Nuclear Medicine, Amsterdam UMC, Location University of Amsterdam, Amsterdam, Netherlands
- 6Department of Neurology, OLVG Amsterdam, Amsterdam, Netherlands
- 7Department of Epidemiology and Biostatistics Amsterdam Movement Sciences Research Institute, Amsterdam UMC, Vrije Universiteit Amsterdam, Amsterdam, Netherlands
- 8Department of Human Genetics, Radboud Institute for Health Sciences, Radboud University Medical Center, Nijmegen, Netherlands
- 9Department of Neurosurgery, Leiden University Medical Center, Leiden, Netherlands
- 10Department of Neurosurgery, Elisabeth-TweeSteden Ziekenhuis, Tilburg, Netherlands
- 11Department of Nuclear Medicine and Molecular Imaging, University of Groningen, University Medical Center Groningen, Groningen, Netherlands
Background: Animal models of nerve compression have revealed neuroinflammation not only at the entrapment site, but also remotely at the spinal cord. However, there is limited information on the presence of neuroinflammation in human compression neuropathies. The objectives of this study were to: (1) assess which tracer kinetic model most optimally quantified [11C]DPA713 uptake in the spinal cord and neuroforamina in patients with painful cervical radiculopathy, (2) evaluate the performance of linearized methods (e.g., Logan) and simplified (e.g., standardized uptake value - SUV) methods, and (3) assess the test-retest reliability of these methods. Microglia activation associated with neuroinflammation was quantified using positron emission tomography (PET) with the radiotracer [11C]DPA713, targeting the 18 kDa translocator protein (TSPO). The Akaike information criterion, visual inspection of the fits and number of outliers were used to select the optimal kinetic model. As unaffected tissue, the spinal cord and neuroforamina three cervical levels above the affected target tissue was used.
Results: The single tissue (1T2k) compartment model was the preferred model to describe [11C]DPA713 kinetics at the spinal cord and neuroforamina. Higher levels of 1T2k VT were observed in the affected neuroforamina and spinal cord compared with corresponding unaffected tissues. Logan VT (≥0.73) showed high correlation with 1T2k VT at both locations. Of the simplified methods, neuroforamina and spinal cord SUV normalized for the metabolite corrected plasma (TBR-PP) exhibited high correlations with 1T2k VT (r ≥ 0.84). Test-retest reliability varied between fair to excellent.
Conclusions: These results indicate that a 1T2k model with metabolite corrected image derived input function can be used to describe the kinetics of [11C]DPA713 in the spinal cord and neuroforamina in humans. 1T2k VT or Logan VT can be used as binding metric, while TBR-PP is the recommended choice among simplified models.
Introduction
Following peripheral nerve compression, neuroimmune activation develops in the dorsal root ganglia (DRG) and spinal cord (1). These neuroimmune responses are thought to play an important role in the pathogenesis of painful compression neuropathies, including painful lumbar and cervical radiculopathy (2–4). The further development and refinement of clinical methods to evaluate neuroimmune activation in vivo in the DRG and spinal cord would advance research in painful compression neuropathies in humans (2, 5).
Microglia are considered the resident macrophages of the nervous system, responsible for phagocytosis of cellular debris, antigen presentation and a variety of other functions, such as cytokine signaling (6, 7). Activated microglia and astrocytes release inflammatory mediators such as reactive oxygen species (ROS), cytokines, and neurothrophic factors that activate or sensitize the nociceptive circuitry (6, 7). Microglia express translocator protein (TSPO), an intracellular protein formerly known as the peripheral benzodiazepine receptor, which becomes overexpressed under inflammatory conditions (8, 9). Using molecular imaging techniques, such as positron emission tomography (PET), it is possible to quantify TSPO levels in vivo (10).
[11C]DPA713 is a second generation TSPO radioligand, which shows higher specific binding and better kinetic properties than the more widely used first generation TSPO ligand (R)-[11C]PK11195 (11–13). Nevertheless, there are challenges specific to TSPO imaging, such as polymorphisms of the TSPO gene, cellular heterogeneity of TSPO in nervous tissue and TSPO distribution in blood and plasma (5, 14). To overcome these issues, only high-affinity and mixed-affinity binders can be assessed and an input function is necessary for kinetic modelling (5). To obtain the input function, in general, arterial cannulation is required. However, when a region devoid of specific binding exists, an image derived input function is an attractive non-invasive alternative to arterial sampling (15, 16). In most cervical radiculopathies, the lower cervical levels are affected. As a result, both ascending aorta and affected nerve roots can be in the same field-of-view using a short axial field-of-view PET/CT scanner (17).
Although the optimal tracer kinetic model for quantification of [11C]DPA713 uptake in the brain has been described, this still is an open question for the spinal cord and neuroforamina. In addition, information on the test-retest reliability of [11C]DPA713 for the spinal cord and neuroforamina has not been published yet, limiting the interpretation of research findings. Therefore, the aims of the present study were (1) to evaluate a tracer kinetic models with image derived input function to quantify [11C]DPA713 uptake in the spinal cord and neuroforamina in patients with painful cervical radiculopathy, (2) to use this model to assess the performance of linearized [e.g., Logan (18)] and simplified [e.g., standardized uptake value (SUV) (19)] methods, and (3) to assess test-retest reliability of the resulting outcome parameters.
Materials and methods
This study was approved by the Medical Ethics Committee of Amsterdam University Medical Centre, location VUmc (Approval number: 2020.179) and was registered at the WHO International Clinical Trials Registry Platform (https://trialsearch.who.int; study ID: NL8060). Informed consent was obtained from all individual participants included in the study.
Study designs
The study consisted of two parts: the first part employed a cross-sectional design, while in the second part a test-retest design with a one-week follow-up was adopted. The first part of the study involved patients with a painful cervical radiculopathy to identify the optimal tracer kinetic model with an image derived input function (Figure 1) for describing uptake of [11C]DPA713 in the spinal cord and neuroforamina. The second part of the study focused on determining test-retest reliability of the corresponding model parameters. From the initial group of patients with painful cervical radiculopathy, a subset of six was randomly selected. These six patients were scanned on two separate occasions, with a one-week interval between measurements.
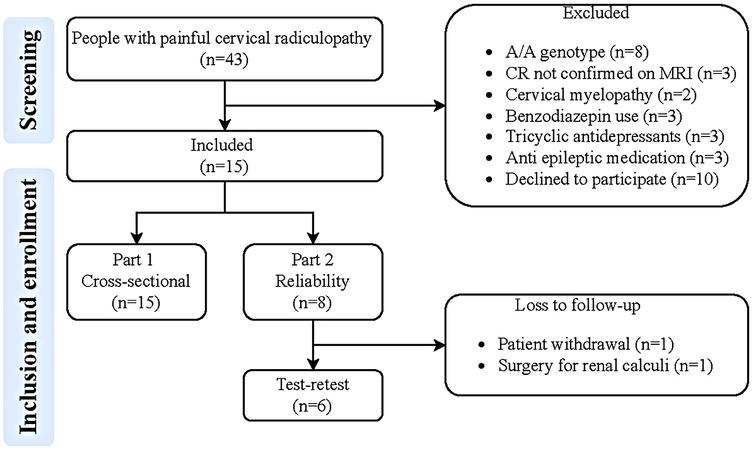
Figure 1. Flowchart of the study. MRI, magnetic resonance imaging; CR, painful cervical radiculopathy; G/G genotype: low-affinity binders.
Participants
Patients who were at least 18 years of age were eligible for inclusion if they had been diagnosed with a painful cervical radiculopathy by a medical specialist, supported by relevant Magnetic Resonance Imaging (MRI) findings. Exclusion criteria included: (1) exposure to research and medical procedure dose radioactivity with a dose above 5 mSv in the previous year, (2) use of immunosuppressive medication (e.g., corticosteroid therapy, opioid therapy, benzodiazepine use), (3) unwillingness to refrain from nonsteroidal anti-inflammatory drug (NSAID) exposure in the 2 weeks prior to scanning, (4) a cervical epidural steroid injection in the preceding 12 weeks, (5) pregnancy and/or breastfeeding, and (6) having the low affinity binding TSPO G/G polymorphism. The genotype must be performed at a prior visit, before enrolling into the protocol.
Clinical assessment
Demographic and clinical data were obtained after inclusion. Clinical characteristics were assessed through clinical (neurological) examination and questionnaires [neck disability index (NDI) and painDETECT]. Details are provided in Table 1.
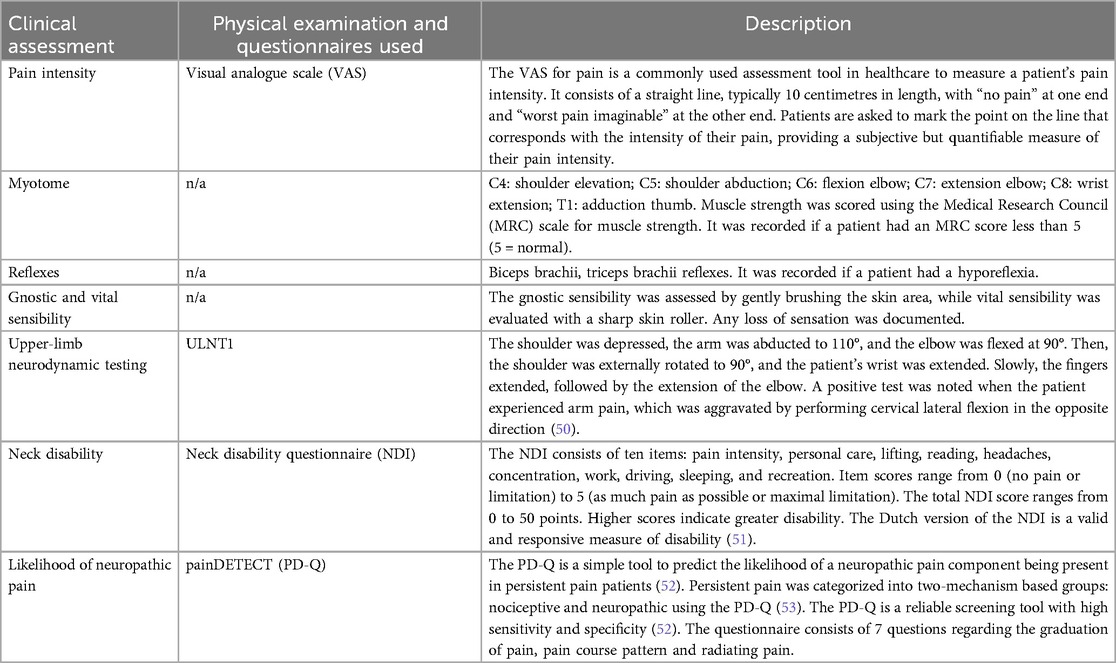
Table 1. Description of physical examination and questionnaires used.
Determination of TSPO rs6971 genotype
The genetic variant rs6971 in TSPO is known to affect the binding affinity of second generation TSPO tracers (14). Therefore, patients were classified based on their genotype: homozygous AA as high affinity binders, heterozygous AG as mixed affinity binders and homozygous GG as low affinity binders. The genetic variant rs6971 was determined in DNA extracted from blood using a Chemagic STAR DNA Saliva 4k Kit (Hamilton Robotics, Reno, NV, United States), according to the manufacturer's protocol. Genotyping for rs6971 was performed using a KASP™ by Design allelic discrimination assay (LGC Genomics, Hoddesdon, UK). Genotyping was performed in a 10 µl reaction volume, comprising 10 ng DNA, 0.5 µl KASP Mastermix (low ROX), 0.125 µl KASP SNP genotyping assay (40x) and water. Each amplification for the KASPar assay was performed by an initial denaturation at 94°C for 15 min, followed by 10 cycles of denaturation at 94°C for 20 s and annealing/extension at 61°C for 60 s including a drop of 0.6°C for each cycle. This was followed by 26 cycles of denaturation at 94°C for 10 s and annealing/extension at 55°C for 60 s, followed by four cycles of denaturation at 94°C for 20 s and annealing/extension at 57°C for 60 s. This was carried out on a 7500FAST Real-Time PCR System (Applied Biosystems, Nieuwerkerk aan den IJssel, The Netherlands). Genotypes were scored using the algorithm and software (v2.0.6) supplied by Applied Biosystems. Positive controls for each possible genotype were included as quality control for the genotyping.
Scanning protocol
Each patient was scanned on an Ingenuity TF PET/CT scanner (Philips Medical Systems, Best, the Netherlands). To ensure consistent image quality and quantification, patients were positioned so that the affected neuroforamina and ascending aorta lay within the central 10 cm of the scanner's 18.4 cm axial field of view. Positioning was confirmed via CT scout and applied uniformly across all subjects. The scan protocol consisted of a low-dose CT scan for attenuation correction, anatomical positioning, and segmentation of anatomical regions, followed by an intravenous injection of 370 ± 22 MBq [11C]DPA713 at the start of a dynamic PET scan of 60 min.
Acquired list mode data were reconstructed into 19 frames (1 × 15, 3 × 5, 3 × 10, 4 × 60, 2 × 150, 2 × 60 and 4 × 600 s). Data were reconstructed using 3D RAMLA in combination with CT-based attenuation correction, providing images with a final voxel volume of 4 mm3 (voxel dimensions: 1.7 mm × 1.7 mm × 1.7 mm in the x, y, and z directions, respectively) and a spatial resolution of 5 mm full width at half maximum (FWHM). Reconstruction included all usual corrections, such as detector normalization, and decay, dead time, attenuation, randoms and scatter corrections.
Venous blood samples were withdrawn from an intravenous catheter placed contralaterally to the tracer infusion at 5, 10, 15, 30, 35, 40, and 59 min post-injection of [11C]DPA713 to estimate radiolabeled metabolite fractions, plasma parent fractions, and plasma-to-whole blood ratios. Plasma was separated by centrifugation and analysed using high-performance liquid chromatography (HPLC) with offline quantification. Given the limitations of online activity detectors—particularly at later time points when plasma activity is low due to the short half-life of [11C] - HPLC fractions were collected and subsequently measured using a high-sensitivity multiwell counter (Wallac Wizard, PerkinElmer). This method enables reliable detection of parent and radiometabolite fractions under conditions typical of [11C]DPA713 studies (13, 20).
Image segmentation
Using the CT images, regions of interest were drawn manually on the axial slices (thickness 5 mm) within the boundaries of the affected neuroforamina (containing the roots and dorsal root ganglia), spinal cord and ascending aorta using software developed in house (ACCURATE) (21, 22). Target and unaffected tissue regions of interest (ROI) were drawn using a circle with a diameter of 2 cm (1 slice; size 1.5175 cm3). Unaffected tissues were drawn three levels higher than the affected cervical nerve root, as primary afferent neurons that enter the spinal cord may synapse with 2nd order neurons two levels above and below the affected level due to the tract of Lissauer. As several patients with cervical radiculopathy had bilateral CR and/or symptoms, the contralateral neuroforamina could not be used as unaffected region. Preliminary research has shown that there was no difference in the volume of distribution of neuroforamina and spinal cord unaffected tissues (i.e., three levels above) between patients with cervical radiculopathy and pain-free participants, demonstrating that these anatomical regions might serve as an reference region (submitted manuscript). Target and unaffected regions were selected by a trained researcher and approved by an expert neuroradiologist. Subsequently, these ROIs were used in the corresponding dynamic [11C]DPA713 images in order to extract regional time-activity curves (TACs). Image derived input function (IDIF) based metabolite corrected plasma input curves were generated following a step wise procedure: (1) The input was based on a multi-exponential curve fitted separately to the discrete whole blood and plasma samples in order to extract both whole blood and plasma input curves; (2) Additionally, plasma input curves were corrected for metabolites fractions measured in plasma based on discrete blood samples fitted to a hill-fit function in order to generate metabolite corrected plasma input curve; (3) Next, to more accurately define the peak part of the input, image derived TAC before 5 min pi was scaled to match the levels of whole blood activity at 5 min and corrected for plasma-to-whole blood ratios and metabolites fractions using the curves from the first two steps and all scaled with a constant factor as such to match activity levels of blood samples at 5 min post infusion; and (4) the input function was corrected for delay relative to each TAC separately.
Kinetic analysis
TACs were analysed using three conventional compartmental models, all requiring a metabolite corrected arterial input function. The compartment models consisted of a single tissue compartment model (1T2k), an irreversible two tissue compartment model (2T3k), and a reversible two tissue compartment model (2T4k), all including an additional parameter for the blood volume fraction.
Model selection followed a stepwise procedure aimed at minimizing bias and variability: (1) Obvious outliers (e.g., missing input function or non-physiological TACs) were excluded, (2) data were fitted using all candidate models within parameter boundariers, and preference based on the Akaike Information Criterion (AIC) for reversible vs. irreversible models was determined, (2) visual assessment of fit quality, (3) number of outlier parameter estimates, (4) robustness to noise, and (5) correlation between estimates from different compartmental models (23). Outliers were identified based on a combination of quantitative and qualitative criteria. Specifically, a case was considered an outlier if (1) the estimated volume of distribution (VT) exceeded the group median VT for the same anatomical region by more than 50%, or (2) the time–activity curves (TACs) showed non-physiological patterns, such as abrupt signal drops, typically associated with patient motion (see Supplementary Figure S1). The optimal fitting model was used to derive various model dependent kinetic parameters such as rate constants (K1, k2, k3, k4), the net influx rate constant (Ki), and the volume of distribution (VT). VT was considered as the primary outcome parameter to describe uptake of [11C]DPA713 within tissues. VT is an index of receptor density and equals the ratio at equilibrium of the concentration of [11C]DPA713 in tissue to that in plasma (24). The concentration of [11C]DPA713 in tissue represents the sum of specific binding (receptor bound) and non-displaceable uptake (non-specifically bound and free radioligand in tissue water) (24).
Linearized and simplified method analysis
The accuracy and precision of linearized plasma input methods [either Patlak or Logan (18, 25)] and several simplified static approaches were evaluated by comparing their outcome measures with corresponding kinetic parameters obtained with the optimal non-linear compartment methods. Simplified static approaches consisted of measures of average regional tracer uptake over an interval (20–50 and 30–60 min post-injection.) normalized to (1) patient weight and injected dose (SUV: standardized uptake value), (2) activity in arterial whole blood [target-to-whole blood ratio (TBR-WB)] and (3) activity in metabolite corrected plasma [target-to-metabolite corrected plasma ratio (TBR-PP)].
Statistical analysis
To assess the performance of a simplified method, such as SUV, a Pearson's or Spearman's rank correlation coefficient (r) was employed depending on the distribution of the data. The interpretation of correlation scores followed these categories: r < 0.30: low/insignificant correlations, 0.30 ≥ r < 0.45: moderate correlation, 0.45 ≥ r < 0.60 substantial correlation and r ≥ 0.60: high correlation (26). To assess test-retest reliability, intraclass correlation coefficients (ICC2.1) were calculated employing absolute agreement, two-way mixed effects models, accompanied by 95% confidence intervals (CIs) (27). For a minimum standard of test-retest reliability, ICC2.1 values of at least 0.76 were deemed essential (27). The interpretation of ICC2.1 scores followed these categories: 0.00–0.40: poor reliability, 0.41–0.75: fair to good reliability and, 0.76–1.00: good to excellent reliability (27). In addition, measures for absolute measurement error between test and retest were calculated, including the standard error of measurement (SEM) based on ICC2.1, the smallest detectable difference (SDD) and the Bland-Altman Limits of Agreement (Bland Altman LoA). SEM was defined by , SDD by (28), and Bland-Altman LoA (29) by . P-values smaller than 0.05 were considered as statistically significant. SPSS version 28 (IBM, Armonk, NY, USA) was used for the statistical analyses.
Results
Participants
Fifteen patients with cervical radiculopathy were included in the study and a randomly selected subset of six patients participated in the test-retest study. The C7 radiculopathy was the most commonly affected (9 out of 15), followed by C6 radiculopathy (5 out of 15) and C5 radiculopathy (1 out of 15). In the subset of cervical radiculopathy participants who took part in the test-retest study, C6 radiculopathy was the most frequently affected (3 out of 6), followed by C7 radiculopathy (2 out of 6), and C5 radiculopathy (1 out of 6). Table 2 provides an overview of baseline participant demographics, clinical characteristics and functional profiles.
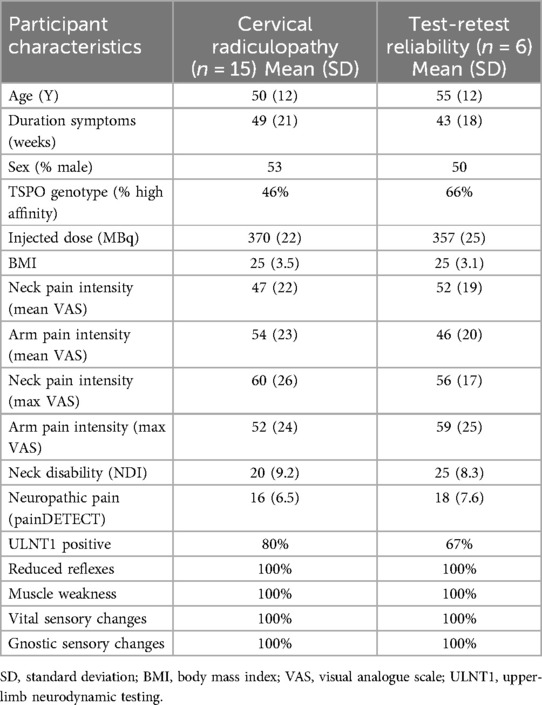
Table 2. Overview of the baseline and test-retest participant demographics, clinical characteristics and functional profiles.
Sample data
The average normalized whole blood sample values (SUV) decreased exponentially over time with substantial individual variation (Figure 2A). The average plasma-to-whole blood ratio was approximately 0.8 during the whole scan period (Figure 2B). On average, parent tracer fractions decreased to 80% at 30 min p.i. and slowly decreased further to 72% at 60 min (Figure 2C).
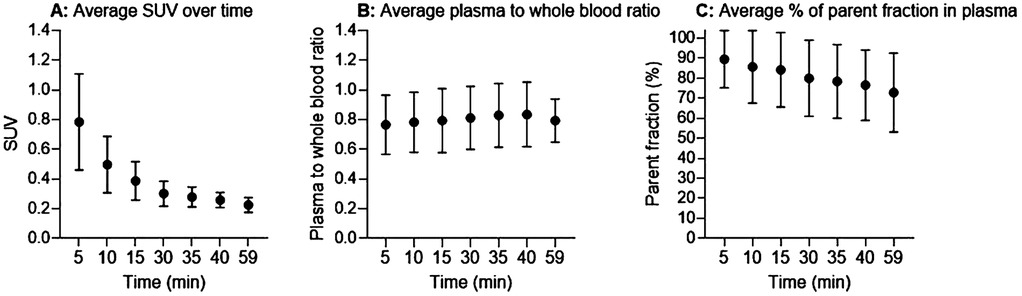
Figure 2. Input functions. (A) Normalized whole blood standardized uptake value (SUV). (B) Plasma-to-whole blood concentration ratio. (C) Average percentage of parent fractions in plasma as a function of time (minutes). Black circles are mean values and error bars represent one standard deviation.
Kinetic analysis
For one patient, the kinetic analysis was not performed as the ascending aorta was outside the field of view, thereby prohibiting the creation of an image derived input function. The following boundaries for the kinetic parameters were employed: K1 upper boundary (UB): 0.7, VT UB: 40, k3 UB: 0.8 and Vb UB: 0.7, and all lower boundaries were set to 0. Model performance according to the Akaike information criterion (AIC) revealed that for all regions (neuroforamina and spinal cord) the reversible models (1T2k or 2T4k) were preferred over the irreversible model (2T3k) in approximately 55% of cases. The single tissue compartmental model (1T2k) was the preferred model in 11% and 32% of cases for neuroforamina and spinal cord, respectively. The 2T4k model was the preferred model for the neuroforamina in 39% of cases and in 26% for the spinal cord. In the cases where AIC indicated a preference for the 2T3k model, often were noisy due to relative low signal from small regions and AIC differences were relatively small compared with those of the reversible models. Based on visual inspection, combined for neuroforamina and spinal cord, 1T2k showed 1 and 2T4k 20 outliers in the outcome measures due to patient motion. See Supplementary Figure S1 for a visual presentation of an outlier due to patient motion for the different kinetic models. Neuroforamina 2T4k VT was highly correlated with 1T2k VT in both neuroforamina (r = 0.91; p < 0.01) (Supplementary Figure S2A) and spinal cord (r = 0.85; p < 0.01) (Supplementary Figure S2B). Based on the number of outliers, visual fit quality and AIC, the 1T2k model was selected as the optimal model for describing [11C]DPA713 kinetics in both neuroforamina and spinal cord.
Linear and simplified analyses
Volume of distribution VT derived from Logan was compared with that of the preferred 1T2k model. Neuroforaminal Logan VT (with t* = 30 min post-injection) demonstrated high correlation with 1T2k VT (r = 0.73; p < 0.01) (Figure 3A). Similarly, for the spinal cord, Logan VT (t* = 30) exhibited high correlation with 1T2k VT (r = 0.81, p < 0.01) (Figure 3B).
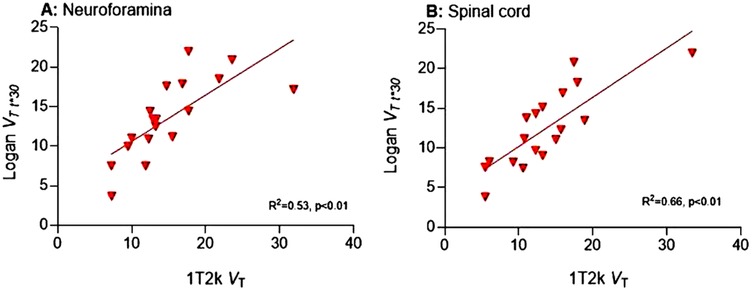
Figure 3. Correlation between VT 1T2k and VT Logan. VT, Volume of distribution; 1T2k, single-tissue compartmental model; R2, explained variance.
To assess whether simplified analyses could be used, neuroforamina and spinal cord SUV and TBR for two time intervals (20–50 and 30–60 min post-injection) were compared with corresponding 1T2k VT values. In the neuroforamina, TBR-WB (time interval 20–50: r = 0.48; p = 0.04; time interval 30–60: r = 0.50; p = 0.04) demonstrated substantial correlations with 1T2k VT. In addition, TBR-PP levels (time interval 20–50: r = 0.85; p < 0.01; time interval 30–60: r = 0.88; p < 0.01) had high correlations with 1T2k VT. In contrast, there were low correlations between SUV (time interval 20–50: r = 0.01; p = 0.85; time interval 30–60: r = 0.01; p = 0.99) and 1T2k VT.
At the spinal cord, high correlations were present between TBR-WB (time interval 20–50: r = 0.64, p = 0.14; time interval 30–60: r = 0.60; p = 0.07) with 1T2k VT and between TBR-PP levels (time interval 20–50: r = 0.67, p < 0.01; time interval 30–60: r = 0.69, p < 0.01) and 1T2k VT. There were moderate correlations between SUV (time interval 20–50: r = 0.34; p = 0.14; time interval 30–60: r = 0.41; p = 0.07) and 1T2k VT. See Supplementary Table S3 for more details.
Differences between target and unaffected tissues
Neuroforamina and spinal cord 1T2k VT levels were significantly higher in the target regions compared with the unaffected tissues (Table 3). This difference was also present for Logan VT and simplified methods (Table 3).
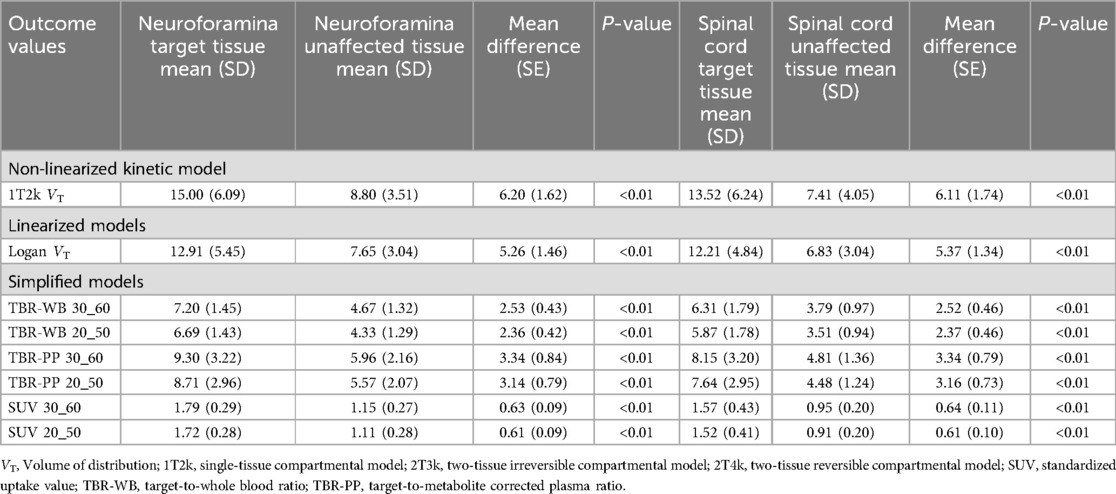
Table 3. Outcome values for the non-linear, linearized and simplified models for both target and unaffected tissues.
Test-retest reliability
1T2k derived VT revealed fair to good reliability for the neuroforamina and poor reliability for the spinal cord (Table 4, Figures 4A,B). In addition, 1T2k derived VT revealed fair to good reliability for unaffected neuroforamina and poor reliability for unaffected spinal cord (Table 4). This variation in test-retest reliability might be due to variations in metabolite concentration determination, as the determined metabolite fractions substantially differed between test-retest measurements (see Supplementary Table S4). Omitting the metabolite correction (1T2k_WB) revealed good to excellent reliability for the neuroforamina and fair to good reliability for the spinal cord. Logan VT showed good to excellent test-retest reliability with ICC2.1 values above 0.76 for the neuroforamina, but poor reliability for the spinal cord. Amongst the simplified measures, at the neuroforamina, SUV_30–60 revealed test-retest reliability with ICC2.1 values above the 0.76 threshold. At the spinal cord, TBR-PP_30–60, SUV 20–50, and SUV 30–60 showed test-retest reliability with ICC values above the 0.76 threshold. See Table 4 for more quantitative details.
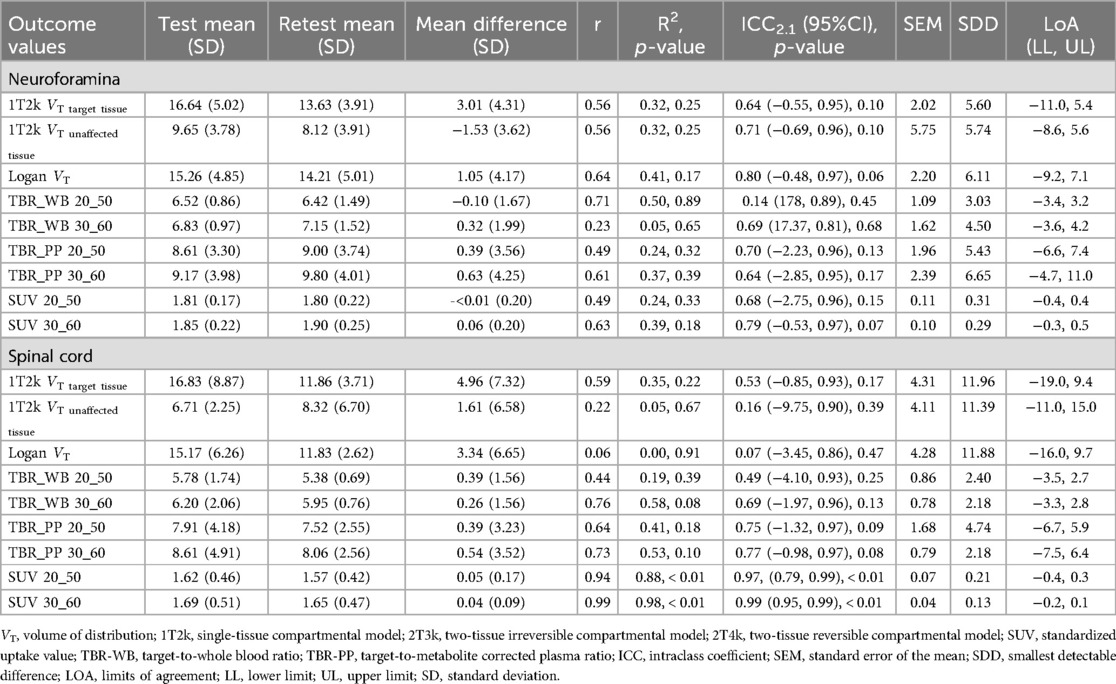
Table 4. Test-retest reliability data per neuroinflammatory metric .
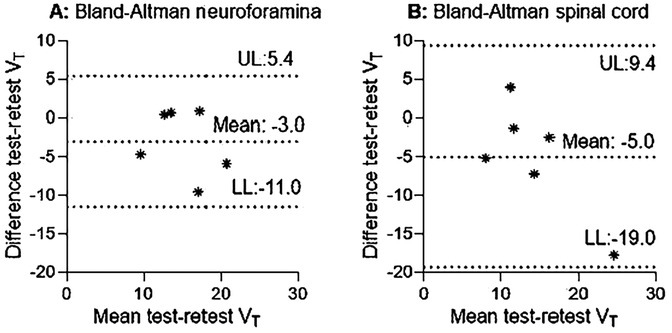
Figure 4. Bland-Altman of VT test-retest data. (A) and (B) reveal the 1T2k VT.
Discussion
This study resulted in four main findings. First, based on AIC, visual inspection of fits and the number of outliers, the 1T2k model was the preferred model to describe [11C]DPA713 kinetics in neuroforamina and spinal cord of patients with painful cervical radiculopathy. Second, Logan VT and TBR-PP showed high correlations with 1T2k derived VT for both affected neuroforamina and spinal cord. Third, at the neuroforamina, 1T2k_WB VT, Logan VT, and SUV_30–60 showed ICC2.1 values above the set threshold of 0.76. At the spinal cord, TBR-PP, and SUV showed ICC2.1 values above the set threshold of 0.76. Fourth, 1T2k VT, 1T2k_WB VT, Logan VT and all simplified measures revealed elevated [11C]DPA713 uptake in the affected neuroforamina and spinal cord compared with unaffected tissues using a within-person design.
When comparing the present findings with previous reports, it is important to note that limited data are available on human musculoskeletal pain conditions. TSPO PET imaging has been employed as a neuroinflammatory biomarker mainly in the assessment of microglial activity in neurodegenerative diseases rather than in musculoskeletal pain conditions (30, 31). The scarcity of available data has limited the translational potential of preclinical work (32–34). In a human study comparing patients with a cervical radiculopathy and pain-free participants (n = 5 in each group), [11C]DPA713 SUV revealed no observable spinal neuroinflammation in the cervical radiculopathy group (35). A comparison with the present study is difficult, as no information was provided regarding the time interval during which SUV was measured. Another human study indicated an increase in [11C]PBR28 SUV in the ipsilateral neuroforamina and spinal cord segments in patients with chronic radicular pain (n = 19) compared with pain-free participants (n = 10) (2). In the present study, using a within-subject design, all binding metrics - VT, Logan VT, and simplified measures—revealed elevated tracer uptake in the spinal cord and neuroforamina compared with unaffected tissues. VT offers advantages over simplified measures like SUV because it may accounts for blood flow, radiometabolites, and tracer clearance over time, addressing several limitations of SUV. Although simplified measures are practical and revealed between-group differences in our study, there are important scenarios where quantitative kinetic modeling is essential. Even without direct estimation of binding kinetics (k3/k4), 1T2k derived VT enables a more robust interpretation of tracer behaviour than SUV alone and is particularly valuable in longitudinal designs, such as therapy monitoring or disease progression studies, where systemic physiological changes (e.g., inflammation or vascular alterations) may influence tracer delivery and confound SUV-based analyses (5, 36). Although challenges in radiometabolite assay accuracy, especially at later time points, can impact quantitative outcomes, we addressed this by employing a high-sensitivity multiwell counter validated for low-activity [11C]DPA713 samples (see Methods). This methodological approach helps mitigate counting-related bias and supports the robustness of the derived input function and resulting VT estimates.
Methodological considerations
Model selection followed a careful process. Initial exclusions were made for obvious artifacts, such as missing input function data or non-physiological TACs. The remaining datasets were analyzed using all candidate models within defined parameter boundaries, with AIC used to guide the initial decisions. Although AIC values showed a slight advantage for the 2T4k model in certain regions, such as the neuroforamina, model selection was guided by additional factors: visual fit quality, resistance to noise, prevalence of outliers, and the physiological plausibility of estimated parameters. The 2T4k model frequently produced unstable fits in smaller regions with lower signal-to-noise ratios, resulting in 20 outliers compared to only one for the 1T2k model. Many of these were associated with slight patient motion, observed in about 15% of scans. Motion artifacts were identified through visual inspection of dynamic PET/CT frames and TACs, which occasionally displayed abrupt signal drops (see Supplementary Figure S1). TACs strongly affected by motion were excluded. However, slight motion artifacts in combination with noise disproportionately affected the 2T4k model, which in response yielded exaggerated VT values and larger standard deviations. By contrast, the more constrained 1T2k model yielded stable, physiologically plausible estimates even under these conditions. Comparing VT estimates from both models revealed high correlations (r = 0.91 in neuroforamina, r = 0.85 in spinal cord), indicating that 1T2k can reliably estimate VT. Although AIC provided a useful initial guide, the final decision was ultimately driven by practical considerations: consistency of parameter estimates, visual fit quality, and close agreement in VT values. Under ideal, high signal-to-noise ratio conditions, the 2T4k model might offer finer detail. However, in the practical setting of this study, the 1T2k model proved both robust and accurate. As a final consideration, the known reversibility of [11C]DPA713 uptake in nervous tissue supports the physiological validity of a reversible single-tissue model (37, 38).
The direct calculation of binding potential relative to the non-displaceable compartment (BPND = k3/k4) is not possible with the 1T2k model, as k3 and k4 are not determined (BPND). Alternatively, BPND could be determined indirectly from distribution volume ratio (DVR) minus 1 based on a reference tissue approach. However, use of a reference region to calculate DVR and BPND requires: (1) the reference region is devoid of specific/displaceable binding, (2) reference and target tissues have the same non-displaceable volume of distribution and (3) VT can be measured reliably in both tissues (39). The unaffected tissue in this study could not be used as reference region as it does not fulfil the assumption of no specific binding. Further research will be necessary to identify and validate suitable tissues that can serve as reference tissue when calculating DVR and BPND for the spinal cord and neuroforamina.
There were high correlations between Logan VT and 1T2k VT, as well as between simplified metrics, particularly TBR-PP, and 1T2k VT. Despite the high correlations between TBR-PP metrics (SUV corrected for parent fraction in plasma) and 1T2k VT, the use of static TBR-PP entails significant limitations. Radiculopathy commonly involves edema, which can alter local blood flow within the dorsal root ganglion and, consequently, affect tracer delivery. While changes in perfusion may influence early tracer kinetics, the VT as derived from compartmental modeling is generally considered robust to such variations, assuming sufficient scan duration and appropriate model fit. Moreover, the plasma-to-tissue influx rate constant (K1) provides a means to assess regional perfusion directly. In contrast, static imaging measures such as target-to-background ratio offer no information about tracer kinetics and do not account for differences in tissue perfusion, potentially introducing variability unrelated to specific tracer binding. Especially in longitudinal studies investigating treatment effects, changes in perfusion of the dorsal root ganglion may be expected, and the use of TBR metrics will need to be validated against the 1T2k model.
Single tissue compartmental model VT only reached fair to good test-retest reliability with ICC values falling below the set cut-off point of 0.76. Uncertainty in the estimation of true metabolite fractions may contribute to variability in 1T2k VT. These inaccuracies are unlikely due to the HPLC method itself, which is validated and reliable, but rather reflect practical challenges during venous sampling, such as insufficient blood volume or prolonged sampling duration. The uncorrected metabolite model (1T2k_WB VT) revealed better test-retest reliability with an ICC of 0.88 for the affected neuroforamina and an ICC of 0.74 for the spinal cord. Logan VT showed good to excellent reliability at the neuroforamina, but poor reliability at the spinal cord. Another reason for the suboptimal test-retest reliability could stem from the CT slice thickness of 5 mm. Given the limited axial field of view (18 cm) and the necessity for the ascending aorta to consistently remain within this field, it is plausible that the visualization of the neuroforamina was not consistent across test-retest images. This variation could have introduced inconsistency in drawing the VOI on the longitudinal plane. However, different VOI strategies (1 slice vs. more slices) were used and the adopted method showed the highest reliability. Future studies should consider the use of artificial intelligence methodologies to automate identification of the target areas of interest as an attempt to increase test-retest reliability (40).
Compared with corresponding unaffected tissues, increased [11C]DPA713 binding was observed at the affected neuroforamina and spinal cord, suggesting neuroinflammation. There are several factors that might cause neuroinflammation locally at the affected neuroforamina and spinal cord. Firstly, neuroinflammation might arise due to disturbed homeostasis caused by compression and/or chemical irritation of the cervical nerve root(s) and/or dorsal root ganglion. Clinical immunohistochemical analysis has shown that nucleus pulposus material initiates a chemical cascade, involving pro-inflammatory mediators, such as tumour necrosis factor (TNF), interleukin-6 (IL-6), and matrix metalloproteinases (MMPs) (41). Secondly, aberrant neuronal activity might occur, resulting in ectopic/aberrant firing of nociceptors, which induces inflammatory reactions, a process called neurogenic neuroinflammation (42–44). From a broader neuroscience perspective, this study demonstrates that PET imaging with [11C]DPA713 can be used to visualize neuroinflammatory processes in-vivo in the human spinal cord and nerve roots, regions that are otherwise difficult to access. These findings contribute to our understanding of the biological mechanisms that may underlie radiculopathy and related symptoms. Furthermore, such in-vivo imaging approaches provide a valuable tool to study neuroimmune interactions in the human nervous system and how these may relate to structural pathology or clinical symptoms. This may help guide future investigations into therapeutic strategies targeting neuroinflammatory pathways.
It is important to acknowledge limitations associated with the TSPO tracer, as it does not exclusively reflect microglial activation but also astrocyte involvement in neuroinflammation (45). Inter-individual genetic variations can influence TSPO binding, and therefore only individuals with mixed and high-affinity binding for [11C]DPA713 were included. Moreover, [11C]DPA713 binding to TSPO does not differentiate between anti-inflammatory and pro-inflammatory phenotypes, indicating the need for tracers capable of discriminating between these two immune responses (46). [11C]DPA713 has potential advantages over other tracers, such as (R)-[11C]PK11195, including increased binding affinity, and improved signal-to-noise ratio(5). To reduce patient burden during PET/CT scanning, image-derived input function was used in combination with venous sampling rather than arterial sampling. It is important to consider that image-derived input function methods are highly tracer-specific and influenced by tracer kinetics and radio metabolites (15). A limitation of this study is the lack of direct validation of the image-derived input function against arterial sampling for [11C]DPA713 on this scanner. However, using large blood pools, high correlations have been shown between the input function derived from arterial cannulation and that derived from the ascending aorta (ICC>0.98) (47). Partial volume effects might pose a significant problem, but they were minimal in this study as shown in the scaling factor. The use of venous blood to determine the metabolite fraction has the advantage of reducing the patient burden compared with arterial metabolite fraction determination. However, while for one tracer arterial and venous metabolite fractions may be similar, for other there may be significant differences (48). For [11C]DPA713, the use of venous samples to determine metabolite fractions might introduce errors when creating the image derived input function corrected for labelled metabolites. For [11C]DPA713, arterial and venous metabolite analyses should be compared in a future study.
These results indicate that a 1T2k model with a metabolite-corrected image-derived input function can be used to describe the kinetics of [11C]DPA713 in the spinal cord and neuroforamina in humans (Figure 5). 1T2k VT or Logan VT can be used as binding metrics, while TBR-PP is the recommended choice among simplified models. PET may offer added value in the clinic by revealing where neuroinflammation is present, potentially aiding in understanding the spatial distribution and dynamics of inflammation in chronic radiculopathy (49). Although dynamic PET is not yet suitable for routine clinical use, it holds promise for advancing our understanding of the complex pathophysiology of painful cervical radiculopathy and the effects of treatments. However, to interpret treatment effects reliably, it is essential to use a metabolite-corrected input function, as therapeutic interventions may alter both the blood signal and the proportion of radiolabelled metabolites. Without this correction, changes in tracer kinetics could be misattributed to treatment effects rather than underlying pharmacokinetic alterations.
![T1-weighted MRI, low dose CT, [¹¹C]DPA713 PET, and PET-CT images of the neck region. T1-weighted MRI shows a sagittal spinal column view. Low dose CT and PET images highlight a specific area with marked radioactive uptake on the PET scan. PET-CT overlay shows combined structural and functional imaging. A color scale indicates radioactivity levels from zero to thirty.](https://www.frontiersin.org/files/Articles/1569991/fnume-05-1569991-HTML/image_m/fnume-05-1569991-g005.jpg)
Figure 5. Graphical summary. Neuroinflammation in a patient with painful cervical radiculopathy C6. Patient was a mixed-affinity binder for TSPO polymorphism. To quantify [11C]DPA713 binding at the neuroforamina and spinal cord, a single tissue compartment (1T2k) model with image derived input function was used. For visualization purposes, volume of distribution (VT) images were generated using Logan plot analysis, with a time threshold of t* = 30 min. (A) T1-weighted MRI. The dotted line indicates the cross-sectional area used for the CT and PET analysis. (B) Low-dose CT cross-sectional image, with (C) a zoomed view at the neuroforamina. (D) A parametric cross-sectional image of [11C]DPA713 binding, with (E) a zoomed view at the neuroforamina. Higher volume of distribution (VT) indicates more tracer binding, suggesting higher levels of neuroinflammation. (F) CT and PET images merged with (G) a zoomed view at the affected neuroforamina.
Data availability statement
The raw data supporting the conclusions of this article will be made available by the authors, without undue reservation.
Ethics statement
The studies involving humans were approved by This study was approved by the Medical Ethics Committee of Amsterdam University Medical Centre, location VUmc (Approval number: 2020.179). The studies were conducted in accordance with the local legislation and institutional requirements. The participants provided their written informed consent to participate in this study.
Author contributions
IL: Conceptualization, Data curation, Formal analysis, Funding acquisition, Investigation, Methodology, Project administration, Resources, Software, Supervision, Validation, Visualization, Writing – original draft, Writing – review & editing. GS-P: Formal analysis, Funding acquisition, Project administration, Writing – review & editing. MK: Data curation, Project administration, Writing – review & editing. MC: Conceptualization, Funding acquisition, Project administration, Supervision, Writing – review & editing. RB: Conceptualization, Data curation, Investigation, Methodology, Project administration, Resources, Software, Supervision, Validation, Writing – review & editing. EG: Resources, Writing – review & editing. BT: Project administration, Writing – review & editing. MC: Project administration, Writing – review & editing. CV-L: Project administration, Writing – review & editing. PD: Project administration, Writing – review & editing. BB: Conceptualization, Funding acquisition, Methodology, Project administration, Resources, Software, Supervision, Writing – review & editing. AL: Conceptualization, Data curation, Formal analysis, Investigation, Methodology, Project administration, Resources, Software, Supervision, Visualization, Writing – review & editing. MY: Conceptualization, Data curation, Formal analysis, Funding acquisition, Investigation, Methodology, Project administration, Resources, Software, Supervision, Validation, Visualization, Writing – review & editing.
Funding
The author(s) declare that financial support was received for the research and/or publication of this article. This study was funded by Menzies Health Institute Queensland, Griffith University, Australia (Internal grant ID: MHIQ_2020) and by Amsterdam Movement Sciences (AMS) (Grant ID: Lab Fund 2022), Vrije Universiteit Amsterdam. The funding sources did not have a role in the study design, data collection, analyses and interpretation of the data, nor in the reporting of the results.
Acknowledgments
We wish to express our appreciation to the Laboratory of Medical Immunology and Laboratory of Radiochemistry at the Amsterdam UMC for granting us access to their laboratory facilities for processing blood and determining radiolabelled metabolite fractions. Furthermore, we extend our gratitude to the PET and MRI technicians affiliated with Amsterdam UMC for their invaluable assistance during PET/CT and MRI procedures. Finally, we would like to acknowledge the valuable contributions of technicians from Radboud UMC, who provided assistance in TSPO genotyping.
Conflict of interest
The authors declare that the research was conducted in the absence of any commercial or financial relationships that could be construed as a potential conflict of interest.
The author(s) declared that they were an editorial board member of Frontiers, at the time of submission. This had no impact on the peer review process and the final decision.
Generative AI statement
The author(s) declare that no Generative AI was used in the creation of this manuscript.
Any alternative text (alt text) provided alongside figures in this article has been generated by Frontiers with the support of artificial intelligence and reasonable efforts have been made to ensure accuracy, including review by the authors wherever possible. If you identify any issues, please contact us.
Publisher's note
All claims expressed in this article are solely those of the authors and do not necessarily represent those of their affiliated organizations, or those of the publisher, the editors and the reviewers. Any product that may be evaluated in this article, or claim that may be made by its manufacturer, is not guaranteed or endorsed by the publisher.
Supplementary material
The Supplementary Material for this article can be found online at: https://www.frontiersin.org/articles/10.3389/fnume.2025.1569991/full#supplementary-material
References
1. Schmid AB, Coppieters MW, Ruitenberg MJ, McLachlan EM. Local and remote immune-mediated inflammation after mild peripheral nerve compression in rats. J Neuropathol Exp Neurol. (2013) 72(7):662–80. doi: 10.1097/NEN.0b013e318298de5b
2. Albrecht DS, Ahmed SU, Kettner NW, Borra RJH, Cohen-Adad J, Deng H, et al. Neuroinflammation of the spinal cord and nerve roots in chronic radicular pain patients. Pain. (2018) 159(5):968–77. doi: 10.1097/j.pain.0000000000001171
3. Austin PJ, Moalem-Taylor G. The neuro-immune balance in neuropathic pain: involvement of inflammatory immune cells, immune-like glial cells and cytokines. J Neuroimmunol. (2010) 229(1):26–50. doi: 10.1016/j.jneuroim.2010.08.013
4. Grace PM, Hutchinson MR, Maier SF, Watkins LR. Pathological pain and the neuroimmune interface. Nat Rev Immunol. (2014) 14(4):217–31. doi: 10.1038/nri3621
5. Turkheimer FE, Rizzo G, Bloomfield PS, Howes O, Zanotti-Fregonara P, Bertoldo A, et al. The methodology of TSPO imaging with positron emission tomography. Biochem Soc Trans. (2015) 43(4):586–92. doi: 10.1042/BST20150058
6. Chen G, Zhang YQ, Qadri YJ, Serhan CN, Ji RR. Microglia in pain: detrimental and protective roles in pathogenesis and resolution of pain. Neuron. (2018) 100(6):1292–311. doi: 10.1016/j.neuron.2018.11.009
7. Cserép C, Pósfai B, Lénárt N, Fekete R, László ZI, Lele Z, et al. Microglia monitor and protect neuronal function through specialized somatic purinergic junctions. Science (New York, NY). (2020) 367(6477):528–37. doi: 10.1126/science.aax6752
8. Banati RB. Visualising microglial activation in vivo. Glia. (2002) 40(2):206–17. doi: 10.1002/glia.10144
9. Venneti S, Lopresti BJ, Wiley CA. Molecular imaging of microglia/macrophages in the brain. Glia. (2013) 61(1):10–23. doi: 10.1002/glia.22357
10. Albrecht DS, Granziera C, Hooker JM, Loggia ML. In vivo imaging of human neuroinflammation. ACS Chem Neurosci. (2016) 7(4):470–83. doi: 10.1021/acschemneuro.6b00056
11. Yokokura M, Terada T, Bunai T, Nakaizumi K, Takebayashi K, Iwata Y, et al. Depiction of microglial activation in aging and dementia: positron emission tomography with [(11)C]DPA713 versus [(11)C](R)PK11195. J Cereb Blood Flow Metab. (2017) 37(3):877–89. doi: 10.1177/0271678X16646788
12. Bruijnen STG, Verweij NJF, Gent YYJ, Huisman MC, Windhorst AD, Kassiou M, et al. Imaging disease activity of rheumatoid arthritis by macrophage targeting using second generation translocator protein positron emission tomography tracers. PLoS One. (2019) 14(9):e0222844. doi: 10.1371/journal.pone.0222844
13. Yaqub M, Verweij NJF, Pieplenbosch S, Boellaard R, Lammertsma AA, van der Laken CJ. Quantitative assessment of arthritis activity in rheumatoid arthritis patients using [11C]DPA-713 positron emission tomography. Int J Mol Sci. (2020) 21(9):3137. doi: 10.3390/ijms21093137
14. Owen DR, Guo Q, Rabiner EA, Gunn RN. The impact of the rs6971 polymorphism in TSPO for quantification and study design. Clin Transl Imaging. (2015) 3(6):417–22. doi: 10.1007/s40336-015-0141-z
15. Zanotti-Fregonara P, Chen K, Liow J-S, Fujita M, Innis RB. Image-derived input function for brain PET studies: many challenges and few opportunities. J Cereb Blood Flow Metab. (2011) 31(10):1986–98. doi: 10.1038/jcbfm.2011.107
16. Zanotti-Fregonara P, Liow JS, Fujita M, Dusch E, Zoghbi SS, Luong E, et al. Image-derived input function for human brain using high resolution PET imaging with [C](R)-rolipram and [C]PBR28. PLoS One. (2011) 6(2):e17056. doi: 10.1371/journal.pone.0017056
17. Sleijser-Koehorst MLS, Coppieters MW, Epping R, Rooker S, Verhagen AP, Scholten-Peeters GGM. Diagnostic accuracy of patient interview items and clinical tests for cervical radiculopathy. Physiotherapy. (2020) 111:74–82. doi: 10.1016/j.physio.2020.07.007
18. Logan J. Graphical analysis of PET data applied to reversible and irreversible tracers. Nucl Med Biol. (2000) 27(7):661–70. doi: 10.1016/S0969-8051(00)00137-2
19. Thie JA. Understanding the standardized uptake value, its methods, and implications for usage. J Nucl Med. (2004) 45(9):1431–4.15347707
20. Greuter HN, van Ophemert PL, Luurtsema G, Franssen EJ, Boellaard R, Lammertsma AA. Validation of a multiwell gamma-counter for measuring high-pressure liquid chromatography metabolite profiles. J Nucl Med Technol. (2004) 32(1):28–32.14990672
21. Boellaard R. Quantitative oncology molecular analysis suite: aCCURATE. J Nucl Med. (2018) 59(supplement 1):1753.
22. Burggraaff CN, Rahman F, Kaßner I, Pieplenbosch S, Barrington SF, Jauw YWS, et al. Optimizing workflows for fast and reliable metabolic tumor volume measurements in diffuse large B cell lymphoma. Mol Imaging Biol. (2020) 22(4):1102–10. doi: 10.1007/s11307-020-01474-z
23. Akaike H. Fitting autoregressive models for prediction. Ann Inst Stat Math. (1969) 21(1):243–7. doi: 10.1007/BF02532251
24. Cunningham VJ, Rabiner EA, Slifstein M, Laruelle M, Gunn RN. Measuring drug occupancy in the absence of a reference region: the lassen plot re-visited. J Cereb Blood Flow Metab. (2010) 30(1):46–50. doi: 10.1038/jcbfm.2009.190
25. Patlak CS, Blasberg RG, Fenstermacher JD. Graphical evaluation of blood-to-brain transfer constants from multiple-time uptake data. J Cereb Blood Flow Metab. (1983) 3(1):1–7. doi: 10.1038/jcbfm.1983.1
26. Burnand B, Kernan WN, Feinstein AR. Indexes and boundaries for “quantitative significance” in statistical decisions. J Clin Epidemiol. (1990) 43(12):1273–84. doi: 10.1016/0895-4356(90)90093-5
27. Koo TK, Li MY. A guideline of selecting and reporting intraclass correlation coefficients for reliability research. J Chiropr Med. (2016) 15(2):155–63. doi: 10.1016/j.jcm.2016.02.012
28. Stratford PW. Getting more from the literature: estimating the standard error of measurement from reliability studies. Physiotherapy Canada. (2004) 56(027):745–50. doi: 10.2310/6640.2004.15377
29. Bland JM, Altman DG. Statistical methods for assessing agreement between two methods of clinical measurement. Lancet. (1986) 1(8476):307–10. doi: 10.1016/S0140-6736(86)90837-8
30. Echeverry S, Shi XQ, Yang M, Huang H, Wu Y, Lorenzo LE, et al. Spinal microglia are required for long-term maintenance of neuropathic pain. Pain. (2017) 158(9):1792–801. doi: 10.1097/j.pain.0000000000000982
31. Largeau B, Dupont AC, Guilloteau D, Santiago-Ribeiro MJ, Arlicot N. TSPO PET imaging: from microglial activation to peripheral Sterile inflammatory diseases? Contrast Media Mol Imaging. (2017) 2017:6592139. doi: 10.1155/2017/6592139
32. Koop MA, Sleijser-Koehorst MLS, Hooijmans CR, Tdlohreg PQ, Lutke Schipholt IJ, Scholten-Peeters GGM, et al. The potential protective effects of pre-injury exercise on neuroimmune responses following experimentally-induced traumatic neuropathy: a systematic review with meta-analysis. Front Immunol. (2023) 14:1215566. doi: 10.3389/fimmu.2023.1215566
33. Sleijser-Koehorst MLS, Koop MA, Coppieters MW, Lutke Schipholt IJ, Radisic N, Hooijmans CR, et al. The effects of aerobic exercise on neuroimmune responses in animals with traumatic peripheral nerve injury: a systematic review with meta-analyses. J Neuroinflammation. (2023) 20(1):104. doi: 10.1186/s12974-023-02777-y
34. Lutke Schipholt IJ, Coppieters MW, Meijer OG, Tompra N, de Vries RBM, Scholten-Peeters GGM. Effects of joint and nerve mobilisation on neuroimmune responses in animals and humans with neuromusculoskeletal conditions: a systematic review and meta-analysis. Pain Rep. (2021) 6(2):e927. doi: 10.1097/PR9.0000000000000927
35. Shimosegawa E, Matsunaga K, Hatazawa J. Relevance of spinal neuroinflammation to neuropathic pain: an exploratory clinical study evaluated by 11C-DPA-713 PET and TSPO-related biomarkers. J Nucl Med. (2019) 60(supplement 1):1487. -.
36. Carson RE. Tracer kinetic modeling in PET. In: Bailey DL, Townsend DW, Valk PE, Maisey MN, editors. Positron Emission Tomography: Basic Sciences. London: Springer London (2005). p. 127–59.
37. Coughlin JM, Wang Y, Ma S, Yue C, Kim PK, Adams AV, et al. Regional brain distribution of translocator protein using [(11)C]DPA-713 PET in individuals infected with HIV. J Neurovirol. (2014) 20(3):219–32. doi: 10.1007/s13365-014-0239-5
38. Endres CJ, Pomper MG, James M, Uzuner O, Hammoud DA, Watkins CC, et al. Initial evaluation of 11C-DPA-713, a novel TSPO PET ligand, in humans. J Nucl Med. (2009) 50(8):1276–82. doi: 10.2967/jnumed.109.062265
39. Zanderigo F, Ogden RT, Parsey RV. Reference region approaches in PET: a comparative study on multiple radioligands. J Cereb Blood Flow Metab. (2013) 33(6):888–97. doi: 10.1038/jcbfm.2013.26
40. Klyuzhin IS, Chaussé G, Bloise I, Harsini S, Ferres JL, Uribe C, et al. PSMA-Hornet: fully-automated, multi-target segmentation of healthy organs in PSMA PET/CT images. Med Phys. (2024) 51(2):1203–16. doi: 10.1002/mp.16658
41. Kang JD, Georgescu HI, McIntyre-Larkin L, Stefanovic-Racic M, Evans CH. Herniated cervical intervertebral discs spontaneously produce matrix metalloproteinases, nitric oxide, interleukin-6, and prostaglandin E2. Spine (Phila Pa 1976). (1995) 20(22):2373–8. doi: 10.1097/00007632-199511001-00001
42. Xanthos DN, Sandkühler J. Neurogenic neuroinflammation: inflammatory CNS reactions in response to neuronal activity. Nat Rev Neurosci. (2014) 15(1):43–53. doi: 10.1038/nrn3617
43. Sawicki CM, Kim JK, Weber MD, Faw TD, McKim DB, Madalena KM, et al. Microglia promote increased pain behavior through enhanced inflammation in the spinal cord during repeated social defeat stress. J Neurosci. (2019) 39(7):1139–49. doi: 10.1523/JNEUROSCI.2785-18.2018
44. Biltz RG, Sawicki CM, Sheridan JF, Godbout JP. The neuroimmunology of social-stress-induced sensitization. Nat Immunol. (2022) 23(11):1527–35. doi: 10.1038/s41590-022-01321-z
45. Nutma E, Ceyzériat K, Amor S, Tsartsalis S, Millet P, Owen DR, et al. Cellular sources of TSPO expression in healthy and diseased brain. Eur J Nucl Med Mol Imaging. (2021) 49(1):146–63. doi: 10.1007/s00259-020-05166-2
46. Van Weehaeghe D, Koole M, Schmidt ME, Deman S, Jacobs AH, Souche E, et al. [(11)C]JNJ54173717, a novel P2X7 receptor radioligand as marker for neuroinflammation: human biodistribution, dosimetry, brain kinetic modelling and quantification of brain P2X7 receptors in patients with Parkinson’s disease and healthy volunteers. Eur J Nucl Med Mol Imaging. (2019) 46(10):2051–64. doi: 10.1007/s00259-019-04369-6
47. de Geus-Oei LF, Visser EP, Krabbe PF, van Hoorn BA, Koenders EB, Willemsen AT, et al. Comparison of image-derived and arterial input functions for estimating the rate of glucose metabolism in therapy-monitoring 18F-FDG PET studies. J Nucl Med. (2006) 47(6):945–9.16741303
48. Tonietto M, Rizzo G, Veronese M, Fujita M, Zoghbi SS, Zanotti-Fregonara P, et al. Plasma radiometabolite correction in dynamic PET studies: insights on the available modeling approaches. J Cereb Blood Flow Metab. (2016) 36(2):326–39. doi: 10.1177/0271678X15610585
49. Su CY, Huang GS, Chang WC, Wang CC, Chen CW, Hsu YC. The value of (18)F-FDG PET/MRI in detecting lumbar radiculopathy for selective percutaneous endoscopic discectomy: a case report. Nucl Med Mol Imaging. (2023) 57(5):247–50. doi: 10.1007/s13139-023-00797-3
50. Nee RJ, Jull GA, Vicenzino B, Coppieters MW. The validity of upper-limb neurodynamic tests for detecting peripheral neuropathic pain. J Orthop Sports Phys Ther. (2012) 42(5):413–24. doi: 10.2519/jospt.2012.3988
51. Jorritsma W, de Vries GE, Dijkstra PU, Geertzen JH, Reneman MF. Neck pain and disability scale and neck disability Index: validity of Dutch language versions. Eur Spine J. (2012) 21(1):93–100. doi: 10.1007/s00586-011-1920-5
52. Freynhagen R, Baron R, Gockel U, Tolle TR. painDETECT: a new screening questionnaire to identify neuropathic components in patients with back pain. Curr Med Res Opin. (2006) 22(10):1911–20. doi: 10.1185/030079906X132488
Keywords: neuroinflammation, neuropathic pain, PET imaging, cervical radiculopathy, immunoactivation, PET quantification data collection
Citation: Lutke Schipholt IJ, Scholten-Peeters GGM, Koop MA, Coppieters MW, Boellaard R, van de Giessen E, ter Meulen BC, Coenen M, Vleggeert-Lankamp C, Depaauw PR, van Berckel BNM, Lammerstma AA and Yaqub M (2025) Quantification of neuroinflammation in spinal cord and neuroforamina of patients with painful cervical radiculopathy using [11C]DPA713 PET/CT. Front. Nucl. Med. 5:1569991. doi: 10.3389/fnume.2025.1569991
Received: 2 February 2025; Accepted: 4 August 2025;
Published: 21 August 2025.
Edited by:
Mario Petretta, University of Naples Federico II, ItalyReviewed by:
Gunnar P.H. Dietz, University Medical Center Göttingen, GermanyBrad Christian, University of Wisconsin-Madison, United States
Copyright: © 2025 Lutke Schipholt, Scholten-Peeters, Koop, Coppieters, Boellaard, van de Giessen, ter Meulen, Coenen, Vleggeert-Lankamp, Depaauw, van Berckel, Lammerstma and Yaqub. This is an open-access article distributed under the terms of the Creative Commons Attribution License (CC BY). The use, distribution or reproduction in other forums is permitted, provided the original author(s) and the copyright owner(s) are credited and that the original publication in this journal is cited, in accordance with accepted academic practice. No use, distribution or reproduction is permitted which does not comply with these terms.
*Correspondence: Ivo J. Lutke Schipholt, aS5qLm0ubHV0a2VzY2hpcGhvbHRAdnUubmw=
†ORCID:
Ivo J. Lutke Schipholt
orcid.org/0000-0002-6524-7245
Gwendolyne G. M. Scholten-Peeters
orcid.org/0000-0002-4409-9554
Meghan A. Koop
orcid.org/0000-0002-2293-0554
Michel W. Coppieters
orcid.org/0000-0002-3958-4408
Ronald Boellaard
orcid.org/0000-0002-0313-5686
Elsmarieke van de Giessen
orcid.org/0000-0001-9956-4233
Bastiaan C. ter Meulen
orcid.org/0000-0002-3746-1092
Marieke Coenen
orcid.org/0000-0001-8796-2031
Carmen Vleggeert-Lankamp
orcid.org/0000-0001-9597-7225
Bart N. M. van Berckel
orcid.org/0000-0003-1811-4383
Adriaan A. Lammerstma
orcid.org/0000-0003-1237-2891
Maqsood Yaqub
orcid.org/0000-0003-2122-740X