 Giordana Salvi de Souza1,2
 Pascalle Mossel1,3Joost F. Somsen1
 Laura Providência1Anna L. Bartels4Antoon T. M. Willemsen1Rudi A. J. O. Dierckx1
 Cristiane R. G. Furini2,5
 Adriaan A. Lammertsma1
 Charalampos Tsoumpas1Gert Luurtsema1*
- 1Department of Nuclear Medicine and Molecular Imaging, University of Groningen, University Medical Center Groningen, Groningen, Netherlands
- 2School of Medicine, PUCRS, Porto Alegre, Brazil
- 3Department of Radiology, Leiden University Medical Center, Leiden, Netherlands
- 4Department of Neurology, Ommelander Ziekenhuis Groep, Scheemda, Netherlands
- 5Laboratory of Cognition and Memory Neurobiology, Brain Institute, PUCRS, Porto Alegre, Brazil
Kinetic modelling of brain PET data is crucial for estimating quantitative biological parameters, traditionally requiring arterial sampling. This study evaluated whether arterial samples could be omitted to estimate the image-derived input function (IDIF) using a long axial field-of-view PET scanner. The use of internal carotid arteries (ICA) for IDIF estimation, along with venous samples for plasma-to-whole blood ratios and plasma parent fractions, was also assessed. Six healthy volunteers underwent [18F]MC225 scans with manual arterial sampling. IDIFs were derived from the aortic arch (IDIFAA) and calibrated using manual arterial samples (IDIFAA_CAL). ICA-derived IDIF was also calibrated (IDIFCA_CAL) and compared to IDIFAA_CAL. In a separate group of six volunteers, venous and arterial samples were collected to evaluate plasma-to-whole blood ratios, plasma parent fractions, and IDIF calibration (IDIFCA_CAL_VEN). Volume of distribution (VT) of different brain regions was estimated for all IDIFs techniques, corrected for plasma-to-whole blood ratio and plasma parent fraction (IDIFAA,P, IDIFAA_CAL,P, IDIFICA_CAL,P and IDIFICA_CAL_VEN_P). Our findings revealed discrepancies between IDIFAA and arterial samples, highlighting the importance of calibration. The differences between IDIFAA,P and IDIFAA_CAL,P were 9.2% for area under the curve and 4.0% for brain VT. IDIFICA_CAL,P showed strong agreement with IDIFA_CAL,P, with 1.2% VT difference. Venous sampling showed consistent agreement with arterial sampling for plasma parameters but was unreliable for IDIF calibration, leading to 39% VT differences. This study emphasises that arterial samples are still required for IDIF calibration and reliable VT estimation for [18F]MC225 PET tracer. ICA-derived IDIF, when calibrated, provides reliable VT estimates. Venous sampling is a potential alternative for estimating plasma parameters, but it is unsuitable for IDIF calibration.
Trial Registry: NCT05618119 (clinicaltrials.gov/study/NCT05618119).
1 Introduction
Kinetic modelling translates dynamic positron emission tomography (PET) data into quantitative biological parameters. However, in the absence of a reference tissue, this usually requires an arterial input function (AIF), which most often involves continuous (or serial) arterial blood sampling (1). Manual arterial samples are used to measure the plasma-to-whole blood ratio and to quantify the fraction of the unmetabolised parent compound in plasma over time (2). Although this process is considered the gold standard, it is invasive, leading to associated patient discomfort. In addition, it requires specialised equipment and well-trained personnel (3).
For several applications, non-invasive quantification methods are used, e.g., for tracers with a reference tissue, when an image-derived input function (IDIF) can substitute the AIF, and when simultaneous estimation can be applied (1–5). Recent advances, such as long axial field-of-view (LAFOV) PET scanners, improve the feasibility of estimating whole blood time activity curves (BTAC) or IDIF from large vascular structures, such as the aorta or left ventricle (3, 4, 6–8). Earlier studies using standard short axial field-of-view (SAFOV) PET scanners successfully derived IDIFs from large vessels for tracers such as [15O]H2O and [18F]FDG (9–11).
Building on these foundations, recent studies with LAFOV PET imaging validated the feasibility of extracting IDIFs from different regions of the aorta for different tracers, including [18F]FDG, [15O]H2O, and [18F]DPA-714 (8, 12, 13). However, IDIFs must still be calibrated using manual arterial samples to scale the curves to absolute radioactivity concentrations measured with a gamma counter. For [18F]DPA-714, calibration using manual arterial samples had to be performed for a reliable IDIF estimation (8). Further studies expanded LAFOV PET applications for IDIFs extraction to other tracers, such as [18F]PSMA-1007 and [18F]florbetaben (14, 15).
Despite these advances, the limited availability of LAFOV PET scanners means that many brain PET studies must rely on SAFOV PET systems. In those cases, the internal carotid arteries (ICA) are often used as a blood pool region for IDIF estimation (16–18). However, as previously demonstrated, ICA should not be used without proper partial volume effect (PVE) correction for scanners with at least a 3-mm spatial resolution for [18F]FDG (7). Further correction techniques, such as recovery coefficient-based adjustments, model-based PVE correction, or calibration incorporating arterial and venous blood sampling, can help mitigate these inaccuracies (4, 16).
Regardless of the extraction method, accurate kinetic modelling requires the concentration of non-metabolized tracer within arterial plasma as the true input function. Converting a BTAC or IDIF into a (total) plasma time-activity curve involves using a plasma-to-whole blood ratio. Subsequently, the plasma time-activity curve must be adjusted for the plasma parent fraction to obtain the final IDIF. These adjustments typically require arterial blood samples (2, 4). In theory, venous or arterialised blood could yield concentrations comparable with arterial values, at least at later time points (19, 20). This would allow a less invasive and more patient-friendly quantification. Nevertheless, differences in blood composition and metabolite levels between venous and arterial samples can impact kinetic accuracy (21).
This study focused on [18F]MC225, a tracer used to evaluate P-glycoprotein (P-gp) function (22). P-gp is an efflux transporter that removes xenobiotics from brain endothelial cells into the bloodstream, limiting the permeability of many substrates and central nervous system drugs across the blood-brain barrier (22, 23). Furthermore, no reference tissue is available for [18F]MC225, which hinders non-invasive quantification.
Therefore, the study aimed to:
1. Assess the feasibility of directly estimating the IDIF from the aortic arch (AA) using LAFOV PET, and compare these estimates with manual whole blood samples (gold standard).
2. Validate the use of the internal carotid arteries (ICA) for IDIF estimation in LAFOV PET to assess its applicability to SAFOV PET.
3. Investigate whether venous samples can be used as an alternative to arterial samples to estimate the plasma-to-whole blood ratio and plasma parent fraction and calibrate the IDIF.
2 Methods
2.1 Participants
This study included two groups of participants. Six participants were scanned on a LAFOV PET/CT to validate IDIF estimation from the AA. The same individuals were used to validate the use of ICA to estimate the IDIF. Six other participants were acquired on a SAFOV PET/CT, with arterial and venous blood samples for plasma-to-whole blood ratio and plasma parent fraction estimation. A previous study showed that the performance of both scanners for brain imaging is comparable (24).
The study was approved by the Medical Ethics Review Committee of the University Medical Center Groningen (protocol ID 2022.555, NCT05618119). Written informed consent was obtained from all participants.
2.2 PET acquisition
[18F]MC225 was synthesised at the University Medical Center Groningen (EU-GMP production license: 108964 F), as previously described (23). Following a 60 s injection of 215 ± 72 MBq [18F]MC225 in the antecubital vein, 60 min of list mode data were acquired on either a Biograph Vision Quadra PET/computed tomography (CT) (Siemens Healthineers, Erlangen, Germany) or a Biograph Vision PET/CT (Siemens Healthineers, Erlangen, Germany).
List mode data were binned into 26 frames (1 × 10, 10 × 5, 1 × 10, 2 × 30, 3 × 60, 2 × 150, 4 × 300, 3 × 600 s) and reconstructed using an ordered-subset expectation maximisation algorithm (8 iterations, 5 subsets) with time-of-flight and point-spread function and a voxel size of 1.65 × 1.65 × 1.645 mm3. Data were corrected for attenuation, random coincidences, scattered radiation, dead time, and decay. Image reconstruction for Biograph Vision Quadra was performed using e7tools, a prototype research software package from Siemens Healthineers (Erlangen, Germany).
2.3 Magnetic resonance image (MRI) acquisition
A sagittal 3D T1w MPRAGE (repetition time of 2,300 ms, echo time of 2.31 ms, inversion time of 900 ms, flip angle of 8°, slice thickness of 0.9 mm, voxel size: 0.9 × 0.9 × 0.9 mm3) was acquired for all subjects. MRI scans were obtained as anatomical references for all PET scans. MRI scans were performed using a 3.0 T Magnetom Prisma (Siemens Healthineers, Erlangen, Germany) with a 64-channel head coil.
2.4 Arterial and venous blood sampling
For the subjects of the first cohort (LAFOV PET/CT), manual arterial whole blood samples were collected 5, 10, 20, 40, and 60 min after injection of [18F]MC225. These samples were used to measure plasma-to-whole blood ratio using a gamma counter (2,480 WIZARD 2, Waltham, PerkinElmer, USA), cross-calibrated against the PET scanner. The concentration, measured in Bq/g, was converted to kBq/ml using the whole blood density (1.06 kg/L) (25). As previously described, the plasma parent fraction was determined using thin-layer chromatography analysis with F-254 silica plates (Sigma-Aldrich, Germany) (23).
For the subjects scanned on the SAFOV PET/CT, manual samples were collected from the radial artery and the antecubital fossa vein opposite the injection site at 5, 10, 20, 40, and 60 min after tracer injection.
2.5 IDIF calibration
The IDIF was generated using PMOD PVIEW (version 4.0, PMOD Technologies Ltd., Zürich, Switzerland). Eight circular regions of interest (ROIs), each with a radius of 5 mm, were manually placed in consecutive slices centrally in the AA on an early summed PET image (50–80 s). These ROIs were combined into a single volume of interest (VOI), which was projected onto the dynamic image sequence to generate the IDIF, referred to as IDIFAA.
A hybrid approach, IDIFAA_CAL, was developed to adjust the IDIFAA by incorporating manual arterial blood samples. A three-exponential fit (17) was applied to manual arterial samples, and concentration values were derived between 220 s and 535 s intervals, timeframes close to the peak. A calibration factor (CF) was calculated by averaging the ratio between the fitted concentration values (denoted as and the IDIFAA values (denoted as over the interval from 220 s to 535 s, as represented by the equation:
where N denotes the total number of time points within the interval from 220 s to 535 s, is the concentration at time t, derived from the three-exponential fit applied to the manual arterial blood samples and is the concentration at time t, extracted from the IDIFAA.
The CF was then applied to correct the peak portion of the raw IDIF (0–280 s). For the tail portion of the curve, covering the interval from 220 s to 3,600 s, the previously calibrated PET-derived concentration values (at 220 s and 280 s) were combined with additional manual arterial sample data. A 3-exponential fit was applied to this combined dataset to estimate the mid-frame concentration values. Finally, the adjusted peak and the fitted tail were merged to form the calibrated IDIFAA. The methodology to generate the IDIFAA_CAL is summarised in Figure 1.
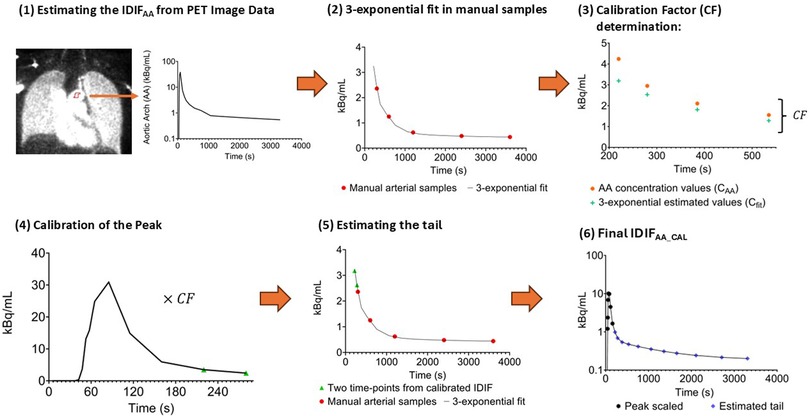
Figure 1. Overview of the methodology for estimating IDIFAA_CAL. (1) Generation of the initial IDIF (IDIFAA) by placing circular ROIs in the aortic arch on an early PET image. (2) A 3-exponential fit is applied to manual arterial samples, and concentration values are derived between 220 s and 535 s intervals. (3) The fitted concentration and IDIFAA values are compared between 220 and 535 s to calculate the calibration factor (CF). (4) The CF is applied to scale the early part of IDIFAA (0–280 s). (5) The tail is estimated using a 3-exponential fit to the manual arterial samples, incorporating the concentration values at 220 s and 280 s. (6) The final IDIFAA_CAL is created by combining the scaled peak with the re-estimated tail.
2.6 Plasma corrections
IDIFAA and IDIFAA_CAL were multiplied by the plasma-to-whole blood ratio curve, which was obtained by fitting an exponential function to manual arterial sample data, to apply this correction. Moreover, the plasma parent fraction was fitted to a Hill function, as previously described (22). The resulting IDIFAA_P and IDIFAA_CAL_P curves include both plasma-to-whole blood ratio and plasma parent fraction corrections, with “P” indicating the application of both corrections.
2.7 IDIF for internal carotid artery
Sixteen circular ROIs, each 5 mm in radius, were manually placed in consecutive slices in the ICA on an early summed PET image (50–80 s). No partial volume correction was applied in the PET images. Four maximum pixel values from each ROI were determined and combined into a VOI to extract the concentration values for IDIFICA (7, 26). Next, IDIFICA_CAL_P was obtained using the same method as IDIFAA_CAL_P.
2.8 Venous sampling validation
Similar to the procedure for IDIFICA_CAL_P, IDIFICA_CAL_VEN was obtained using whole blood concentrations from the venous samples for IDIF calibration. In addition, plasma-to-whole blood ratio and plasma parent fraction were also estimated using venous samples using the same method described above. IDIFICA_CAL_VEN_P was derived, corrected by plasma-to-whole blood ratio and plasma parent fraction derived from venous samples.
2.9 Brain PET quantification
Motion correction was applied to all subjects using rigid transformation with the first 15 frames as a reference. PET images were co-registered to the individual anatomical T1-weighted MRI and spatially normalised to the Montreal Neurological Institute space using PNEURO PMOD (version 4.0, PMOD Technologies Ltd., Zürich, Switzerland). Brain regions of interest were defined based on Hammer's maximum probability atlas (27), including occipital, orbitofrontal, parietal, temporal cortices, cerebellum, whole brain white (WM), and grey (GM) matter.
2.10 Pharmacokinetic analysis
Pharmacokinetic analysis was performed using PKIN PMOD (version 4.0, PMOD Technologies Ltd., Zürich, Switzerland). Weighting factors based on time frame duration and decay were applied to the tissue TACs. Blood delay was estimated by fitting the first 10 min of whole brain GM data to a one-tissue compartment model. Regional tissue TACs were fitted to a reversible two-tissue compartment model, with fractional blood volume (Vb) included as a fitting parameter and delay fixed to the estimate obtained for GM, yielding the volume of distribution (VT) as an outcome measure (22, 28).
2.11 Statistical analysis
Descriptive statistics are presented as mean ± standard deviation (SD). Statistical analyses were conducted using GraphPad Prism software (Boston, USA). The area under the curve (AUC) was used to compare IDIF estimations from different methods. The correlation was assessed using Pearson correlation analysis, and correlation (r), slope, intercept, and intraclass correlation coefficient (ICC) values were reported. Bias and agreement between methods were assessed using Bland-Altman plots, and the relationship between VT values was quantified using linear regression analysis. For all methods that estimated VT, the percentage of difference was calculated.
3 Results
To facilitate understanding of the various input functions and calibration methods used in this study, we summarise the relevant acronyms and their definitions in Table 1. This table outlines the different IDIFs derived from the AA and ICA, the corresponding calibration approaches, manual arterial and venous blood sampling, and adjustments for plasma-to-whole blood ratio and plasma parent fraction.
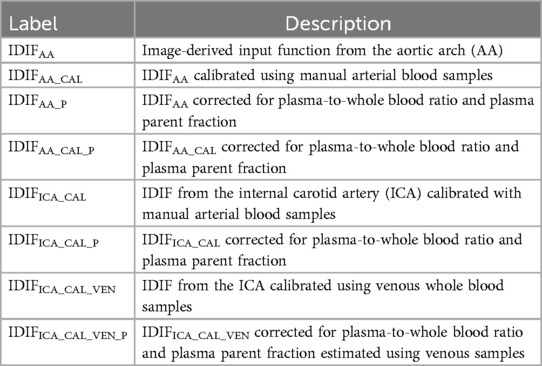
Table 1. Summary of acronyms and descriptions of IDIF and calibration methods.
3.1 Comparison of IDIFAA_P and IDIFAA_CAL_P
Figure 2 illustrates an example of IDIFAA and IDIFAA_CAL from the same subject, comparing it with the manual arterial samples. To assess the difference between the IDIFs values and manual arterial samples, the ratio of manual arterial samples to IDIFAA and IDIFAA_CAL was calculated. These results are shown in Figure 3A. The AUCs of both IDIFs were estimated and compared (Figure 3B), with a mean AUC difference of 9.2%. Correlation (Figure 3C) and Bland-Altman plot (Figure 3D) were calculated. There were issues with blood sampling, plasma-to-whole blood ratio and metabolites estimation. In the Supplementary Material, all the reasons are explained. Individual VT values across brain regions using IDIFAA_P and IDIFAA_CAL_P are provided in Supplementary Material Figure S1. Table 2 summarises the quantitative analysis of VT differences, including bias, slope, Y-intercept, and ICC for the regions evaluated. Despite the minor differences in AUC and VT values, the correlation between IDIFAA_P and IDIFAA_CAL_P ranged from 0.74 to 0.85, and the ICC ranged from 0.60 to 0.78, indicating that calibration improves the accuracy of the derived IDIF.
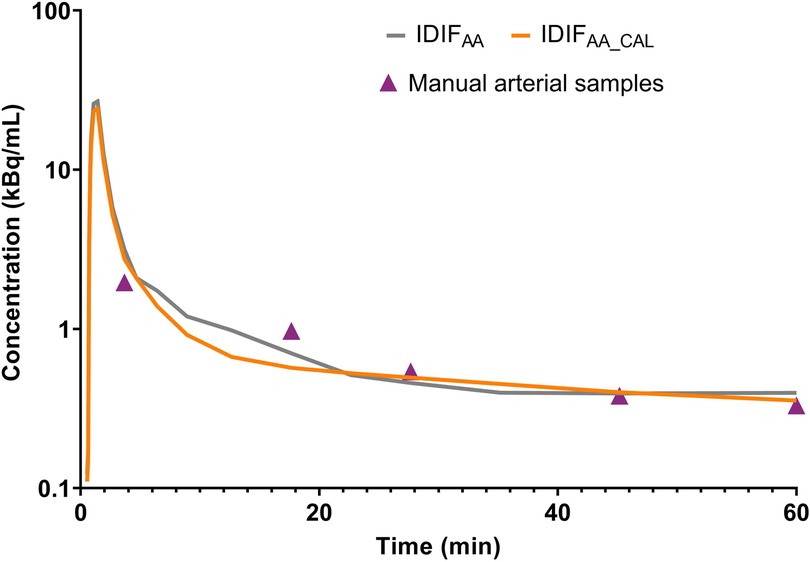
Figure 2. Comparison of IDIFAA, IDIFAA_CAL and manual arterial samples for one subject (S05).
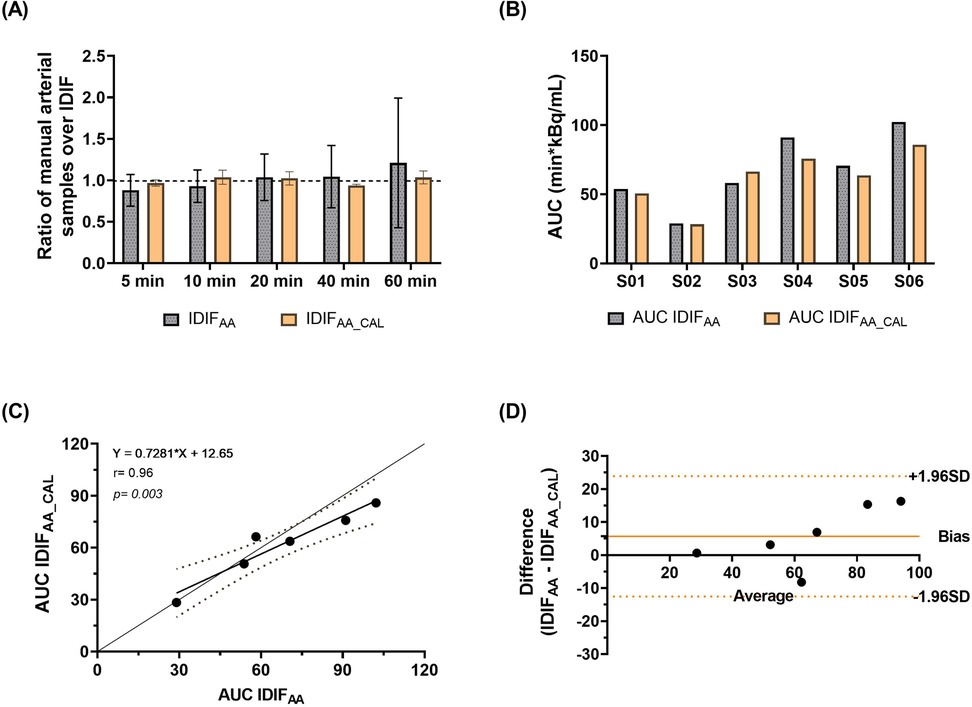
Figure 3. Evaluation of IDIF derivation methods. (A) The ratio of manual arterial samples to IDIFAA and IDIFAA_CAL values. (B) Comparison of AUCs for the two IDIF methods. (C) Correlation between IDIFAA and IDIFAA_CAL. (D) Bland-Altman plot assessing the degree of agreement between the approaches.
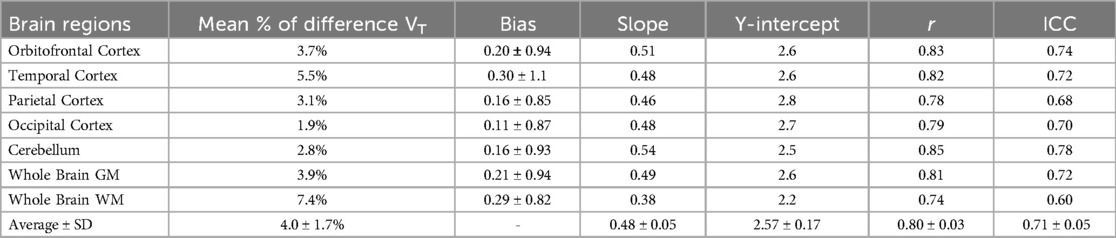
Table 2. Comparison of VT values across subjects obtained using IDIFAA_P and IDIFAA_CAL_P.
3.2 Validation of ICA
The comparison between IDIFAA, IDIFAA_CAL, and IDIFICA_CAL is presented in Supplementary Material Figure S2, where ICA was validated as a surrogate for IDIFAA_CAL across six participants. Individual VT values across brain regions using IDIFAA_CAL_P and IDIFICA_CAL_P are provided in Supplementary Material Figure S3. Table 3 compares VT values across various brain regions derived using IDIFICA_CAL_P and IDIFAA_CAL_P.
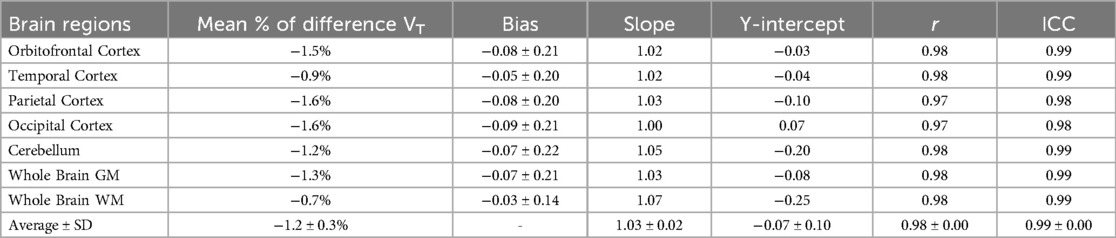
Table 3. Comparison of mean VT estimates for IDIFICA_CAL_P vs. IDIFAA_CAL_P across different brain regions.
The Bland-Altman analysis (Figure 4A) demonstrates agreement between the two approaches, with minimal bias and low variability. Figure 4B presents the correlation analysis (r = 0.99, p < 0.001), with a mean VT difference of 1.2% across brain regions and an ICC of 0.99, underscoring the high consistency between IDIFICA_CAL_P and IDIFAA_CAL_P. In addition, Supplementary Material Figure S4 presents an example of whole brain grey matter TACs from subject SO5, fitted using the three IDIFs evaluated: IDIFAA_P, IDIFAA_CAL_P, and IDIFICA_CAL_P.
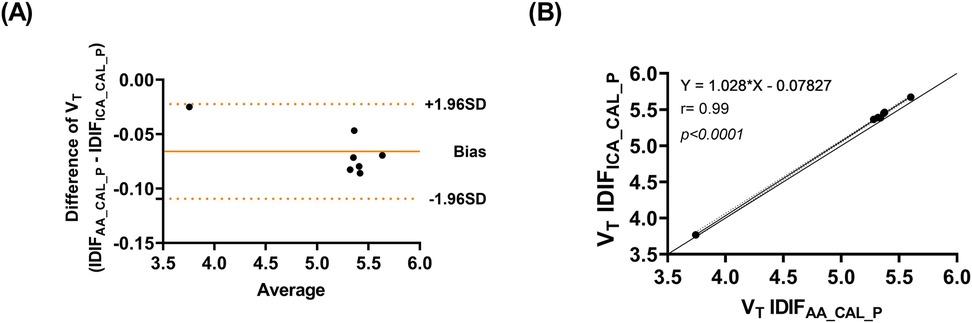
Figure 4. (A) Bland-Altman plot comparing VT values estimated using IDIFICA_CAL_P and IDIFAA_CAL_P (B) correlation of VT values estimated using IDIFICA_CAL_P and IDIFAA_CAL_P.
3.3 Validation of venous samples
Comparisons of whole blood, plasma concentrations, plasma-to-whole blood ratio, and plasma parent fraction values obtained with arterial and venous samples are shown in Figure 5. Higher variability in the whole blood and plasma concentrations was found during the first 5 min, both in arterial and venous samples. Figure 6 presents the correlation and Bland-Altman plots comparing arterial and venous samples for plasma-to-whole blood ratio and plasma parent fraction. Each dot in the Bland-Altman plot represents a time point. To assess the accuracy of the IDIF, the peak and AUC values were compared between IDIFICA_CAL_P and IDIFICA_CAL_VEN_P, as illustrated in Figure 7. From six subjects, two individuals, IDIFICA_CAL_VEN_P, could not be estimated, and VT was not estimated: the first subject did not have plasma parent fraction estimated with venous samples, and the second subject had missing venous samples at the 5 and 60 min. For the third subject (S10), the 5 min sample was missing, but the analysis was conducted using the remaining venous samples. The VT values for various brain regions were compared using the IDIFICA_CAL_P and IDIFICA_CAL_VEN_P to evaluate the reliability of venous sampling for calibration. The comparison presented in Table 4, highlights the percentage difference in VT values between the two IDIFs across different brain regions. Calibration of IDIF derived from the ICA using venous samples (IDIFICA_CAL_VEN_P) did not yield reliable VT estimates, with discrepancies as large as 39% compared to IDIFICA_CAL_P.
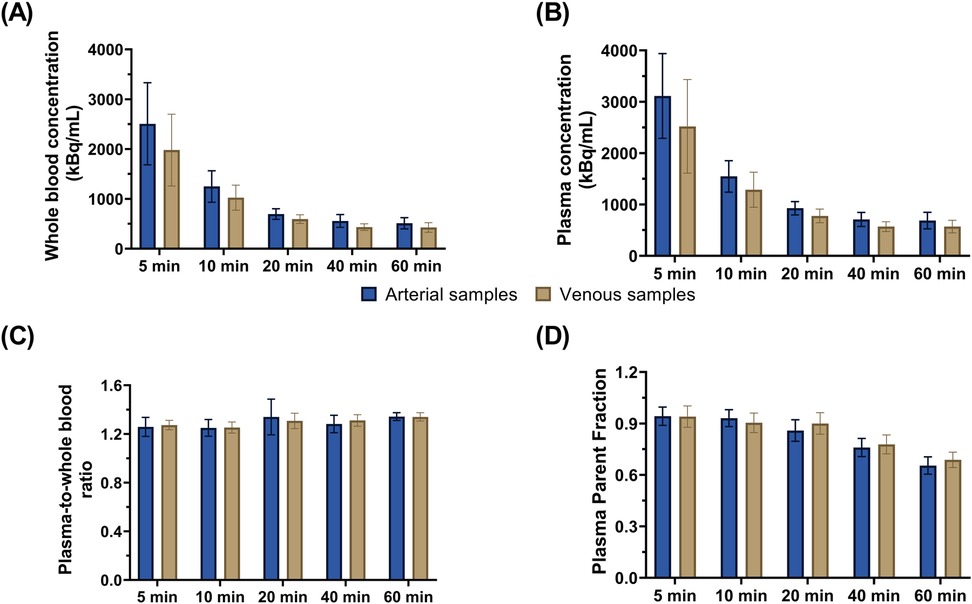
Figure 5. Concentration values from arterial and venous samples for (A) whole blood and (B) plasma. Comparison of arterial and venous manual samples for (C) plasma-to-whole blood ratio and (D) plasma parent fraction. Error bars represent standard deviation.
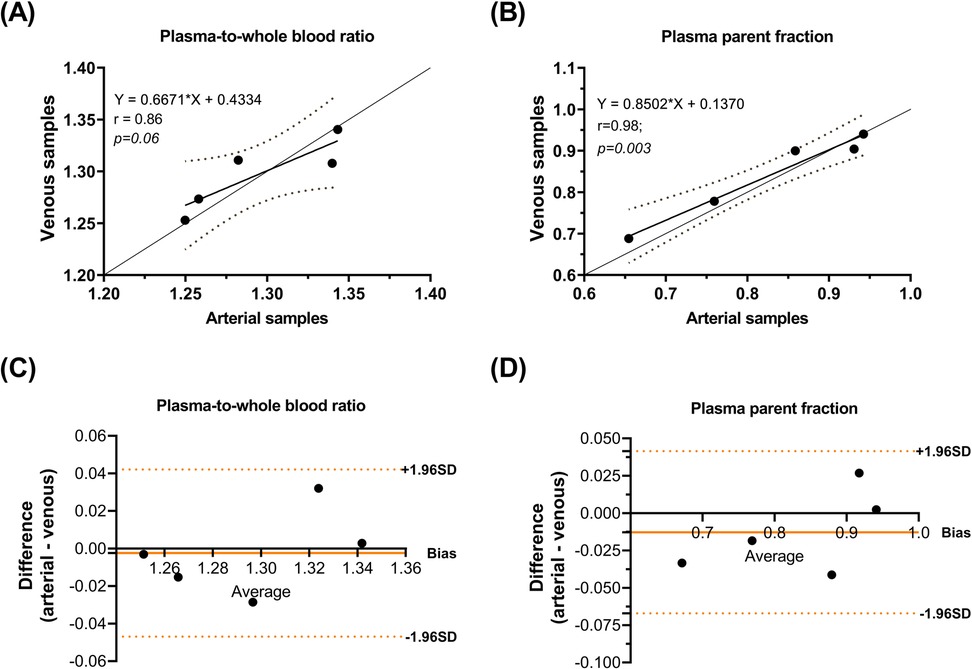
Figure 6. Correlation of (A) plasma-to-whole blood ratio and (B) plasma parent fraction. Bland-Altman plot differences between arterial and venous samples for (C) plasma-to-whole blood ratio and (D) plasma parent fraction.
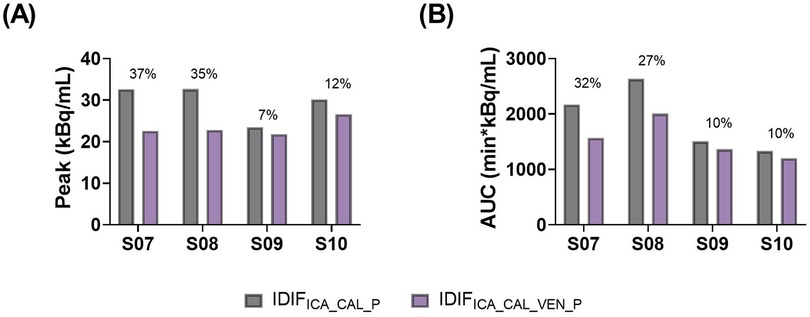
Figure 7. Comparison of (A) peak and (B) AUC values from IDIFICA_CAL_P and IDIFICA_CAL_VEN_P. The percentage numbers represent the percentage difference between both methods.
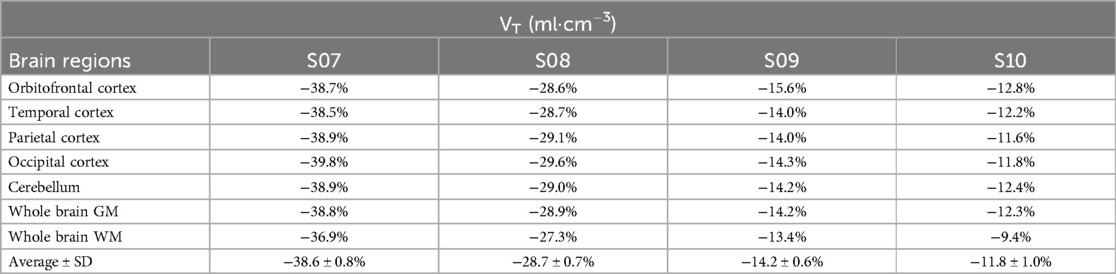
Table 4. Percentage difference in VT between IDIFICA_CAL_P and IDIFICA_CAL_VEN_P across different brain regions.
Supporting figures are provided in the Supplementary Material. Supplementary Material Figure S5 compares whole blood TACs between IDIFICA_CAL and IDIFICA_CAL_VEN. The resulting IDIFs derived from these curves are shown in Supplementary Material Figure S6. The impact of these differences on regional VT values is illustrated in Supplementary Material Figure S7, and a representative example of grey matter TAC from subject SO7, fitted using both IDIFs, is shown in Supplementary Material Figure S8.
4 Discussion
This study evaluated whether IDIF derived from the AA using LAFOV PET requires additional calibration with manual arterial samples for [18F]MC225 PET tracer. Moreover, the use of ICA was assessed as a surrogate for AA due to its accessibility in brain PET imaging, particularly in SAFOV PET/CT scanners. To address the limitations of performing arterial sampling, venous sampling was explored as a less invasive alternative to reduce patient discomfort and simplify the blood collection process.
Comparison between IDIFAA and manual arterial samples revealed differences in tracer concentration (Figure 3A). IDIFAA underestimated concentrations at early time points (e.g., 5 min) and overestimated them at late time points (e.g., 60 min). This overestimation is likely attributable to PVE - spill-in from adjacent tissues, such as the myocardium and lungs, which showed high tracer concentrations (29–31). In addition to PVE, scatter correction and reconstruction algorithm settings may complicate accurate aortic concentration estimations (4, 8, 29). These differences underscore the challenges in achieving accurate corrections, calibrations, and image reconstruction settings.
As expected, IDIFAA_CAL achieved ratios close to 1. The mean AUC difference between IDIFAA and IDIFAA_CAL was 9.2%, and the mean VT difference was 4.0%. Despite the low AUC and VT differences, the correlation ranged from 0.74 to 0.85, and the ICC ranged from 0.60 to 0.78; these metrics do not fully validate the use of IDIFAA alone. Calibration improved the reliability of the IDIFAA by aligning the measured tracer concentrations from manual arterial samples with those from the image-derived. This correction helped reduce discrepancies in tracer concentration estimates, especially in the early and late phases of the IDIF (Figure 2).
In addition, the use of ICA was explored as an alternative to using AA for IDIF estimation. The results showed that IDIFICA_CAL yielded highly consistent results when calibrated similarly to IDIFAA_CAL. Bland-Altman analysis confirmed minimal bias and low variability between the two methods, with a mean VT difference of 1.2% across brain regions. The ICA-based approach achieved a high mean correlation (0.98) and ICC (0.99), indicating its reliability as a surrogate for the AA-derived input function.
Furthermore, the feasibility of venous sampling was investigated as an alternative to arterial sampling, similar to previous studies investigating venous sampling for other tracers (21, 32–34). For [18F]MC225, good agreement in plasma-to-whole blood ratio and plasma parent fraction was found between venous and arterial samples, as shown in the Bland-Altman plot (Figure 6). However, calibrating IDIFICA using venous samples (IDIFICA_CAL_VEN_P) did not provide reliable estimates of VT, with differences up to 39% compared with IDIFICA_CAL_P. These discrepancies may stem from the differences in whole blood concentrations between venous and arterial samples at 5 min time-point (Figure 5A), which likely influenced IDIF calibration. The arterio-venous equilibrium can explain the difference in this time-point (16, 33). While venous sampling shows promise for less invasive protocols, arterial samples remain essential for accurate VT estimation. Enhancing venous sampling techniques or incorporating correction methods might improve its utility in less-invasive quantification.
These findings have significant implications for PET imaging research and clinical practice. Validation of AA-derived IDIF emphasises the need for manual arterial sampling to ensure reliable kinetic analysis for [18F]MC225. Moreover, the validation of ICA for IDIF estimation offers a practical alternative for brain imaging studies, particularly in SAFOV PET scanners. This approach could be extended to other tracers, enabling (limited) discrete arterial sampling rather than continuous sampling protocols. Although limited to VT estimation, venous sampling presents a potential pathway toward reduced invasiveness for estimating plasma-to-whole blood ratio and plasma parent fraction. These findings contribute to developing patient-friendly scan protocols that may enhance compliance and streamline clinical trial procedures. To eliminate the need for arterial samples for calibrating the IDIF, further research must understand how venous sampling can be optimised, how to calibrate the IDIF, and how venous sampling can be optimised and potential errors can be addressed, particularly at early time points (e.g., the first sample). If omitting the first sample reduced the discrepancies observed, this could lead to more accurate calibration without arterial sampling, although this would need validation.
A key limitation of this study is the relatively small sample size (n = 6 per group), which restricts the statistical power of our analysis and limits the generalizability of our findings. However, given the nature of the study, increasing the sample size is unlikely to change the overall conclusion that calibration remains essential for reliable input function estimation. Furthermore, occasional missing data points due to issues with manual blood sampling may have introduced variability in the calibration and estimation of input functions. Future research should focus on developing and validating less invasive alternatives to arterial sampling, such as population-based corrections for the plasma-to-whole blood ratio and parent fraction. Their implementation in research settings requires rigorous validation in patient cohorts to ensure equivalence in quantitative outcomes. Furthermore, a better understanding of why calibration remains essential for certain tracers may inform the design of more accurate non-invasive methods. This could include advancements in image reconstruction algorithms and improved spillover correction strategies. Other strategies, such as single-point blood sampling or Simultaneous Estimation of the Input Function (SIME), also warrant further exploration. SIME offers a fully non-invasive framework for input function estimation by leveraging data across multiple brain regions without requiring direct invasive measurements (2, 5, 35, 36). It may represent a viable alternative to traditional arterial sampling in the context of PET quantification.
In conclusion, this study demonstrated that IDIF derived from LAFOV PET images requires calibration with manual arterial samples for accurate VT estimation. While ICA was validated as a surrogate for the AA after calibration, venous sampling proved insufficient for IDIF calibration, limiting its utility for precise VT estimation. However, venous samples showed promise for less invasive measurement of plasma-to-whole blood ratios and plasma parent fractions.
Data availability statement
The datasets generated during and/or analyzed during the current study are available from the corresponding author upon reasonable request.
Ethics statement
The studies involving humans were approved by Medical Ethics Review Committee of the University Medical Center Groningen (protocol ID 2022.555, NCT05618119). The studies were conducted in accordance with the local legislation and institutional requirements. The participants provided their written informed consent to participate in this study.
Author contributions
GS: Investigation, Data curation, Writing – original draft, Conceptualization, Formal analysis, Methodology. PM: Writing – review & editing, Investigation. JS: Writing – review & editing, Investigation. LP: Writing – review & editing. AB: Writing – review & editing. AW: Conceptualization, Writing – review & editing. RD: Writing – review & editing. CF: Writing – review & editing. AL: Conceptualization, Writing – review & editing, Supervision, Methodology. CT: Supervision, Writing – review & editing, Methodology, Conceptualization. GL: Project administration, Methodology, Conceptualization, Writing – review & editing, Supervision.
Funding
The author(s) declare that financial support was received for the research and/or publication of this article. Part of this work was supported by the Abel Tasman Talent Program (ATTP) of the Graduate School of Medical Sciences of the University of Groningen, the Netherlands.
Conflict of interest
The authors declare that the research was conducted in the absence of any commercial or financial relationships that could be construed as a potential conflict of interest.
The author(s) declared that they were an editorial board member of Frontiers, at the time of submission. This had no impact on the peer review process and the final decision.
Generative AI statement
The author(s) declare that no Generative AI was used in the creation of this manuscript.
Publisher's note
All claims expressed in this article are solely those of the authors and do not necessarily represent those of their affiliated organizations, or those of the publisher, the editors and the reviewers. Any product that may be evaluated in this article, or claim that may be made by its manufacturer, is not guaranteed or endorsed by the publisher.
Supplementary material
The Supplementary Material for this article can be found online at: https://www.frontiersin.org/articles/10.3389/fnume.2025.1597902/full#supplementary-material
References
1. Lammertsma AA, Hume SP. Simplified reference tissue model for PET receptor studies. Neuroimage. (1996) 4:153–8. doi: 10.1006/nimg.1996.0066
2. van der Weijden CWJ, Mossel P, Bartels AL, Dierckx RAJO, Luurtsema G, Lammertsma AA, et al. Non-invasive kinetic modelling approaches for quantitative analysis of brain PET studies. Eur J Nucl Med Mol Imaging. (2023) 50:1636–50. doi: 10.1007/s00259-022-06057-4
3. Dimitrakopoulou-Strauss A, Pan L, Sachpekidis C. Long axial field of view (LAFOV) PET-CT: implementation in static and dynamic oncological studies. Eur J Nucl Med Mol Imaging. (2023) 50:3354–62. doi: 10.1007/s00259-023-06222-3
4. Volpi T, Maccioni L, Colpo M, Debiasi G, Capotosti A, Ciceri T, et al. An update on the use of image-derived input functions for human PET studies: new hopes or old illusions? EJNMMI Res. (2023) 13:97. doi: 10.1186/s13550-023-01050-w
5. Dassanayake P, Anazodo UC, Liu L, Narciso L, Iacobelli M, Hicks J, et al. Development of a minimally invasive simultaneous estimation method for quantifying translocator protein binding with [18F]FEPPA positron emission tomography. EJNMMI Res. (2023) 13:1. doi: 10.1186/s13550-023-00950-1
6. Sari H, Eriksson L, Mingels C, Alberts I, Casey ME, Afshar-Oromieh A, et al. Feasibility of using abbreviated scan protocols with population-based input functions for accurate kinetic modeling of [18F]-FDG datasets from a long axial FOV PET scanner. Eur J Nucl Med Mol Imaging. (2023) 50:257–65. doi: 10.1007/s00259-022-05983-7
7. Providência L, van der Weijden CWJ, Mohr P, van Sluis J, van Snick JH, Slart RHJA, et al. Can internal carotid arteries be used for noninvasive quantification of brain PET studies? J Nucl Med. (2024) 65:600–6. doi: 10.2967/jnumed.123.266675
8. Palard-Novello X, Visser D, Tolboom N, Smith CLC, Zwezerijnen G, van de Giessen E, et al. Validation of image-derived input function using a long axial field of view PET/CT scanner for two different tracers. EJNMMI Phys. (2024) 11:25. doi: 10.1186/s40658-024-00628-0
9. Harms HJ, Knaapen P, de Haan S, Halbmeijer R, Lammertsma AA, Lubberink M. Automatic generation of absolute myocardial blood flow images using [15O]H2O and a clinical PET/CT scanner. Eur J Nucl Med Mol Imaging. (2011) 38:930–9. doi: 10.1007/s00259-011-1730-3
10. Reed MB, Godbersen GM, Vraka C, Rausch I, Ponce de León M, Popper V, et al. Comparison of cardiac image-derived input functions for quantitative whole body [18F]FDG imaging with arterial blood sampling. Front Physiol. (2023) 14:1074052. doi: 10.3389/fphys.2023.1074052
11. Van Der Weerdt AP, Klein LJ, Boellaard R, Visser CA, Visser FC, Lammertsma AA. Image-derived input functions for determination of MRGlu in cardiac 18 F-FDG PET scans. J Nucl Med. (2001) 42:1622–9.11696630
12. Andersen TL, Andersen FL, Haddock B, Rosenbaum S, Larsson HBW, Law I, et al. Automated quantitative image-derived input function for the estimation of cerebral blood flow using oxygen-15-labelled water on a long-axial field-of-view PET/CT scanner. Diagnostics. (2024) 14:1590. doi: 10.3390/diagnostics14151590
13. Smith CLC, Zwezerijnen GJC, den Hollander ME, Greuter HNJM, Gerards NR, Zijlstra J, et al. Validating image-derived input functions of dynamic 18F-FDG long axial field-of-view PET/CT studies. Frontiers in Nuclear Medicine. (2025) 5:1556848. doi: 10.3389/fnume.2025.1556848
14. Holy EN, Li E, Bhattarai A, Fletcher E, Alfaro ER, Harvey DJ, et al. Non-invasive quantification of 18F-florbetaben with total-body EXPLORER PET. EJNMMI Res. (2024) 14:39. doi: 10.1186/s13550-024-01104-7
15. Sachpekidis C, Pan L, Groezinger M, Strauss DS, Dimitrakopoulou-Strauss A. Combined whole-body dynamic and static PET/CT with low-dose [18F]PSMA-1007 in prostate cancer patients. Eur J Nucl Med Mol Imaging. (2024) 51:2137–50. doi: 10.1007/s00259-024-06620-1
16. Zanotti-Fregonara P, Chen K, Liow J-S, Fujita M, Innis RB. Image-derived input function for brain PET studies: many challenges and few opportunities. J Cereb Blood Flow Metab. (2011) 31:1986–98. doi: 10.1038/jcbfm.2011.107
17. Mourik JEM, Lubberink M, Schuitemaker A, Tolboom N, van Berckel BNM, Lammertsma AA, et al. Image-derived input functions for PET brain studies. Eur J Nucl Med Mol Imaging. (2009) 36:463–71. doi: 10.1007/s00259-008-0986-8
18. van der Weijden CWJ, van der Hoorn A, Wang Y, Willemsen ATM, Dierckx RAJO, Lammertsma AA, et al. Investigation of image-derived input functions for non-invasive quantification of myelin density using [11C]MeDAS PET. Neuroimage. (2022) 264:119772. doi: 10.1016/j.neuroimage.2022.119772
19. van der Weerdt AP, Klein LJ, Visser CA, Visser FC, Lammertsma AA. Use of arterialised venous instead of arterial blood for measurement of myocardial glucose metabolism during euglycaemic-hyperinsulinaemic clamping. Eur J Nucl Med Mol Imaging. (2002) 29:663–9. doi: 10.1007/s00259-002-0772-y
20. Ito H, Koyama M, Goto R, Kawashima R, Ono S, Atsumi H, et al. Cerebral blood flow measurement with iodine-123-IMP SPECT, calibrated standard input function and venous blood sampling. J Nucl Med. (1995) 36:2339.8523128
21. Tomasi G, Veronese M, Bertoldo A, Smith CB, Schmidt KC. Substitution of venous for arterial blood sampling in the determination of regional rates of cerebral protein synthesis with L-[1- 11 C]leucine PET: a validation study. J Cereb Blood Flow Metab. (2019) 39:1849–63. doi: 10.1177/0271678X18771242
22. Mossel P, Arif WM, De Souza GS, Varela LG, van der Weijden CWJ, Boersma HH, et al. Quantification of P-glycoprotein function at the human blood-brain barrier using [18F]MC225 and PET. Eur J Nucl Med Mol Imaging. (2023) 50:3917–27. doi: 10.1007/s00259-023-06363-5
23. Savolainen H, Windhorst AD, Elsinga PH, Cantore M, Colabufo NA, Willemsen AT, et al. Evaluation of [ 18 F]MC225 as a PET radiotracer for measuring P-glycoprotein function at the blood–brain barrier in rats: kinetics, metabolism, and selectivity. J Cereb Blood Flow Metab. (2017) 37:1286–98. doi: 10.1177/0271678X16654493
24. Turmacu V, Mohr P, Providencia L, Salvi de Souza G, Tsoumpas C. Comparing short versus long axial field-of-view brain PET imaging—a phantom study. In: Tsoumpas C, Providência L, Lammertsma AA, Slart RHJA, Glaudemans AWJM, editors. Total Body PET Conference Book. Groningen: Frontiers Media SA (2024). p. 158–60.
25. Berger MJ, Coursey S, Zucker MA, Chang J. NIST Standard reference database 124. NISTIR. (2017). doi: 10.18434/T4NC7P
26. Mourik JEM, Lubberink M, Klumpers UMH, Comans EF, Lammertsma AA, Boellaard R. Partial volume corrected image derived input functions for dynamic PET brain studies: methodology and validation for [11C]flumazenil. Neuroimage. (2008) 39:1041–50. doi: 10.1016/j.neuroimage.2007.10.022
27. Hammers A, Allom R, Koepp MJ, Free SL, Myers R, Lemieux L, et al. Three-dimensional maximum probability atlas of the human brain, with particular reference to the temporal lobe. Hum Brain Mapp. (2003) 19:224–47. doi: 10.1002/hbm.10123
28. Mossel P, Salvi de Souza G, Willemsen ATM, Stormezand GN, Colabufo NA, Toyohara J, et al. Measurement of cyclosporin induced changes in P-glycoprotein function at the human blood-brain barrier using [18F]MC225 and PET. Eur J Nucl Med Mol Imaging. (2025) doi: 10.1007/s00259-025-07320-0
29. Boellaard R, Van Lingen A, Lammertsma AA. Experimental and clinical evaluation of iterative reconstruction (OSEM) in dynamic PET: quantitative characteristics and effects on kinetic modeling. J Nucl Med. (2001) 42:808–17.11337581
30. Akerele MI, Karakatsanis NA, Deidda D, Cal-Gonzalez J, Forsythe RO, Dweck MR, et al. Comparison of correction techniques for the spillin effect in emission tomography. IEEE Trans Radiat Plasma Med Sci. (2020) 4:422–32. doi: 10.1109/TRPMS.2020.2980443
31. Croteau E, Lavallée É, Labbe SM, Hubert L, Pifferi F, Rousseau JA, et al. Image-derived input function in dynamic human PET/CT: methodology and validation with 11C-acetate and 18F-fluorothioheptadecanoic acid in muscle and 18F-fluorodeoxyglucose in brain. Eur J Nucl Med Mol Imaging. (2010) 37:1539–50. doi: 10.1007/s00259-010-1443-z
32. Ng Y, Moberly SP, Mather KJ, Brown-Proctor C, Hutchins GD, Green MA. Equivalence of arterial and venous blood for [11C]CO2-metabolite analysis following intravenous administration of 1-[11C]acetate and 1-[11C]palmitate. Nucl Med Biol. (2013) 40:361–5. doi: 10.1016/j.nucmedbio.2012.11.011
33. Galovic M, Erlandsson K, Fryer TD, Hong YT, Manavaki R, Sari H, et al. Validation of a combined image derived input function and venous sampling approach for the quantification of [18F]GE-179 PET binding in the brain. Neuroimage. (2021) 237:118194. doi: 10.1016/j.neuroimage.2021.118194
34. Zanotti-Fregonara P, Hines CS, Zoghbi SS, Liow J-S, Zhang Y, Pike VW, et al. Population-based input function and image-derived input function for [11C](R)-rolipram PET imaging: methodology, validation and application to the study of major depressive disorder. Neuroimage. (2012) 63:1532–41. doi: 10.1016/j.neuroimage.2012.08.007
35. Jochimsen TH, Zeisig V, Schulz J, Werner P, Patt M, Patt J, et al. Fully automated calculation of image-derived input function in simultaneous PET/MRI in a sheep model. EJNMMI Phys. (2016) 3(1):2. doi: 10.1186/s40658-016-0139-2
Keywords: long axial field of view PET, pharmacokinetics, venous sampling, quantitative analysis, IDIF, kinetic analyses
Citation: Salvi de Souza G, Mossel P, Somsen JF, Providência L, Bartels AL, Willemsen ATM, Dierckx RAJO, Furini CRG, Lammertsma AA, Tsoumpas C and Luurtsema G (2025) Evaluating image-derived input functions for cerebral [18F]MC225 PET studies. Front. Nucl. Med. 5:1597902. doi: 10.3389/fnume.2025.1597902
Received: 21 March 2025; Accepted: 19 May 2025;
Published: 5 June 2025.
Edited by:
Ning Guo, Massachusetts General Hospital and Harvard Medical School, United StatesReviewed by:
Alan Miranda, University of Antwerp, BelgiumYansong Zhu, University of California, Davis, United States
Copyright: © 2025 Salvi de Souza, Mossel, Somsen, Providência, Bartels, Willemsen, Dierckx, Furini, Lammertsma, Tsoumpas and Luurtsema. This is an open-access article distributed under the terms of the Creative Commons Attribution License (CC BY). The use, distribution or reproduction in other forums is permitted, provided the original author(s) and the copyright owner(s) are credited and that the original publication in this journal is cited, in accordance with accepted academic practice. No use, distribution or reproduction is permitted which does not comply with these terms.
*Correspondence: Gert Luurtsema, Zy5sdXVydHNlbWFAdW1jZy5ubA==