- 1Division of Plant Biotechnology, Institute of Environmentally-Friendly Agriculture, College of Agriculture and Life Sciences, Chonnam National University, Gwangju, South Korea
- 2Trident School of Biotech Sciences, Trident Academy of Creative Technology, Bhubaneswar, India
- 3Department of Biochemistry and Molecular Biophysics, Kansas State University, Manhattan, KS, USA
- 4Department of Life Science and Biotechnology, College of Natural Sciences, Soonchunhyang University, Asan, South Korea
Autophagy is a process that is necessary during starvation, as it replenishes metabolic precursors by eliminating damaged organelles. Autophagy is mediated by more than 35 autophagy-related (Atg) proteins that participate in the nucleation, elongation, and curving of the autophagosome membrane. In a pursuit to address the role of autophagy during development and immune resistance of the mealworm beetle, Tenebrio molitor, we screened ATG gene sequences from the whole-larva transcriptome database. We identified a homolog of ATG13 gene in T. molitor (designated as TmATG13) that comprises a cDNA of 1176 bp open reading frame (ORF) encoding a protein of 391 amino acids. Analyses of the structure-specific features of TmAtg13 showed an intrinsically disordered middle and C-terminal region that was rich in regulatory phosphorylation sites. The N-terminal Atg13 domain had a HORMA (Hop1, Rev7, and Mad2) fold containing amino acid residues conserved across the Atg13 insect orthologs. A quantitative reverse-transcription-polymerase chain reaction analysis revealed that TmATG13 was expressed ubiquitously during all developmental stages of the insect. TmATG13 mRNA expression was high in the fat body and gut of the larval and adult stages of the insect. The TmATG13 transcripts were expressed at a high level until 6 days of ovarian development, followed by a significant decline. Silencing of ATG13 transcripts in T. molitor larvae showed a reduced survivability of 39 and 38% in response to Escherichia coli and Staphylococcus aureus infection. Furthermore, the role of TmAtg13 in initiating autophagy as a part of the host cell autophagic complex of the host cells against the intracellular pathogen Listeria monocytogenes is currently under study and will be critical to unfold the structure-function relationships.
Introduction
Eukaryotic cells have developed efficient mechanisms to cope with environmental stressors, including the clearance of harmful pathogens from the cytosol. Autophagy is a conserved mechanism, whereby the cytoplasmic contents are degraded in the lysosomes. The sequestration of the cytoplasm forms the developing autophagosome that finally fuses with a lysosome in the cytoplasm, and the cytoplasm-derived material is degraded by lysosomal hydrolases (Nakatogawa et al., 2009; Rubinsztein et al., 2012). The breakdown products are recycled to allow further metabolism needed for survival. Autophagy was first identified as a cellular response to nutrient deprivation. Since then, it has been implicated in a multitude of developmental processes including tissue remodeling during development (Tsukamoto et al., 2008), innate immune responses (Levine and Deretic, 2007), and disease-related functions as in aging, cancer, and neurodegenerative diseases (Mizushima et al., 2008).
The autophagy pathway, particularly the formation of autophagosome, is mediated by autophagy-related (ATG) genes. These genes code for approximately 35 or so specialized Atg proteins, first identified in yeast through genetic screening and have now been implicated in the autophagy mechanisms of higher eukaryotes (He and Klionsky, 2009). The regulatory function of autophagy in insects attributed to PI3K-AKT/PKB-TSC1/TSC2-Rheb-TOR signaling pathway (Rusten et al., 2004). The pathway is activated by 20-hydroxyecdysone (20E) and is mediated by transcription factors, such as β FTZ-F1, BR-C, E74A, and E93. The mTOR complex inhibits the activity of Atg1/Atg13 protein kinase complex under normal conditions; thus, acting as a negative regulator of autophagy (Ravikumar et al., 2004; Malagoli et al., 2010; Yeh et al., 2011). Autophagy in Saccharomyces cerevisiae is controlled by the cAMP-dependent protein kinase (PKA) pathway, which directly phosphorylates Atg13, acting as a conserved regulator of Atg1 kinase activity (Funakoshi et al., 1997; Hosokawa et al., 2009; Stephan et al., 2009). mTOR activity declines under nutrient-deprived conditions leading to the nucleation of the autophagosome membrane via the formation of the Atg1/Atg13 and autophagy-related gene 6- Vps34 (also called phosphatidylinositol 3-kinase)—immune response deficient1 (Atg6-Vps34-Ird1) complexes. Furthermore, the role of mTOR in autophagy has been established through elegant genetic studies (Sancak et al., 2010), although the exact mechanism remains unknown. During the process of elongation of phagophore membrane in insects, the Atg8-phosphatidylethanolamine and the Atg12-Atg5 conjugated protein complex, becomes integral part of the membrane. The Lqf/Epsin protein is needed towards curving of the autophagosome membrane. These highly curved vesicles are recognized by the Atg1 C-terminal early autophagy targeting/tethering (EAT) domain (Chang and Neufeld, 2009; Ragusa et al., 2012).
The protein kinase Atg1 and the phosphoprotein Atg13 functions as a critical component in nutrient-dependent autophagic signaling. Although the complex has been sufficiently studied for its presumptive roles of autophagy in higher eukaryotes and metazoans (Chan et al., 2009; Jung et al., 2009; Alers et al., 2011), its regulation of the autophagic machinery in arthropods including insects is less known. Atg13 in Drosophila stimulates both autophagic activity of Atg1 and its inhibition of cell growth and TOR signaling that maintains a regulatory link between TOR and the Atg1/Atg13 complex, which is very similar to yeast and metazoans (Scott et al., 2007; Chang and Neufeld, 2009). Until now, Atg1 and Atg13 phosphorylation mechanism have not been clearly defined. One study reported that mTOR regulates phosphorylation of Atg13, ULK1 and ULK2 (which are mammalian homologs of Atg1). Thus, Atg13 functions in mammals to stabilize ULK interactions and facilitate the FIP200 phosphorylation by ULK (Jung et al., 2009). An understanding of the structure of insect Atg13 will be useful to understand the molecular mechanisms of autophagy initiation at phagophore assembly site (PAS). The Atg13 HORMA (Hop1p, Rev1p, and Mad2) domain, which is similar to the spindle checkpoint protein Mad2, has been mapped at the structural level which provided insight into its mediation of autophagy (Jao et al., 2013b).
The yellow mealworm, Tenebrio molitor is a useful model for studying insect biochemistry, immunology, and physiology due to its large size, ease of handling, and compatible genetics (Jiang et al., 2011). We have screened and characterized immune genes from this insect using expressed sequence tag (EST) and RNA sequence (RNAseq) analysis (Jeong et al., 2013; Patnaik et al., 2013, 2014; Tindwa et al., 2013; Noh et al., 2014). We have also screened and identified the autophagy genes from T. molitor using the RNA-seq approach. We understand that autophagy research in insects is in its infancy compared to that of the well-characterized models in yeast, Drosophila, and mammals. The present research aims at establishing a more general model for insects that may or may not be in agreement with the Dipteran findings. Herein, we hypothesized a necessary role for the Atg13 ortholog in T. molitor larvae during initiation of autophagy and a function during ovary maturation and development. The TmATG13 gene was characterized at the sequence and structure level using molecular cloning and bioinformatics approaches. The folded structure of the deduced HORMA domain protein was mapped using homology modeling and structural prediction software's. We also assessed the developmental and tissue-specific mRNA expression of TmATG13 and its relevance during ovarian maturation and development. Furthermore, the functional significance of the TmATG13 transcripts using gene silencing study elaborated on its requirement for survivability against bacterial infections.
Materials and Methods
Insect Rearing and Maintanence
T. molitor larvae were maintained in an environmental chamber at 26 ± 1°C with 60 ± 5% relative humidity. The larvae were fed an autoclaved artificial diet composed of 220 g wheat bran (Milworm House, Busan, Korea), 10 g bean powder (Donggran Food, Daejeon, Korea), 5 g brewer's yeast (Beer Yeast Korea Inc., HNH Seoul, Korea), 0.15 g chloramphenicol (Duchefa Biochemie, Haarleem, The Netherlands), 1.1 g sorbic acid (Sigma Aldrich, St. Louis, MO, USA), and 1.1 ml propionic acid (Sigma Aldrich, Louis, USA) mixed in 430 ml of distilled water.
Cloning of the cDNA Encoding TmATG13
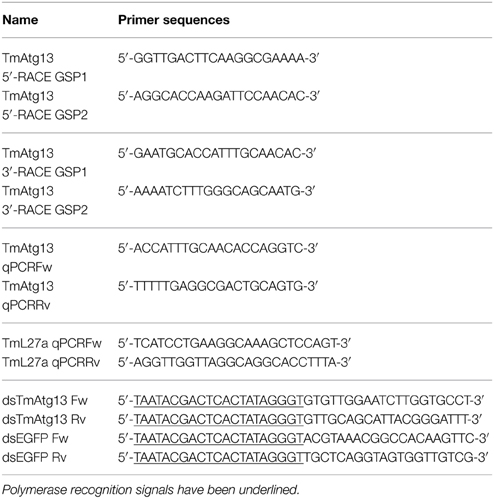
Reverse transcription- polymerase chain reaction (RT-PCR) and 5′/3′ rapid amplification of cDNA ends- PCR (RACE-PCR) analyses were used to clone the full-length open reading frame (ORF) of TmATG13, identified from RNAseq analysis of T. molitor larvae. All primers were synthesized using the PrimerQuest program (http://www.idtdna.com/Scitools) and are detailed in Figure 1. Briefly, the synthesized cDNAs from last-instar T. molitor larvae were amplified using RT-PCR and the pre-designed primers under the following conditions: denaturation at 94°C for 30 s, annealing at 48°C for 30 s, and extension at 72°C for 30 s for 30 cycles. The amplified gene products were purified using an AccuPower PCR purification kit (Bioneer, Daejeon, Korea), according to manufacturer's instructions. The purified PCR products were incubated at 72°C for 15 min to produce sticky or cohesive ends using Taq polymerase. Subsequent to ligation into the pCR2.1 TOPO TA cloning vector (Invitrogen Corporation, Carlsbad, CA, USA) and transformation into Escherichia coli cells, the cloned insert was sequenced using the 454 genome sequencer-GS FLX+ system (Roche Life Sciences, Branford, CT, USA).
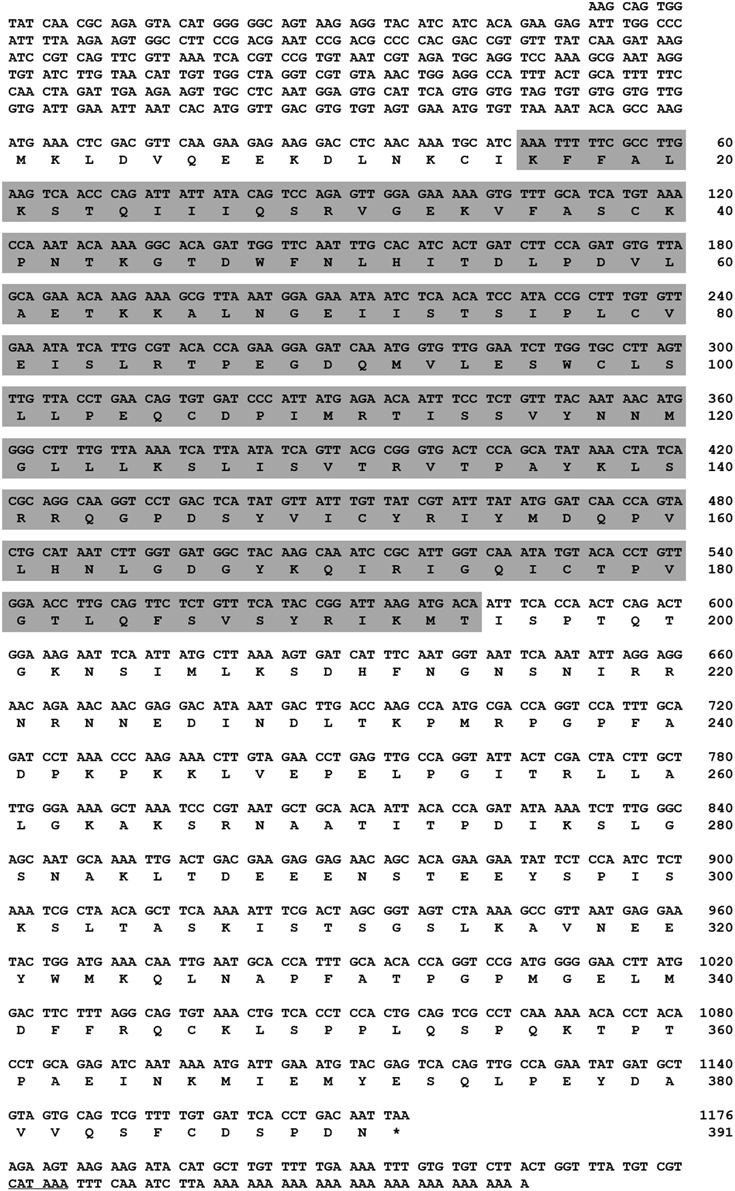
Figure 1. Nucleotide and deduced amino acid sequence of TmAtg13 cDNA. The full-length ORF sequence was derived from the Tenebrio molitor transcriptome database. The 5′/3′-UTR region was obtained by RACE-PCR methods. Asterisk denotes the stop codon. The polyadenylation domain in the 3′-UTR is underlined. Gray box indicates the N-terminal HORMA domain.
The 5′/3′ extensions of the TmAtg13 ORF sequence were obtained using the SMARTer RACE cDNA amplification kit (Clontech Laboratories, Palo Alto, CA, USA) according to the manufacturer's instructions. The RACE conditions were as follows: pre-denaturation at 98°C for 5 min, denaturation at 98°Cfor 10 s, annealing at 55°C for 30 s, and extension at 72°C for 1 min. The nested PCR products were purified and subsequently cloned and sequenced as described above.
The TmAtg13 cDNA sequence has been registered in GenBank with the accession number KJ778621.
Sequence Alignment, Domain Analysis, and Phylogenetic Tree
The deduced amino acid sequence corresponding to the N-terminal conserved HORMA domain was analyzed in detail. The specific domain was predicted using the InterProScan (http://www.ebi.ac.uk/Tools/pfa/iprscan/) and BLAST programs at NCBI (http://blast.ncbi.nlm.nih.gov/). The TmAtg13 orthologous sequences for multiple alignment were derived from GenBank and analyzed using Clustal W2 (http://www.ebi.ac.uk/Tools/msa/clustalw2/) and GeneDoc ver. 2.7 (http://www.psc.edu/).
The structure representing the N-terminal HORMA domain was obtained by constructing a homology model using the SWISS MODEL workspace (http://swissmodel.expasy.org/workspace). The predicted model was based on a reference template from the Protein Data Bank (PDB ID: 4J2G at 2.29 Å resolution). The predicted model was visualized using the PyMOL ver. 1.5 software (http://www.pymol.org/). Additionally the 3D structure of Human mitotic spindle assembly checkpoint protein MAD2A was retrieved from the protein data bank (PDB ID: 1KLQ; DOI: 10.2210/pdb1klq/pdb). The structural identities were assigned to the multiple sequence data using the protein structure database DaliLite ver. 3.0 (Holm and Rosenstrom, 2010).
The evolutionary position of the TmAtg13 N- terminal HORMA domain was analyzed with respect to its orthologs using the maximum likelihood method based on the Jones -Thornton -Taylor (JTT) model (Felsenstein, 1981). A bootstrap consensus tree of 1000 replicates was used to evaluate branch strength for analysis using MEGA ver. 6.06 (Tamura et al., 2013).
qRT-PCR
The Atg13 mRNA expression was analyzed in the larval and adult tissues of T. molitor using qRT-PCR. For the same, the last-instar larval tissues and 2-day old adult tissues, including the fat body, gut, hemocytes, integument, Malphigian tubules, ovary, and testes were dissected from healthy insects. For developmental expression analysis, healthy T. molitor samples from the last-instar larvae, pre-pupa, day 1–7 pupa, and adult day 1 and day 2 samples were used. Ovaries (n = 3) were dissected from adult females on alternate days and used for total RNA isolation and cDNA synthesis to evaluate TmAtg13 expression during ovarian maturation. The qRT-PCR analysis was performed using the Bioneer Exicycler 96 Real-Time Quantitative Thermal Block and SYBR Green-containing qPCR Master Mix. Total RNA was isolated from tissues and developmental samples using the SV isolation system (Promega Corp. Madison, WI, USA). cDNA was generated from 1 μg of total RNA with oligo (dT) primers and the AccuPower RT premix (Bioneer). The resulting cDNAs were applied to qRT-PCR analyses and amplified using primers (Table 1) under a standard temperature profile (pre-denaturation at 95°C for 20 s, followed by 40 cycles denaturation at 94°C for 5 s, annealing and extension at 60°C for 20 s). Each analysis was measured independently at least three times. The 2−ΔΔCt method (Livak and Schmittgen, 2001) was employed to analyze the TmAtg13 expression levels. The gene expression levels were normalized to T. molitor ribosomal protein L27a (TmL27a), which served as an internal control. Data are presented as relative mRNA expression levels (mean ± standard deviation, n = 3).
RNA Interference (RNAi) of TmATG13
The dsRNA fragments of TmATG13 gene were synthesized for silencing the corresponding mRNA transcripts. For the same, TmATG13 DNA fragment was amplified from cDNA by PCR using gene-specific primers tailed with a T7 promoter sequence (Table 1). The PCR reaction was carried out under the following conditions: initial denaturation at 94°C for 3 min, followed by 28 cycles of denaturation at 94°C for 30 s, annealing at 56°C for 30 s, extension at 72°C for 1 min, and a final extension at 72°C for 10 min. The PCR product was purified using the AccuPrep PCR Purification kit (Bioneer, Daejeon, South Korea) and was used to synthesize the double-stranded RNA (dsRNA) using Ampliscribe™ T7-Flash™ Transcription kit (Epicentre Biotechnologies, Madison, WI, USA). The dsRNA product was purified and precipitated with 5 M ammonium acetate. Integrity of the purified dsRNA was confirmed by running 1% agarose gel electrophoresis and quantified using a NanoDrop spectrophotometer (Thermo Scientific, Wilmington, DE, USA). dsRNA for the enhanced green fluorescent protein (dsEGFP) was synthesized in the same way, and all dsRNAs were stored at −20°C until injection into T. molitor larvae.
The dsTmATG13 or dsEGFP (1 μg/larva) were dissolved in water and injected into the hemocoel of the larvae (n = 20) using disposable needles mounted onto a micro-applicator (Picospiritzer III Micro Dispensing System, Parker Hannifin, Hollis, NH, USA). Animals treated with the dsRNAs were maintained on an artificial diet as described above.
Bacterial Injections and Bioassays
E. coli K12 and Staphylococcus aureus RN4220 were grown in Luria Bertani broth (LB) [10 g tryptone, 5 g yeast extract, 10 g sodium chloride (pH, 7.0) per liter]. Aliquots of 106 cfu/larva of S. aureus or E. coli were injected into T. molitor larvae (n = 20) to investigate the TmAtg13 induction pattern in response to the microbial injections. Total RNAs and cDNAs were prepared from samples of each treatment taken at 3, 6, 9, and 12 h post-injection. Relative TmAtg13 expression levels at different time points were determined by the qPCR, as described above.
To investigate the role of TmATG13 in larval survival against S. aureus and E. coli infections, the larvae were injected with either dsEGFP or dsTmATG13. The larvae were challenged with 106 cfu/larva of S. aureus or E. coli 4 days after the dsRNA injection. Treated larvae were incubated at 26°C, and the number of dead larvae was recorded on a daily basis for 7 days post-injection. Survival rates of survival were compared between the dsTmATG13 and dsEGFP-treated groups. Statistical analysis was conducted by Wilcoxon-Mann-Whitney test and the cumulative survival rates were considered significant (P < 0.05).
Results
Identification of the cDNA Encoding TmATG13 and Domain Architecture
We identified the full-length TmATG13 ORF from a T. molitor larval transcriptome database. The full-length TmATG13 cDNA including the 5′/3′- untranslated regions (UTRs) was identified using RACE-PCR approach. The TmAtg13 nucleotide and deduced amino acid sequences are shown in Figure 1. The T. molitor ATG13 gene and protein of T. molitor were designated as TmATG13, and TmAtg13, respectively. The sequence analysis showed that the TmATG13 cDNA had a 1176 bp ORF encoding a protein of 391 amino acid residues. The 5′-untranslated region contains 369 bp, and the 3′-UTR contained 106 bp ending with a 29 bp polyadenylation (A)+ (polyA+) tail. The ORF predicted a protein with a molecular mass of 43.7 kDa and a pI of 8.32.
A search of the protein database using Basic Local Alignment Search Tool (BLAST) revealed high sequence similarities between TmAtg13 and other Atg13 orthologs from other insects. Analyses of the TmAtg13 deduced amino acid sequence revealed a highly conserved N-terminal Atg13 domain and an unstructured and variable C-terminal region. The Atg13 domain extended from amino acids 16–194 (Figure 1). Detailed analyses of TmAtg13 Atg13 domain using predictive sequence and structure analyses showed that the N-terminal domain belonged to the HORMA family. Multiple sequence alignment with conserved residues and the secondary structural elements corresponding to the TmAtg13 HORMA domain are shown in Figure 2.
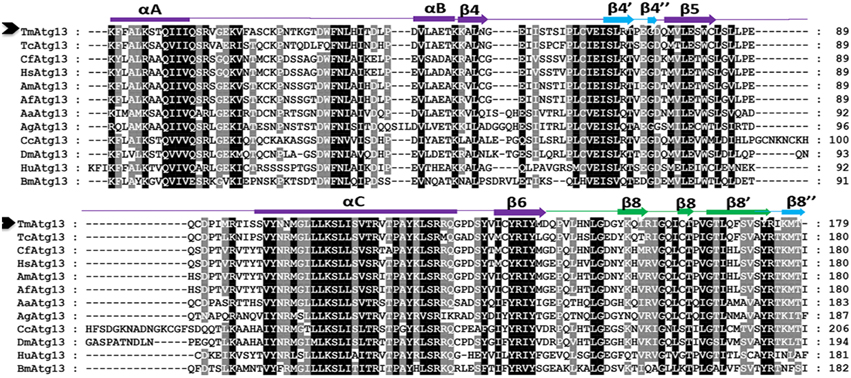
Figure 2. Multiple alignment of the deduced amino acid sequence of the TmAtg13 protein HORMA domain with its orthologs. The secondary structural elements predicted by a homology model (reference template PDB id: 4j2gA) and DaliLite ver. 3.0 are represented on the top of the sequence. Regions structurally similar to MAD2 are colored in purple except the safety belt region, which is highlighted in green. The Atg13 HORMA domain (β4′, β4″, andβ8″), which is unique to TmAtg13, is colored in blue. The amino acid residues that are identical or similar in all sequences are shaded black, gray sequences indicate identical or similar amino acids in most sequences. Dashes indicate gaps to optimize the alignment.
The HORMA domain homology model of T. molitor Atg13 was built based on the reference Atg13 HORMA domain of Lachancea thermotolerans (LtAtg13; PDB id: 4J2G) (Jao et al., 2013a). Figure 3Ai shows the three-dimensional (3D) molecular structure of the HORMA domain of LtAtg13 and TmAtg13, respectively. The superimposed 3D structure of TmAtg13 (Figure 3Aii) showed structural homology in the core region, with large variations in the outside loop region. The prediction analysis of the HORMA domain's secondary structure suggested a globular protein that could potentially form a complex β-sheet(s) with associated α-helices. The TmAtg13 HORMA domain had a centrally-placed five-stranded antiparallel β-sheet centered on a α/β fold. The three-stranded β-sheets (β4′, β4″, and β8″) were placed on one end of the structure, whereas the α-helices packed the other side of the structure. The predicted TmAtg13 model showed homology with the spindle checkpoint protein Mad2, particularly the c-Mad2 conformation involved in binding other proteins at the spindle checkpoint (Figure 3Bi). All the TmAtg13 regions excluding the three-stranded β-sheet HORMA fold could be superimposed on the Mad2 structure (Figure 3Bii).
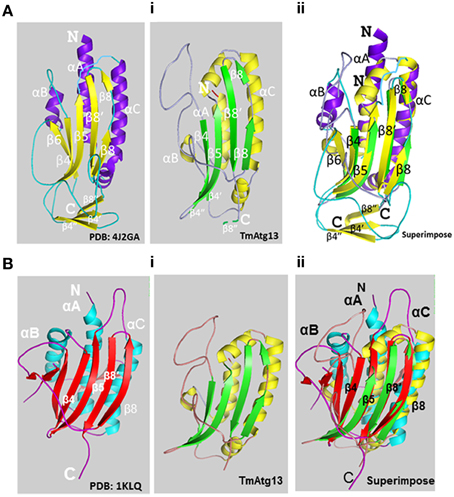
Figure 3. Molecular structure of the TmAtg13 HORMA domain. (Ai) The predicted structural model of TmAtg13 N-terminal HORMA domain is shown in parallel to the reference 3D-model of Lachancea thermotolerans Atg13 (PDB id: 4J2GA). (Aii) Superposed 3D-image of the N-terminal HORMA domain of TmAtg13 over the reference Atg13 model of Lachancea thermotolerans (PDB: 4J2GA). The alpha-helices and beta-sheets for the reference model and TmAtg13 HORMA domain are represented in purple and yellow, and yellow and green, respectively. (Bi) The predicted structural model of TmAtg13 N-terminal HORMA domain is shown in parallel to the 3D-model of Human mitotic assembly check-point protein MAD2 (PDB id: 1KLQ). (Bii) Superposed image of TmAtg13 HORMA domain with the Human MAD2 protein. The alpha-helices and beta-sheets are represented in cyan and red, and red and yellow, respectively for the reference Human MAD2 protein and TmAtg13 N-terminal HORMA domain.
The TmAtg13 HORMA domain was comprised of 179 amino acid residues with a molecular weight of 20.1 kDa (pI, 8.91), and the molecular formula C902H1456N238O261S11. The putative phosphorylation sites for the TmAtg13 HORMA domain were serine (S23, S100), threonine (T31, T39, T71, T119, and T163), and tyrosine (Y102, Y133, and Y153) residues. TmAtg13 had a higher proportion of polar residues (45.2%) and basic amino acids (12.2%), which indicating that it favors a hydrophilic environment.
TmATG13 Phylogenetics Study
The TmAtg13 N-terminal HORMA domain was analyzed with the representative Atg13 sequences from its orthologs through a phylogenetics study using the neighbor-joining method. As shown in Figure 4A, TmAtg13 was clustered into the same branch as Tribolium castaneum Atg13 (TcAtg13) with a bootstrap percentage of 97%. The beetle Atg13 was clustered separately from the hymenopteran, dipteran, and lepidopteron cluster. Human Atg13 was considered as an out-group in the taxonomic classification of Atg13 sequences from insects. A percent identity and distance matrix was also designed to understand the level of sequence conservation among the T. molitor Atg13 sequences and its orthologs (Figure 4B). Identity of TmAtg13 was 77% with TcAtg13. In addition, the identity of the TmAtg13 protein sequence with hymenopteran orthologs from hymenoptera was in the order of 65–70%, followed by the dipteran ortholog at 55–65%.
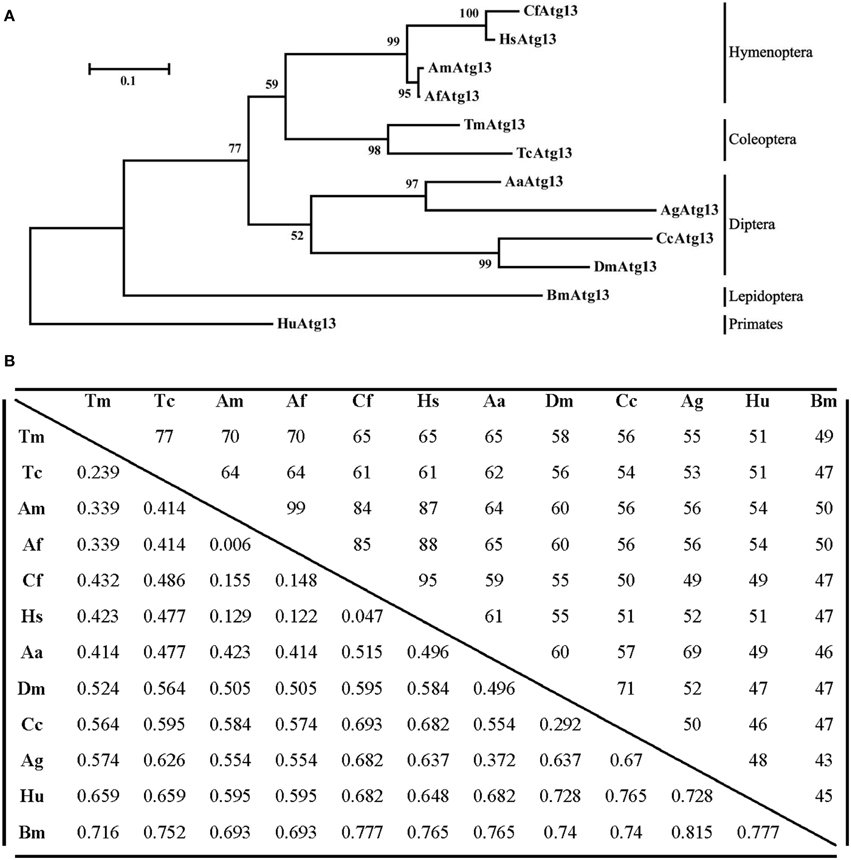
Figure 4. Molecular phylogenetic analysis and percentage identity matrix for the TmAtg13 HORMA domain. (A) An evolutionary tree for the TmAtg13 HORMA domain was constructed by using the maximum likelihood method and was based on the Jones- Thornton- Taylor matrix model. Bootstrap replications of 1000 were assigned and analyzed using the MEGA 6.06 program. The amino acid sequences with the GenBank accession numbers were as follows: TmAtg13; Tenebrio molitor Atg13, TcAtg13; Tribolium castaneum Atg13 (XP_968716.2), CfAtg13; Camponotus floridanus Atg13 (EFN61542.1), AmAtg13; Apis mellifera Atg13 (XP_623782.1), AfAtg13; Apis florea Atg13 (XP_003690771.1), HsAtg13; Harpegnathos saltator Atg13 (EFN82266.1), BmAtg13; Bombyx mori Atg13 (XP_004924339.1), AaAtg13; Aedes aegypti Atg13 (XP_001664333.1), AgAtg13; Anopheles gambiae Atg13 (XP_315727.4), CcAtg13; Ceratitis capitata Atg13 (XP_004523373.1), DmAtg13; Drosophila melanogaster Atg13 (NP_649796.1), and the outgroup HuAtg13; Homo sapiens Atg13 (AAH06191.1). (B) Percentage identity and distance matrix of TmAtg13 with its orthologs as analyzed using the ClustalX2 and MEGA 6.06 programs.
TmATG13 mRNA Transcriptional Profiles
Real-time PCR was performed using TmATG13-specific primers to determine the TmATG13 gene expression profiles (Table 1). The quantities of TmATG13 PCR products were indexed to the levels obtained for the TmL27a gene, known to be constitutively expressed in T. molitor. Figure 5A shows the TmATG13 transcript expression in the last-instar larval tissues and Figure 5B shows the fold-changes in adult T. molitor tissues. TmATG13 expression levels in the fat body and gut of last-instar larvae were relatively higher than those in hemocytes, the integument, and the Malphigian tubules. Similar results were observed in the T. molitor adults, where the TmATG13 transcript expression was higher in the fat body than that in other tissues. High levels of TmATG13 mRNA transcripts were also noted in the ovaries and testis of healthy T. molitor adults.
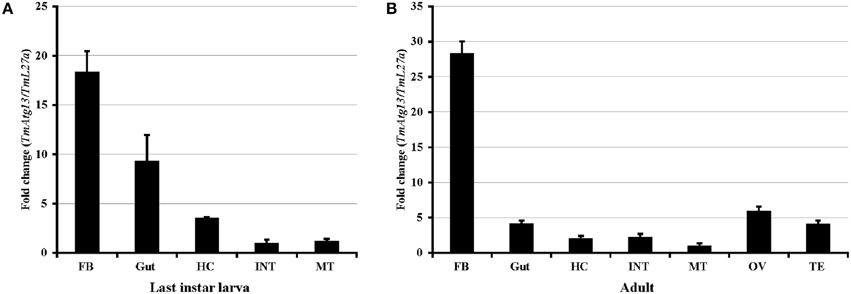
Figure 5. TmAtg13 larval and adult-tissue specific expression profiles. (A) TmAtg13 in the last instar larval tissues. (B) The distribution of the transcript in 2-day old adult tissues. Ribosomal protein L27a (Tenebrio molitor) was used as an endogenous control. Data are presented as mean ± standard error (n = 3). Abbreviations are as follows: FB, fat body; HC, hemocytes; INT, integument; MT, Malphigian tubules; OV, ovary; TE, Testis.
We also examined the TmATG13 expression at different developmental stages, including late larva, pre-pupa, pupal days 1–7, and adult day 1 and day 2 (Figure 6). The results suggest that TmATG13 mRNA is ubiquitously expressed, as no differences in the transcriptional profile were observed in between larval, pupal, and adult stages. We also detected the TmATG13 mRNA transcription profiles of TmATG13 mRNA during ovarian maturation in a time-course study (Figure 7). The TmATG13 mRNA expression levels of TmATG13 was greater early after adult eclosion, with the highest expression observed on at day 6 of development, followed by a significant decline during later stages of ovarian development and maturation.
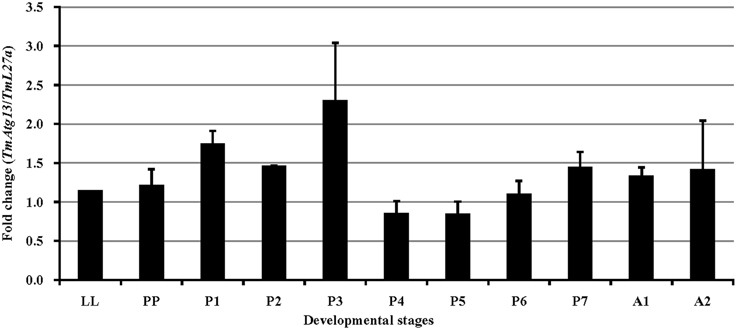
Figure 6. Developmental expression patterns of TmAtg13 in the beetle, T. molitor. Ribosomal protein L27a (T. molitor) was used as an endogenous control. Data are presented as mean ± standard error (n = 3). Abbreviations are as follows: LL, last instar larva; PP, pre-pupa; P1–P7, 1–7 day old pupa, and A1–A2, 1–2 day old adult.
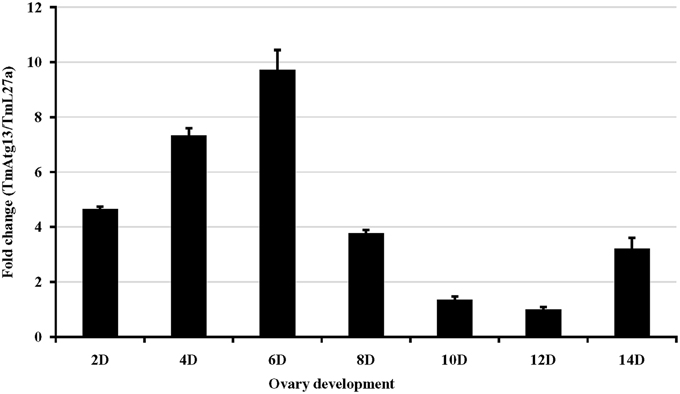
Figure 7. Temporal expression of TmAtg13 during the maturation of adult ovary in the beetle, T. molitor. TmAtg13 mRNA expression levels are expressed as fold changes with respect to the endogenous control (ribosomal protein L27a). Expression of the mRNA transcripts was analyzed on alternate days (day 2, 4, 6, 8, 10, 12, and 14) of ovarian development. Data are presented as mean ± standard error (n = 3).
TmATG13 Induction Patterns and RNAi
E. coli and S. aureus were injected into T. molitor larvae to understand the TmATG13 induction pattern in response to microbial challenge, and TmATG13 transcript levels were monitored in a time-dependent manner. The results indicate that TmATG13 transcript levels increased steadily until 6 h compared to those in PBS-treated larvae, followed by a persistent decline at 9 and 12 h post-injection of E. coli (Figure 8A) and S. aureus (Figure 8B). The role of TmATG13 in survival of T. molitor larvae was investigated by knocking down the transcript levels followed by injections of S. aureus and E. coli. The RNAi efficiency measured after dsTmATG13 injection was found to be about 82% (Figure 9A). The results indicated that at 7 days post-injection, the survivability against E. coli and S. aureus was decreased by 39 and 38%, respectively, in dsTmAtg13-injected larvae compared to that in the dsEGFP-injected control groups (Figures 9B,C).
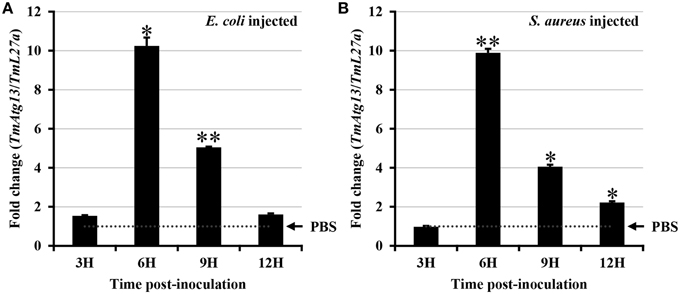
Figure 8. Induction patterns of TmAtg13 in response to bacterial inoculation. E. coli (A), and S. aureus (B) were injected into T. molitor larvae and total RNAs were isolated at 3, 6, 9, and 12 h post-injection of microorganisms. Primers for ribosomal protein L27a from T. molitor (TmL27a) were used as endogenous control. Results of triplicate experiments have been provided with standard errors. * P < 0.05; ** P < 0.01 (SAS, ANOVA).
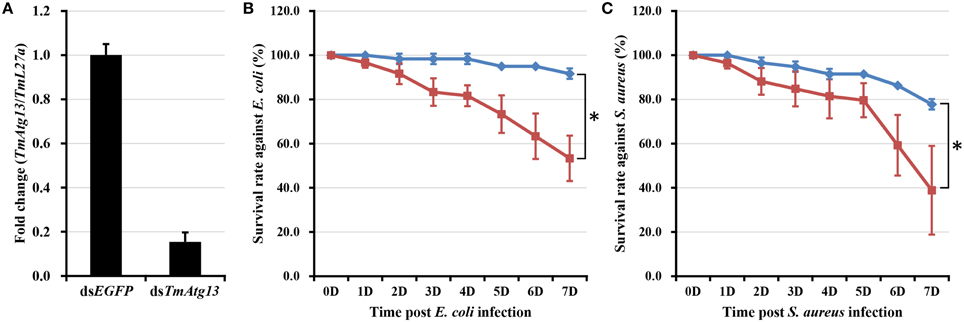
Figure 9. RNAi-based silencing of TmAtg13 transcripts and survival assay. (A) RNAi efficiency of TmAtg13 mRNA in dsTmAtg13 injected larvae compared with dsEGFP-treated T. molitor. Survival rate against E. coli (B) and S. aureus (C) measured in TmAtg13 silenced T. molitor larvae compared with dsEGFP-treated T. molitor larvae. Data are presented as mean ± SE. *, significant (P < 0.05; Wilcoxon-Mann-Whitney test) change in the larval survivability was observed in between the dsEGFP and dsTmAtg13 silenced larvae.
Discussion
We screened a full-length ATG13 ORF from a T. molitor transcriptome database. Seven putative ATG genes, including ATG13, were identified previously from the tick, Ixodes scapularis, and all are involved in formation of autophagosomes (Van Zee et al., 2007). As expected, the TmAtg13 homolog characterized in the present study, showed high identity with Atg13 from T. castaneum, when compared with other insect Atg13 orthologs. We used the conserved amino acid sequence of the TmAtg13 N-terminal domain to model the protein structure in detail. It was found that the N-terminal Atg13 domain was unstructured and less conserved. This result agrees with other reports on the structure and function of Atg13 in model organisms. This unstructured Atg13 region is necessary and sufficient for binding to both Atg1 and Atg17 (Kabeya et al., 2005; Ragusa et al., 2012). This region is also a locus for the presence of regulatory Atg13 phosphorylation sites and conforms to our TmAtg13 observation. A potential human Atg13 ortholog shows about 15% identity with the S. cerevisiae Atg13 protein over their C-terminal amino acid sequence and 43% identity with the Drosophila Atg13 protein (Chang and Neufeld, 2009). Additionally, the Q-rich region, which is a characteristic feature of yeast Atg13, is not conserved in other species including Drosophila, Tenebrio, and human Atg13. Most of the studies have addressed the requirement of the unstructured Atg13 region to bind Atg1 through hypophosphorylation; a process essential to the translocation of this complex to the PAS.
Comparatively little is known about the structural features of conserved Atg13 domain, even though the 2.3 Ǡ crystal structure of LtAtg13 has been solved with structural similarity to the spindle checkpoint protein Mad2 (Mapeli et al., 2007; Chao et al., 2012). Mad2 has two different stable conformations, and O-Mad2 and C-Mad2, with C-Mad2 conforms completely to the HORMA domain (Aravind and Koonin, 1998). The LtAtg13 HORMA fold domain is required for autophagy and to recruit the Atg14 of phosphatidylinositol (PtdIns) 3-kinase subunit Atg14 but not to localize Atg13 (Jao et al., 2013a,b). The amino acid sequences corresponding to the N-terminal T. molitor Atg13 domain were used to construct a homology model based on the crystal structure of L. thermotolerans. The predicted TmAtg13 model of TmAtg13 showed all the secondary structural features, including the Mad2-related organization, and the safety belt region. The HORMA fold structure toward the end of the N-terminal region which is unique to Atg13 protein of T. molitor. In this regard the putative existence of TmAtg13 HORMA domain as a phosphorylated conformational switch needs to be addressed further. The concept of phosphoregulated switch in Atg13 in L. thermotolerans needs to be further investigated. It has been shown that a mutation in the putative phosphate sensor in the HORMA domain does not show a distinct autophagy phenotype (Jao et al., 2013a) although mutations to TOR phosphorylation sites in Atg13 to Ala lead to constitutive autophagy (Kamada et al., 2010).
Real-time PCR- based quantification was useful to measure the expression of TmATG13 transcript in healthy T. molitor larval and adult tissues as well as during various developmental stages. We observed enhanced mRNA expression of TmATG13 in the fat body of T. molitor larvae and adults. In general, autophagy is rapidly induced by starvation in the larval fat body as shown in previous reports (Scott et al., 2004; Umemiya et al., 2007; Malagoli et al., 2010). In fat body cells of Drosophila, overexpression of Atg17 leads to phosphorylation of Atg13 that enhances autophagy in an Atg-1 dependent manner (Nagy et al., 2014). Midgut cells have also been examined for autophagosomes or autophagic vacuoles under starved conditions (Tarnowski and Coons, 1989). Lysosome number and the quantity amount of lysosomal enzymes increase during starvation for autophagy-related processes (Vilaplana et al., 2007).
The high mRNA expression of TmATG13 in the T. molitor larval gut was a positive signal for specific degradation of midgut epithelial cell components. We are working toward generating TmAtg13 antiserum to determine the location of this protein in fat body and midgut cells of unfed T. molitor larvae by immunohistochemistry and immunoblotting. Hyperphosphorylated and dephosphorylated Atg13 species have been detected recently by Western blot (Miller-Fleming et al., 2014). The consistent and ubiquitous Atg13 transcriptional profile during T. molitor development may suggest a routine involvement of autophagy in the degeneration of larval tissues and organs, and a temporal transition in pupal and adult metamorphorhic stages. Autophagy during lepidopteran metamorphic transition periods is well characterized, particularly in the moths Heliothis virescens (Tettamanti et al., 2007a), Alabama argillacea (de Sousa et al., 2009), and the butterfly Pieris brassicae (Tettamanti et al., 2007b). A lower TmATG13 expression level during the late stages of normal ovarian development suggests impaired autophagy, although this needs to be confirmed by TOR activity and autophagosomes/autolysosomes production. Also there is a possibility of the activation of a programmed cell death (PCD) process where the features of autophagy and apoptosis are concomitant. A report in this direction states that autophagy largely controls cell death in D. melanogaster oocytes by regulating the development of nurse cells and DNA fragmentation in late oogenesis. This is because a genetic inhibition of autophagy by removal of function of ATG1, ATG13, and VPS34 results in persistent nurse cell nuclei without fragmented DNA (Nezis et al., 2010).
The increase in TmATG13 transcripts shortly after hours of E. coli and S. aureus infection in T. molitor larvae indicates pathogen clearance through the autophagic process. This observation is in logic with the reduced survivability of TmATG13-silenced larvae in E. coli and S. aureus infected T. molitor whole larva. Previous reports have documented the direct role of autophagy in restricting replication of Listeria monocytogenes, Shigella flexneri, Salmonella typhimurium, and Mycobacterium tuberculosis (Gutierrez et al., 2004; Birmingham et al., 2006; Yano et al., 2008; Mostowy et al., 2011) in infected cells. Atg13 protein is required for phagosome formation in the hierarchical, canonical autophagy, and therefore a depletion of TmAtg13 via RNAi could have reduced the ability of the larvae to contain the pathogens through autophagy.
In summary, we identified an ATG13 homolog from the T. molitor transcriptome database and characterized its sequence and structural features using a bioinformatics approach. The conserved N-terminal Atg13 domain conformed to the HORMA domain architecture of human Mad2 protein and Atg13 protein of L. thermotolerans. We found the expression of ATG13 at the level of RNA in different developmental stages and tissues of T. molitor larvae and adult. However, we did not confirm its existence morphologically. In preparing RNAi screen for TmAtg13 and delineating its putative role in autophagy-mediated clearance of bacterial pathogens such as E. coli and S. aureus, we are close to providing a nexus for study of the individual structural components of the HORMA domain in regulation of autophagy. Furthermore, the dynamics of TmATG13 interaction with Atg1 and Atg14, especially in midgut tissues is under study to understand the insect's starvation strategy.
Author Contributions
Conception and design of work: YL, YH. Obtainment of experimental data: JL, YJ, KP, BP, HT, GS, RC. Writing and revision of manuscript: BP, RC, YH.
Conflict of Interest Statement
The authors declare that the research was conducted in the absence of any commercial or financial relationships that could be construed as a potential conflict of interest.
Acknowledgments
This work was supported by the Next-Generation Bio Green 21 Program (No. PJ008186) of the Rural Development Administration, Republic of Korea.
References
Alers, S., Loffler, A. S., Paasch, F., Dieterle, A. M., Keppeler, H., Lauber, K., et al. (2011). Atg13 and FIP200 act independently of Ulk1 and Ulk2 in autophagy induction. Autophagy 7, 1423–1433. doi: 10.4161/auto.7.12.18027
Aravind, L., and Koonin, E. V. (1998). The HORMA domain: a common structural denominator in mitotic checkpoints, chromosome synapsis and DNA repair. Trends Biochem. Sci. 23, 284–286. doi: 10.1016/S0968-0004(98)01257-2
Birmingham, C. L., Smith, A. C., Bakowski, M. A., Yoshimori, T., and Brumell, J. H. (2006). Autophagy controls Salmonella infection in response to damage to the Salmonella-containing vacuole. J. Biol. Chem. 281, 11374–11383. doi: 10.1074/jbc.M509157200
Chan, E. Y. W., Longatti, A., McKnight, N. C., and Tooze, S. A. (2009). Kinase-inactivated ULK proteins inhibit autophagy via their conserved C-terminal domains using an Atg13-independent mechanism. Mol. Cell. Biol. 29, 157–171. doi: 10.1128/MCB.01082-08
Chang, Y. Y., and Neufeld, T. P. (2009). An Atg1/Atg13 complex with multiple roles in TOR-mediated autophagy regulation. Mol. Biol. Cell 20, 2004–2014. doi: 10.1091/mbc.E08-12-1250
Chao, W. C. H., Kulkarni, K., Zhang, Z. G., Kong, E. H., and Barford, D. (2012). Structure of the mitotic checkpoint complex. Nature 484, 208–213. doi: 10.1038/nature10896
de Sousa, M. E., Wanderley-Teixeira, V., Teixeira, A. A., de Siqueira, H. A., Santos, F. A., and Alves, L. C. (2009). Ultrastructure of the Alabama argillacea (Hubner) (Lepidoptera: Noctuidae) midgut. Micron 4, 743–749. doi: 10.1016/j.micron.2009.04.008
Felsenstein, J. (1981). Evolutionary tree from DNA sequences: a maximum likelihood approach. J. Mol. Evol. 17, 368–376. doi: 10.1007/BF01734359
Funakoshi, T., Matsuura, A., Noda, T., and Ohsumi, Y. (1997). Analyses of APG13 gene involved in autophagy in yeast, Saccharomyces cerevisiae. Gene 192, 207–213. doi: 10.1016/S0378-1119(97)00031-0
Gutierrez, M. G., Master, S. S., Singh, S. B., Taylor, G. A., Colombo, M. I., and Deretic, V. (2004). Autophagy is a defense mechanism inhibiting BCG and Mycobacterium tuberculosis survival in infected macrophages. Cell 119, 753–766. doi: 10.1016/j.cell.2004.11.038
He, C., and Klionsky, D. J. (2009). Regulation mechanisms and signaling pathways of autophagy. Annu. Rev. Genet. 43, 67–93. doi: 10.1146/annurev-genet-102808-114910
Holm, L., and Rosenstrom, P. (2010). Dali server: conservation mapping in 3D. Nucleic Acids Res. 38, 545–549. doi: 10.1093/nar/gkq366
Hosokawa, N., Hara, T., Kaizuka, T., Kishi, C., Takamura, A., Miura, Y., et al. (2009). Nutrient dependent mTORC1 association with ULK1-Atg13-FIP200 complex required for autophagy. Mol. Biol. Cell 20, 1981–1991. doi: 10.1091/mbc.E08-12-1248
Jao, C. C., Ragusa, M. J., Stanley, R. E., and Hurley, J. H. (2013a). A HORMA domain in Atg13 mediates PI 3-kinase recruitment in autophagy. Proc. Natl. Acad. Sci. U.S.A. 110, 5486–5491. doi: 10.1073/pnas.1220306110
Jao, C. C., Ragusa, M. J., Stanley, R. E., and Hurley, J. H. (2013b). What the N-terminal domain of Atg13 looks like and what it does. A HORMA fold required for PtdIns 3-kinase recruitment. Autophagy 9, 1112–1114. doi: 10.4161/auto.24896
Jeong, J. E., Kang, S. W., Hwang, H. J., Chae, S.-H., Patnaik, B. B., Han, Y. S., et al. (2013). Expressed sequence tags (ESTs) analysis of Tenebrio molitor larvae. Entomol. Res. 43, 168–176. doi: 10.1111/1748-5967.12019
Jiang, F., Ramanathan, A., Miller, M. T., Tang, G.-Q., Gale, M., Patel, S. S., et al. (2011). Structural basis of RNA recognition and activation by innate immune receptor RIG-I. Nature 479, 423–427. doi: 10.1038/nature10537
Jung, C. H., Jun, C. B., Ro, S. H., Kim, Y. M., Otto, N. M., Cao, J. L., et al. (2009). ULK-Atg13-FIP200 complexes mediate mTOR signaling to the autophagy machinery. Mol. Biol. Cell 20, 1992–2003. doi: 10.1091/mbc.E08-12-1249
Kabeya, Y., Kamada, Y., Baba, M., Takikawa, H., Sasaki, M., and Ohsumi, Y. (2005). Atg17 functions in cooperation with Atg1 and Atg13 in yeast autophagy. Mol. Biol. Cell 16, 2544–2553. doi: 10.1091/mbc.E04-08-0669
Kamada, Y., Yoshino, K., Kondo, C., Kawamata, T., Oshiro, N., Yonezawa, K., et al. (2010). Tor directly controls the Atg1 kinase complex to regulate autophagy. Mol. Cell. Biol. 30, 1049–1058. doi: 10.1128/MCB.01344-09
Levine, B., and Deretic, V. (2007). Unveiling the roles of autophagy in innate and adaptive immunity. Nat. Rev. Immunol. 7, 767–777. doi: 10.1038/nri2161
Livak, K. J., and Schmittgen, T. D. (2001). Analysis of relative gene expression data using real-time quantitative PCR and the 2−ΔΔCt method. Methods 25, 402–408. doi: 10.1006/meth.2001.1262
Malagoli, D., Abdalla, F. C., Cao, Y., Feng, Q., Fujisaki, K., Gregorc, A., et al. (2010). Autophagy and its physiological relevance in arthropods. Autophagy 6, 575–588. doi: 10.4161/auto.6.5.11962
Mapeli, M., Massimiliano, L., Santaguida, S., and Musacchio, A. (2007). The Mad2 conformational dimer: structure and implications for the spindle assembly checkpoint. Cell 131, 730–743. doi: 10.1016/j.cell.2007.08.049
Miller-Fleming, L., Cheong, H., Antas, P., and Klionsky, D. J. (2014). Detection of Saccharomyces cerevisiae Atg13 by Western blot. Autophagy 10, 514–517. doi: 10.4161/auto.27707
Mizushima, N., Levine, B., Cuervo, A. M., and Klionsky, D. J. (2008). Autophagy fights disease through self-digestion. Nature 451, 1069–1075. doi: 10.1038/nature06639
Mostowy, S., Sancho-Shimizu, V., Hamon, M. A., Simeone, S., Brosch, R., Johansen, T., et al. (2011).p62 and NDP52 proteins target intracytosolic Shigella and Listeria to different autophagy pathways. J. Biol. Chem. 286, 26987–22699. doi: 10.1074/jbc.M111.223610
Nagy, P., Karpati, M., Varga, A., Pircs, K., Venkei, Z., Takats, S., et al. (2014). Atg17/FIP200 localizes to perilysosomal Ref(2)P aggregates and promotes autophagy by activation of Atg1 in Drosophila. Autophagy 10, 453–467. doi: 10.4161/auto.27442
Nakatogawa, H., Suzuki, K., Kamada, Y., and Ohsumi, Y. (2009). Dynamics and diversity in autophagy mechanisms: lessons from yeast. Nat. Rev. Mol. Cell Biol. 10, 458–467. doi: 10.1038/nrm2708
Nezis, I. P., Shravage, B. V., Sagona, A. P., Lamark, T., Bjorkoy, G., Johansen, T., et al. (2010). Autophagic degradation of dBruce controls DNA fragmentation in nurse cells during late Drosophila melanogaster oogenesis. J. Cell Biol. 190, 523–531. doi: 10.1083/jcb.201002035
Noh, J. Y., Patnaik, B. B., Tindwa, H., Seo, G. W., Kim, D. H., Patnaik, H. H., et al. (2014). Genomic organization, sequence characterization, and expression analysis of Tenebrio molitor apolipophorin-III in response to an intracellular pathogen, Listeria monocytogenes. Gene 534, 204–217. doi: 10.1016/j.gene.2013.10.058
Patnaik, B. B., Kang, S. M., Seo, G. W., Lee, H. J., Patnaik, H. H., Jo, Y. H., et al. (2013). Molecular cloning, sequence characterization and expression analysis of a CD63 homologue from the coleopteran beetle, Tenebrio molitor. Int. J. Mol. Sci. 14, 20744–20767. doi: 10.3390/ijms141020744
Patnaik, B. B., Patnaik, H. H., Seo, G. W., Jo, Y. H., Lee, Y. S., Lee, B. L., et al. (2014). Gene structure, cDNA characterization, and RNAi-based functional analysis of a myeloid differentiation factor 88 homolog in Tenebrio molitor larvae exposed to Staphylococcus aureus infection. Dev. Comp. Immunol. 46, 208–221. doi: 10.1016/j.dci.2014.04.009
Ragusa, M. J., Stanley, R. E., and Hurley, J. H. (2012). Architecture of Atg17 complex as a scaffold for autophagosome biogenesis. Cell 151, 1501–1512. doi: 10.1016/j.cell.2012.11.028
Ravikumar, B., Vacher, C., Berger, Z., Davies, J. E., Luo, S., Oroz, L. G., et al. (2004). Inhibition of mTOR induces autophagy and reduces toxicity of polyglutamine expansions in fly and mouse models of Huntington disease. Nat. Genet. 36, 585–595. doi: 10.1038/ng1362
Rubinsztein, D. C., Codogno, P., and Levine, B. (2012). Autophagy modulation as a potential therapeutic target for diverse diseases. Nat. Rev. Drug Discov. 11, 709–730. doi: 10.1038/nrd3802
Rusten, T. E., Lindmo, K., Juhasz, G., Sass, M., Seglen, P. O., Brech, A., et al. (2004). Programmed autophagy in the Drosophila fat body is induced by ecdysone through regulation of the PI3K pathway. Dev. Cell 7, 179–192. doi: 10.1016/j.devcel.2004.07.005
Sancak, Y., Bar-Peled, L., Zoncu, R., Markhard, A. L., Nada, S., and Sabatini, D. M. (2010). Regulator-Rag complex targets mTORC1 to the lysosomal surface and is necessary for its activation by amino acids. Cell 141, 290–303. doi: 10.1016/j.cell.2010.02.024
Scott, R. C., Juhasz, G., and Neufeld, T. P. (2007). Direct induction of autophagy by Atg1 inhibits cell growth and induces apoptotic cell death. Curr. Biol. 17, 1–11. doi: 10.1016/j.cub.2006.10.053
Scott, R. C., Schuldiner, O., and Neufeld, T. P. (2004). Role and regulation of starvation-induced autophagy in the Drosophila fat body. Dev. Cell 7, 167–178. doi: 10.1016/j.devcel.2004.07.009
Stephan, J. S., Yeh, Y. Y., Ramachandran, V., Deminoff, S. J., and Herman, P. K. (2009). The Tor and PKA signaling pathways independently target the Atg1/Atg13 protein kinase complex to control autophagy. Proc. Natl. Acad. Sci. U.S.A. 106, 17049–17054. doi: 10.1073/pnas.0903316106
Tamura, K., Stecher, G., Peterson, D., Filipski, A., and Kumar, S. (2013). MEGA 6.0: molecular evolutionary genetics analysis version 6.0. Mol. Biol. Evol. 30, 2725–2729. doi: 10.1093/molbev/mst197
Tarnowski, B. I., and Coons, L. B. (1989). Ultrastructure of the midgut and blood meal digestion in the adult tick Dermacentor variabilis. Exp. Appl. Acarol. 6, 263–289. doi: 10.1007/BF01193300
Tettamanti, G., Grimaldi, A., Casartelli, M., Ambrosetti, E., Ponti, B., Congiu, T., et al. (2007a). Programmed cell death and stem cell differentiation are responsible for midgut replacement in Heliothis virescens during prepupal instar. Cell Tissue Res. 330, 345–359. doi: 10.1007/s00441-007-0449-8
Tettamanti, G., Grimaldi, A., Pennacchio, F., and de Eguileor, M. (2007b). Lepidopteran larval midgut during prepupal instar: digestion or self-digestion? Autophagy 3, 630–631. doi: 10.4161/auto.4908
Tindwa, H., Patnaik, B. B., Kim, D. H., Mun, S., Jo, Y. H., Lee, B. L., et al. (2013). Cloning, characterization and effect of TmPGRP-LE silencing on survival of Tenebrio molitor against Listeria monocytogenes infection. Int. J. Mol. Sci. 14, 22462–22482. doi: 10.3390/ijms141122462
Tsukamoto, S., Kuma, A., Murakami, M., Kishi, C., Yamamoto, A., and Mizushima, M. (2008). Autophagy is essential for preimplantation development of mouse embryos. Science 321, 117–120. doi: 10.1126/science.1154822
Umemiya, R., Matsuo, T., Hatta, T., Sakakibara, S., Boldbaatar, D., and Fujisaki, K. (2007). Cloning and characterization of an autophagy-related gene, ATG12, from the three-host tick Haemaphysalis longicornis. Insect Biochem. Mol. Biol. 37, 975–984. doi: 10.1016/j.ibmb.2007.05.006
Van Zee, J. P., Geraci, N. S., Guerrero, F. D., Wikel, S. K., Stuart, J. J., Nene, V. M., et al. (2007). Tick genomics: the Ixodes genome project and beyond. Int. J. Parasitol. 37, 1297–1305. doi: 10.1016/j.ijpara.2007.05.011
Vilaplana, L., Pascual, N., Perera, N., and Belles, X. (2007). Molecular characterization of an inhibitor of apoptosis in the Egyptian armyworm, Spodoptera littoralis and midgut cell death during metamorphosis. Insect Biochem. Mol. Biol. 37, 1241–1248. doi: 10.1016/j.ibmb.2007.07.013
Yano, T., Mita, S., Ohmori, H., Oshima, Y., Fujimoto, Y., Ueda, R., et al. (2008). Autophagic control of Listeria through intracellular innate immune recognition in Drosophila. Nat. Immunol. 9, 908–916. doi: 10.1038/ni.1634
Keywords: Tenebrio molitor, autophagy, ATG13, HORMA domain, expression analysis, RNA interference
Citation: Lee JH, Jo YH, Patnaik BB, Park KB, Tindwa H, Seo GW, Chandrasekar R, Lee YS and Han YS (2015) Cloning, expression analysis, and RNA interference study of a HORMA domain containing autophagy-related gene 13 (ATG13) from the coleopteran beetle, Tenebrio molitor. Front. Physiol. 6:180. doi: 10.3389/fphys.2015.00180
Received: 21 September 2014; Accepted: 30 May 2015;
Published: 17 June 2015.
Edited by:
Xanthe Vafopoulou, York University, CanadaReviewed by:
Alexey Veraksa, University of Massachusetts Boston, USAKaliappanadar Nellaiappan, CuriRx, USA
Copyright © 2015 Lee, Jo, Patnaik, Park, Tindwa, Seo, Chandrasekar, Lee and Han. This is an open-access article distributed under the terms of the Creative Commons Attribution License (CC BY). The use, distribution or reproduction in other forums is permitted, provided the original author(s) or licensor are credited and that the original publication in this journal is cited, in accordance with accepted academic practice. No use, distribution or reproduction is permitted which does not comply with these terms.
*Correspondence: Yong Hun Jo and Yeon Soo Han, College of Agriculture and Life Science, Chonnam National University, Building No-6, 77, Yongbong-ro, Buk-gu, Gwangju 500-757, Korea,eWh1bjEyMjhAY2hvbC5jb20=;aGFueXNAam51LmFjLmty
 Jung Hee Lee1
 Yong Hun Jo
 Bharat Bhusan Patnaik
 Hamisi Tindwa
 Raman Chandrasekar
 Yeon Soo Han