 Zhenhui Li1,2
 Hongjia Ouyang1,2
 Ming Zheng1,2
 Bolin Cai1,2
 Peigong Han1,2
 Bahareldin A. Abdalla1,2
 Qinghua Nie1,2*
 Xiquan Zhang1,2
- 1Department of Animal Genetics, Breeding and Reproduction, College of Animal Science, South China Agricultural University, Guangzhou, China
- 2Guangdong Provincial Key Lab of Agro-Animal Genomics and Molecular Breeding and Key Lab of Chicken Genetics, Breeding and Reproduction, Ministry of Agriculture, Guangzhou, China
Long non-coding RNAs (lncRNAs) play important roles in transcriptional and post-transcriptional regulation. However, little is currently known about the mechanisms by which they regulate skeletal muscle development in the chicken. In this study, we used RNA sequencing to profile the leg muscle transcriptome (lncRNA and mRNA) at three stages of skeletal muscle development in the chicken: embryonic day 11 (E11), embryonic day 16 (E16), and 1 day after hatching (D1). In total, 129, 132, and 45 differentially expressed lncRNAs, and 1798, 3072, and 1211 differentially expressed mRNAs were identified in comparisons of E11 vs. E16, E11 vs. D1, and E16 vs. D1, respectively. Moreover, we identified the cis- and trans-regulatory target genes of differentially expressed lncRNAs, and constructed lncRNA-gene interaction networks. In total, 126 and 200 cis-targets, and two and three trans-targets were involved in lncRNA-gene interaction networks that were constructed based on the E11 vs. E16, and E11 vs. D1 comparisons, respectively. The comparison of the E16 vs. D1 lncRNA-gene network comprised 25 cis-targets. We determined that lncRNA target genes are potentially involved in cellular development, and cellular growth and proliferation using Ingenuity Pathway Analysis. The gene networks identified for the E11 vs. D1 comparison were involved in embryonic development, organismal development and tissue development. The present study provides an RNA sequencing based evaluation of lncRNA function during skeletal muscle development in the chicken. Comprehensive analysis facilitated the identification of lncRNAs and target genes that might contribute to the regulation of different stages of skeletal muscle development.
Introduction
Embryonic patterning and organogenesis in metazoans entail complicated processes, including cellular differentiation, migration proliferation, and programmed cell death. These complex cellular and developmental processes depend on the precise spatiotemporal expression of regulatory factors. Evidence suggests that in complex organisms, RNA contains a hidden layer of regulatory information. It not only functions as a messenger between DNA and the protein, but also plays a role in the regulation of genome organization and gene expression (Morris and Mattick, 2014). Data from high-throughput sequencing studies have revealed that only a very small percentage (1–2%) of the mammalian genome encodes proteins, but tens of thousands of intergenic sites are transcribed to non-coding RNA. This transcription plays a critical role in regulating gene expression during several biological processes (Muers, 2011). Many small non-coding RNAs, such as microRNAs (miRNAs), PIWI-interacting RNAs (piRNAs), and small nucleolar RNAs (snoRNAs) have been the subject of many functional studies; however, systematic identification of the functions of lncRNA has yet to be conducted.
LncRNAs, or mRNA-like long non-coding RNAs, are a novel class of regulatory RNAs, with sizes ranging from 200 bp to >100 kb (Novikova et al., 2013). LncRNAs are transcribed by RNA polymerase II, but do not encode proteins. There is evidence to suggest that lncRNAs, by a variety of mechanisms, serve as versatile regulators of diverse aspects of biology. The Xist gene is a master regulatory switch that controls the inactivation of the X chromosome in mammals, and is one of the first known examples of a lncRNA that directly participates in the formation of repressive chromatin (Lee and Bartolomei, 2013). Recently, specific roles of lncRNAs in the development of diverse organs and tissue types have been identified. For example, Bvht and Fendrr are two important lncRNAs that are involved in cardiac development in the mouse. In neonatal cardiomyocytes, knockdown of Bvht by RNAi changes cardiac-specific gene expression and inhibits normal development to mature cardiomyocytes (Klattenhoff et al., 2013). Similarly, knockout of Fendrr impairs heart function, leads to deficits in the body wall, and ultimately results in embryonic lethality (Grote et al., 2013). In addition to their extensive roles in organ development, lncRNAs are also known to play a role in skeletal muscle differentiation. Linc-MD1 is one of the first lncRNAs that was observed to be involved in myogenesis. This lncRNA acts as a competing endogenous RNA and “sponges” miR-133 and miR-135 to regulate the expression of MAML1 and MEF2C, which are transcription factors that activate late-differentiation muscle genes (Cesana et al., 2011). Moreover, lncRNA H19, which is highly expressed in the developing embryo and in adult muscle, functions as a molecular sponge for the let-7 family of miRNAs, and thereby regulates muscle differentiation (Kallen et al., 2013). LncRNAs can be cis-acting or trans-acting, and the location of the target gene is commonly used to distinguish between the two. Cis-acting lncRNAs regulate the expression of target genes that are located at or near the same genomic locus, whereas trans-acting lncRNAs can either inhibit or activate gene transcription at independent chromosomal loci (Fatica and Bozzoni, 2014). For example, lincRNA-p21 activates p21 expression in cis to influence the chromatin state, activate p53 pathway genes, and enforce the G1/S checkpoint (Dimitrova et al., 2014). In addition, the lncRNA Six3OS acts in trans to regulate retinal development by modulating Six3 activity (Rapicavoli et al., 2011).
Skeletal muscle development in the chicken is a multi-step process that comprises four major stages: in the initial stage, muscle precursor cells differentiate from the somite; in the second stage, myogenic precursor proliferation, and differentiation give rise to myoblasts; in the third stage, myoblast differentiation gives rise to myotubes; and finally, myofibers are formed from the myotubes (Luo et al., 2013). Many genes, such as paired box 3 (Pax3), paired box 7 (Pax7), myogenic differentiation (MyoD), myogenic factor 5 (Myf5), and myogenin (MyoG) (Sobolewska et al., 2011) are involved in the regulation of skeletal muscle development in the chicken; however, research on the role of lncRNAs in the regulation of this process remains scarce. With the aid of non-coding RNA (ncRNA) library construction, 125 ncRNAs have been identified in the chicken that play important roles in tissue development and lineage/species specification during evolution (Zhang et al., 2009). In another study, 281 new intergenic lncRNAs were identified in chicken embryo skeletal muscle, and further analyses suggested that these lncRNAs were less conserved than protein-coding genes, but slightly more conserved than random non-coding sequences (Li T. et al., 2012). Although an increasing number of lncRNAs are being characterized by high-throughput sequencing studies, few examples of regulatory mechanisms involving lncRNAs in chicken muscle development have been described.
In this study, we identified lncRNA and mRNA expression profiles in three different stages of chicken skeletal muscle development. Differentially expressed lncRNAs were then used in bioinformatics analyses to predict cis- and trans-target genes. These findings were integrated with differentially expressed mRNA data to improve the accuracy of target prediction. The predicted cis- and trans-targets were then used for the construction of lncRNA-gene correlation networks. Ingenuity Pathway Analysis (IPA) and gene ontology (GO) analysis were performed to investigate the functions associated with network genes. In summary, this study provides predictions about the functional interactions of lncRNAs and protein-coding genes, and the information generated from these predictions can be utilized in further studies of lncRNA function in chicken skeletal muscle development.
Materials and Methods
Ethics Statement
All animal experiments were performed according to protocols approved by the Institutional Animal Care and Use Committee at the South China Agricultural University (Guangzhou, People's Republic of China). All experiments were conducted in compliance with the regulations and guidelines established by that committee.
Chicken Embryo Incubation and Tissue Collection
Fertilized eggs of a native Chinese yellow meat-type chicken known as Xinghua chickens were used in the this study. The Xinghua chicken is an indigenous chicken breed from Xinghua town, Fengkai County, Guangdong province, China is characterized by a relatively slow growth rate. The fertilized eggs were incubated in a humidified incubator at 37.5°C and 65% humidity. Skeletal leg muscles were resected at embryonic day 11 (E11), embryonic day 16 (E16), and 1 day after hatching (D1). All tissues were immediately frozen in liquid nitrogen and stored at −80°C until RNA extraction. The sex of the chicken was determined by PCR amplification of the CHD1 gene using sex-specific primers (Li Z. L. et al., 2012). Chickens with two bands of 600 bp and 450 bp were born as females, whereas those with one band of 600 bp were born as males. The sex-specific primer sequences are presented in Table 1.
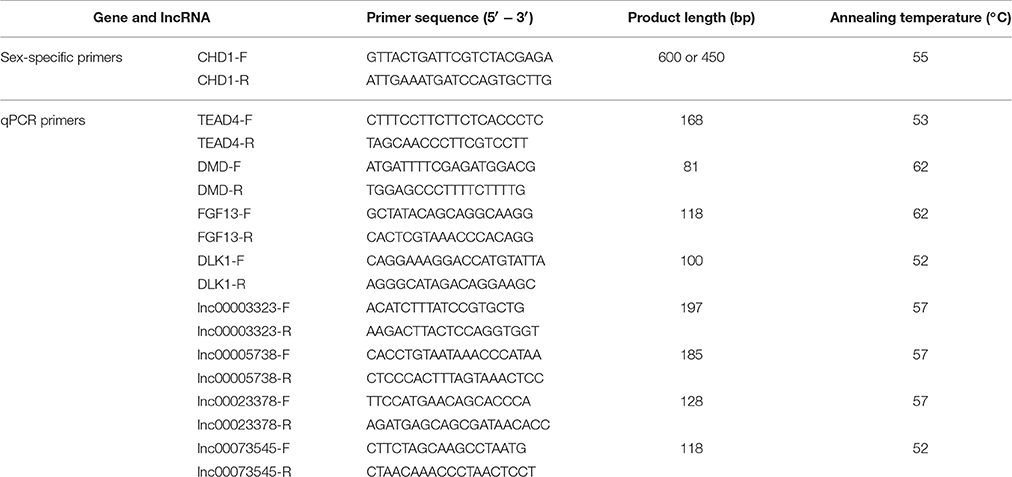
Table 1. Sex-specific primers and real-time qPCR primers.
Illumina Deep Sequencing and Sequence Analysis
Total RNA for RNA sequencing (RNA-seq) was isolated from six chicken leg muscle samples (two each from E11, E16, and D1), using Trizol Reagent (Invitrogen, Carlsbad, CA, USA) according to the manufacturer's protocol. RNA quantity and quality were evaluated on an Agilent 2100 Bioanalyzer (Agilent Technologies, Waldbronn, Germany), and RNA integrity was further examined using agarose gel electrophoresis. Ribosomal RNA (rRNA) was removed from the total RNA using the Epicentre Ribo-Zero™ rRNA Removal Kit (Epicentre, Madison, Wisconsin, USA) following the manufacturer's instructions. High-throughput RNA-seq was performed on the Illumina Hiseq 2500 platform (Illumina, San Diego, CA, USA). The Illumina sequencing raw reads were cleaned by removing empty reads, adapter sequences, reads with over 10% N sequences, and low quality reads, in which the number of bases with a quality value Q ≤ 10 was >50%. In addition, rRNA reads were identified, by blasting against the rRNA database (http://www.arb-silva.de/) using Simple Object Access Protocol (SOAP) software, and removed from the dataset. The filtered reads were mapped to the chicken reference genome (ftp://ftp.ensembl.org/pub/release-73/fasta/gallus_gallus/dna/) using the Tophat2 software. The mapped reads were assembled and transcripts were constructed using the Cufflinks 2.0.2 software. The Ensembl, NCBI RefGene, and UCSC databases were chosen as annotation references for lncRNA analyses. The Coding Potential Calculator (CPC), Coding-Non-Coding Index (CNCI) and Phylogenetic codon substitution frequency (PhyloCSF) were applied to estimate coding ability of potential lncRNAs. An RNA length ≥ 200 nt, CPC score ≤ 0, CNCI score ≤ 0, and PhyloCSF score ≤ −20 were used to evaluate the coding potential of transcripts. The RefSeq and Ensembl databases were used for gene analysis. The expression levels of the transcripts were expressed as FPKM (fragments per kilobase of transcript per million mapped reads) values using the Cuffnorm program. Differentially expressed lncRNAs and mRNAs for each comparison (E11 vs. E16, E11 vs. D1, and E16 vs. D1) were identified using Cuffdiff (the differential expression analysis tool packaged with the Cufflinks software), with a q < 0.05 and |(fold change)| ≥ 2 as the cut-off points. The sequencing data obtained from RNA-seq were released to the National Center for Biotechnology Information (NCBI) Gene Expression Omnibus (GEO) database under the accession number GSE91060.
Cis- and trans-Analyses
Differentially expressed lncRNAs were selected for cis- and trans-target gene prediction, and these findings were integrated with differentially expressed mRNA data to improve the accuracy of target prediction. To classify lncRNA cis-target genes, we used the UCSC Genome Bioinformatics tool to identify differentially expressed genes (DEGs) located ~300 kb upstream and downstream of differentially expressed lncRNAs, and determined the potential that the lncRNA was cis-acting. To classify lncRNA trans-target genes, the BLAST (e < 1E − 5) software was used to assess the impact of lncRNA binding on complete mRNA molecules. The RNAplex program (−e −20) was then used to identify possible trans-target genes of the lncRNAs. Differentially expressed lncRNAs and their corresponding differentially expressed cis- and trans-target genes were used to construct lncRNA-gene interaction networks using the Cytoscape program.
IPA, Gene Ontology, and Pathway Analysis
Gene interaction network and biological process enrichment analyses for the cis- and trans-target genes of differentially expressed lncRNAs were performed using IPA (www.ingenuity.com). Ingenuity Pathway Analysis is a web-based software from Ingenuity Systems® (Qiagen, Redwood City, CA, USA) that enables investigators to analyze data derived from high-throughput sequencing. IPA provides a comprehensive database of known networks and pathways that are continuously being updated based on published work on gene functions and interactions. Each gene identifier was imported and mapped to its corresponding gene object in the Ingenuity Pathways Knowledge Base (IPKB) and superimposed onto a global molecular network, based on the information stored in the IPKB. IPA uses computational algorithms to identify local networks that are particularly enriched for the genes of interest. A network score that is used to rank networks is also provided. This numerical score, which is based on the hyper-geometric distribution, is calculated using a right-tailed Fisher's exact test and is represented as the negative log of the P-value. Functional enrichment analysis was also performed on these networks to understand the significance of the biological functions and/or disease phenotypes of the genes in the network. The predicted lncRNA target genes were entered into the Molecule Annotation System (MAS) 3.0 (http://bioinfo.capitalbio.com/mas3), which is based on the Kyoto Encyclopedia of Genes and Genomes database (KEGG) (CapitalBio, Beijing, China). The MAS uses GO data as an advantage to identify the molecular functions represented in the gene profile. The MAS 3.0 software was used to perform GO and KEGG analyses.
Real-Time qPCR Analysis
Single-strand cDNA was synthesized from 1 μg of total RNA using the PrimeScript™ RT reagent kit with gDNA Eraser (Takara, Osaka, Japan). The qPCR reactions were performed on a Bio-Rad CFX96 Real-Time Detection system to detect the RNA expression level of each gene, using the iTaq™ Universal SYBR® Green Supermix kit (Bio-Rad Laboratories Inc., Hercules, CA, USA), for which the chicken β-actin gene was used as an internal control. Data analysis was carried out with the 2−ΔΔCt method as described previously (Livak and Schmittgen, 2001). Real-time qPCR primers were designed using the Premier Primer 5.0 software (Premier Biosoft International, Palo Alto, CA, USA). The qPCR primer sequences are presented in Table 1.
Statistical Analysis
Quantitative expressions of the data are presented as mean ± S.E.M of three independent experiments. In each experiment, the assay was performed in triplicate. Statistical significance of the data was tested by performing one-sample or paired t-tests when required. When applicable, the specific types of tests and the P < 0.05 are indicated in the figure legends.
Results
Overview of RNA-Sequencing
The Illumina Hiseq 2500 platform was used to perform RNA-seq for the six cDNA libraries, and 125 bp paired-end reads were generated. The number of raw reads generated from each library was exceeded 100 million reads (Table 2). After filtering the low quality reads, most of the clean reads still comprised more than 90% of the raw data, with the exception of the E16-2 group (85.13%) and D1-1 group (89.47%). More than 73.70% of the clean reads were perfectly mapped to the chicken reference genome. The unique mapped reads ranged from 95.62 to 96.54% of the total mapped reads (Table 2).
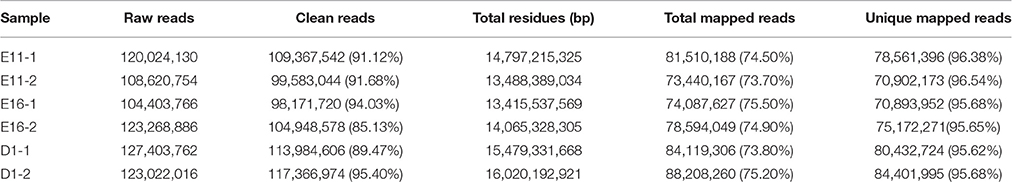
Table 2. Summary of draft reads of six libraries by RNA-sequencing.
Identification of lncRNAs in Chicken Leg Skeletal Muscle
After a stringent filtering process to discard transcripts that did not have the characteristics of lncRNAs, RNA-seq yielded 1995 lncRNA transcripts. The length of the lncRNAs ranged from 204 to 32984 bp, with 30.78 and 25.31% of lncRNAs having a length of 204–1000 and 1000–2000 bp, respectively (Figure 1A). The lncRNA genes had an average length of 2941 bp and 2.9 exons (Figures 1A,B). The 1995 lncRNA transcripts were distributed among chicken chromosomes 1–28, 33, MT, Z, and W. Quite notably, 316 lncRNAs were located in the chromosome 1 (Figure 1C).
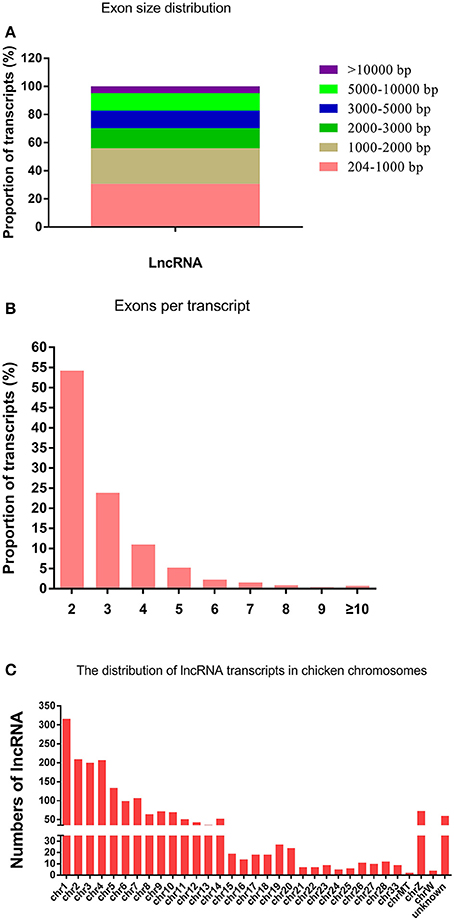
Figure 1. The features of chicken lncRNAs. (A) Exon length distribution of chicken lncRNAs. (B) Exon numbers per transcript of chicken lncRNAs. (C) Chromosome distribution of lncRNA transcripts identified in chicken leg muscle.
Differential Expression Analysis of lncRNAs and mRNAs
To investigate the key lncRNAs and mRNAs involved in chicken skeletal muscle development, RNA-seq (with rRNA removed) was performed to detect the differentially expressed lncRNAs (DE-lncRNAs) and DEGs at three stages of leg muscle development in the chicken (E11, E16, and D1). DE-lncRNAs and DEGs were identified by Cuffdiff analysis (q < 0.05; |(fold change)| ≥ 2). Among three comparisons, E11 vs. E16, E11 vs. D1, and E16 vs. D1, 129, 132, and 45 DE-lncRNAs were detected, respectively. Among these DE-lncRNAs, 26, 24, and 6 lncRNAs were uniquely expressed in one of the two samples in the E11 vs. E16 (Table S1), E11 vs. D1 (Table S2), and E16 vs. D1 (Table S3) comparisons, respectively. Of these DE-lncRNAs, six, including lnc00060568, lnc00057952, lnc00019955, lnc00064868, lnc00002354, and lnc00029488, were identified as differentially expressed among all three comparisons, whereas 61, 54, and 7 lncRNAs were found exclusively in the E11 vs. E16, E11 vs. D1, and E16 vs. D1 comparisons, respectively (Figure 2A).
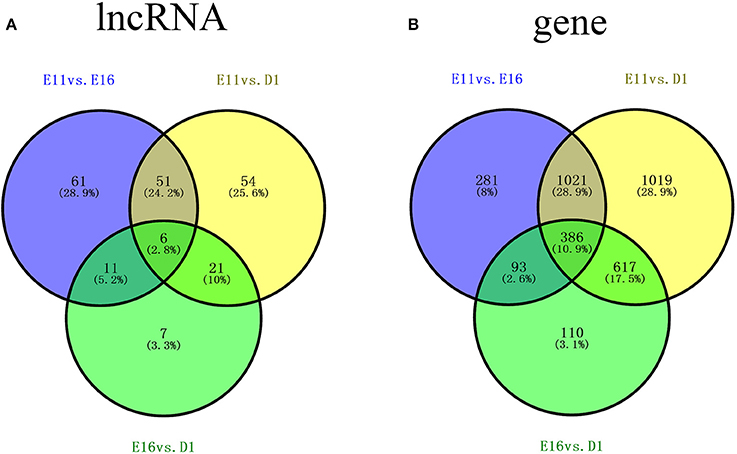
Figure 2. Venn diagrams of differentially expressed lncRNAs (DE-lncRNAs) and differentially expressed genes (DEGs) showing comparisons of three stages of skeletal muscle development in the chicken (A) Number of DE-lncRNAs for three comparisons: E11 vs. E16, E11 vs. D1, and E16 vs. D1. (B) Numbers of DEGs for three comparisons: E11 vs. E16, E11 vs. D1, and E16 vs. D1. E11, E16, and D1 indicate the developmental stages of skeletal muscle development: embryonic day 11, embryonic day 16, and 1 day after hatching, respectively.
Comparisons of gene expression levels among the three developmental stages revealed that there were 1798 DEGs (q < 0.05; |(fold change)| ≥ 2) between E11 and E16 (E11 vs. E16), 3072 DEGs between E11 and D1 (E11 vs. D1), and 1211 DEGs between E16 and D1 (E16 vs. D1). Among these DEGs, 27, 50, and 5 genes were uniquely expressed in one of the two samples in the E11 vs. E16 (Table S4), E11 vs. D1 (Table S5), and E16 vs. D1 (Table S6) comparisons, respectively. Of these DEGs, 386 genes were detected in all three comparisons, whereas 281, 1019, and 110 genes were exclusively differentially expressed in E11 vs. E16, E11 vs. D1, and E16 vs. D1 comparisons, respectively (Figure 2B).
LncRNA-Gene Interaction Network Construction
To address the question of how lncRNAs function in concert with their target genes (mRNAs) to regulate chicken muscle development, and to identify the key molecular players in this process, cis- and trans-targets of the differentially expressed lncRNAs were predicted, and the possible regulatory networks of interactions between lncRNAs and their target genes (mRNAs) were constructed. Previous studies have confirmed that lncRNAs regulate the expression of neighboring protein-coding genes through cis-acting mechanisms (Bu et al., 2012; Han et al., 2012). In addition, lncRNAs can regulate the expression of genes that are located on other chromosomes; such regulation is called trans-acting (Han et al., 2012). In the present study, bioinformatics analysis was used to predict potential cis- and trans-target genes of DE-lncRNAs, and further construct a lncRNA-gene interaction network between the DE-lncRNAs and their corresponding differentially expressed cis- and trans-target genes. Construction of the lncRNA-gene network consisted of three steps (Figure 3). Firstly, the genes within 300 kb upstream and downstream of the lncRNA were identified using the UCSC Genome Browser. Among these genes, those that were coexpressed with the lncRNA were classified as potential lncRNA cis-target genes. Secondly, BLAST and RNAplex software were used to identify trans-target genes. To narrow the field and improve the accuracy of target prediction, only those putative trans-target genes that were coexpressed with the lncRNAs were classified as trans-lncRNA target genes. Thirdly, Cytoscape was used to construct a lncRNA-gene interaction network based on the DE-lncRNAs and their corresponding differentially expressed cis- and trans-target genes. For the E11 vs. E16 comparison, the lncRNA-gene interaction network comprised 211 network nodes and 148 lncRNA-gene connections among 83 lncRNAs and 128 protein-coding genes (Figure 4, Table S7). For the E11 vs. D1 comparison, the lncRNA-gene interaction network comprised 305 network nodes and 242 lncRNA-gene connections among 102 lncRNAs and 203 protein-coding genes (Figure 5, Table S8). For the E16 vs. D1 comparison, the lncRNA-gene interaction network comprised 46 network nodes and 28 lncRNA-gene connections among 21 lncRNAs and 25 protein-coding genes (Figure 6, Table S9).
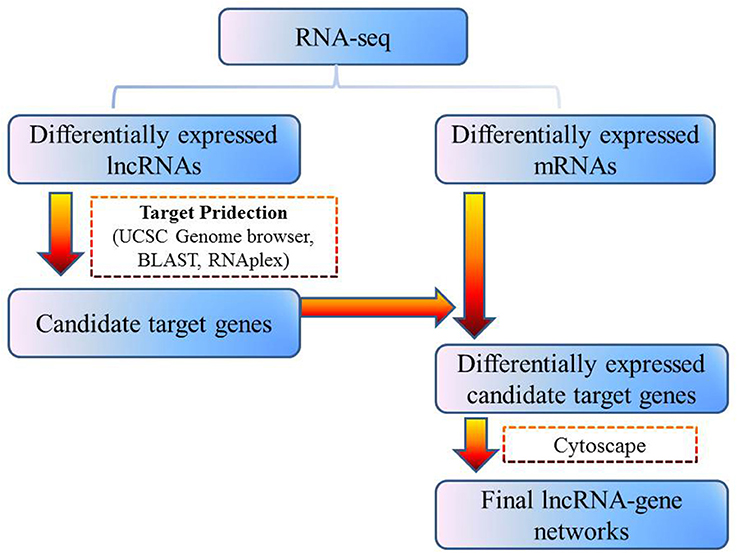
Figure 3. Schematic of lncRNA-gene interaction network construction.
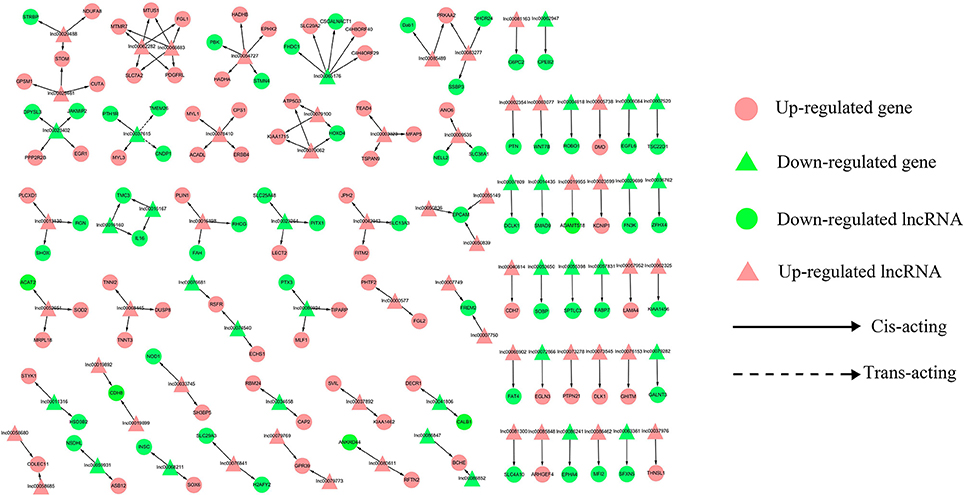
Figure 4. LncRNA-gene network for comparison of E11 vs. E16. E11 vs. E16, differentially expressed lncRNAs and their corresponding differentially expressed cis- and trans-target genes were used to construct a lncRNA-gene interaction network. In this network, up-regulated genes are displayed as pink circles, down-regulated genes are displayed as green circles, up-regulated lncRNAs are displayed as pink triangles, and down-regulated lncRNAs are displayed as green triangles. Solid lines represent the interactions between differentially expressed lncRNAs and their corresponding cis target genes, whereas the dashed lines represent interactions between differentially expressed lncRNAs and their corresponding trans-target genes.
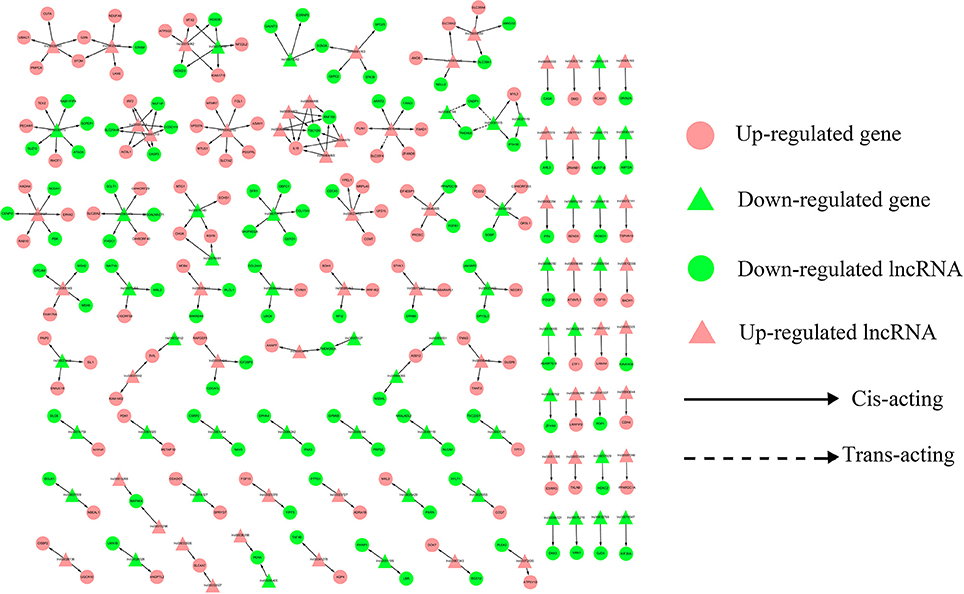
Figure 5. LncRNA-gene network for comparison of E11 vs. D1. E11 vs. D1, differentially expressed lncRNAs and their corresponding differentially expressed cis- and trans-target genes were used to construct a lncRNA-gene interaction network. In this network, up-regulated genes are displayed as pink circles, down-regulated genes are displayed as green circles, up-regulated lncRNAs are displayed as pink triangles, and down-regulated lncRNAs are displayed as green triangles. Solid and dashed lines represent the interactions between differentially expressed lncRNAs and their corresponding cis- and trans-target genes, respectively.
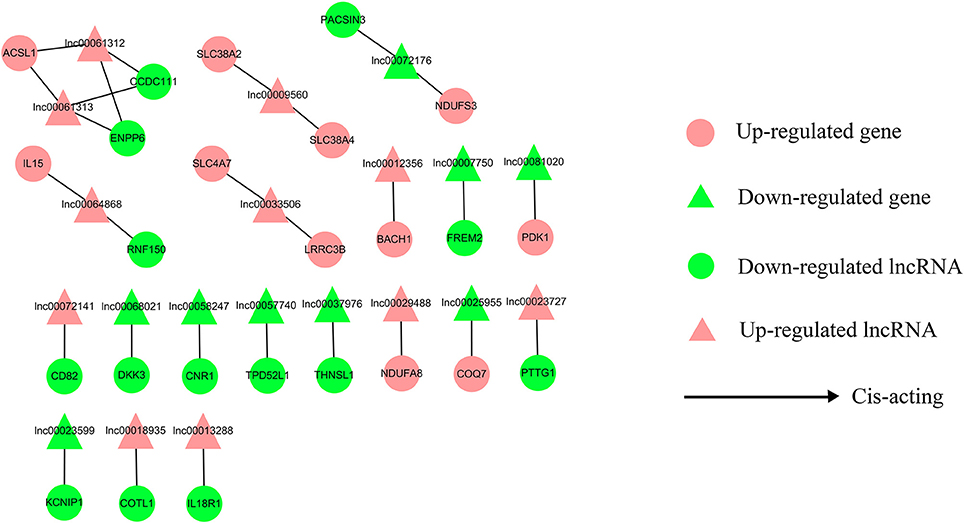
Figure 6. LncRNA-gene network for comparison of E16 vs. D1. E16 vs. D1, differentially expressed lncRNAs and their corresponding differentially expressed cis-target genes were used to construct a lncRNA-gene interaction network. In this network, up-regulated genes are displayed as pink circles, down-regulated genes are displayed as green circles, up-regulated lncRNAs are displayed as pink triangles, and down-regulated lncRNAs are displayed as green triangles. Solid lines represent the interactions between the differentially expressed lncRNAs and their corresponding cis-target genes.
We then analyzed the expression correlation between the network lncRNAs and their corresponding target genes. In the network constructed from DE-lncRNAs and target genes identified from the E11 vs. E16 comparison, 92 lncRNA-gene connections were positively correlated, whereas another 56 connections were negatively correlated (Figure 4, Table S7). For the E11 vs. D1 comparison, 138 lncRNA-gene connections were positively correlated and 104 connections were negatively correlated (Figure 5, Table S8). For the E16 vs. D1 comparison, 16 lncRNA-gene connections were positively correlated and 12 connections were negatively correlated (Figure 6, Table S9). Directionality analysis showed that for all three contrast networks, the number of positive correlations between lncRNA-gene pairs was higher than the number of negative correlations.
Ingenuity Pathway Analysis
In total, 128, 203, and 25 DEGs that were also targets of DE-lncRNAs belonged to the E11 vs. E16, E11 vs. D1, and E16 vs. D1 comparison lncRNA-gene networks, respectively. To identify the functions of the DE-lncRNAs target genes and their potential network connections, we used IPA to determine which gene networks might be affected by these DE-lncRNAs target genes. For the E11 vs. E16 comparison, we identified a total of ten networks, and the top four were related to cancer, organismal injury and abnormalities, cell cycle, developmental disorders, hereditary disorders, metabolic disease, reproductive system disease, cellular development, cellular growth and proliferation, and connective tissue development and function (Figures 7A–D, Table 1). In total, 23 (Figure 7A), 22 (Figure 7B), 20 (Figure 7C), and 15 (Figure 7D) DEGs belonged to these top four gene-gene networks. For the E11 vs. D1 comparison, 16 networks were identified and the top two were related to cell morphology, organ morphology, reproductive system development and function, embryonic development, organismal development, and tissue development (Figures 7E,F, Table 1). A total of 22 (Figure 7E), and 19 (Figure 7F) DEGs belonged to these top two gene-gene networks. In addition, for the E16 vs. D1 comparison, we identified a total of four networks, and the top two were related to nervous system development and function, cellular development, cellular growth and proliferation, developmental disorders, hereditary disorders, and ophthalmic disease (Figures 7G,H, Table 1). A total of 11 (Figure 7G), and 10 (Figure 7H) DEGs belonged to these top two gene-gene networks.
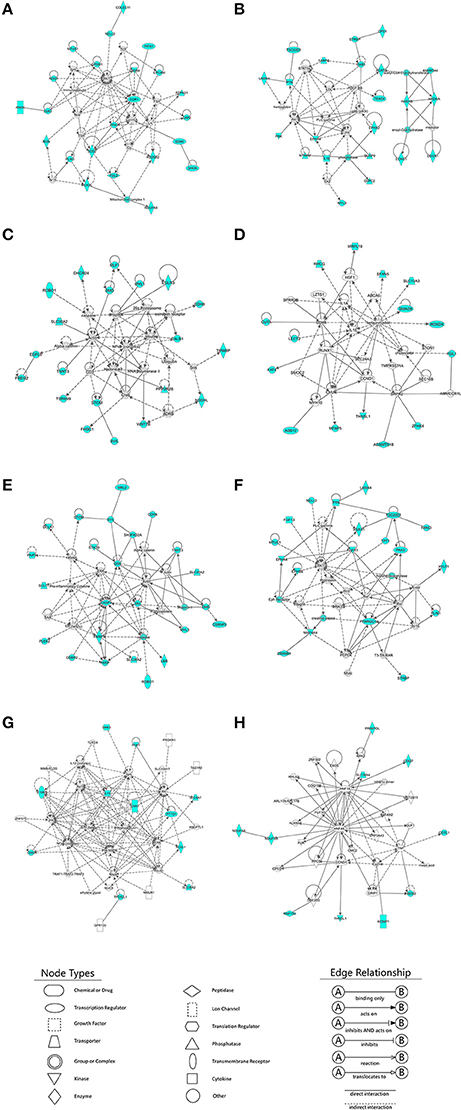
Figure 7. Ingenuity Pathway Analysis (IPA) identification of gene networks affected by differentially expressed lncRNA (DE-lncRNA) target genes. IPA online software was used to identify the gene-gene interaction networks, using differentially expressed DE-lncRNA target genes as input. (A–D) Four major gene networks identified for the E11 vs. E16 comparison. (E,F) Two major gene networks identified for the E11 vs. D1 comparison. (G,H) Two major gene networks identified for the E16 vs. D1 comparison. Nodes shaded in blue represent the DE-lncRNA target genes that are also involved in the IPA interaction network. White nodes represent transcription factors (as opposed to DE-lncRNAs target genes) that are associated with the regulation of some of these genes, based on the evidence stored in the IPA knowledgebase. Edges and nodes are annotated with labels that illustrate the nature of the relationship between the genes and their functions.
GO and KEGG Pathway Analysis
We then conducted GO and KEGG pathway analyses to gain insight into the functions of DE-lncRNA target genes. GO analysis was done to uncover enriched (q < 0.01) biological process terms for each contrast. A total of 107 enriched GO terms, including 43 for E11 vs. E16 (Figure S1A, Table S10); 51 for E11 vs. D1 (Figure S1B, Table S11); and 13 for E16 vs. D1 (Figure S1C, Table S12), were identified. Among these terms, 71 were unique GO terms that each appeared only once among all three comparisons. Many of the GO terms that were enriched in more than one comparison were related to muscle maintenance, lysine transport, ornithine transport, arginine transport, and peptide biosynthesis. A total of seven DE-lncRNA target genes involved in muscle maintenance, embryonic skeletal joint morphogenesis, post-embryonic development and organ growth were identified in the E11 vs. E16, and E11 vs. D1 comparisons, including well-known genes that affect muscle growth, such as dystrophin (DMD) and delta like non-canonical notch ligand 1 (DLK1).
KEGG pathway analysis of DE-lncRNAs target genes was done to identify pathways that were enriched in DE-lncRNA target genes. For the E11 vs. E16, E11 vs. D1, and E16 vs. D1 comparisons, 18 (Table S13), 17 (Table S14), and one (Table S15) enriched pathways (q < 0.001) were detected, respectively. For the E11 vs. E16 comparison, 11 DE-lncRNAs target genes played a role in the most significantly enriched pathways, including fatty acid metabolism, valine, leucine and isoleucine degradation, fatty acid elongation in mitochondria, and benzoate degradation via CoA ligation. In contrast, for the E11 vs. D1 comparison, the mitogen-activated protein kinase (MAPK) signaling pathway, mismatch repair, beta-Alanine metabolism, and chondroitin sulfate biosynthesis were identified as the most significantly enriched pathways, with 13 DE-lncRNAs target genes being associated with these pathways.
Verification of Gene Expression Profiles Using qRT-PCR
To confirm the accuracy and reproducibility of the DE-lncRNA and DEG expression levels obtained from RNA-seq, four well-known DE-lncRNA target genes that affect muscle development, including the TEA domain transcription factor 4 (TEAD4) (Jacquemin et al., 1996), DMD (Ghahramani et al., 2010), fibroblast growth factor 13 (FGF13) (Itoh and Ornitz, 2008), and DLK1 (Andersen et al., 2013), and their corresponding lncRNA regulators, lnc00003323, lnc00005738, lnc00023378, and lnc00073545, were selected for real-time qRT-PCR validation. The qRT-PCR primers for these lncRNAs and genes are shown in Table 1. All four lncRNAs and their target genes had similar expression patterns in comparison to the RNA-seq data (Figure 8), indicating the reliability of our RNA-seq data.
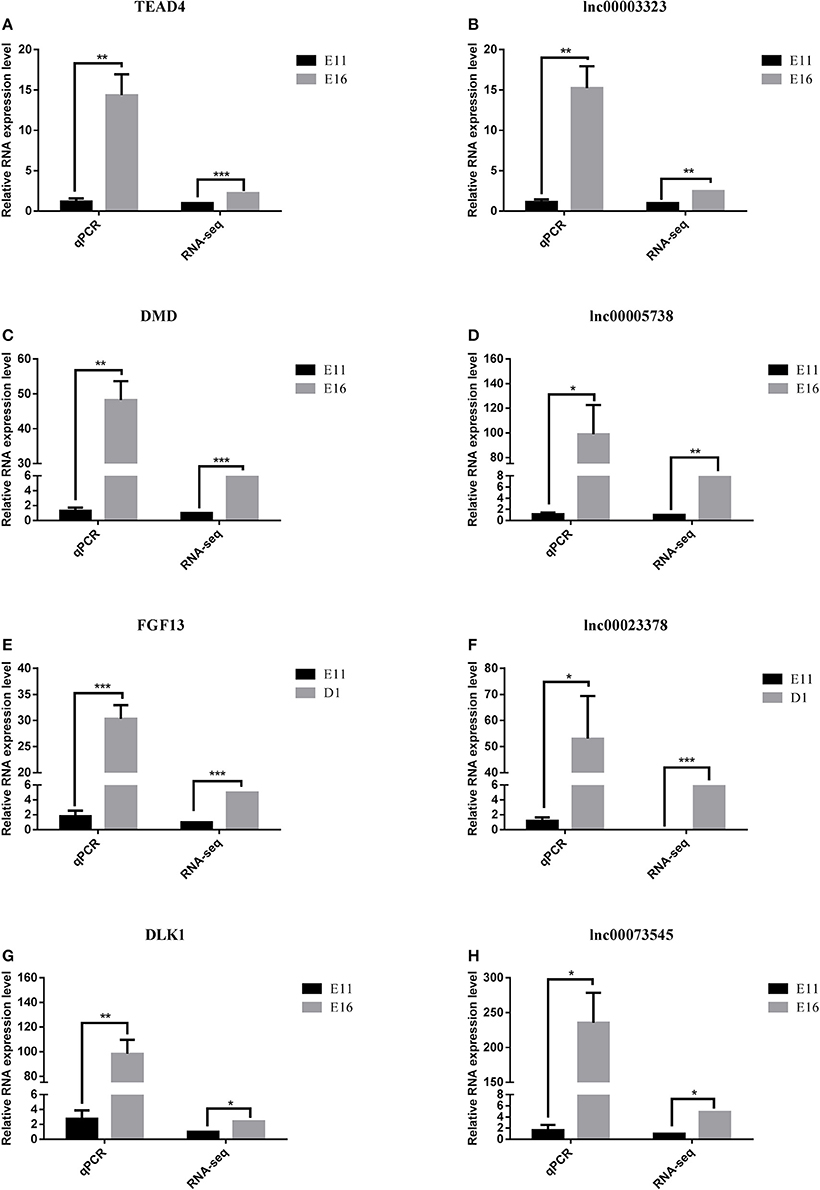
Figure 8. Quantitative real-time PCR validation of differentially expressed lncRNAs and their corresponding target genes. (A) The expression of TEAD4 was down-regulated in the E11 group compared with that in the E16 group. (B) The expression of lnc00003323 was down-regulated in the E11 group compared with that in the E16 group. (C) The expression of DMD was down-regulated in the E11 group compared with that in the E16 group. (D) The expression of lnc00005738 was down-regulated in the E11 group compared with that in the E16 group. (E) The expression of FGF13 was down-regulated in the E11 group compared with that in the D1 group. (F) The expression of lnc00023378 was down-regulated in the E11 group compared with that in the D1 group. (G) The expression of DLK1 was down-regulated in the E11 group compared with that in the E16 group. (H) The expression of lnc00073545 was down-regulated in the E11 group compared with that in the E16 group. RNA expression levels were determined by RT-qPCR analysis. Data are shown as means ± S.E.M. of at least three biological replicates. Asterisks denote statistically significant differences. *, **, and *** indicate P < 0.05, P < 0.01, and P < 0.001, respectively.
Discussion
Over the past few years, many studies have demonstrated pervasive transcription across 70–90% of mammalian genomes (Wang and Chang, 2011; Derrien et al., 2012). Surprisingly, <2% of the genome encodes protein-coding genes, indicating that non-coding RNAs comprise the majority of the transcriptome. Based on their length, non-coding transcripts can generally be divided into two major classes. Small non-coding RNAs have been relatively well-characterized, and include piRNAs, small interfering RNAs (siRNAs), microRNAs (miRNAs), and some bacterial regulatory RNAs (Fatica and Bozzoni, 2014). In contrast, lncRNAs can vary in size from 200 bp to 100 kb, and have been implicated in imprinting control (Lee and Bartolomei, 2013), cell differentiation and development (Dong et al., 2014), and skeletal muscle growth (Kallen et al., 2013). However, the function of lncRNAs in chicken muscle development remains unclear. In the present study, Illumina high-throughput sequencing was performed to provide an extensive lncRNA and gene expression profile in the previously unexamined chicken leg skeletal muscle at stages E11, E16, and D1. Multiple comparisons of lncRNA and gene transcript levels allowed us to identify 129, 132, and 45 lncRNAs, and 1798, 3072, and 1211 genes that were differentially expressed in the E11 vs. E16, E11 vs. D1, and E16 vs. D1 comparisons, respectively. Li et al. have been reported in their study the first systematic identification of lncRNAs during the development of the chicken pectoralis muscle (Li T. et al., 2012). Using RNA-seq to sample the transcriptome, they successfully identified 281 new intergenic lncRNAs in the chicken genome. However, they did not identify the targets of lncRNAs or clarify their potential functions.
LncRNAs exert their effects by targeting protein-coding genes. There is accumulating evidence to suggest that lncRNAs are important factors that control gene expression through both cis and trans-acting regulatory mechanisms (Han et al., 2012). To gain insight into how interactions between lncRNAs and their target genes regulate muscle development, interaction networks composed of DE-lncRNAs and their predicted cis- and trans-acting targets were constructed. The information about the direction (sense or antisense) of lncRNA transcripts are presented in the Tables S1–S3, S7–S9. There is not a correlation between sense cis-acting lncRNA and gene activation or antisense cis-acting lncRNA and gene silencing based on data presented in Tables S7–S9. 54.03% of cis-acting lncRNAs is located in the upstream of their corresponding target genes, while 45.48% of cis-acting lncRNAs is located in the downstream of their corresponding target genes, and only 0.49% of cis-acting lncRNAs is located in their target genes body. Using IPA system, the function of lncRNA target genes were identified. Among three contrasts (E11 vs. E16, E11 vs. D1, E16 vs. D1), the lncRNA target genes of E11 vs. E16 comparisons were independently enriched in “cancer,” “organismal injury and abnormalities,” “cell cycle,” and “connective tissue development and function”; whereas the lncRNA target genes of E11 vs. D1 comparisons were independently enriched in “cell morphology,” “organ morphology,” “embryonic development,” “organismal development,” and “tissue development”; and the lncRNA target genes of E16 vs. D1 comparisons were independently enriched in “nervous system development and function” and “ophthalmic disease” (Table 3).
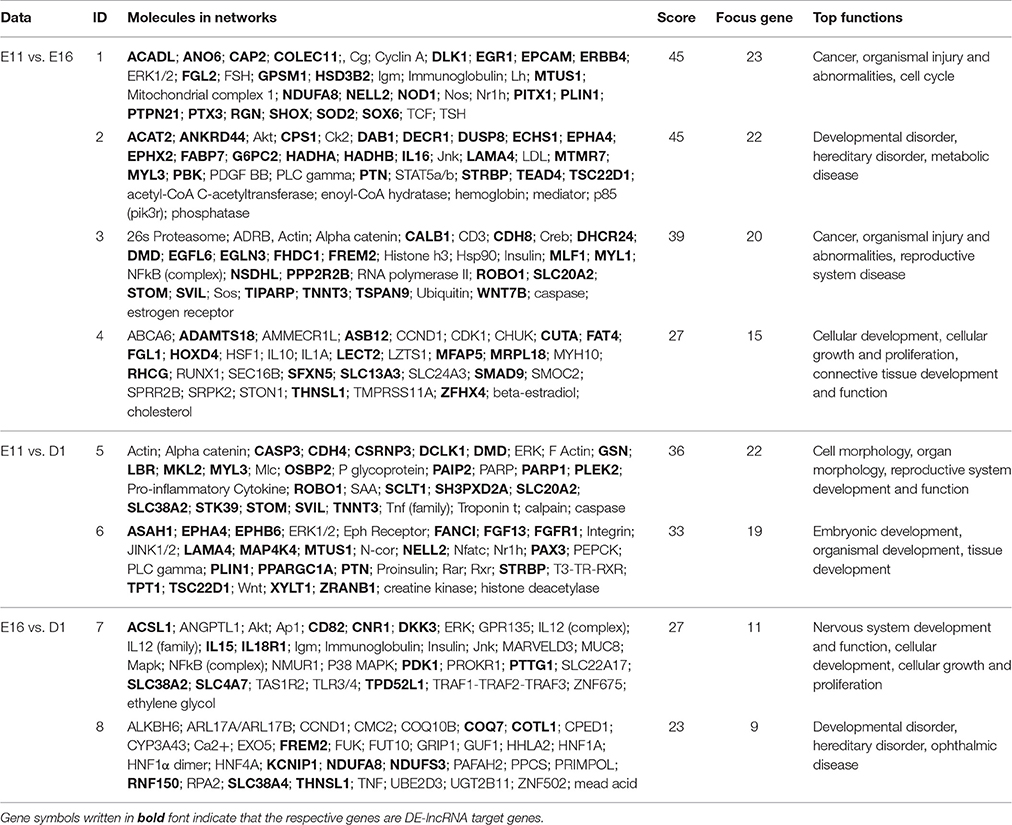
Table 3. Summary of the most highly represented networks generated by IPA analysis.
Based on the lncRNA-gene interaction networks, TEAD4 is predicted to be a target of lnc00003323. Moreover, the TEAD4 gene plays an important role in the gene-gene network that is involved in developmental disorders and metabolic disease (Figure 7B). To our knowledge, prior to this analysis, no reports existed concerning the association between TEAD4 and lncRNA. TEAD4 is a transcription factor that has a conserved TEA/ATTS DNA-binding domain, which recognizes the MCAT element in the promoters of muscle-specific genes (Benhaddou et al., 2012). In mouse embryos, TEAD4 is specifically expressed in developing skeletal muscle tissue (Jacquemin et al., 1996). A previous study demonstrated that TEAD4 is a direct target gene of the MYOD1 and MYOG transcription factors in the mouse C2C12 cell line (Jacquemin et al., 1996). In mouse 2-cell embryos, ablation of the mouse TEAD4 gene leads to lack of trophectoderm specification and early preimplantation lethality (Benhaddou et al., 2012). Moreover, TEAD4 is an important regulator of proliferation and organ size that plays a role in the Hippo signaling pathway of both Drosophila and mammalian cells (Zhao et al., 2010). The aforementioned studies indicate that TEAD4 in particular, is an important regulator of muscle development. In the present study, TEAD4 was expressed at higher levels at stage E16 than at stage E11, in skeletal muscles of the leg (Figure 8A). The predicted regulatory lncRNA, lnc00003323, could control the expression of TEAD4 via cis-acting mechanisms, and is expressed at higher levels in skeletal muscle at stage E16 than at stage E11 (Figure 8B). Authors of a previous study have suggested that lncRNAs could activate the transcription of nearby genes in cis by recruiting remodeling factors to local chromatin (Luo et al., 2015). The positive relationship between lnc00003323 and TEAD4 observed in the present study indicates that lnc00003323 targets TEAD4 via cis-acting mechanisms to regulate skeletal muscle development in the chicken.
In the E11 vs. E16 comparison lncRNA-gene network (Figure 4), the DMD gene is the putative cis-target of lnc00005738. In addition, DMD plays an important role in gene-gene networks that are involved in organismal injury and abnormalities, cell morphology and organ morphology (Figures 7C,E). The DMD gene is the largest gene described in human beings that encodes a rod-like cytoskeletal protein that is found at the inner surface of muscle fibers in skeletal and cardiac muscles (Muntoni et al., 2003). The encoded protein, dystrophin, is required for proper development and organization of myofibers, as contractile units in striated muscles (Ghahramani et al., 2010).
In the E11 vs. D1 comparison lncRNA-gene network (Figure 5), FGF13 is a predicted cis-target of lnc00023378 that is a part of the gene-gene interaction network that is related to embryonic development, organismal development, and tissue development (Figure 7F). FGF13 is a member of the fibroblast growth factor (FGF) family. Members of this family possess broad mitogenic and cell survival activities, and are involved in a variety of biological processes, including embryonic development, cell growth, morphogenesis, tissue repair, tumor growth, and invasion (Itoh and Ornitz, 2008). A recent study demonstrated that FGF13 regulates proliferation and differentiation of skeletal muscle by down-regulating Spry1 (Lu et al., 2015). DLK1, which encodes a transmembrane protein, is the putative cis-target of lnc00073545 (Figure 4). DLK1 is an imprinted gene, the increased expression of which is associated with muscle hypertrophy in animal models. As with many imprinted genes, DLK1 plays an important role in mammalian development, and its expression level exerts remarkable effects on cell proliferation and differentiation (Waddell et al., 2010). Previous research has shown that DLK1 is a crucial regulator of the myogenic program in skeletal muscle. During embryogenesis, DLK1 knockout mice display developmental delays in gaining muscle mass and function, owing to inhibition of the myogenic program (Andersen et al., 2013). In the present study, lnc00073545 and DLK1 were expressed at higher levels in skeletal muscle of the leg at stage E16, as compared to stage E11 (Figures 8G,H). The positive correlation between lnc00073545 and DLK1 expression patterns suggest that lnc00073545 might play an important role in skeletal muscle development in the chicken via its cis-regulation of DLK1.
In summary, we have identified a set of lncRNAs and genes that are differentially expressed at three different stages of skeletal muscle development in the chicken. The functions of, and biological processes associated with lncRNAs in skeletal muscle development were determined, based on IPA analysis and GO and KEGG pathway annotations of lncRNA target genes. The results of the cis- and trans-acting lncRNA target gene analyses and the lncRNA-gene interaction networks provide information that could be utilized in further studies of lncRNA function in skeletal muscle development in the chicken.
Author Contributions
ZL: performed research, analyzed data, and wrote the paper. HO: analyzed data and was involved in the study design. MZ, BC, PH: analyzed data. BA: reviewed the manuscript. QN conceived the study, and was involved in its design and coordination. XZ was involved in the design of the study.
Funding
This research was supported by the Program for New Century Excellent Talents in University (NCET-13-0803) and the Foundation for High-level Talents in Higher Education of Guangdong, China.
Conflict of Interest Statement
The authors declare that the research was conducted in the absence of any commercial or financial relationships that could be construed as a potential conflict of interest.
Supplementary Material
The Supplementary Material for this article can be found online at: http://journal.frontiersin.org/article/10.3389/fphys.2016.00687/full#supplementary-material
Abbreviations
CNCI, Coding-Non-Coding Index; CPC, Coding Potential Calculator; DEG, differentially expressed genes; FGF, fibroblast growth factor; GO, gene ontology; IPA, Ingenuity Pathway Analysis; IPKB, Ingenuity Pathways Knowledge Base; KEGG, Kyoto Encyclopedia of Genes and Genomes; PhyloCSF, Phylogenetic codon substitution frequency; DMD, dystrophin gene (gene that causes Duchenne muscular dystrophy); LncRNA, long non-coding RNA.
References
Andersen, D. C., Laborda, J., Baladron, V., Kassem, M., Sheikh, S. P., and Jensen, C. H. (2013). Dual role of delta-like 1 homolog (DLK1) in skeletal muscle development and adult muscle regeneration. Development 140, 3743–3753. doi: 10.1242/dev.095810
Benhaddou, A., Keime, C., Ye, T., Morlon, A., Michel, I., Jost, B., et al. (2012). Transcription factor TEAD4 regulates expression of myogenin and the unfolded protein response genes during C2C12 cell differentiation. Cell Death Differ. 19, 220–231. doi: 10.1038/cdd.2011.87
Bu, Q., Hu, Z., Chen, F., Zhu, R., Deng, Y., Shao, X., et al. (2012). Transcriptome analysis of long non-coding RNAs of the nucleus accumbens in cocaine-conditioned mice. J. Neurochem. 123, 790–799. doi: 10.1111/jnc.12006
Cesana, M., Cacchiarelli, D., Legnini, I., Santini, T., Sthandier, O., Chinappi, M., et al. (2011). A long noncoding RNA controls muscle differentiation by functioning as a competing endogenous RNA. Cell 147, 358–369. doi: 10.1016/j.cell.2011.09.028
Derrien, T., Johnson, R., Bussotti, G., Tanzer, A., Djebali, S., Tilgner, H., et al. (2012). The GENCODE v7 catalog of human long noncoding RNAs: analysis of their gene structure, evolution, and expression. Genome Res. 22, 1775–1789. doi: 10.1101/gr.132159.111
Dimitrova, N., Zamudio, J. R., Jong, R. M., Soukup, D., Resnick, R., Sarma, K., et al. (2014). LincRNA-p21 activates p21 in cis to promote Polycomb target gene expression and to enforce the G1/S checkpoint. Mol. Cell 54, 777–790. doi: 10.1016/j.molcel.2014.04.025
Dong, R., Jia, D., Xue, P., Cui, X., Li, K., Zheng, S., et al. (2014). Genome-wide analysis of long noncoding RNA (lncRNA) expression in hepatoblastoma tissues. PLoS ONE 9:e85599. doi: 10.1371/journal.pone.0085599
Fatica, A., and Bozzoni, I. (2014). Long non-coding RNAs: new players in cell differentiation and development. Nat. Rev. Genet. 15, 7–21. doi: 10.1038/nrg3606
Ghahramani, S. M., Trollet, C., Athanasopoulos, T., Graham, I. R., Hu, P., and Dickson, G. (2010). Transcriptomic analysis of dystrophin RNAi knockdown reveals a central role for dystrophin in muscle differentiation and contractile apparatus organization. BMC Genomics 11:345. doi: 10.1186/1471-2164-11-345
Grote, P., Wittler, L., Hendrix, D., Koch, F., Währisch, S., Beisaw, A., et al. (2013). The tissue-specific lncRNA Fendrr is an essential regulator of heart and body wall development in the mouse. Dev. Cell 24, 206–214. doi: 10.1016/j.devcel.2012.12.012
Han, L., Zhang, K., Shi, Z., Zhang, J., Zhu, J., Zhu, S., et al. (2012). LncRNA profile of glioblastoma reveals the potential role of lncRNAs in contributing to glioblastoma pathogenesis. Int. J. Oncol. 40, 2004–2012. doi: 10.3892/ijo.2012.1413
Itoh, N., and Ornitz, D. M. (2008). Functional evolutionary history of the mouse Fgf gene family. Dev. Dyn. 237, 18–27. doi: 10.1002/dvdy.21388
Jacquemin, P., Hwang, J. J., Martial, J. A., Dollé, P., and Davidson, I. (1996). A novel family of developmentally regulated mammalian transcription factors containing the TEA/ATTS DNA binding domain. J. Biol. Chem. 271, 21775–21785. doi: 10.1074/jbc.271.36.21775
Kallen, A. N., Zhou, X. B., Xu, J., Qiao, C., Ma, J., Yan, L., et al. (2013). The imprinted H19 lncRNA antagonizes let-7 microRNAs. Mol. Cell 52, 101–112. doi: 10.1016/j.molcel.2013.08.027
Klattenhoff, C. A., Scheuermann, J. C., Surface, L. E., Bradley, R. K., Fields, P. A., Steinhauser, M. L., et al. (2013). Braveheart, a long noncoding RNA required for cardiovascular lineage commitment. Cell 152, 570–583. doi: 10.1016/j.cell.2013.01.003
Lee, J. T., and Bartolomei, M. S. (2013). X-inactivation, imprinting, and long noncoding RNAs in health and disease. Cell 152, 1308–1323. doi: 10.1016/j.cell.2013.02.016
Li, T., Wang, S., Wu, R., Zhou, X., Zhu, D., and Zhang, Y. (2012). Identification of long non-protein coding RNAs in chicken skeletal muscle using next generation sequencing. Genomics 99, 292–298. doi: 10.1016/j.ygeno.2012.02.003
Li, Z. L., Qin, Q-M., Shi, Z. D., Chen, H. N., and Huang, Q. S. (2012). Sex identification with direct whole blood PCR amplification in chicklings and chicken embryos. China Anim. Husbandry Vet. Med. 9, 74–78.
Livak, K. J., and Schmittgen, T. D. (2001). Analysis of relative gene expression data using real-time quantitative PCR and the 2−ΔΔCT Method. Methods 25, 402–408. doi: 10.1006/meth.2001.1262
Lu, H., Shi, X., Wu, G., Zhu, J., Song, C., Zhang, Q., et al. (2015). FGF13 regulates proliferation and differentiation of skeletal muscle by down-regulating Spry1. Cell Prolif. 48, 550–560. doi: 10.1111/cpr.12200
Luo, W., Nie, Q., and Zhang, X. (2013). MicroRNAs involved in skeletal muscle differentiation. J. Genet. Genomics 40, 107–116. doi: 10.1016/j.jgg.2013.02.002
Luo, Z., Li, Y., Liu, X., Luo, M., Xu, L., Luo, Y., et al. (2015). Systems biology of myasthenia gravis, integration of aberrant lncRNA and mRNA expression changes. BMC Med. Genomics 8:13. doi: 10.1186/s12920-015-0087-z
Morris, K. V., and Mattick, J. S. (2014). The rise of regulatory RNA. Nat. Rev. Genet. 15, 423–437. doi: 10.1038/nrg3722
Muers, M. (2011). RNA: genome-wide views of long non-coding RNAs. Nat. Rev. Genet. 12, 742. doi: 10.1038/nrg3088
Muntoni, F., Torelli, S., and Ferlini, A. (2003). Dystrophin and mutations: one gene, several proteins, multiple phenotypes. Lancet Neurol. 2, 731–740. doi: 10.1016/S1474-4422(03)00585-4
Novikova, I. V., Hennelly, S. P., Tung, C. S., and Sanbonmatsu, K. Y. (2013). Rise of the RNA machines: exploring the structure of long non-coding RNAs. J. Mol. Biol. 425, 3731–3746. doi: 10.1016/j.jmb.2013.02.030
Rapicavoli, N. A., Poth, E. M., Zhu, H., and Blackshaw, S. (2011). The long noncoding RNA Six3OS acts in trans to regulate retinal development by modulating Six3 activity. Neural. Dev. 6:32. doi: 10.1186/1749-8104-6-32
Sobolewska, A., Elminowska-Wenda, G., Bogucka, J., Szpinda, M., Walasik, K., Bednarczyk, M., et al. (2011). Myogenesis–possibilities of its stimulation in chickens. Folia Biol. 59, 85–90. doi: 10.3409/fb59_3-4.85-90
Waddell, J. N., Zhang, P., Wen, Y., Gupta, S. K., Yevtodiyenko, A., Schmidt, J. V., et al. (2010). Dlk1 is necessary for proper skeletal muscle development and regeneration. PLoS ONE 5:e15055. doi: 10.1371/journal.pone.0015055
Wang, K. C., and Chang, H. Y. (2011). Molecular mechanisms of long noncoding RNAs. Mol. Cell 43, 904–914. doi: 10.1016/j.molcel.2011.08.018
Zhang, Y., Wang, J., Huang, S., Zhu, X., Liu, J., Yang, N., et al. (2009). Systematic identification and characterization of chicken (Gallus gallus) ncRNAs. Nucleic Acids Res. 37, 6562–6574. doi: 10.1093/nar/gkp704
Keywords: chicken, long non-coding RNA, cis-acting, trans-acting, skeletal muscle development
Citation: Li Z, Ouyang H, Zheng M, Cai B, Han P, Abdalla BA, Nie Q and Zhang X (2017) Integrated Analysis of Long Non-coding RNAs (LncRNAs) and mRNA Expression Profiles Reveals the Potential Role of LncRNAs in Skeletal Muscle Development of the Chicken. Front. Physiol. 7:687. doi: 10.3389/fphys.2016.00687
Received: 25 October 2016; Accepted: 23 December 2016;
Published: 09 January 2017.
Edited by:
Xiaogang Wu, Institute for Systems Biology, USAReviewed by:
Stephen K. Anderson, National Cancer Institute-Frederick, USAHongli Du, South China University of Technology, China
Zhonglin Tang, Institute of Animal Science, Chinese Academy of Agricultural Sciences, China
Copyright © 2017 Li, Ouyang, Zheng, Cai, Han, Abdalla, Nie and Zhang. This is an open-access article distributed under the terms of the Creative Commons Attribution License (CC BY). The use, distribution or reproduction in other forums is permitted, provided the original author(s) or licensor are credited and that the original publication in this journal is cited, in accordance with accepted academic practice. No use, distribution or reproduction is permitted which does not comply with these terms.
*Correspondence: Qinghua Nie, bnFpbmdodWFAc2NhdS5lZHUuY24=