 Shalaya Kipp
 Rodger Kram
 Wouter Hoogkamer
- 1Department of Integrative Physiology, University of Colorado, Boulder, CO, United States
- 2School of Kinesiology, University of British Columbia, Vancouver, BC, Canada
Training, footwear, nutrition, and racing strategies (i.e., drafting) have all been shown to reduce the metabolic cost of distance running (i.e., improve running economy). However, how these improvements in running economy (RE) quantitatively translate into faster running performance is less established. Here, we quantify how metabolic savings translate into faster running performance, considering both the inherent rate of oxygen uptake-velocity relation and the additional cost of overcoming air resistance when running overground. We collate and compare five existing equations for oxygen uptake-velocity relations across wide velocity ranges. Because the oxygen uptake vs. velocity relation is non-linear, for velocities slower than ∼3 m/s, the predicted percent improvement in velocity is slightly greater than the percent improvement in RE. For velocities faster than ∼3 m/s, the predicted percent improvement in velocity is less than the percent improvements in RE. At 5.5 m/s, i.e., world-class marathon pace, the predicted percent improvement in velocity is ∼2/3rds of the percent improvement in RE. For example, at 2:04 marathon pace, a 3% improvement in RE translates to a 1.97% faster velocity or 2:01:36, almost exactly equal to the recently set world record.
Introduction
The remarkable 2:00:25 exhibition marathon in Monza, Italy in 2017 and the current world record time of 2:01:39 set in Berlin in 2018 by Eliud Kipchoge raise an intriguing question: can we predict improvements in endurance running performance based on improvements in running economy (RE)? Together with lactate threshold and maximal oxygen uptake ( O2max), RE is one of the three primary physiological determinants of performance (Daniels, 1985; Joyner, 1991; Foster and Lucia, 2007). RE is traditionally defined as the rate of oxygen uptake (O2, in mlO2/kg/min) for running at a specified submaximal velocity1. Improvements in RE allow athletes to run at a faster velocity for the same oxygen uptake and thus achieve superior performances (Joyner, 1991; Hoogkamer et al., 2016, 2017). RE can also be expressed in oxygen uptake per unit distance (in mlO2/kg/km), by dividing O2 by the running velocity at which it was assessed. From ∼2.2 to 5.6 m/s (8–20 km/h), net O2 (gross minus rest or standing) per distance remains fairly constant (Margaria et al., 1963; di Prampero et al., 1986; Saibene and Minetti, 2003; Lacour and Bourdin, 2015). Accordingly, 1% improvements in RE (lower rates) should directly translate to 1% faster running performances (Daniels and Daniels, 1992; McLaughlin et al., 2010). Indeed, we demonstrated that laboratory-measured percent changes in RE translate to similar percent changes in distance running performance (assessed by 3 km time trials) (Hoogkamer et al., 2016).
Recently, we have used these insights and models to translate metabolic savings reported in the literature (Hoogkamer et al., 2017) and measured in our laboratory (Hoogkamer et al., 2018a) into predicted improvements in elite marathon running performances. Unfortunately, the heterogeneity of racecourses, meteorological and competitive conditions, combined with fluctuations in the training status of elite marathon runners preclude controlled experiments on racing performance. Recent marathon race results suggest that finishing times may not match the theoretically predicted improvements from drafting (Hoogkamer et al., 2017) or advances in shoe technology (Hoogkamer et al., 2018a). Here, we examine the assumptions underlying our extrapolations and derive a revised model for extrapolating metabolic savings into running performance improvements.
Running Velocity and O2
To extrapolate how changes in RE will impact performance, we focus on the gross O2-velocity relation. If the relation is directly proportional with a zero O2-intercept, running 1% faster exacts a 1% higher metabolic rate and we can expect that a 1% improvement in RE would allow for a 1% faster race performance (Hoogkamer et al., 2016). There are many reports of linear gross O2-velocity relations for treadmill running. The relations have either positive (Pugh, 1970; Léger and Mercier, 1984; Helgerud et al., 2010) or negative O2-intercepts (Joyner, 1991; Daniels and Daniels, 1992; Jones and Doust, 1996), depending on the velocity ranges considered. In the case of a linear gross O2-velocity relation with a positive O2-intercept, running 1% faster requires less than 1% more oxygen. In the case of a linear gross O2-velocity relation with a negative O2-intercept, running 1% faster requires more than 1% more oxygen. It is therefore critical to base any extrapolation of metabolic savings to running performance on the best available O2-velocity relation data.
More recent treadmill running studies have indicated that both the gross O2-velocity relation and the metabolic rate (Watts or kcal/min)-velocity relations are actually better described as inherently curvilinear, especially over wide ranges in velocity (Steudel-Numbers and Wall-Scheffler, 2009; Batliner et al., 2018; Black et al., 2018; Kipp et al., 2018). Figure 1A illustrates both linear and curvilinear regressions to treadmill running data from 10 high-level male runners (<30-min 10 km) for velocities spanning 1.78–5.14 m/s and measured at ∼1600 m altitude (Batliner et al., 2018). The upward curvilinear relation explains why a positive gross O2-intercept is observed when a linear regression line is fitted to slow velocity gross O2 data (Bransford and Howley, 1977; Maughan and Leiper, 1983) and a negative intercept when fitted to fast velocity gross O2 data (Conley and Krahenbuhl, 1980; Joyner, 1991; Daniels and Daniels, 1992; Jones and Doust, 1996). A critical implication of a curvilinear gross O2-velocity relation is that at fast running velocities, a 1% improvement in RE translates to smaller (<1%) improvements in running velocity and thus a less than directly proportional performance benefit. This inherent upward curvilinearity, has not previously been accounted for in models to predict running performance (di Prampero et al., 1986; McLaughlin et al., 2010).
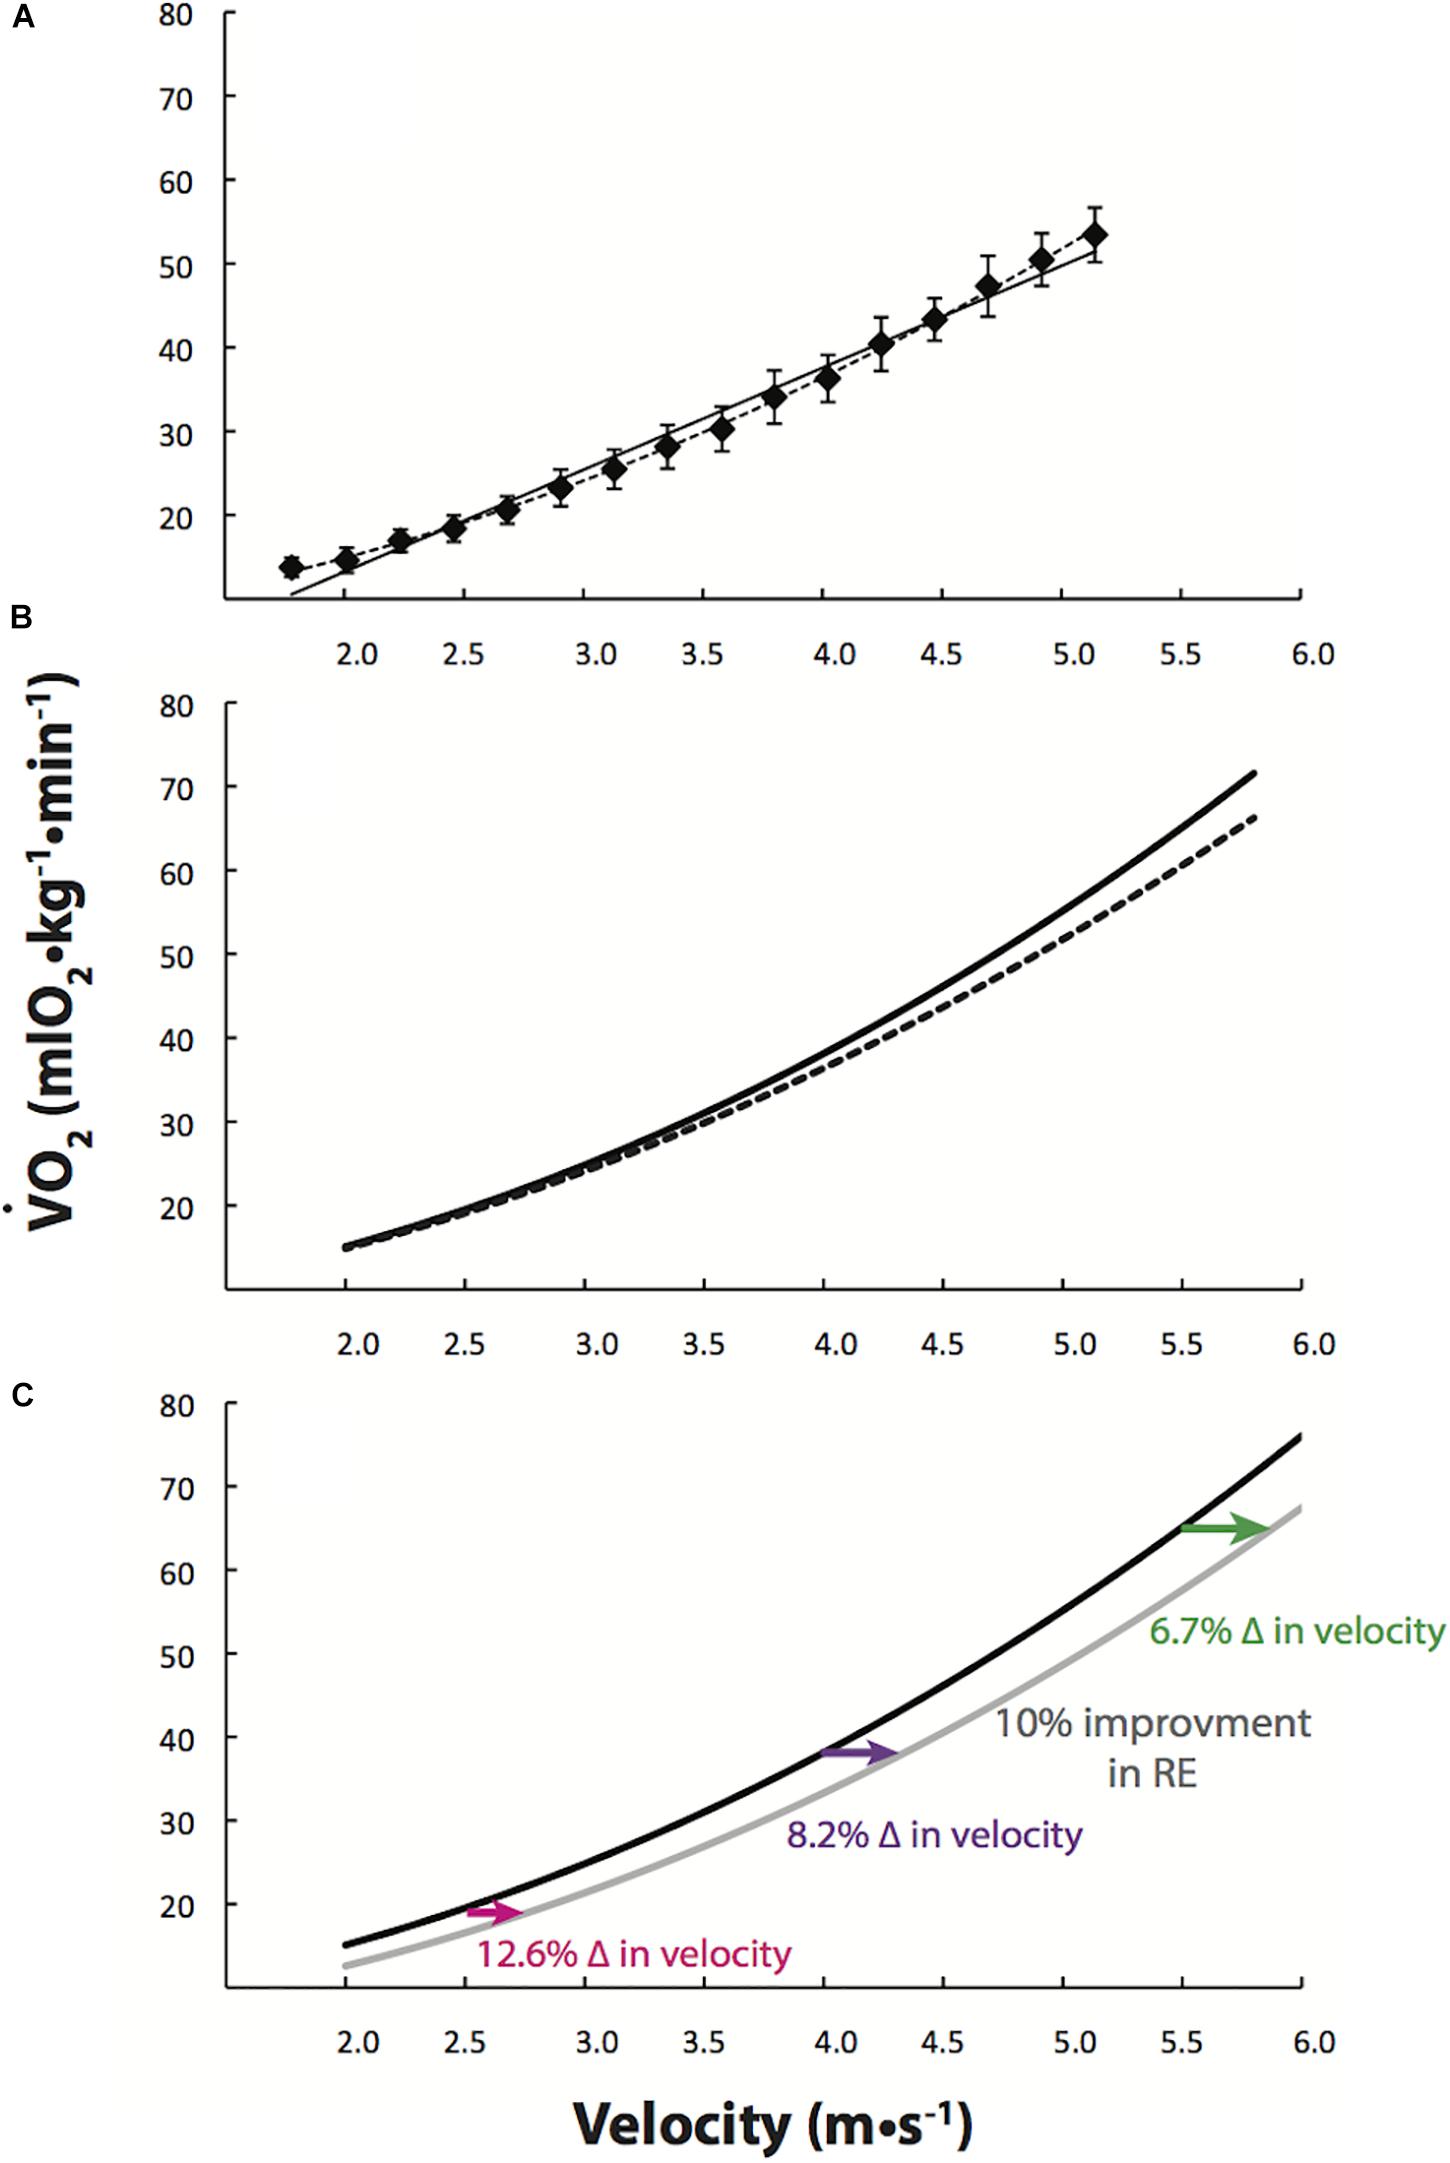
Figure 1. Oxygen uptake (O2) increases curvilinearly with running velocity. (A) Linear (solid line) and curvilinear (dashed line) regressions to treadmill running data from 10 high-level male runners (<30-min 10 km) over a wide range of velocities (1.78–5.14 m/s) (Batliner et al., 2018). (B) Batliner et al. (2018) quadratic equation (dashed line) and the quadratic equation combined with Pugh’s cubic term for overcoming air resistance (solid line), as per Eq. [2]. (C) Based on this cubic Eq. [2] (black line), a 10% improvement in running economy (RE; gray line) allows for percent improvements in running velocity which depend on running velocity itself. At slower running velocities (∼<3.0 m/s), O2 increases gradually with increases in running velocity, and, as a result at 2.5 m/s a 10% improvement in RE should facilitate running 12.6% faster. At faster running velocities, O2 increases steeply with running velocity and as a result at 5.5 m/s, a 10% improvement in RE should allow for running only 6.7% faster.
Air resistance is a second important consideration when translating metabolic savings quantified in treadmill studies to overground running performance. Most studies that show a curvilinear O2-velocity relation have actually been conducted on treadmills, with negligible air resistance (Steudel-Numbers and Wall-Scheffler, 2009; Black et al., 2018; Batliner et al., 2018; Kipp et al., 2018). However, as described by Pugh (1970, 1971), the oxygen cost of overcoming air resistance can be expected to increase more than proportionally at faster running velocities, since air drag force is proportional to air (running) velocity squared (du Bois-Reymond, 1925; Hill, 1928) and hence mechanical power (force × velocity) is proportional to velocity cubed. Specifically, Pugh (1971) related the metabolic cost of overcoming air resistance to the mechanical power needed to overcome the air drag forces during running: O2 (L/min) = 0.00354⋅Ap⋅v3 for an athlete of projected frontal area Ap (m2), running at velocity v (m/s), through still air. Throughout this paper, we will use an Ap of 0.45 m2, for an elite male marathoner (58 kg and 1.71 m) (DuBois and DuBois, 1916; Hoogkamer et al., 2017). Léger and Mercier (1984) added Pugh’s cubic air resistance term to the linear equation they had derived from a regression on data from 10 separate treadmill studies over various moderate velocity ranges. Velocity (v) is expressed in m/s for all equations below.
Léger and Mercier, 1984 (including Pugh’s cubic term):
In Eq. 2 and Figure 1B (sold line), we added Pugh’s cubic air resistance term to the inherent curvilinear equation from Batliner et al., 2018.
Batliner et al., 2018 + Pugh’s cubic term:
In Figure 1C we have depicted how this curvilinear O2-velocity relation affects the predicted improvements in running velocity with a consistent hypothetical 10% improvement in RE. The percent velocity enhancement resulting from an improvement in RE depends on the baseline running velocity itself.
Running Velocity and Potential Improvements in Velocity
Multiple long-term interventions, such as endurance, interval, resistance, and plyometric training, have been shown to improve RE (for review: Saunders et al., 2004; Barnes and Kilding, 2015). Other factors such as the racecourse elevation profile (e.g., downhill) (Minetti et al., 2002), favorable meteorological conditions and innovations in footwear can also improve RE (Hoogkamer et al., 2017). Recently, we showed that a prototype of the Nike Vaporfly 4%, a shoe with exceptionally compliant and resilient midsole in which a stiff carbon-fiber plate is embedded improved RE by an average of 4%, compared to two well-established racing shoes (Hoogkamer et al., 2018a). The mechanisms behind the energy savings have been detailed in Hoogkamer et al. (2019). How much faster could an athlete wearing these shoes run, assuming their response is equal the average response of our group; i.e., a consistent improvement in RE of 4%?
We quantified the possible improvements in running velocity using Eqs 1 and 2, by Léger and Mercier (1984) and Batliner et al. (2018), treadmill data from Black et al. (2018) and Kipp et al. (2018), and overground running data from Tam et al. (2012). Figure 2A shows how the improvements in running velocity that are possible with a 4% improvement in RE depend on running velocity for each of these studies.
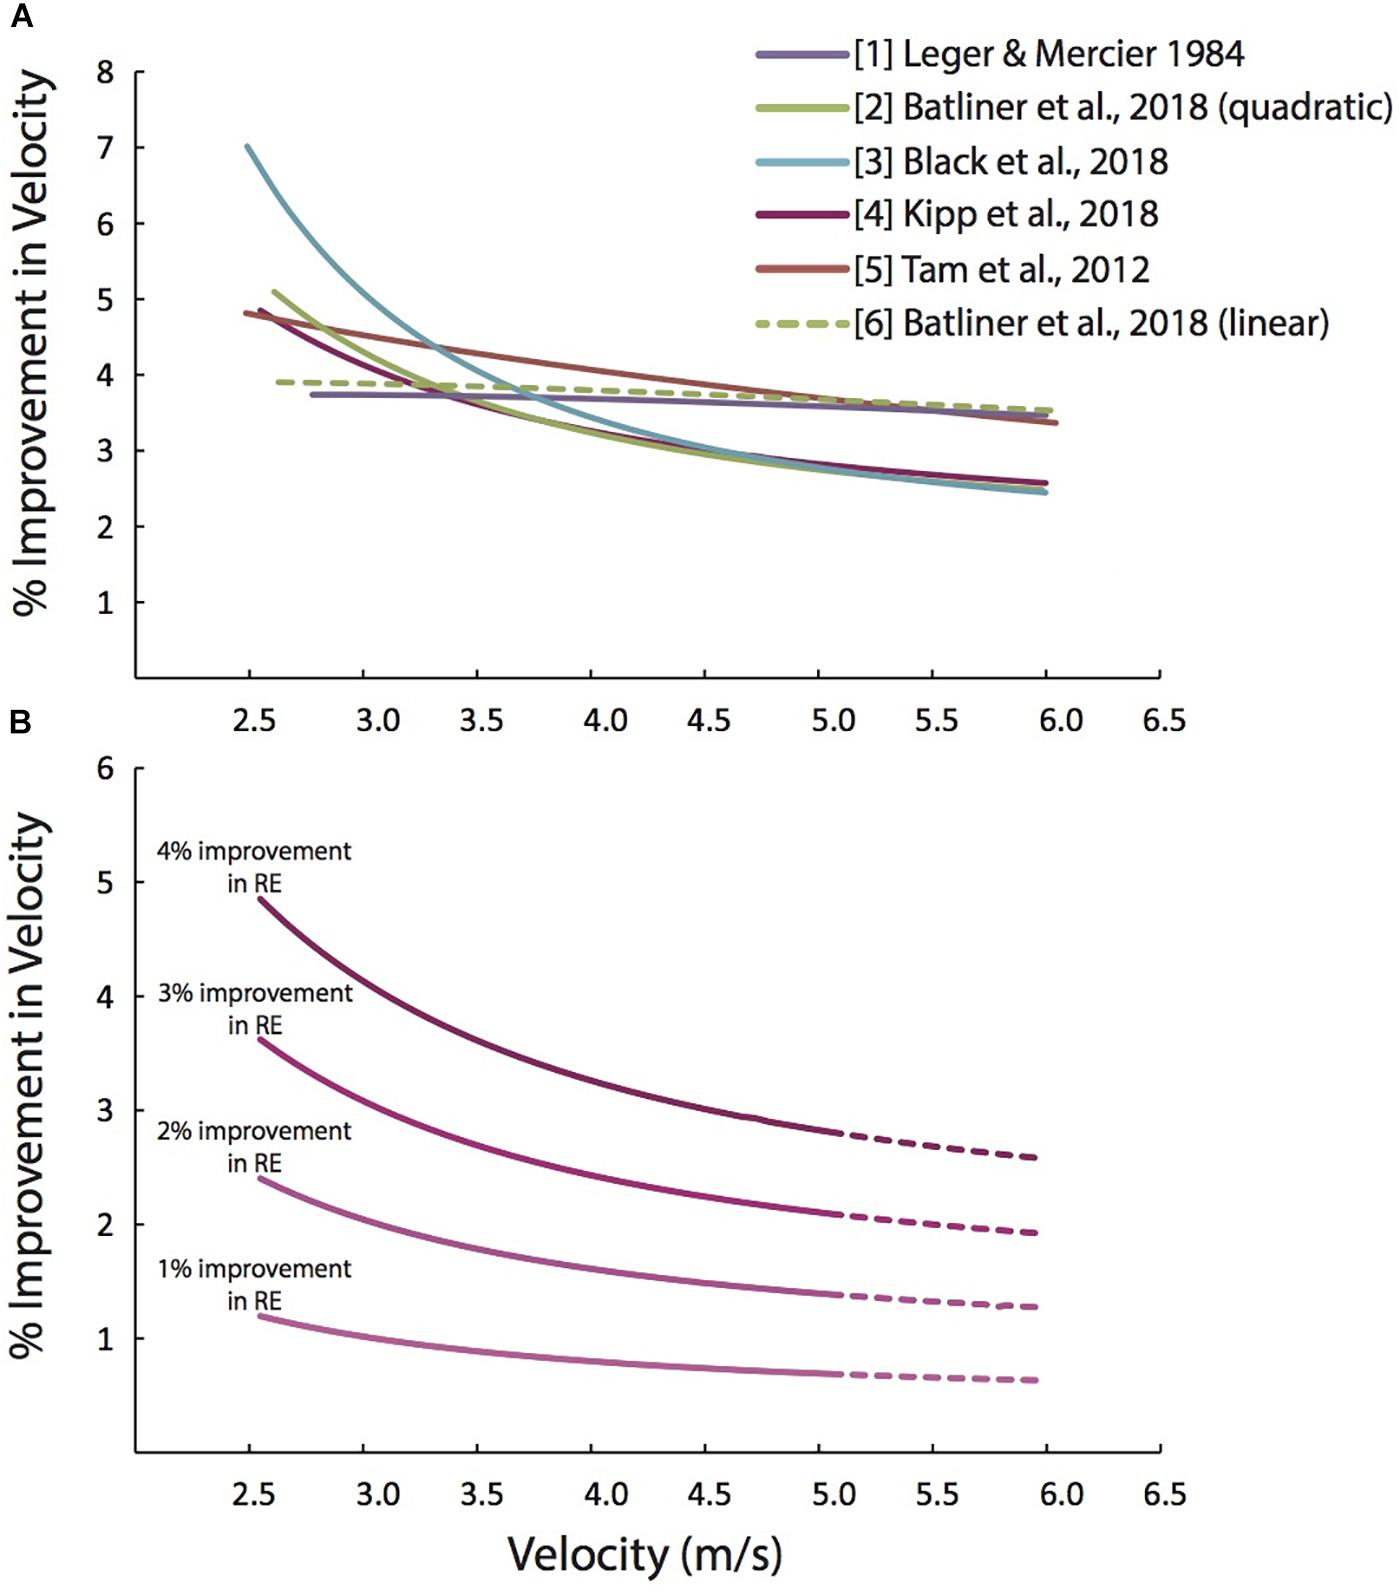
Figure 2. Predicted percent improvements in running velocity depend on the baseline running velocity. (A) Predicted percent improvements in running velocity vs. running velocity, based on a 4% improvement in RE, using several equations from the recent scientific literature. The solid green is based on a quadratic fit through Batliner et al. (2018) data with Pugh’s cubic air resistance term. The green dashed line is based on a linear fit through Batliner et al. (2018) data combined with Pugh’s cubic air resistance term. The difference between the two green lines highlights the importance of the inherent curvilinearity of the O2-velocity relation which substantially alters the magnitude of percent improvement in velocity. (B) Predicted percent improvements in running velocity vs. running velocity, based on 1 to 4% improvements in RE, using Eq. [2], which combines the quadratic equation from Batliner et al. (2018) with Pugh’s cubic air resistance term. Beyond the velocity range of Batliner et al. (2018) (>5.14 m/s) prediction lines are dashed.
We fit a quadratic equation through the O2 data of Black et al. (2018) who studied 14 male and 10 female athletes running at 10 different velocities from 2.22 to 4.72 m/s at sea level. Then, we added Pugh’s cubic air resistance term (Eq. 3).
Black et al., 2018 + Pugh’s cubic term:
Similarly, we fit a quadratic equation through Kipp et al.’s (2018) data measured at ∼1600 m altitude for 10 high-level male athletes at six running velocities ranging from 2.22 to 5.00 m/s and added Pugh’s cubic air resistance term (Eq. 4).
Kipp et al., 2018 + Pugh’s cubic term:
Uniquely, Tam et al. (2012) measured O2 in 10 elite male Kenyan athletes (<2:09-h marathon) running overground on a clay track at ∼2,000 m altitude at four running velocities ranging from 3.33 to 5.00 m/s. They constrained their regression to have a linear and a cubic term, without a square term, similar to Léger and Mercier (1984). Tam et al. (2012) expressed their metabolic data in net energy cost of transport (J/kg/km) (gross – upright resting) and then fit a line through the data plotted against the square of velocity. We repeated this analysis for the data expressed in ml O2/kg/km, converted this to rate of oxygen uptake in ml O2/kg/min and then added the reported upright resting rate of oxygen uptake, to get gross O2 values at each velocity (Eq. 5).
The equations with a square term (Eqs. 2–4) all follow a similar trend and concur closely for running velocities faster than 4 m/s (Figure 2A). While the cubic term in Eq. 1 is identical to that in Eqs. 2–4, Eq. 1 predicts fairly consistent velocity improvements over the presented velocity range (2.5–6.0 m/s), as opposed to the increasingly smaller percent velocity improvements predicted with Eqs. 2–4. This indicates that the square term (which represents the inherent curvilinearity of the O2-velocity relation) substantially alters the relation between baseline running velocity and the possible improvements in running velocity. This is also demonstrated by the dashed line, which is based on a linear fit through Batliner et al.’s (2018) data with Pugh’s cubic air resistance term added.
Linear fit of Batliner et al., 2018 + Pugh’s cubic term:
Interestingly, this line closely resembles the running velocity improvements predicted using Leger and Mercier’s (1984) and Tam et al.’s (2012) equations, which do not have a square term. In short, ignoring the inherent curvilinearity of the O2-velocity relation results in over-prediction of the percent improvements in velocity at the faster velocities.
It is important to realize that Eqs. 1–4 are used to predict changes in performance at sea level. If one wants to apply these equations to predict changes in performance at other altitudes, Pugh’s cubic air resistance term should be adjusted for the difference in air density. While second order polynomials are fit through treadmill O2 data collected at altitude (∼1600 m for Batliner et al., 2018 and Kipp et al., 2018), we believe that the effect of air density on the relation between O2 and treadmill running speed is small, since externally it would only affect the cost of moving the extremities through the air relative to the torso.
Eqs. 2–4 take into account the inherent curvilinearity of the O2-velocity relation, but their coefficients differ slightly. This is likely due to differences in the subject populations tested and the experimental setups. One of the major determinants of the equation coefficients is the velocity range over which the data were collected. Narrower velocity ranges result in less pronounced curvilinearity of the O2-velocity relation. A narrower velocity range is what has led many previous studies to describe the O2-velocity relation as linear (Menier and Pugh, 1968; Daniels and Daniels, 1992; Helgerud et al., 2010). Here, we have utilized the Batliner et al., 2018 equation (Eq. 2) because it is derived from the widest running velocity range. Interestingly, even though it was collected over the widest range of velocity, it has the most conservative inherent curvilinearity term (as seen in the square term of the equation).
Implications for Running Performance
Figure 2B depicts the relation between the baseline running velocity and the percent increases in running velocity possible for different percent improvements in RE, based on Eq. 2. With an improvement in RE of 1% (due to training, footwear, nutrition, tailwind, etc.) a recreational athlete who could typically run at 2.60 m/s (4:30:00 marathon) would be predicted to run their race 1.17% faster, finishing in ∼4:26:53, a 3 min and 7 s improvement. Alternatively, with the same 1% improvement in RE, an elite marathoner running at 5.72 m/s (2:03:00 marathon), would be able to run only 0.65% faster, finishing in 2:02:13, only a 47 s improvement. A similar trend is apparent for all improvements in RE (Figure 2B). Generally, for velocities slower than ∼3 m/s, the percent improvement in velocity are expected to be slightly greater than the percent improvement in RE. For velocities faster than ∼3 m/s, percent improvements in velocity are expected to be less than the percent improvements in RE. At velocities faster than ∼5.5 m/s (∼2:08 marathon pace), percent improvements in velocity are expected to be less than 2/3rds of the percent improvements in RE.
We used this same approach to go back to our 2016 study (Hoogkamer et al., 2016), where we demonstrated that lab-measured changes in RE translate to similar changes in distance running performance, assessed by 3 km time trials. The metabolic data indicated that adding 100 g mass to each shoe worsened RE on average by 1.11%, while it slowed 3 km time trial performance by 0.78%. The discrepancy in those percent changes can now be explained by the inherent curvilinearity of the O2-velocity relation and the additional curvilinear cost of overcoming air resistance. Eq. 2 predicts that a 1.11% worsening in RE at a running velocity of 4.79 m/s (i.e., the average running velocity during the 3 km time trials) would result in a 0.78% slower time, exactly matching the experimentally observed average slowing of the time trial performances.
Calculating predicted improvements in running velocity based on baseline running velocity and percent improvements in RE based on Eq. 2, requires the non-trivial solving of a third-order polynomial for running velocity (v). To allow readers to calculate their own comparisons/predictions, we provide a spreadsheet that solves the cubic equation (see Supplementary Material). The spreadsheet predicts marathon, half-marathon, and 10 km performances based on only four inputs: height, weight, percent improvement in RE and baseline performance. When using this calculator, it is important to realize that it provides a general prediction that does not take into account individual variability in the O2-velocity relation. Furthermore, percent improvements in RE due to footwear innovations (Hoogkamer et al., 2018a) or long-term training interventions (Saunders et al., 2004; Barnes and Kilding, 2015) also differ between individuals. Finally, Pugh’s cubic air resistance term is dependent on a runner’s projected frontal area, which can be estimated based on the runner’s height and body mass. In this paper, we have assumed those to be 1.71 m and 58 kg, respectively. In the Supplementary Spreadsheet, these numbers can be adjusted at will.
At the previous world record marathon pace of 5.72 m/s, a 4% improvement in RE translates to a 2.64% faster running velocity, allowing a marathon time of 1:59:47. Yet, with the introduction of a 4% more economical running shoe, the marathon world record has only been broken by 1.03%. It is important to note that Dennis Kimetto, the previous holder of the world record has not competed in the newly developed shoe. The fastest marathon by Eliud Kipchoge (current marathon world record holder) prior to adopting the shoes with an average of 4% RE enhancement was 2:04:00 at Berlin in 2015. According to our calculations, starting with a 2:04 baseline, a 3% improvement in RE translates to a 1.97% faster velocity or 2:01:36, almost exactly equal to the recently set world record. It is unknown how much of a RE enhancement Kipchoge experiences in the new shoes.
Possible Confounding Factors
The major assumption in our approach to predict improvements in running performance based on improvements in RE is that all other performance related factors remain the same. This might not always be the case. For example, when RE is improved through drafting behind other competitors or pacemakers, the reduced air flow over the skin might negatively affect the runner’s thermoregulation (less heat convection/evaporation), which could impair running performance and, at least partly, counter the gains in RE (Hoogkamer et al., 2018b). Although small body size provides thermoregulatory advantages (via a greater surface area to volume ratio) (Joyner et al., 2011), the aerodynamic drag force per kg body mass is greater for smaller individuals.
Similarly, when RE is improved by running an overall downhill course, it can be expected that the repeated eccentric loading will result in additional muscle damage (Hikida et al., 1983), which will negatively affect running performance. Muscle damage is likely to occur in elite marathon runners due to the distance and fast speeds, but it is not well understood how RE changes with muscle damage or fatigue. Indeed, there are several reports of worsening RE during the marathon and ultra-marathon distance (Petersen et al., 2007; Vernillo et al., 2017), which might be related to muscle damage, fatigue (Millet et al., 2011) or substrate utilization shifts (Vernillo et al., 2017). However, as long as those RE changes during the marathon are consistent and do not change the curvilinearity of the O2-velocity relation, deterioration in RE during a race should not affect our predictions. Theoretically, running faster per se, independent of the source of the improvement in RE, might result in more muscle damage during a race, which would impair running performance. However, more cushioned running shoes can be expected to reduce muscle damage. It may also be that the extensive training of elite marathoners mitigates the muscle damage common in slower marathoners. Further, some data suggest that RE differences between shoes might be affected by fatigue (Vercruyssen et al., 2016).
A potential limitation of our approach is that we do not have direct measurements of the relation between running velocity and metabolic energy cost (i.e., W/kg or kcal/min) at elite marathon pace. If this relation is steeper beyond the tested velocity range, percent improvements in performance will be even smaller. Distance runners in shorter races (e.g., half-marathons and 10 km) compete at velocities above their lactate threshold, where it is not possible to measure RE due to contributions from non-oxidative sources. It is not completely understood how the total metabolic demands (oxidative and non-oxidative) change at these high intensities.
Unlike elite runners, slower runners should have a greater percent improvement from technological advancements in footwear. As shown in Figure 1C, at slower speeds, there is a greater improvement in velocity for a given improvement in RE. Thus, it is likely that improvements in RE from footwear will produce a wave of recreational runners setting personal records (Quealy and Katz, 2018).
Future Perspectives
Our analysis here focused solely on the oxygen cost of running. Expressing RE in units of rates of energy utilization (W/kg or kcals/min/kg) accounts for differences in substrate utilization and, therefore, in the amount of energy liberated per liter oxygen. To be most relevant to elite marathoners, future investigations should quantify how the energy cost of running changes during overground running at world-class marathon velocities on pavement surfaces at sea level.
Author Contributions
SK and WH were responsible for conception of the review. SK drafted the manuscript. RK and WH revised it. RK conceived of the calculator in the Supplementary Material while SK and WH developed it. SK, RK, and WH approved the final version of the manuscript. All authors agreed to be accountable for all aspects of the work.
Conflict of Interest Statement
RK is a paid consultant to Nike, Inc. The remaining authors declare that the research was conducted in the absence of any commercial or financial relationships that could be construed as a potential conflict of interest.
Acknowledgments
We thank Erik K. Johnson for pointing out the existence of analytical solutions for third order polynomials and Dr. Matthew I. Black for providing us with the data from his article.
Supplementary Material
The Supplementary Material for this article can be found online at: https://www.frontiersin.org/articles/10.3389/fphys.2019.00079/full#supplementary-material
Footnotes
- ^ We and others prefer to express RE in units of energy utilization (W/kg or kcals/min/kg) (Fletcher et al., 2009; Shaw et al., 2014; Beck et al., 2018; Kipp et al., 2018) to account for differences in substrate utilization and therefore, in the amount of energy liberated per liter of oxygen uptake. Here, we needed to incorporate several classic studies that only reported oxygen uptake rates and thus we express RE in units of oxygen uptake rate.
References
Barnes, K. R., and Kilding, A. E. (2015). Strategies to improve running economy. Sports Med. 45, 37–56. doi: 10.1007/s40279-014-0246-y
Batliner, M. E., Kipp, S., Grabowski, A. M., Kram, R., and Byrnes, W. C. (2018). Does metabolic rate increase linearly with running speed in all distance runners? Sports Med. Int. Open 2, E1–E8. doi: 10.1055/s-0043-122068
Beck, O. N., Kipp, S., Byrnes, W. C., and Kram, R. (2018). Use aerobic energy expenditure instead of oxygen uptake to quantify exercise intensity and predict endurance performance. J. Appl. Physiol. 125, 672–674. doi: 10.1152/japplphysiol.00940.2017
Black, M. I., Handsaker, J. C., Allen, S. J., Forrester, S. E., and Folland, J. P. (2018). Is there an optimal speed for economical running? Int. J. Sports Physiol. Perform. 13, 75–81. doi: 10.1123/ijspp.2017-0015
Bransford, D. R., and Howley, E. T. (1977). Oxygen cost of running in trained and untrained men and women. Med. Sci. Sports. 9, 41–44. doi: 10.1249/00005768-197721000-00007
Conley, D. L., and Krahenbuhl, G. S. (1980). Running economy and distance running performance of highly trained athletes. Med. Sci. Sports Exerc. 12, 357–360. doi: 10.1249/00005768-198025000-00010
Daniels, J., and Daniels, N. (1992). Running economy of elite male and elite female runners. Med. Sci. Sports Exerc. 24, 483–489. doi: 10.1249/00005768-199204000-00015
Daniels, J. T. (1985). A physiologist’s view of running economy. Med. Sci. Sports Exerc. 17, 332–338. doi: 10.1249/00005768-198506000-00006
di Prampero, P. E., Atchou, G., Brückner, J. C., and Moia, C. (1986). The energetics of endurance running. Eur. J. Appl. Physiol. Occup. Physiol. 55, 259–266. doi: 10.1007/BF02343797
du Bois-Reymond, R. (1925). Der Luftwiderstand des menschlichen Korpers. Pflügers Arch. Ges. Physiol. 208, 445–453. doi: 10.1007/BF01722252
DuBois, D., and DuBois, E. F. (1916). Clinical calorimetry, tenth paper. A formula to estimate the approximate surface area if height and weight be known. Arch. Intern. Med. XVII, 863–871. doi: 10.1001/archinte.1916.00080130010002
Fletcher, J. R., Esau, S. P., and MacIntosh, B. R. (2009). Economy of running: beyond the measurement of oxygen uptake. J. Appl. Physiol. 107, 1918–1922. doi: 10.1152/japplphysiol.00307.2009
Foster, C., and Lucia, A. (2007). Running economy: the forgotten factor in elite performance. Sports Med. 37, 316–319. doi: 10.2165/00007256-200737040-00011
Helgerud, J., Støren,Ø., and Hoff, J. (2010). Are there differences in running economy at different velocities for well-trained distance runners?. Eur. J. Appl. Physiol. 108, 1099–1105. doi: 10.1007/s00421-009-1218-z
Hikida, R. S., Staron, R. S., Hagerman, F. C., Sherman, W. M., and Costill, D. L. (1983). Muscle fiber necrosis associated with human marathon runners. J. Neurol. Sci. 59, 185–203. doi: 10.1016/0022-510X(83)90037-0
Hill, A. V., (1928). The air-resistance to a runner. Proc. R. Soc. Lond. B 102, 380–385. doi: 10.1098/rspb.1928.0012
Hoogkamer, W., Kipp, S., Frank, J. H., Farina, E. M., Luo, G., and Kram, R. (2018a). A comparison of the energetic cost of running in marathon racing shoes. Sports Med. 48, 1009–1019. doi: 10.1007/s40279-017-0811-2
Hoogkamer, W., Kipp, S., and Kram, R. (2019). The biomechanics of competitive male runners in three marathon racing shoes: a randomized crossover study. Sports Med. doi: 10.1007/s40279-018-1024-z [Epub ahead of print].
Hoogkamer, W., Snyder, K. L., and Arellano, C. J. (2018b). Modeling the benefits of cooperative drafting: is there an optimal strategy to facilitate a sub-2-hour marathon performance? Sports Med. 48, 2859–2867. doi: 10.1007/s40279-018-0991-4
Hoogkamer, W., Kipp, S., Spiering, B. A., and Kram, R. (2016). Altered running economy directly translates to altered distance-running performance. Med. Sci. Sports Exerc. 48, 2175–2180. doi: 10.1249/MSS.0000000000001012
Hoogkamer, W., Kram, R., and Arellano, C. J. (2017). How biomechanical improvements in running economy could break the 2-hour marathon barrier. Sports Med. 47, 1739–1750. doi: 10.1007/s40279-017-0708-0
Jones, A. M., and Doust, J. H. (1996). A 1% treadmill grade most accurately reflects the energetic cost of outdoor running. J. Sports Sci. 14, 321–327. doi: 10.1080/02640419608727717
Joyner, M. J. (1991). Modeling: optimal marathon performance on the basis of physiological factors. J. Appl. Physiol. 70, 683–687. doi: 10.1152/jappl.1991.70.2.683
Joyner, M. J., Ruiz, J. R., and Lucia, A. (2011). The two-hour marathon: who and when? J. Appl. Physiol. 110, 275–277. doi: 10.1152/japplphysiol.00563.2010
Kipp, S., Grabowski, A. M., and Kram, R. (2018). What determines the metabolic cost of human running across a wide range of velocities?. J. Exp. Biol. 221:jeb.184218. doi: 10.1242/jeb.184218
Lacour, J. R., and Bourdin, M. (2015). Factors affecting the energy cost of level running at submaximal speed. Eur. J. Appl. Physiol. 115, 651–673. doi: 10.1007/s00421-015-3115-y
Léger, L., and Mercier, D. (1984). Gross energy cost of horizontal treadmill and track running. Sports Med. 1, 270–277. doi: 10.2165/00007256-198401040-00003
Margaria, R., Cerretelli, P., Aghemo, P., and Sassi, G. (1963). Energy cost of running. J. Appl. Physiol. 18, 367–370. doi: 10.1152/jappl.1963.18.2.367
Maughan, R. J., and Leiper, J. B. (1983). Aerobic capacity and fractional utilisation of aerobic capacity in elite and non-elite male and female marathon runners. Eur. J. Appl. Physiol. Occup. Physiol. 52, 80–87. doi: 10.1007/BF00429030
McLaughlin, J. E., Howley, E. T., Bassett, J. D., Thompson, D. L., and Fitzhugh, E. C. (2010). Test of the classic model for predicting endurance running performance. Med. Sci. Sports Exerc. 42, 991–997. doi: 10.1249/MSS.0b013e3181c0669d
Menier, D. R., and Pugh, L. G. C. E. (1968). The relation of oxygen intake and velocity of walking and running, in competition walkers. J. Physiol. 197, 717–721. doi: 10.1113/jphysiol.1968.sp008584
Millet, G. Y., Tomazin, K., Verges, S., Vincent, C., Bonnefoy, R., Boisson, R. C., et al. (2011). Neuromuscular consequences of an extreme mountain ultra-marathon. PLoS One 6:e17059. doi: 10.1371/journal.pone.0017059
Minetti, A. E., Moia, C., Roi, G. S., Susta, D., and Ferretti, G. (2002). Energy cost of walking and running at extreme uphill and downhill slopes. J. Appl. Physiol. 93, 1039–1046. doi: 10.1152/japplphysiol.01177.2001
Petersen, K., Hansen, C. B., Aagaard, P., and Madsen, K. (2007). Muscle mechanical characteristics in fatigue and recovery from a marathon race in highly trained runners. Eur. J. Appl. Physiol. 101, 385–396. doi: 10.1007/s00421-007-0504-x
Pugh, L. G. (1970). Oxygen intake in track and treadmill running with observations on the effect of air resistance. J. Physiol. 207, 823–835. doi: 10.1113/jphysiol.1970.sp009097
Pugh, L. G. (1971). The influence of wind resistance in running and walking and the mechanical efficiency of work against horizontal or vertical forces. J. Physiol. 213, 255–276. doi: 10.1113/jphysiol.1971.sp009381
Quealy, K., and Katz, J. (2018). Nike Says Its $250 Running Shoes Will Make You Run Much Faster. The New York Times. Available at: https://www.nytimes.com/interactive/2018/07/18/upshot/nike-vaporfly-shoe-strava.html
Saibene, F., and Minetti, A. E. (2003). Biomechanical and physiological aspects of legged locomotion in humans. Eur. J. Appl. Physiol. 88, 297–316. doi: 10.1007/s00421-002-0654-9
Saunders, P. U., Pyne, D. B., Telford, R. D., and Hawley, J. A. (2004). Factors affecting running economy in trained distance runners. Sports Med. 34, 465–485. doi: 10.2165/00007256-200434070-00005
Shaw, A. J., Ingham, S. A., and Folland, J. P. (2014). The valid measurement of running economy in runners. Med. Sci. Sports Exerc. 46, 1968–1973. doi: 10.1249/MSS.0000000000000311
Steudel-Numbers, K. L., and Wall-Scheffler, C. M. (2009). Optimal running speed and the evolution of hominin hunting strategies. J. Hum. Evol. 56, 355–360. doi: 10.1016/j.jhevol.2008.11.002
Tam, E., Rossi, H., Moia, C., Berardelli, C., Rosa, G., Capelli, C., et al. (2012). Energetics of running in top-level marathon runners from Kenya. Eur. J. Appl. Physiol. 112, 3797–3806. doi: 10.1007/s00421-012-2357-1
Vercruyssen, F., Tartaruga, M., Horvais, N., and Brisswalter, J. (2016). Effects of footwear and fatigue on running economy and biomechanics in trail runners. Med. Sci. Sports Exerc. 48, 1976–1984. doi: 10.1249/MSS.0000000000000981
Keywords: energetic cost, locomotion, marathon, oxygen uptake, running economy
Citation: Kipp S, Kram R and Hoogkamer W (2019) Extrapolating Metabolic Savings in Running: Implications for Performance Predictions. Front. Physiol. 10:79. doi: 10.3389/fphys.2019.00079
Received: 24 October 2018; Accepted: 22 January 2019;
Published: 11 February 2019.
Edited by:
Davide Malatesta, Université de Lausanne, SwitzerlandReviewed by:
Leonardo Alexandre Peyré-Tartaruga, Universidade Federal do Rio Grande do Sul (UFRGS), BrazilFabrice Vercruyssen, Université de Toulon, France
Andrew Mark Jones, University of Exeter, United Kingdom
Copyright © 2019 Kipp, Kram and Hoogkamer. This is an open-access article distributed under the terms of the Creative Commons Attribution License (CC BY). The use, distribution or reproduction in other forums is permitted, provided the original author(s) and the copyright owner(s) are credited and that the original publication in this journal is cited, in accordance with accepted academic practice. No use, distribution or reproduction is permitted which does not comply with these terms.
*Correspondence: Rodger Kram, cm9kZ2VyLmtyYW1AY29sb3JhZG8uZWR1