 Dan Lazari
 Joames Kauffimann Freitas Leal
 Roland Brock
 Giel Bosman
- Department of Biochemistry, Radboud Institute for Molecular Life Sciences, Radboud University Medical Center, Nijmegen, Netherlands
The molecular organization of the membrane of the red blood cell controls cell morphology and function and is thereby a main determinant of red blood cell homeostasis in the circulation. The role of membrane organization is prominently reflected in red blood cell deformation and aggregation. However, there is little knowledge on whether they are controlled by the same membrane property and if so, to what extent. To address the potential interdependence of these two parameters, we measured deformation and aggregation in a variety of physiological as well as pathological conditions. As a first step, we correlated a number of deformability and aggregation parameters in red blood cells from healthy donors, which we obtained in the course of our studies on red blood cell homeostasis in health and disease. This analysis yielded some statistically significant correlations. Also, we found that most of these correlations were absent in misshapen red blood cells that have an inborn defect in the interaction between the membrane and the cytoskeleton. The observations suggest that deformability and aggregation share at least one common, membrane-related molecular mechanism. Together with data obtained after treatment with various agents known to affect membrane organization in vitro, our findings suggest that a phosphorylation-controlled interaction between the cytoskeleton and the integral membrane protein band 3 is part of the membrane-centered mechanism that plays a role in deformability as well as aggregation.
RBC Aging and Disease
Tissue oxygenation depends on hemoglobin as much as on red blood cell (RBC) characteristics such as metabolism, communication with the immune system, deformability and aggregation behavior. Many if not all of these processes depend on the organization of the RBC membrane that enables the complex, dynamic interactions between the cell membrane and various intracellular and extracellular molecules. Studies of inborn errors of metabolism and membrane protein composition, in combination with the structural and functional changes that occur during RBC aging, have led to a membrane-centered molecular understanding of red blood cell function and survival, and of the role of membrane molecules in cell morphology and membrane organization. Modification of the integral membrane protein band 3 plays a central role in the weakening of the cytoskeleton/membrane interaction at the ankyrin complex, which underlies the generation of microvesicles (Bosman et al., 2010, 2012; Lutz and Bogdanova, 2013). Vesiculation results in the loss of approximately 20% of the hemoglobin, a decrease of 30% in MCV and a concomitant increase in 15% in MCHC (Willekens et al., 1997). The associated changes in cell density and volume enable a clear separation of RBCs according to cell age (Bosch et al., 1994; Willekens et al., 1997, 2008). The accumulation of band 3-derived neoantigens and phosphatidylserine on microvesicles induces their fast disappearance from the circulation, prevents inflammation and thrombosis. Overall, shedding of defective components through vesiculation prevents untimely removal of otherwise functional RBCs (Willekens et al., 2008; Bosman et al., 2012; Alaarg et al., 2013; Freitas Leal et al., 2017, 2018). Nevertheless, old and pathological RBCs are more prone to display removal signals or break down when exposed to osmotic or mechanical stress (Bosman et al., 2011; Ghashghaeinia et al., 2012).
Deformability
In the course of our investigations on the functional consequences of aging-associated or pathology-related changes in membrane organization, we noticed multiple changes in deformability and aggregation (Cluitmans et al., 2012, 2014, 2015, 2016; Freitas Leal et al., 2019). Deformability is a critical determinant of RBC function, because of the extensive change in cell shape required for efficient passage through the capillaries and the spleen. Indeed, physiological aging of RBCs in vivo is associated with a pronounced decrease in their deformability (Bosch et al., 1994). Also, many RBC-centered pathologies such as deficiencies in metabolic enzymes, altered hemoglobins, and mutations in membrane proteins affect the same processes that play a critical role in physiological aging, and are associated with decreased deformability, as well (Alaarg et al., 2013; Mohandas, 2017). This may be due directly to weakening of the interactions between membrane and/or cytoskeleton proteins, or to the resulting loss of membrane by vesiculation (Huisjes et al., 2018). A decrease in the capacity to deform will lead to a decrease in tissue perfusion and oxygenation, and thereby contribute to the pathophysiology.
Aggregation
The same RBC characteristics that determine RBC deformability also play a role in their interaction with plasma proteins, other RBCs, leukocytes and platelets, and the vascular lining (Ben-Ami et al., 2003). At low shear stress or upon removal of external forces, RBCs form rouleaux (stacks of RBCs) and three-dimensional aggregates. Aggregate formation affects tissue perfusion and has an impact on hemostasis, probably by affecting the flow behavior of platelets and leukocytes and their interaction with the vascular endothelium (Baskurt and Meiselman, 2013a; Stroobach et al., 2019). Aggregation is likely to be determined for a major part by low-affinity interactions of RBCs with plasma proteins such as fibrinogen and immunoglobulins (Rampling et al., 2004; Weisel and Litvinov, 2019). In addition, changes in aggregation are often accompanied by changes in deformability, and sometimes by changes in cell shape as well (Xue et al., 2013; Li et al., 2014).
Deformability and Aggregation
Approximately one fifth of the recent papers on RBC deformability also present data on aggregation and vice versa, mostly in pathological conditions, but there are few, if any, that try and determine the common factors or mechanisms underlying the observed changes (Xue et al., 2013). In the course of our studies on RBC homeostasis in health and disease, we have accumulated deformability and/or aggregation data of RBCs with various biological backgrounds, such as RBCs of different ages isolated from the circulation of healthy donors (Willekens et al., 2008; Freitas Leal et al., 2019), RBCs of different storage periods in the blood bank (Cluitmans et al., 2012), acanthocytes and otherwise misshapen RBCs from patients with neuroacanthocytosis (De Franceschi et al., 2011; Cluitmans et al., 2015), and RBCs treated with various membrane organization-affecting agents (Dinkla et al., 2012; Cluitmans et al., 2016). In order to shed more light on the mechanisms that underly aging-associated and pathology-related decreases in RBC function, we used the data obtained in these studies to perform a quantitative correlation analysis of the commonly used deformability and aggregation parameters.
It has been shown before that there is a strong linear association between the extent as expressed by the aggregation index (AI) and t1/2, the speed by which aggregates form (Baskurt et al., 2009). Analysis of all accumulated data mentioned above confirms this finding, with a Pearson correlation coefficient between AI and t1/2 of – 0.87 (Table 1) meaning that if large aggregates are formed, they form faster. There is also a positive correlation between the relaxation time Tr, i.e., the time needed by the RBCs to regain their normal shape from being elongated in the direction of the flow after undergoing a shear rate of 500 s–1, and the AI (r = 0.43), and between the Tr and the t1/2 (r = −0.31), indicating that stiffness of RBCs promotes aggregate formation and enhances the speed by which aggregates form. Furthermore, our data show a strong negative correlation (r = −0.71) between the calculated maximal deformability EImax and SS1/2, the shear stress at which half the EImax is reached (Table 1), demonstrating that elongation is a function of less resistance to deformation. A similar relationship between these deformability parameters has been described for RBCs that had been treated with various concentrations of glutaraldehyde in vitro (Baskurt and Meiselman, 2013b; Xue et al., 2013).
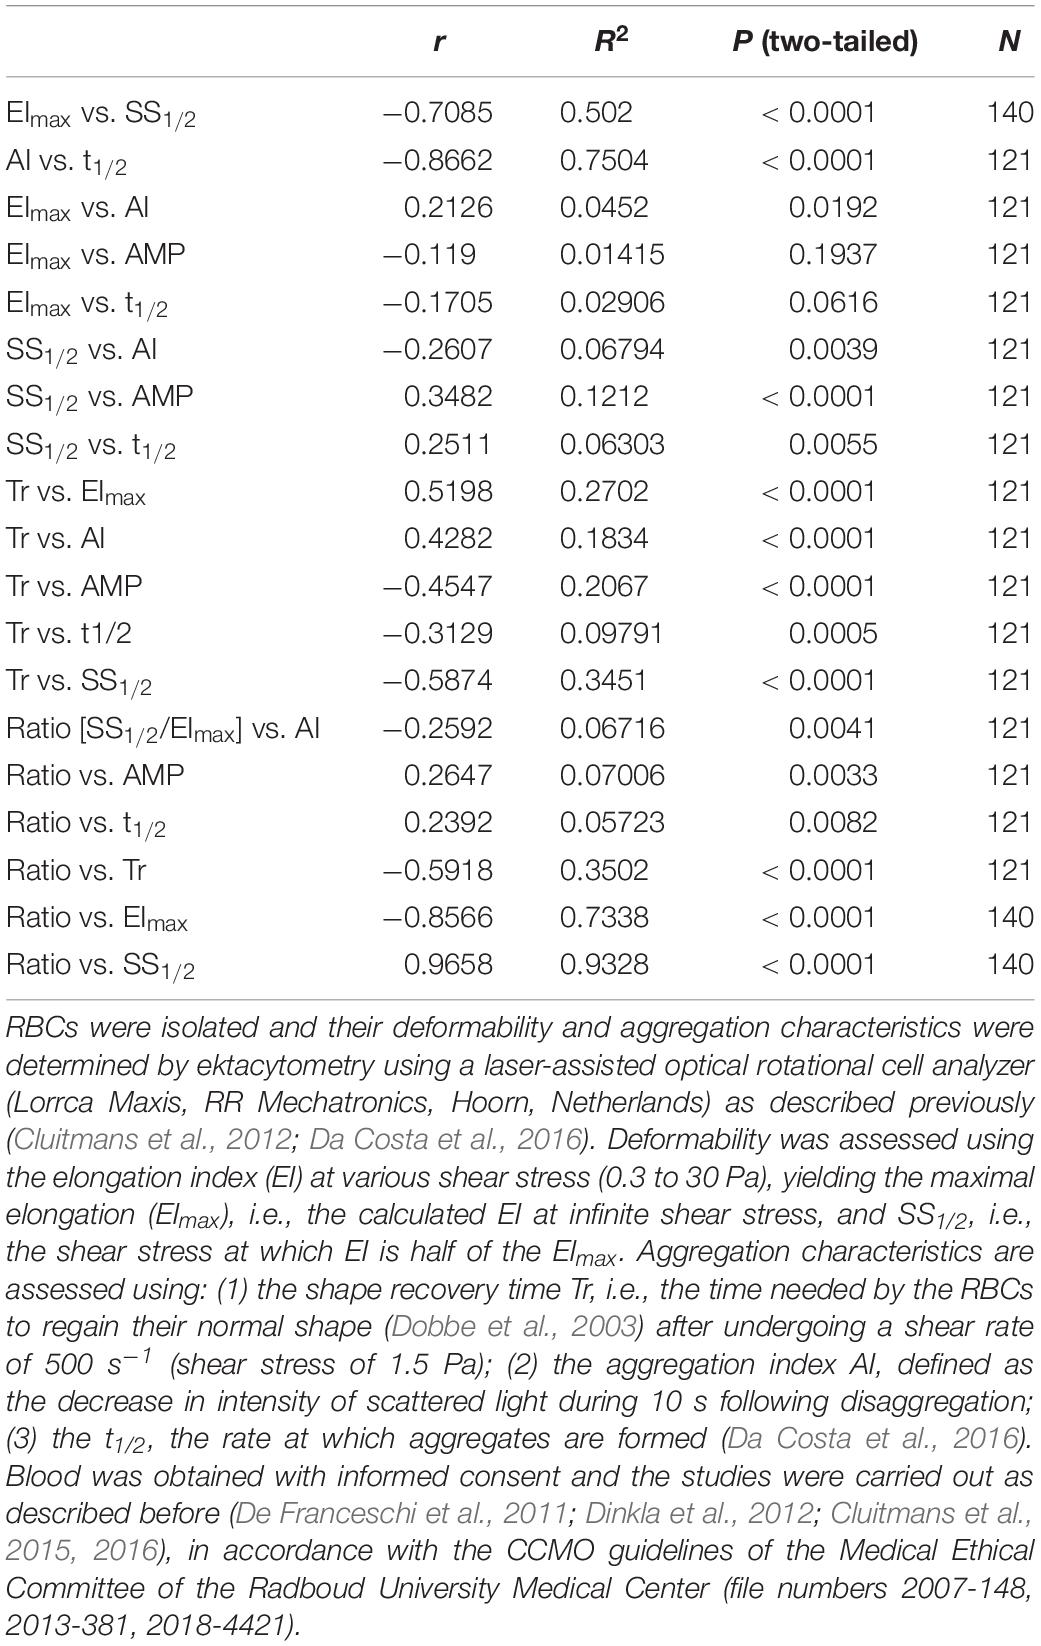
Table 1. Determination of the correlation between deformability and aggregation.
Aggregability is affected by cellular factors such as cell morphology and surface properties, and by the environment. This is illustrated by the effect of RBC age on aggregation characteristics, the variability in RBC aggregability between donors and between species, and by the findings on the correlation between plasma viscosity and aggregation (Rampling et al., 2004; Simmonds et al., 2013). However, the underlying mechanisms are far from clear. Since cell shape and membrane composition are closely related to deformability as well, we analyzed the association between the main deformability and aggregation parameters. The strongest correlation between aggregation and deformability parameters was found between the shape recovery relaxation parameter Tr and the deformability characteristics SS1/2 (r = −0.59) and EImax (r = 0.52), meaning that a rapid recovery from relaxation correlates with a low shear stress required for half maximal elongation and with a strong maximal elongation. Indeed, although Tr is one of the outcome of the aggregation measurement protocol of the Lorrca (RR Mechatronics, Hoorn, Netherlands), Tr is actually a deformability parameter. These findings strengthen the relationship between RBC relaxation and deformation capacity, as observed for RBCs in a microcapillary network-mimicking microfluidics device (Cluitmans et al., 2014). Smaller, but equally statistically significant correlation coefficients were found between AI and SS1/2 (r = −0.26) and between SS1/2 and t1/2 (r = 0.25; Table 1). This relationship between deformation at a shear stress of 2–3 Pa, which is in the same range as the shear stress that RBCs undergo in microcapillaries (Koutsiaris et al., 2007), and the aggregability is strengthened by the statistically significant correlation (r = 0.35) between SS1/2 and the extent of aggregation AMP (Table 1).
It has been argued that the deformability parameters SS1/2 and EImax as such may not always yield satisfactory, relevant information on deformability properties, especially in the case of large changes in EImax. The SS1/2/EImax ratio is much less affected by such changes, and may be more suitable when comparing RBCs from various populations or with different clinical backgrounds (Baskurt and Meiselman, 2013b). Applying this ratio, we found statistically significant correlations between deformability and the aggregation parameters AI, AMP, t1/2 and Tr, that were higher than using SS1/2 and EImax separately (Table 1).
Taken together, our quantitative analyses show that there are a several statistically significant correlations between deformability and aggregation parameters. However, the biological relevance of these correlations remains to be established. Based on the R2 values, there is only a weak relationship between the deformability and aggregation parameters SS1/2 and AMP, i.e., maximally 25 percent of the variance in the shear stress at which half of the maximal deformability is reached, is explained by the variance in the extent of aggregation, and vice versa (Table 1). The relationship between Tr, measured as part of the aggregation analysis, and the deformability parameter SS1/2 is considerably stronger (Table 1), supporting the interpretation of the relaxation time Tr as a deformability characteristic.
It has been speculated that phosphorylation of band 3 is the main molecular determinant controlling deformability and aggregation (Bazanovas et al., 2015). Band 3 plays a key role in many aspects of the RBC aging process, which is associated with alterations in deformability and aggregation (Bosman et al., 2010). Further support for this hypothesis comes from the observation that the formation of acanthocytes and otherwise misshapen RBCs in patients with neuroacanthocytosis is strongly associated with alterations in the Lyn kinase-controlled phosphorylation of membrane proteins including band 3 (De Franceschi et al., 2011, 2014). Thus, to obtain further information on the role of band 3 (phosphorylation) on functional characteristics, we examined the relationship between cell morphology, deformability and aggregability in RBCs from patients with various forms of neuroacanthocytosis (De Franceschi et al., 2011; Cluitmans et al., 2015; Figure 1).
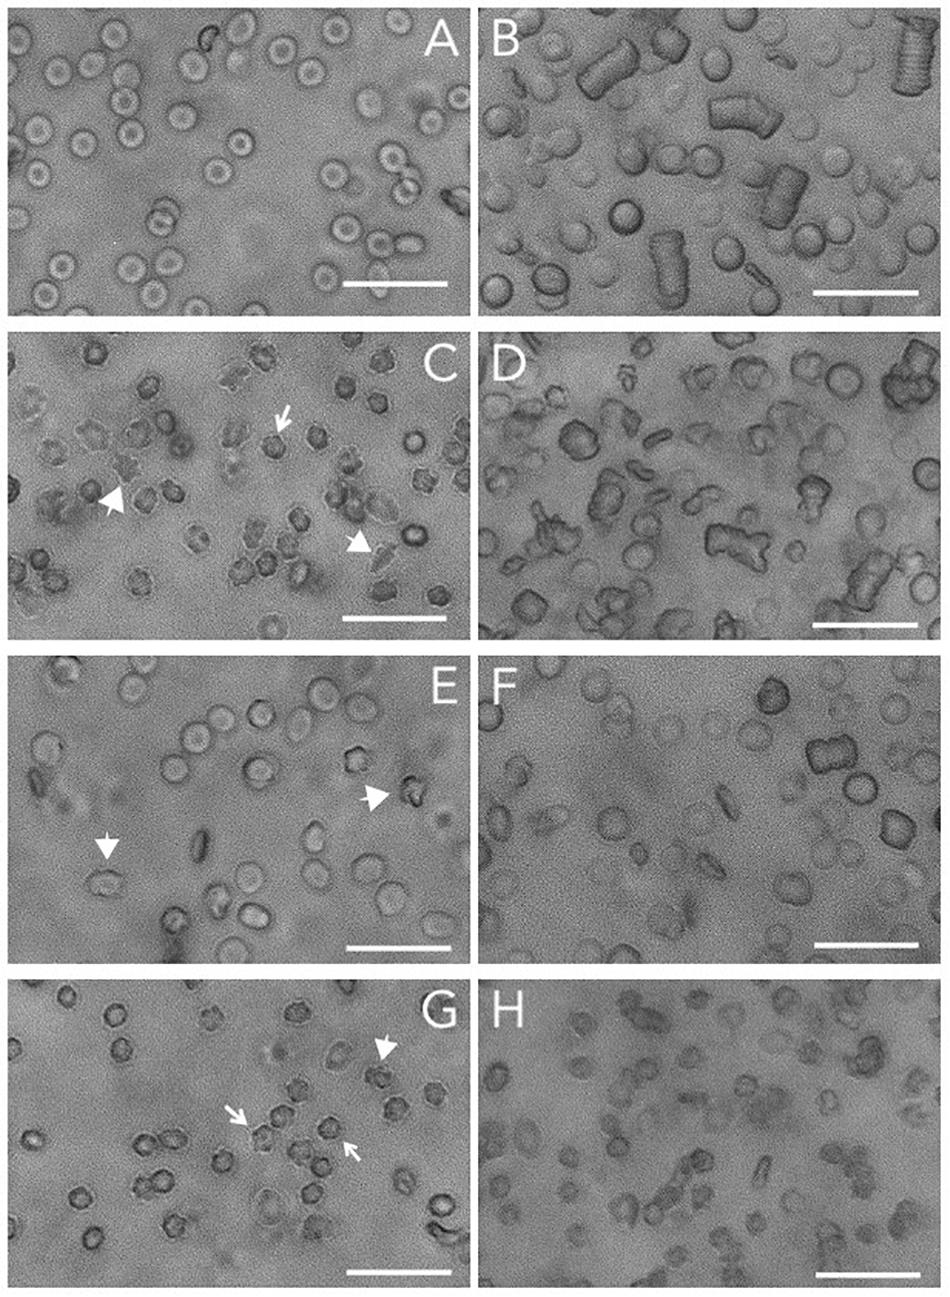
Figure 1. Brightfield microscopy of RBCs and RBC aggregates. Microscopic analyses of RBCs and aggregates were performed by a ZOE Fluorescent Cell Imager (Bio-Rad Laboratories, Hercules, CA, United States). Packed RBCs (1 μL) were resuspended in 199 μL of non-aggregating solution (Ringer) and transferred to an ibidi μ-slide. For aggregation analysis, 2.5 μL of packed RBCs were resuspended in 247.5 μL of plasma. The sample was transferred to an ibidi μ-slide and left for 120 s to allow the RBCs to aggregate. (A) control RBCs; (B) aggregates of control RBCs; (C) RBCs from a neuroacanthocytosis patient; (D) RBCs of a neuroacanthocytosis patient after aggregation; (E,F), control RBCs after treatment with orthovanadate before (E) and after aggregation (F); (G,H) control RBCs after treatment with DIDS before (G) and after aggregation (H). The arrows indicate the echinocytes, the large arrowheads point to misshapen RBCs. Treatments were performed as described before (Cluitmans et al., 2012). The length of the bar is 25 μm. Blood was obtained with informed consent and the studies were carried out as described before (De Franceschi et al., 2011; Dinkla et al., 2012; Cluitmans et al., 2015, 2016), in accordance with the CCMO guidelines of the Medical Ethical Committee of the Radboud University Medical Center (file numbers 2007-148, 2013-381, 2018-4421).
In spite of their aberrant morphology (Figure 1C), acanthocytes deform and relax normally when passing through a microfluidics system that mimics the dimensions (7 μm) and shear stress (2 Pa) of capillaries. However, they are retained when squeezing through a spleen-mimicking device, which is consistent with a decreased deformability (Cluitmans et al., 2015). The negative correlation that was observed between the deformability parameters EImax and SS1/2 for control RBCs was observed for neuroacanthocytosis RBCs as well (r = −0.59), as was the correlation between the different aggregation parameters AI and t1/2 (r = −0.95; Table 2). RBCs from neuroacanthocytosis patients, however, displayed lower Tr values than control RBCs (53 ± 5 vs. 116 ± 7 ms), indicating that these RBCs are more stiff. The neuroacanthocytosis RBCs did not show the correlations between Tr and SS1/2 observed for control RBCs (Table 2). Also, there were no statistically significant correlations between the deformability parameters SS1/2 and EImax and the aggregation parameters AI and t1/2 for the neuroacanthocytosis RBCs (Table 2). In addition, there was no correlation between SS1/2 and EImax demonstrating that the intracellular mechanics of these cells is fundamentally different from the one of healthy cells. In contrast, however, a statistically significant correlation was observed between Tr and AMP (the total extent of aggregation), with a correlation coefficient r (0.85) and R2 (0.72) that were much higher than those found in control RBCs (Table 2). Overall, these findings suggests that the viscoelastic properties of the lipid bilayer that influence relaxation/deformability become much more pronounced when the band 3-mediated interaction between the membrane and the cytoskeleton is weakened, as in the misshapen RBCs of neuroacanthocytosis patients (De Franceschi et al., 2014).
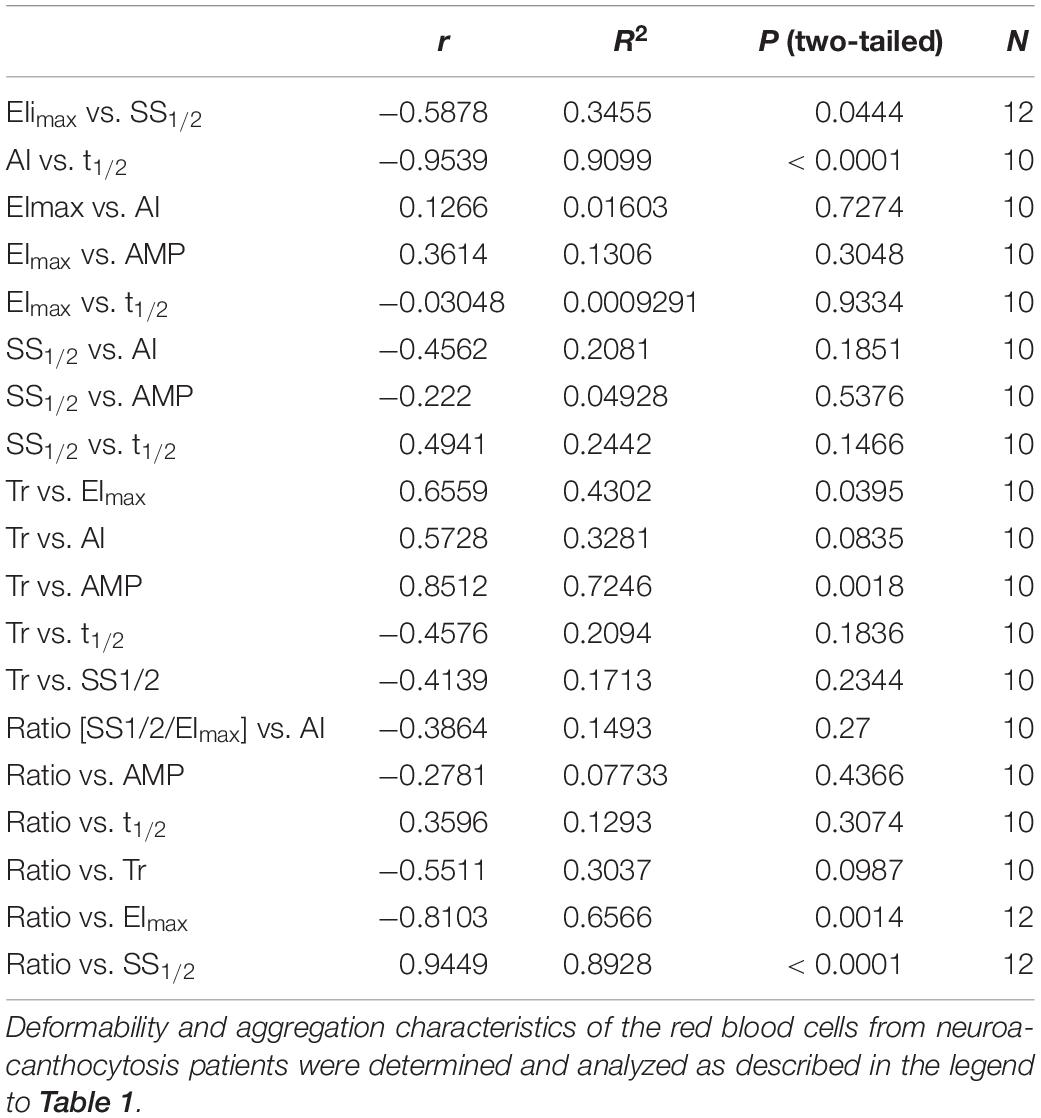
Table 2. Determination of the correlations between deformability and aggregation parameters of red blood cells from neuroacanthocytosis patients.
Microscopy indicates that for the RBCs from neuroacanthocytosis patients the correlation between the kinetics and extent of aggregation is conserved (Figure 1). However, RBCs from neuroacanthocytosis patiens formed more, irregular aggregates than the RBCs from control donors, and these aggregates were smaller and took longer to form (Figure 1). DIDS-induced changes in the organization of band 3 complexes, and orthovanadate-induced, phosphorylation-associated weakening of the connection between the cytoskeleton and the lipid bilayer not only resulted in altered cell morphology, but also in alterations of the shape and size of their aggregates (Figure 1).
General Discussion and Conclusion
Taken together, the correlations that we found between deformability and aggregation, although weak, suggests that at least one common property is involved in both phenomena. Most of these correlations were absent in the misshapen RBCs of patients with acanthocytosis (Table 1 vs. Table 2). Therefore, the common mechanism is likely to be concentrated around the phosphorylation-controlled binding between the integral membrane protein complexes containing band 3 and the cytoskeleton, that is disturbed in neuroacanthocytosis (De Franceschi et al., 2011, 2014). Data from experimental manipulation of phosphorylation status and from the RBCs of patients with hereditary membranopathies support this hypothesis (Cluitmans et al., 2016; Huisjes et al., 2018). Our present analyses indicate that a disturbance in the association between cytoskeleton and membrane affects deformation more than aggregation, thereby reducing the correlation between both processes. A similar conclusion may be drawn from the apparent lack of correlation between deformability and aggregation, for example in red blood cells of various age (Bosch et al., 1994; Cluitmans et al., 2012; of and of patients with diabetes mellitus and coronary artery disease (Keymel et al., 2011; Preibsch et al., 2017). In addition, our present neuroacanthocytosis data in combination with the data obtained through pharmacological modulation of the band 3 complex, provide analytic approaches for delineating the contribution of various membrane components – and their interactions – to deformability and aggregation.
We emphasize that these conclusions are likely to be influenced by the methods and device that are used to measure deformability, and possibly aggregation as well (Dobbe et al., 2003; Baskurt et al., 2009; Da Costa et al., 2016; Huisjes et al., 2018). For example, we have observed that deformability-assessing methods that employ shear stresses and flow conditions similar to those experienced by RBCs in the capillary system, such as a microfluidics device, yield results that are different from those employing larger forces, such as a bead-sorting device and ektacytometry (Deplaine et al., 2011; Cluitmans et al., 2014, 2015, 2016; Da Costa et al., 2016). In addition, quantitative aggregation measurement by ektacytometry alone is likely to obscure any insight into underlying mechanisms, since the resulting parameters may not always reflect the shape and/or size of the aggregates. One example is the relaxation parameter Tr, which is one of the outcomes of most quantitative aggregation analyses, that shows a higher correlation with deformability than with aggregation parameters (Table 1). Simultaneous microscopic analysis may therefore be valuable in distinguishing between the various factors that affect cell-cell interactions. Microscopy of RBCs from various patients or after treatment reveals, in most cases, considerable heterogeneity in cell size and shape (Cluitmans et al., 2012, 2015, 2016). This heterogeneity may be reflected in variations in the deformability and aggregation parameters, especially in the case of a relatively low number of available patient samples, and may underlie the strong decrease in statistical significance of the correlations between deformability and aggregation for the RBCs observed when comparing the data of control RBCs with those from the neuroacanthocytosis patients (cf. Tables 1, 2). Functional heterogeneity may also be affected by the natural history of the red blood cells and red blood cell fractions, as postulated for the exposure of removal signals and the behavior in a microfluidics device of red blood cells of healthy donors (Cluitmans et al., 2012, 2014; Dinkla et al., 2014), and for the age-associated and disease-related heterogeneity in deformability and aggregation in red blood cells of patients with chronic venous disease (Sloczynska et al., 2015).
In conclusion, our current data show clear and rationally accessible correlations between various deformability and aggregation parameters. These correlations are lost in the RBCs of patients with neuroacanthocytosis, thereby identifying band 3 as a key molecular determinant orchestrating both functions.
Author Contributions
DL and JF collected the data. DL and GB performed the correlation analyses. DL, JF, RB, and GB wrote the manuscript.
Funding
The work of JF was supported by the National Council for Scientific and Technological Development (CNPq).
Conflict of Interest
The authors declare that the research was conducted in the absence of any commercial or financial relationships that could be construed as a potential conflict of interest.
Acknowledgments
We thank B. Neu, Rhine-Waal University of Applied Sciences, Kleve, Germany, and R. van Wijk, Laboratory for Clinical Chemistry and Hematology, University Medical Center Utrecht, Netherlands, for enabling the deformability and aggregation measurements.
References
Alaarg, A., Schiffelers, R. M., van Solinge, W. W., and van Wijk, R. (2013). Red blood cell vesiculation in hereditary hemolytic anemia. Front. Physiol. 4:365. doi: 10.3389/fphys.2013.00365
Baskurt, O. K., and Meiselman, H. J. (2013a). Data reduction methods for ektacytometry in clinical hemorheology. Clin. Hemorheol. Microcirc. 54, 99–107. doi: 10.3233/CH-2012-1616
Baskurt, O. K., and Meiselman, H. J. (2013b). Erythrocyte aggregation: basic aspects and clinical importance. Clin. Hemorheol. Microcirc. 53, 23–37. doi: 10.3233/CH-2012-1573
Baskurt, O. K., Uyuklu, M., Ulker, P., Cengiz, M., Nemeth, N., Alexy, T., et al. (2009). Comparison of three instruments for measuring red blood cell aggregation. Clin. Hemorheol. Microcirc. 43, 283–298. doi: 10.3233/CH-2009-1240
Bazanovas, A. N., Evstifeev, A. I., Khaiboullina, S. F., Sadreev, I. I., Skorinkin, A. I., and Kotov, N. V. (2015). Erythrocyte: a systems model of the control of aggregation and deformability. Biosystems 131, 1–8. doi: 10.1016/j.biosystems.2015.03.003
Ben-Ami, R., Barshtein, G., Mardi, T., Deutch, V., Elkayam, O., Yedgar, S., et al. (2003). A synergistic effect of albumin and fibrinogen on immunoglobulin-induced red blood cell aggregation. Am. J. Physiol. Heart Circ. Physiol. 285, H2663–H2669.
Bosch, F. H., Werre, J. M., Schipper, L., Roerdinkholder-Stoelwinder, B., Huls, T., Willekens, F. L., et al. (1994). Determinants of red blood cell deformability in relation to cell age. Eur. J. Haematol. 52, 35–41. doi: 10.1111/j.1600-0609.1994.tb01282.x
Bosman, G. J., Lasonder, E., Groenen-Döpp, Y. A., Willekens, F. L. A., and Werre, J. M. (2012). The proteome of erythrocyte-derived microparticles from plasma: new clues for erythrocyte aging and vesiculation. J. Proteomics 76, 203–210. doi: 10.1016/j.jprot.2012.05.031
Bosman, G. J., Lasonder, E., Groenen-Döpp, Y. A., Willekens, F. L. A., Werre, J. M., and Novotný, V. M. (2010). Comparative proteomics of erythrocyte aging in vivo and in vitro. J. Proteomics 73, 396–402. doi: 10.1016/j.jprot.2009.07.010
Bosman, G. J. C. G. M., Cluitmans, J. C., Groenen, Y. M., Werre, J. M., Willekens, F. L., and Novotný, V. M. (2011). Susceptibility to hyperosmotic stress-induced phosphatidylserine exposure increases during red blood cell storage. Transfusion 51, 1072–1078. doi: 10.1111/j.1537-2995.2010.02929.x
Cluitmans, J. C. A., Chokkalingam, V., Janssen, A. M., Brock, R., Huck, W. T. S., and Bosman, G. J. C. G. M. (2014). Alterations in red blood cell deformability during storage: a microfluidic approach. Biomed. Res. Int. 2014:764268. doi: 10.1155/2014/764268
Cluitmans, J. C. A., Gevi, F., Siciliano, A., Matte, A., Leal, J. K., De Franceschi, L., et al. (2016). Red blood cell homeostasis: pharmacological interventions to explore biochemical, morphological and mechanical properties. Front. Mol. Biosci. 3:10. doi: 10.3389/fmolb.2016.00010
Cluitmans, J. C. A., Hardeman, M. R., Dinkla, S., Brock, R., and Bosman, G. J. C. G. M. (2012). Red blood cell deformability during storage: towards functional proteomics and metabolomics in the blood bank. Blood Transfus. 10(Suppl. 2), 12–18.
Cluitmans, J. C. A., Tomelleri, C., Yapici, Z., Dinkla, S., Bovee-Geurts, P., Chokkalingam, V., et al. (2015). Abnormal red cell structure and function in neuroacanthocytosis. PLoS One 10:e0125580. doi: 10.1371/journal.pone.0125580
Da Costa, L., Suner, L., Galimand, J., Bonnel, A., Pascreau, T., Couque, N., et al. (2016). Diagnostic tool for red blood cell membrane disorders: assessment of a new generation ektacytometer. Blood Cells Mol. Dis. 56, 9–22. doi: 10.1016/j.bcmd.2015.09.001
De Franceschi, L., Bosman, G. J., and Mohandas, N. (2014). Abnormal red cell features associated with hereditary neurodegenerative disorders: the neuroacanthocytosis syndromes. Curr. Opin. Hematol. 21, 201–219. doi: 10.1097/MOH.0000000000000035
De Franceschi, L., Tomelleri, C., Matte, A., Brunati, A. M., Bovee-Geurts, P. H., Bertoldi, M., et al. (2011). Erythrocyte membrane changes of chorea-acanthocytosis are the result of altered Lyn kinase activity. Blood 118, 5652–5663. doi: 10.1182/blood-2011-05-355339
Deplaine, G., Safeukui, I., Jeddi, F., Lacoste, F., Brousse, V., Perrot, S., et al. (2011). The sensing of poorly deformable red blood cells by the human spleen can be mimicked in vitro. Blood 117, 88–95. doi: 10.1182/blood-2010-10-312801
Dinkla, S., Peppelman, M., van der Raadt, J., Alsma, F., Novotny, V. M., Van Kraaij, M. G., et al. (2014). Phosphatidlylserine exposure on stored red blood cells as a parameter for donor-dependent variation in product quality. Blood Transf. 12, 204–209. doi: 10.2450/2013.0106-13
Dinkla, S., Wessels, K., Verdurmen, W. P., Tomelleri, C., Cluitmans, J. C., Fransen, J., et al. (2012). Functional consequences of sphingomyelinase-induced changes in erythrocyte membrane structure. Cell Death. Dis. 3:e410. doi: 10.1038/cddis.2012.143
Dobbe, J. G. G., Streekstra, G. J., Strackee, J., Rutten, M. C., Stijnen, J. M., and Grimbergen, C. A. (2003). Syllectometry: the effect of aggregometer geometry in the assessment of red blood cell shape recovery and aggregation. IEEE Trans. Biomed. Eng. 50, 97–106. doi: 10.1109/tbme.2002.807319
Freitas Leal, J. K., Adjobo-Hermans, M. J. W., and Bosman, G. J. C. G. M. (2018). Red blood cell homeostasis: mechanisms and effects of microvesicle generation in health and disease. Front. Physiol. 9:703. doi: 10.3389/fphys.2018.00703
Freitas Leal, J. K., Adjobo-Hermans, M. J. W., Brock, R., and Bosman, G. J. C. G. M. (2017). Acetylcholinesterase provides new insights into red blood cell ageing in vivo and in vitro. Blood Transfus. 15, 232–238. doi: 10.2450/2017.0370-16
Freitas Leal, J. K., Lazari, D., Bongers, C. C. W. G., Hopman, M. T. E., Brock, R., and Bosman, G. J. C. G. M. (2019). Red blood cell aging as a homeostatic response to exercise-induced stress. Appl. Sci. 9:4827. doi: 10.3390/app9224827
Ghashghaeinia, M., Cluitmans, J. C., Akel, A., Dreischer, P., Toulany, M., Köberle, M., et al. (2012). The impact of erythrocyte age on eryptosis. Br. J. Haematol. 157, 606–614. doi: 10.1111/j.1365-2141.2012.09100.x
Huisjes, R., Bogdanova, A., van Solinge, W. W., Schiffelers, R. M., Kaestner, L., and van Wijk, R. (2018). Squeezing for life – properties of red blood cell deformability. Front. Physiol. 9:656. doi: 10.3389/fphys.2018.00656
Keymel, S., Heiss, C., Kleinbongard, P., Kelm, M., and Lauer, T. (2011). Impaired red blood cell deformability in patients with coronary artery disease an diabetes mellitus. Horm. Metab. Res. 43, 760–765. doi: 10.1055/s-0031-1286325
Koutsiaris, A. G., Tachmitzi, S. V., Batis, N., Kotoula, M. G., Krabatsas, C. H., Tsironi, E., et al. (2007). Volume flow and wall shear stress quantification in the human conjunctival capillaries and post-capillary venules in vivo. Biorheology 44, 375–386.
Li, H., Ye, T., and Lam, K. Y. (2014). Computational analysis of dynamic interaction of two red blood cells in a capillary. Cell. Biochem. Biophys. 69, 673–680. doi: 10.1007/s12013-014-9852-4
Lutz, H. U., and Bogdanova, A. (2013). Mechanisms tagging senescent red blood cells for clearance in healthy humans. Front. Physiol. 4:387. doi: 10.3389/fphys.2013.00387
Preibsch, H., Keymel, S., Kelm, M., Baars, T., and Kleinbongard, P. (2017). Comparison of the simple red blood cell adhesiveness/aggregation test with the laser-assisted optical rotational cell analyzer: red blood cell aggregation in patients with coronary artery disease and a healthy control group. Clin. Hemorheol. Microcirc. 65, 363–371. doi: 10.3233/CH-16201
Rampling, M. W., Meiselman, H. J., Neu, B., and Baskurt, O. K. (2004). Influence of cell-specific factors on red blood cell aggregation. Biorheology 41, 91–112.
Simmonds, M. J., Meiselman, H. J., and Baskurt, O. K. (2013). Blood rheology and aging. J. Geriatr. Cardiol. 10, 291–301.
Sloczynska, K., Kozka, M., and Marona, H. (2015). Rheological properties of young and aged erythrocytes in chronic venous disease patiens with varicose veins. Clin. Hemorheol. Microcirc. 60, 171–178. doi: 10.3233/ch-131715
Stroobach, M., Haya, L., and Fenech, M. (2019). Effects of red blood cell aggregation on microparticle wall adhesion in circular microchannels. Med. Eng. Phys. 69, 100–108. doi: 10.1016/j.medengphy.2019.04.008
Weisel, J. W., and Litvinov, R. I. (2019). Red blood cells: the forgotten player in hemostasis and thrombosis. J. Thromb. Haemost. 17, 1–12. doi: 10.1111/jth.14360
Willekens, F. L., Bosch, F. H., Roerdinkholder-Stoelwinder, B., Groenen-Döpp, Y. A., and Werre, J. M. (1997). Quantification of loss of haemoglobin components from the circulating red blood cell in vivo. Eur. J. Haematol. 58, 246–250. doi: 10.1111/j.1600-0609.1997.tb01662.x
Willekens, F. L. A., Werre, J. M., Groenen-Döpp, Y. A. M., Roerdinkholder-Stoelwinder, B., de Pauw, B., and Bosman, G. J. (2008). Erythrocyte vesiculation: a self-protective mechanism? Br. J. Haematol. 141, 549–556. doi: 10.1111/j.1365-2141.2008.07055.x
Keywords: aggregation, aging, deformability, membrane, red blood cell
Citation: Lazari D, Freitas Leal JK, Brock R and Bosman G (2020) The Relationship Between Aggregation and Deformability of Red Blood Cells in Health and Disease. Front. Physiol. 11:288. doi: 10.3389/fphys.2020.00288
Received: 26 September 2019; Accepted: 16 March 2020;
Published: 15 April 2020.
Edited by:
Gregory Barshtein, The Hebrew University of Jerusalem, IsraelReviewed by:
Sehyun Shin, Korea University, South KoreaNorbert Nemeth, University of Debrecen, Hungary
Copyright © 2020 Lazari, Freitas Leal, Brock and Bosman. This is an open-access article distributed under the terms of the Creative Commons Attribution License (CC BY). The use, distribution or reproduction in other forums is permitted, provided the original author(s) and the copyright owner(s) are credited and that the original publication in this journal is cited, in accordance with accepted academic practice. No use, distribution or reproduction is permitted which does not comply with these terms.
*Correspondence: Giel Bosman, R2llbC5Cb3NtYW5AcmFkYm91ZHVtYy5ubA==