 Elena Kutumova
 Ilya Kiselev
 Ruslan Sharipov
 Galina Lifshits
 Fedor Kolpakov
- 1Department of Computational Biology, Sirius University of Science and Technology, Sochi, Russia
- 2Laboratory of Bioinformatics, Federal Research Center for Information and Computational Technologies, Novosibirsk, Russia
- 3Biosoft.Ru, Ltd., Novosibirsk, Russia
- 4Specialized Educational Scientific Center, Novosibirsk State University, Novosibirsk, Russia
- 5Laboratory for Personalized Medicine, Center of New Medical Technologies, Institute of Chemical Biology and Fundamental Medicine SB RAS, Novosibirsk, Russia
Hypertension is a multifactorial disease arising from complex pathophysiological pathways. Individual characteristics of patients result in different responses to various classes of antihypertensive medications. Therefore, evaluating the efficacy of therapy based on in silico predictions is an important task. This study is a continuation of research on the modular agent-based model of the cardiovascular and renal systems (presented in the previously published article). In the current work, we included in the model equations simulating the response to antihypertensive therapies with different mechanisms of action. For this, we used the pharmacodynamic effects of the angiotensin II receptor blocker losartan, the calcium channel blocker amlodipine, the angiotensin-converting enzyme inhibitor enalapril, the direct renin inhibitor aliskiren, the thiazide diuretic hydrochlorothiazide, and the β-blocker bisoprolol. We fitted therapy parameters based on known clinical trials for all considered medications, and then tested the model’s ability to show reasonable dynamics (expected by clinical observations) after treatment with individual drugs and their dual combinations in a group of virtual patients with hypertension. The extended model paves the way for the next step in personalized medicine that is adapting the model parameters to a real patient and predicting his response to antihypertensive therapy. The model is implemented in the BioUML software and is available at https://gitlab.sirius-web.org/virtual-patient/antihypertensive-treatment-modeling.
1 Introduction
Hypertension is an important worldwide public-health challenge and the most common risk factor for the development of cardiovascular (myocardial infarction, stroke, coronary heart disease, heart failure), cerebrovascular (ischemic or hemorrhagic stroke, transient ischemic attack) and renal diseases (Kearney et al., 2005; Oparil et al., 2018; Campbell et al., 2014). The prevalence of hypertension in the world is 30%–45% among the adult population (Kearney et al., 2005; Irazola et al., 2016). This pathological syndrome is a complex multifactorial disease caused by genetic predisposition and complicated interplay between pathophysiological and environmental factors, from dietary characteristics to social living conditions. The maintenance of physiological blood pressure levels involves various regulators, including neural and endocrine effects, balance of fluid and electrolytes, and the action of the renin–angiotensin–aldosterone system (RAAS) (Oparil et al., 2018).
Non-drug therapy of hypertension includes lifestyle changes (weight loss, exercise, dietary modification, smoking cessation, etc.) (Tejada et al., 2006). Pharmacological therapy is used to lower blood pressure and prevent hypertension and its cardiovascular disease sequelae (Oparil et al., 2018). Currently, five major drug classes are recommended for the treatment of hypertension (Williams et al., 2018):
• angiotensin-converting enzyme inhibitors reduce RAAS activity by inhibiting the conversion of angiotensin I into angiotensin II (Dézsi, 2014);
• angiotensin receptor blockers inhibit the binding of angiotensin II to AT1-receptors in a competitive manner (Dézsi, 2014);
• β-adrenoreceptor blockers decrease cardiac output, heart rate, renin release and the sympathetic nervous system activity (Oparil et al., 2018);
• calcium channel blockers, including dihydropyridines (e.g., amlodipine), cause vasodilation (Oparil et al., 2018);
• diuretics (thiazides and thiazide-like diuretics) inhibit sodium and chloride co-transporters in renal tubules, thereby promoting natriuresis (Oparil et al., 2018).
In addition to first-line antihypertensive drugs, reserve medications, such as direct renin inhibitors, are also being considered. The advantages of direct renin inhibitors include possible greater protection from hypertensive complications, additional blood pressure reduction when used in combination therapy, a placebo-like side-effect profile, avid renal concentration, and long duration of action for some compounds (Israili et al., 2010; Bonanni and Dalla Vestra, 2012). The tactics of treatment (mono- or combination therapy, drugs with rapid absorption or with prolonged action) are selected individually for each patient.
As representatives of various classes of antihypertensive drugs in our study, we considered the angiotensin II receptor blocker losartan (Sica et al., 2005), the calcium channel blocker amlodipine (Fares et al., 2016), the angiotensin-converting enzyme inhibitor enalapril (Ferguson et al., 1982), the direct renin inhibitor aliskiren (Gradman et al., 2005), the thiazide diuretic hydrochlorothiazide (Carter et al., 2004), and the β-blocker bisoprolol (Lancaster and Sorkin, 1988).
Despite some progress in the treatment of hypertension, a number of points must be noted:
• the number of patients with uncontrolled (drug-resistant) course of the disease is growing every year (Sarafidis et al., 2013);
• the integrated contribution of multiple genetic effects to the disease pathogenesis is still unclear (Patel et al., 2017), while this contribution can reach 50% (Luft, 2001);
• the impact of changes associated with cellular aging (Fajemiroye et al., 2018) on disease progression is the subject of research;
• the choice of effective and rational combination antihypertensive therapy remains complex (Gradman et al., 2010).
To address these points, mathematical modeling of the circulatory regulation and renal function taking into account the response to antihypertensive therapies with different mechanisms of action has become increasingly important. Such modeling paves the way for solving the following problems:
• to gain mechanistic insights into the complex dynamics of circulatory regulation in response to drug treatment;
• to predict the effectiveness (or ineffectiveness) of the chosen treatment strategy before prescribing drugs to patients and thereby gain time and prevent the development of complications associated with hypertension;
• to assess the risk of disease based on the results of a genome-wide association study (International Consortium for Blood Pressure Genome-Wide Association Studies et al., 2011);
• to explore the processes of general and vascular aging via consideration of the age-dependent physiological parameters reproduced in the computational model (e.g., the vascular wall stiffness).
Previously created predictive mathematical models either focus on the renal/body fluid system (Uttamsingh et al., 1985; Karaaslan et al., 2005; Hallow et al., 2014; Karaaslan et al., 2014; Hallow and Gebremichael, 2017) based on the model by Guyton et al. (1972), or simulate cardiovascular and pulmonary physiology (Ottesen et al., 2004; Proshin and Solodyannikov, 2006; Paeme et al., 2011; Rosalina et al., 2019). Using this, we developed a modular agent-based model of blood pressure regulation (Kutumova et al., 2021) that describes the cardiovascular and renal systems in great detail. The main advantage of the model is that it is thoroughly calibrated. Clinical ranges cover 49 out of 132 model parameters and 69 out of 160 model variables. The remaining parameters and variables of the model either cannot be measured in the laboratory, or we could not find available data on such measurements. In addition, the range of acceptable model values is not limited to the dynamics of healthy people or patients with the same combination of cardiovascular diseases, but is sufficient to simulate different states. For example, in our baseline study, we reproduced virtual patients with such diseases as uncomplicated hypertension (Ferlinz, 1980), non-hypertensive and hypertensive diastolic heart failure (Fujimoto et al., 2008), hypertensive left ventricular (LV) hypertrophy (Melenovsky et al., 2007), and pulmonary hypertension with left heart disease (Wright et al., 2017). Detailed documentation describing all equations, parameters and variables of the model, with justification of all formulas and changes made to the primary models, is available in the supplementary file to our basic study (Kutumova et al., 2021).
The first application for this model is an extension to account for the actions of different antihypertensive agents. Note that the modular structure of the model allows this to be achieved by adding a new module responsible for calculating the pharmacodynamic functions for each agent, as well as by defining the related target points in the rest of the model. Some pharmacodynamic effects of therapy are direct. In this case, the target variable of the model is multiplied by the influence function, the value of which depends on the dose of the drug. This approach is applied in the model by Hallow et al. (2014) for a number of antihypertensive medications. Other drug effects may be indirect. For example, RAAS inhibitors cause a change in the concentration of angiotensin II, which exerts physiological actions in many target organs, including the kidneys, adrenal glands, heart, blood vessels and brain (Allen et al., 2000). During the model creation we explored in detail the targets of angiotensin II and introduced the necessary influence functions (Kutumova et al., 2021).
The second significant application is personal predictive medicine. The underlying approach, quantitative systems pharmacology modeling, involves adapting the model to physiological quantities in a particular patient and subsequently analyzing the outcomes predicted by various treatment strategies (Allen et al., 2016; Cheng et al., 2017). To study the effect of parameter variability on treatment results, quantitative systems pharmacology models are simulated using different parameterizations termed virtual patients. A virtual population, or population of “digital twins” (Bruynseels et al., 2018; Kamel Boulos and Zhang, 2021), can be generated by the following rules:
• clinical measures (blood pressure, cardiac output, blood biochemistry, heart rate, etc.) have the same values as in a real patient;
• “hidden” characteristics that were not measured in a particular patient (for example, due to the complexity or high cost of laboratory tests), but in general can be estimated from experiments (e.g., central venous pressure, peak flow rates through the heart valves, number of nephrons per kidney, etc.) or from simulation studies (e.g., sympathetic sensitivity of the systemic microvessels), vary depending on the patient’s diseases within the normal or pathological ranges.
Thus, to generate virtual hypertensive patients, we fit parameters that are either directly related to the disease (and therefore deviate from the norm), or vary within known normal ranges. Parameter fitting consists in minimizing the distances between the clinical measures and the corresponding simulated quantities. In addition, we use constrained optimization techniques to account for the set of required physiological ranges for the model variables. So the concept of thorough calibration is applied to each generated virtual patient, which is a novel approach in quantitative systems pharmacology modeling.
Another challenge that involves the creation of virtual populations is in silico clinical trials (Pappalardo et al., 2019). As in the case of real experiments, this task requires the specification of inclusion and exclusion criteria and assumes that clinically measurable characteristics (such as blood pressure, heart rate, etc.) have normal distributions with reasonable means and standard deviations. All in silico trials are equally controllable (Pappalardo et al., 2019), i.e., all drugs (or drug combinations) are tested in the same population without lifestyle changes in patients, which is not possible in real studies.
The implementation of both applications paves the way for modeling individual responses to different classes of antihypertensive agents and thus can be used for personalized predictions on a case-by-case basis. For the model development we used the BioUML software (Kolpakov et al., 2022).
2 Materials and methods
2.1 Mathematical base
We utilize the comprehensive computational model of human cardiovascular and renal systems presented by Kutumova et al. (2021) and available in the BioModels database (Malik-Sheriff et al., 2020) with ID MODEL22021600011.
2.2 Modular architecture
A module is defined as part of a complete mathematical model with inputs and outputs to communicate with other modules:
• inputs receive variables calculated outside of the current module;
• outputs pass variables determined in the current module and required outside of it.
The original model (Kutumova et al., 2021) has two modular representations:
• version with two modules characterizes the interaction of the cardiovascular and renal systems;
• version with 20 modules describes in more detail the integration of 11 functional modules in the cardiovascular submodel and 9 functional modules in the renal submodel (purple and green modules in Figure 1, respectively).
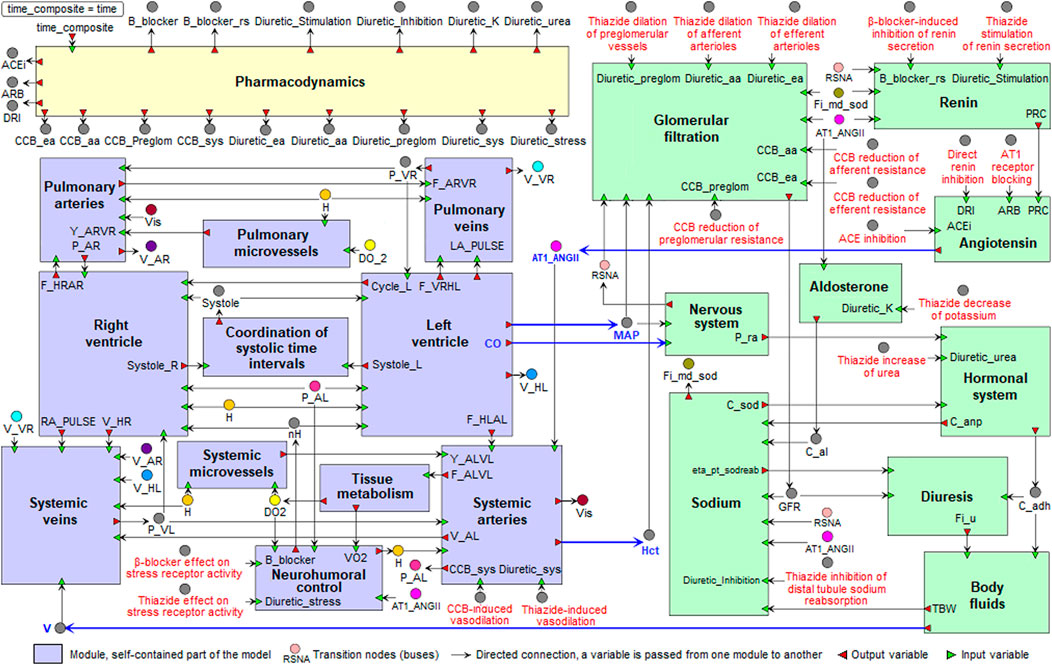
FIGURE 1. Modular agent-based model of the cardiovascular (purple) and renal (green) systems, including the pharmacodynamic module (yellow). Blue arrows indicate directed connections between the renal and cardiovascular sub-diagrams. For the visual simplicity, we added transition nodes (buses) for connections between modules. Target points of antihypertensive agents are marked in red (details are given in the section “Modeling antihypertensive effects” below). Abbreviations in the labels of target points: CCB, calcium channel blocker; ACE, angiotensin-converting enzyme.
2.3 Equilibrium states
Since the model describes the dynamics of the circulatory system, its behavior is related to the cardiac cycle. In this regard, we say that the model is in an equilibrium state if all of its variable values either do not change (e.g., systolic/diastolic blood pressure) or oscillate steadily with an amplitude equal to the length of the cardiac cycle (e.g., systemic arterial pressure).
2.4 Agent-based simulation
The agent-based approach is used to model complex systems comprising a large number of subsystems, in particular, when it is difficult or impossible to formalize the system behavior at the global level. Within the framework of this approach, the system is considered as an aggregation of multiple parts—agents, each of which acts separately, using a set of rules, and can interact with other agents (Soheilypour and Mofrad, 2018; An et al., 2009; Macal and North, 2010). In our case, the agent is a mathematical model combined with an appropriate numerical solver. The simulation of agents consists in solving the underlying model until the next time point. The interaction between agents is handled by a separate scheduler and consists in the exchange of variable values between models.
In the case of the model of the cardiovascular and renal systems, the agent-based approach is utilized, since different submodels have vast differences in time scales: cardiovascular processes take fractions of a second, while the renal system contains long-term processes lasting minutes, which makes the whole model very stiff. Thus, we divide the model into two agents which are simulated with different solvers and exchange variable values during the simulation. To simulate each agent (i.e., to solve the Cauchy problem), we used a version of the CVODE solver (Hindmarsh et al., 2005) ported to Java and adapted to the BioUML application programming interface.
2.5 Frank-Starling mechanism
The Frank-Starling relationship governs normal ventricular function and ensures that the volume the heart ejects in systole (stroke volume, SV) equals the volume it receives in venous return (Costanzo, 2014). That is, within physiologic limits, the heart pumps all the blood that returns to it by the way of the veins (Hall, 2011). As venous return increases, ventricular end-diastolic volume (EDV) also increases, and due to the cardiac length-tension relationship, SV increases accordingly (Figure 2A). Note that changes in heart contractility (or inotropism) affect the Frank-Starling curves (Hillegass, 2011; Costanzo, 2014). Positive inotropic agents produce an increase in SV for a given EDV and, as a result, an increase in ejection fraction (EF), calculated as
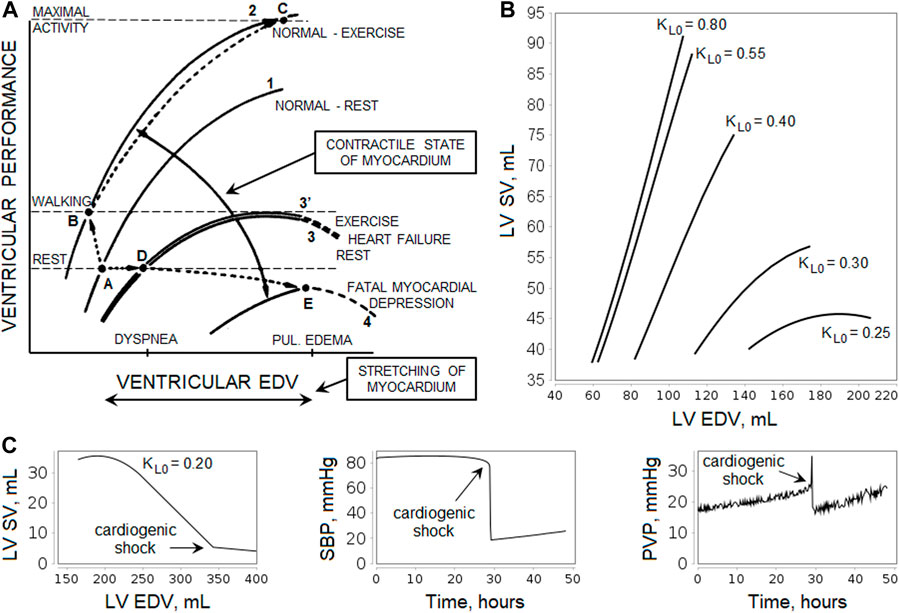
FIGURE 2. Illustration of the Frank-Starling law. (A) Relationship curves between ventricular performance (i.e., stroke volume, SV) and ventricular end-diastolic volume (EDV) depending on the myocardial contractility. An increase in contractility results in a shift of the curve upward and to the left (greater SV for a given level of EDV and lower EDV at any level of SV, curves 1 to 2, points A to B), while depression of contractility leads to a shift downward and to the right (curves 1 to 3, points A to D). The scheme shows the relative levels of EDV that cause dyspnea and pulmonary edema, as well as the levels of ventricular performance required during rest and walking. For more details, see the study by Braunwald et al., 1967. [Reproduced from (Braunwald et al., 1967). Copyright © 2022 Massachusetts Medical Society. Reprinted with permission from Massachusetts Medical Society]. (B) Simulation of the left ventricular (LV) Frank-Starling curves in the model. The curves were obtained using the normal equilibrium state by changing the oxygen demand
Negative inotropic agents have the opposite effect (Costanzo, 2014). In experienced endurance athletes, the myocardial contractility is higher than in untrained healthy individuals (Schattke et al., 2014; Tanaka et al., 1986), whereas heart failure is often caused by impaired contractility (Braunwald et al., 2001). In patients with heart failure, cardiac output and external ventricular performance at rest are generally within normal limits, but an elevation of LV EDV (or preload) is associated with increases in the pulmonary capillary pressure, contributing to the dyspnea, while an elevation of right ventricular preload raises systemic venous pressure and contributes to the development of edema. LV failure becomes fatal when the SV-EDV curve is depressed to the point at which cardiac performance fails to satisfy the requirements of the body even at rest (Figure 2A).
Changes in hemodynamic parameters that occur during exercise are complex. Hyperventilation, the pumping action of the muscles, and the venoconstriction normally augment venous return. Simultaneously, the increased traffic of adrenergic nerve impulses to the myocardium, the increased concentration of circulating catecholamines, and the tachycardia augment the contractile state of the myocardium, elevating the SV without changing (or even with a reduction) of EDV (Braunwald et al., 2001). At low to moderate exercise intensity, the Frank-Starling mechanism is thought to be mainly responsible for the observed increase in SV, while submaximal and vigorous exercise involves the combination of myocardial contractility, tachycardia and the Frank-Starling mechanism (Warburton et al., 2002; Vieira et al., 2016). In heart failure, the improvement of contractility during exercise is attenuated or even prevented by norepinephrine depletion and downregulation of myocardial β-receptors, so the SV-EDV curve practically does not shift (Braunwald et al., 2001).
In our model, in accordance with the work by Proshin and Solodyannikov (2006), the maintenance of the Frank-Starling law is provided by the formula:
where
2.6 Modeling antihypertensive effects
We performed drug activity modeling as follows. First, we defined target variables in the model for all antihypertensive agents, and then we multiplied each target variable by the specific function F that provides the pharmacodynamic effect of therapy:
In this equation,
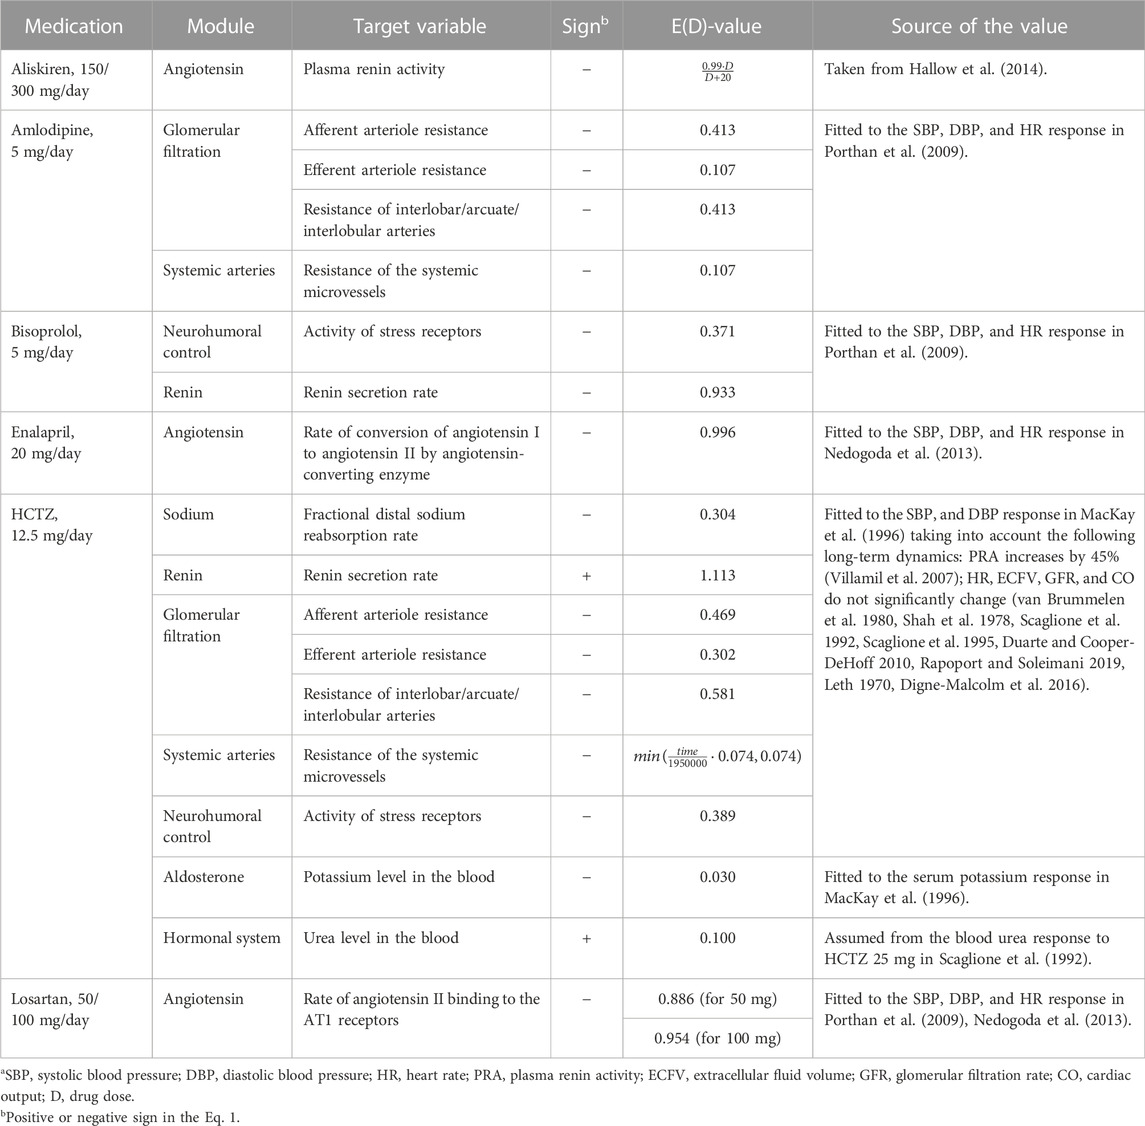
TABLE 1. Target variables of antihypertensive drugs included in the model.a
Aliskiren is a low molecular weight renin inhibitor of non-peptide structure (Gradman et al., 2005). The antihypertensive effect,
where
Amlodipine causes dilation (and, as a result, a decrease in resistance) of afferent and efferent arterioles (Hayashi et al., 2007), as well as interlobar, arcuate, and interlobular arteries (Hallow et al., 2014). The corresponding influences,
Bisoprolol is a β1-adrenoceptor antagonist with no partial agonist (intrinsic sympathomimetic) activity or membrane stabilizing (local anaesthetic) activity (Lancaster and Sorkin, 1988). Since β-blockers suppress renin secretion in the kidneys and reduce its level and activity (Laragh and Sealey, 2011), we added the corresponding effect,
Enalapril is an angiotensin-converting enzyme inhibitor (Ferguson et al., 1982) which acts in the module “Angiotensin''. The action of the drug is modeled by multiplying the rate of conversion of angiotensin I to angiotensin II by the function
Hydrochlorothiazide (HCTZ) belongs to the benzothiadiazine class, referred to simply as thiazide diuretics (Carter et al., 2004). Thiazide-induced reduction of arterial pressure includes differentiation into acute and chronic phases (Rapoport and Soleimani, 2019). The acute reduction correlates with diuresis and a decrease in plasma volume associated with inhibition of sodium reabsorption in the distal tubules (Duarte and Cooper-DeHoff, 2010). This phenomenon is described by the drug effect of
A possible mechanism of the chronic reduction includes vascular dilation (Rapoport and Soleimani, 2019; Duarte and Cooper-DeHoff, 2010). Thus, by analogy with the model by Hallow et al. (2014), we introduced into the module “Glomerular filtration'' the effects of
• extracellular fluid (as well as plasma volume) is initially reduced by thiazides and then almost fully recovers within 4–6 weeks of continuous treatment (Duarte and Cooper-DeHoff, 2010; Rapoport and Soleimani, 2019; Leth, 1970);
• cardiac output decreases with plasma volume loss and then returns to the baseline levels with long-term thiazide treatment (Duarte and Cooper-DeHoff, 2010; van Brummelen et al., 1980).
We found that the recovery of these values can be reproduced in the module “Systemic arteries” with a growing influence of
where
As other targets of HCTZ in the model, we considered constant levels of urea and potassium in the blood. Since HCTZ increases blood urea and decreases blood potassium (Scaglione et al., 1992; Scaglione et al., 1995; Devineni et al., 2014), we multiplied these parameters by the factors
In addition, a clinical trial by Villamil et al. (2007) shows that HCTZ monotherapy increases plasma renin activity. Therefore, following the model by Hallow et al. (2014), we took into account the direct effect of
Another target of the drug is based on the fact that heart rate does not change significantly with long-term treatment with HCTZ (van Brummelen et al., 1980; Shah et al., 1978; Scaglione et al., 1992; Scaglione et al., 1995). Different studies show that norepinephrine pressor response decreases or remains unchanged with thiazide diuretics (Rapoport and Soleimani, 2019). Thus, we assumed the effect of
Losartan is an angiotensin-receptor antagonist without agonist properties (Sica et al., 2005). Its action is modeled in the module “Angiotensin” by the function of the form
2.7 Virtual patient
Similar to the study by Cheng et al. (2017), we define a virtual patient as a single equilibrium parameterization of the model. This parameterization corresponds to a specific state of the patient, for example, “sick” or “healthy”. Response of the patient to external stimuli (e.g., taking antihypertensive drugs) is carried out by introducing a perturbation into the model values and subsequently solving the modified system to search for a new equilibrium. We divide the model parameters (constant values of the model) into two groups:
• the personal parameters vary within normative or pathological ranges or take a fixed value in accordance with clinical measurements in a real patient;
• the general parameters take the same values for all virtual patients.
Among the model variables, we single out observable (i.e., clinically measurable) characteristics. Such variables can be used to verify how well a virtual patient matches a real person.
2.8 Parameter estimation
The use of optimization methods in the current work was necessary in two problems:
• to calibrate the kinetic parameters of drugs based on experimental studies;
• to generate virtual patients with given values of physiological quantities.
In both cases, we fitted the model parameters by minimizing the distance function, defined as the normalized sum of squared differences (Hoops et al., 2006) between several observed (
Additionally, to take into account the known physiological constraints
To solve such optimization problems, we used a stochastic ranking evolution strategy (Runarsson and Yao, 2000) suitable for constrained global optimization.
2.9 Generation of one virtual patient
The task of generating a virtual patient is to find an equilibrium state of the model within the given physiological ranges. Suppose we have a medical history that includes the results of laboratory diagnostics for some person (blood pressure monitoring, electrocardiography, echocardiography, blood tests, etc.). We can directly substitute those of the measured values which are constant in the model (these are body weight and blood counts). The measured values calculated in the model (such as blood pressure, heart rate, glomerular filtration rate, etc.) can be achieved by minimizing the objective function (2). If the patient’s history confirms the presence (or absence) of any cardiovascular or renal diseases, we can also consider the constraints imposed on a number of model parameters and variables that were not explicitly measured. For example, the normal range of systemic vascular resistance is 700–1,600 dyn×s/cm5 (Klingensmith et al., 2016), while in patients with congestive heart failure, the values are generally higher: 944–2,209 dyn×s/cm5 (Laskey et al., 1990). In the case of the model parameters, such constraints determine the boundaries of the search space (the lower and upper limits of the fitting parameters). In the case of variables, they define the feasible region used to calculate the penalty function (3). A complete list of the ranges of parameters and variables that we consider in the current work is provided in Supplementary Tables S1, S2 and justified in our basic study (Kutumova et al., 2021).
Note that the agent-based model converges to the equilibrium state much more slowly than each of the agents independently. Therefore, the optimization of the entire model takes more time. However, the mean arterial pressure, cardiac output and hematocrit values sent by the cardiovascular submodel to the renal agent (Figure 3) are clinically measurable and can be found in the patient’s history (if not, we can randomly select them from physiological ranges). By fixing these values, we can estimate the parameters of only the renal system, pass the necessary equilibrium values to the cardiovascular agent, and then optimize its parameters by minimizing the distances between the simulated and fixed equilibriums of mean arterial pressure and cardiac output at a constant value of hematocrit. Figure 3 demonstrates the described algorithm.
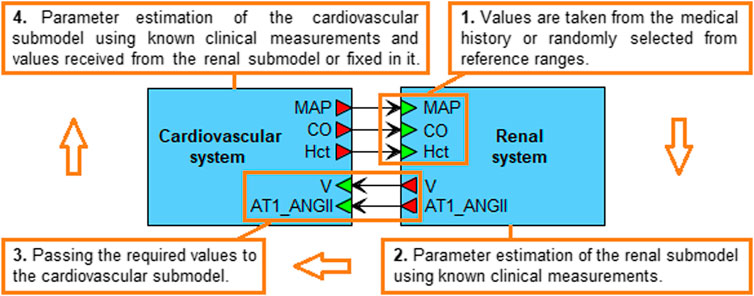
FIGURE 3. Algorithm for generating a virtual patient. The mean arterial pressure (MAP), cardiac output (CO) and hematocrit (Hct) values are taken from the real patient’s history or randomly selected from physiological ranges in accordance with the patient’s diseases. When the estimation of the renal submodel parameters is completed, the equilibrium values of the total blood volume (V) and the concentration of angiotensin II bound to the AT1 receptors (AT1_ANGII) are passed to the cardiovascular submodel. The latter is then calibrated so that the simulated MAP and CO equilibrium values, and the constant Hct value, coincide with the values set in the renal submodel. When the calibration of both submodels is finished, the equilibrium values are combined into a virtual patient.
2.10 Checking the virtual patients
In the current work, we generate virtual patients with uncomplicated hypertension. Analyzing the model, we found that some equilibrium parameterizations under perturbations of physiological parameters result in persistent increase in pulmonary venous pressure, which occurs due to the accumulation of blood in the pulmonary veins. This condition leads to pulmonary edema (Burkhoff and Tyberg, 1993; Alwi, 2010), which may be the result of a hypertensive crisis (Varounis et al., 2017). Because of the complexity of the model, the regions in the parameter space that induce such a state are not obvious and represent a separate issue for study, which is beyond the scope of this work. Here, we restrict ourselves to excluding invalid patients from the analysis. An increase in pulmonary venous blood volume can be detected with an increase in total blood volume that follows an increase in sodium intake (denoted as
2.11 Generation of the virtual population
A virtual population is a collection of unique virtual patients. To generate a population with varying values of systolic blood pressure, diastolic blood pressure (DBP), heart rate (HR), body weight, and body mass index (BMI), we used a function producing the random numbers with the required mean and standard deviation (SD).
We analyzed the baseline characteristics of hypertensive patients enrolled in different clinical trials of aliskiren, amlodipine, bisoprolol, enalapril, hydrochlorothiazide, and losartan (Abate et al., 1998; Agabiti Rosei et al., 2005; Brown et al., 2011; Corea et al., 1996; Cushman et al., 2012; Derosa et al., 2014; Fagher et al., 1990; Fermé et al., 1990; Gradman et al., 2005; Koh et al., 2004; Kwakernaak et al., 2017; Lee et al., 2012; Lithell et al., 1987; Mallion, 2007; Martina et al., 1999; Narkiewicz, 2007; Nedogoda et al., 2013; Oparil et al., 1996; Oparil et al., 2008; Pareek et al., 2016; Paterna et al., 2007; Pool et al., 2007; Porthan et al., 2009; Puig et al., 2007; Sun et al., 2016; Tham et al., 1993; Weber et al., 1995; Wing et al., 2003). Based on these characteristics, we selected suitable mean and SD values for the necessary quantities. A summary table describing the clinical trial populations is given in the Supplementary Material (Supplementary Table S3). Table 2 shows the settings of SBP, DBP, HR, BMI, weight, height, and gender that we used in our work. Note that for other parameters and variables of the model, we also took into account physiological ranges typical for a patient with uncomplicated arterial hypertension (Supplementary Tables S1, S2). Thus, as the inclusion criteria, we considered essential hypertension (SBP ≥ 140 mmHg and/or DBP ≥ 90 mmHg; SBP > 130 mmHg; DBP > 80 mmHg), BMI > 22 kg/m2, and average height (160–180 cm). The exclusion criteria were severe hypertension (SBP > 179.5 mmHg or DBP > 109.5 mmHg), cardiovascular or renal complications, abnormal heart rate (HR < 60 or HR > 90 beats/min), and severe obesity (BMI > 36 kg/m2).
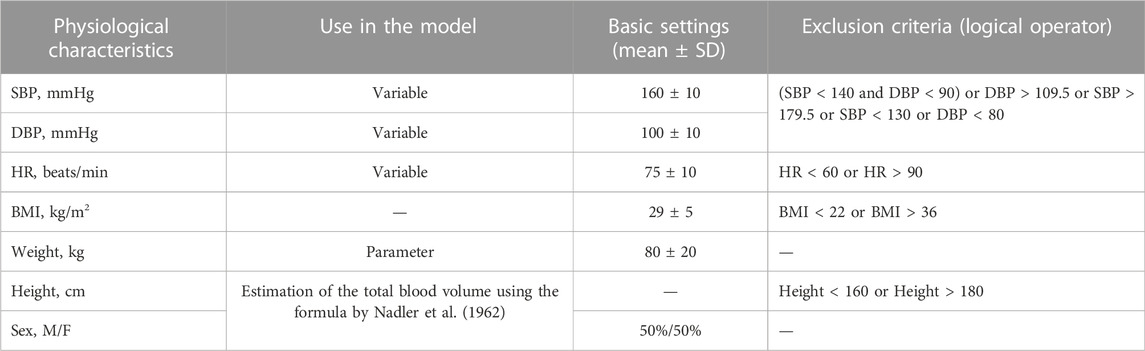
TABLE 2. Basic settings for generating a virtual population with arterial hypertension.
The algorithm for obtaining virtual patients was as follows:
1. Randomly generate SBP, DBP, HR, BMI, and weight values with the basic settings from Table 2 so that these values do not fall into the exclusion criteria.
2. Set the selected weight value into the model. Use height (calculated as
3. If a solution to the optimization problem is found, check it using a sodium loading test. If the simulated dynamics of the model is appropriate, add the generated patient to the resulting population.
4. Repeat steps 1–3 until the required number of virtual patients is reached.
2.12 Calibration of the therapy parameters
We performed the model calibration in the following way. For the pharmacodynamics of aliskiren, we used the kinetic parameters from the study by Hallow et al. (2014). Since aliskiren does not affect HR (Stanton et al. 2003) and glomerular filtration rate (GFR) (Kwakernaak et al., 2017; Bokuda et al., 2018; Siddiqi et al., 2011), we reproduced the similar behavior of these variables in the model. For this purpose, we generated a test population of 100 virtual hypertensive patients with varying values of SBP, DBP, HR, body weight, and BMI (as described in the current section above). Then, for each patient in the population, we estimated the dimensionless parameters responsible for the effect of angiotensin II on the cardiac muscle through baroreceptors (
and fixed them in the model. This change led to a violation of the equilibrium states of the virtual patients. Therefore, at the next step, we found new equilibrium states. After that, we fitted the kinetic parameters of all other drugs for each patient in the adjusted population so that the simulated changes in the target physiological variables (given in the last column of Table 1) were equal to the mean changes in the corresponding experimental characteristics. As the final values of the therapy parameters [column “E(D)-value” in Table 1], we took the mean values for the population.
2.13 Modeling platform
BioUML (https://ict.biouml.org/; https://sirius-web.org/bioumlweb/) is a Java-based integrated environment for systems biology (Kolpakov et al., 2022). It supports a wide range of biological formats and such tools as visual modeling, simulation, parameter estimation and a number of other numerical methods. The software features used in this work are the following:
• a web-version (for collaboration and public presentation of data) and a standalone version (for independent work) of the program;
• an editor for modular and agent-based modeling;
• support of the systems biology markup language (SBML) (Hucka et al., 2019) for model exchange;
• a variety of ordinary differential equation solvers, in particular, the CVODE solver (Hindmarsh et al., 2005), ported to Java and extended to fully support SBML L3.V2;
• a variety of global optimization methods, in particular, the evolution strategy using stochastic ranking (Runarsson and Yao, 2000), which is preferably used in this article;
• integration with the Jupyter hub (https://jupyter.org/) for interactive data analysis.
3 Results and discussion
3.1 Generation of the virtual population
One of the techniques for generating virtual patients is described by Allen et al. (2016). The authors propose to create a large number (hundreds of thousands) of “plausible patients”, defined as model parameterizations within biologically plausible ranges, and then select from them a virtual population corresponding to the desired empirical distribution. To find a plausible patient, they take model inputs within the predefined plausible bounds and optimize this choice until the required outputs also fall within plausible ranges. However, the authors note that their approach is not applicable to models that are slowly simulated (for example, with dynamics across multiple time-scales, as is the case of our model) due to high computational cost to get a large plausible population. An easier way to create a virtual population is discussed in works by Hallow et al. (2014), Hallow et al. (2020), where inputs are sampled from predefined ranges and considered as valid virtual patients only if they produce outputs with physiologically reasonable values. This approach may be relevant with a relatively small number of inputs and outputs [the authors consider 11 inputs/13 outputs in one study (Hallow et al., 2014) and 14 inputs/3 outputs in another study (Hallow et al., 2020)]. However, with a large number of inputs/outputs (in our case, 57 inputs given in Supplementary Table S1 and 54 outputs given in Supplementary Table S2), it leads to enumeration of a huge number of samples with a high rejection rate. Therefore, we apply our own method for generating a virtual population. Like Allen et al., we use optimization methods with a penalty function to create virtual patients, which ensures that outputs are within physiologically acceptable ranges. In addition, for each patient, we minimize the objective function of the distances between the simulated and normally distributed random values of SBP, DBP, and HR, which directly gives us a population with predefined empirical distributions of these quantities (for more details see the Materials and methods section). To test the model, we generated a population of 250 virtual hypertensive patients. The baseline characteristics of this population are shown in Table 3.
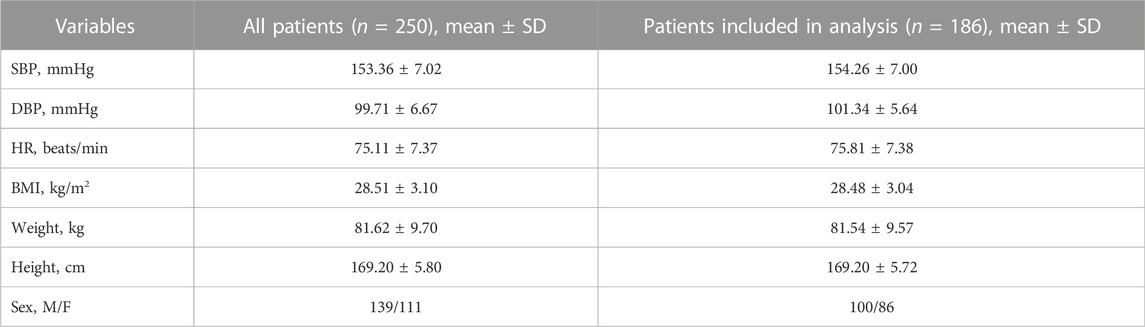
TABLE 3. Baseline characteristics of the virtual population produced for testing the model.
3.2 Selection of patients with valid response to antihypertensive treatment
Using the pharmacodynamic models determined above, we simulated 4-week antihypertensive treatment of the generated virtual patients. To check the resulting changes in the model variables, we compiled a table describing the physiological response to therapy with aliskiren, amlodipine, bisoprolol, enalapril, HCTZ, and losartan (Supplementary Table S4). This table combines information from previously published clinical studies and includes post-treatment changes (increase, decrease, or no change) in plasma renin activity, plasma concentrations of renin, angiotensin I, angiotensin II, aldosterone, serum sodium concentration, heart rate, cardiac output, glomerular filtration rate, filtration fraction, renal blood flow, renal vascular resistance, extracellular fluid volume, and afferent arteriolar resistance. An increase (or decrease) in the long-term post-treatment dynamics of a variable was considered achieved if the corresponding change in value exceeded 5%. At the same time, if the change was less than 10%, we regarded it as insignificant. Thus, the range of changes in dynamics from 5 to 10% was taken as a transitional range due to the variability of possible changes in population variables. Virtual patients with the appropriate response (186 subjects out of 250, or 74%, “Patients included in analysis” in Table 3) were selected for further analysis. Figure 4 shows the distribution of the main parameters in this population. Distribution plots for more parameters are available in the Jupyter document on the web-version of BioUML (see the Availability section).
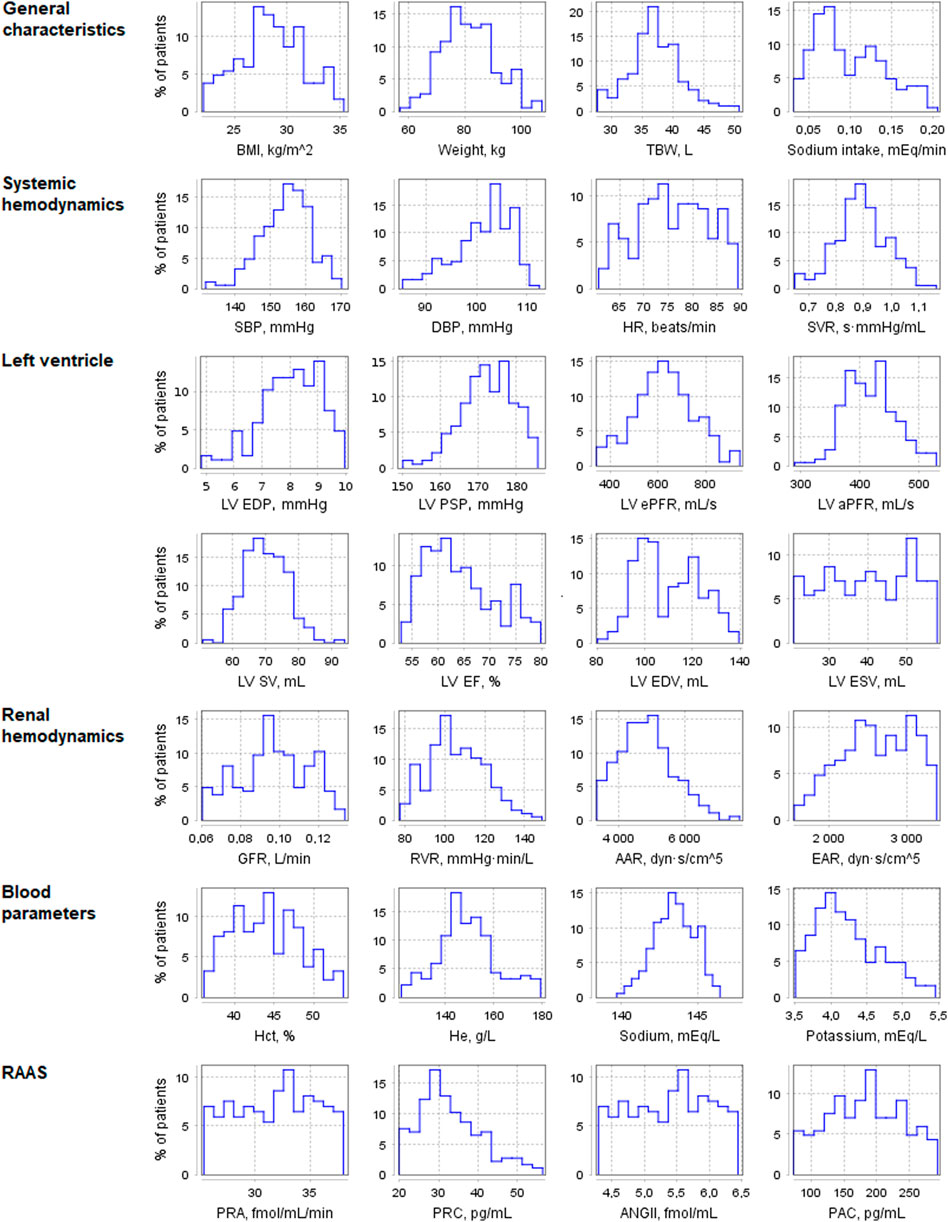
FIGURE 4. Distribution of physiological parameters in the virtual population (n = 186). Designations in the figure: AAR, afferent arteriolar resistance; ANGII, angiotensin II concentration; BMI, body mass index; DBP, diastolic blood pressure; EAR, efferent arteriolar resistance; GFR, glomerular filtration rate; Hct, hematocrit; He, hemoglobin; HR, heart rate; LV, left ventricular; LV aPFR, LV active peak filling rate; LV EF, LV ejection fraction; LV ePFR, LV early peak filling rate; LV EDP, LV end-diastolic pressure; LV EDV, LV end-diastolic volume; LV ESV, LV end-systolic volume; LV PSP, LV peak systolic pressure; LV SV, LV stroke volume; PAC, plasma aldosterone concentration; PRA, plasma renin activity; PRC, plasma renin concentration; RVR, renal vascular resistance; SBP, systolic blood pressure; SVR, systemic vascular resistance; TBW, total body water.
3.3 Testing the simulation of antihypertensive monotherapy
The results of the comparison of the simulated changes in systolic and diastolic blood pressure with experimental measurements are shown in Figure 5. As can be seen from these data, the model accurately reproduces the reduction in blood pressure for all drugs. Numerical data related to Figure 5 and the Jupyter histogram visualization can be found in the web-version of BioUML (see the Availability section).
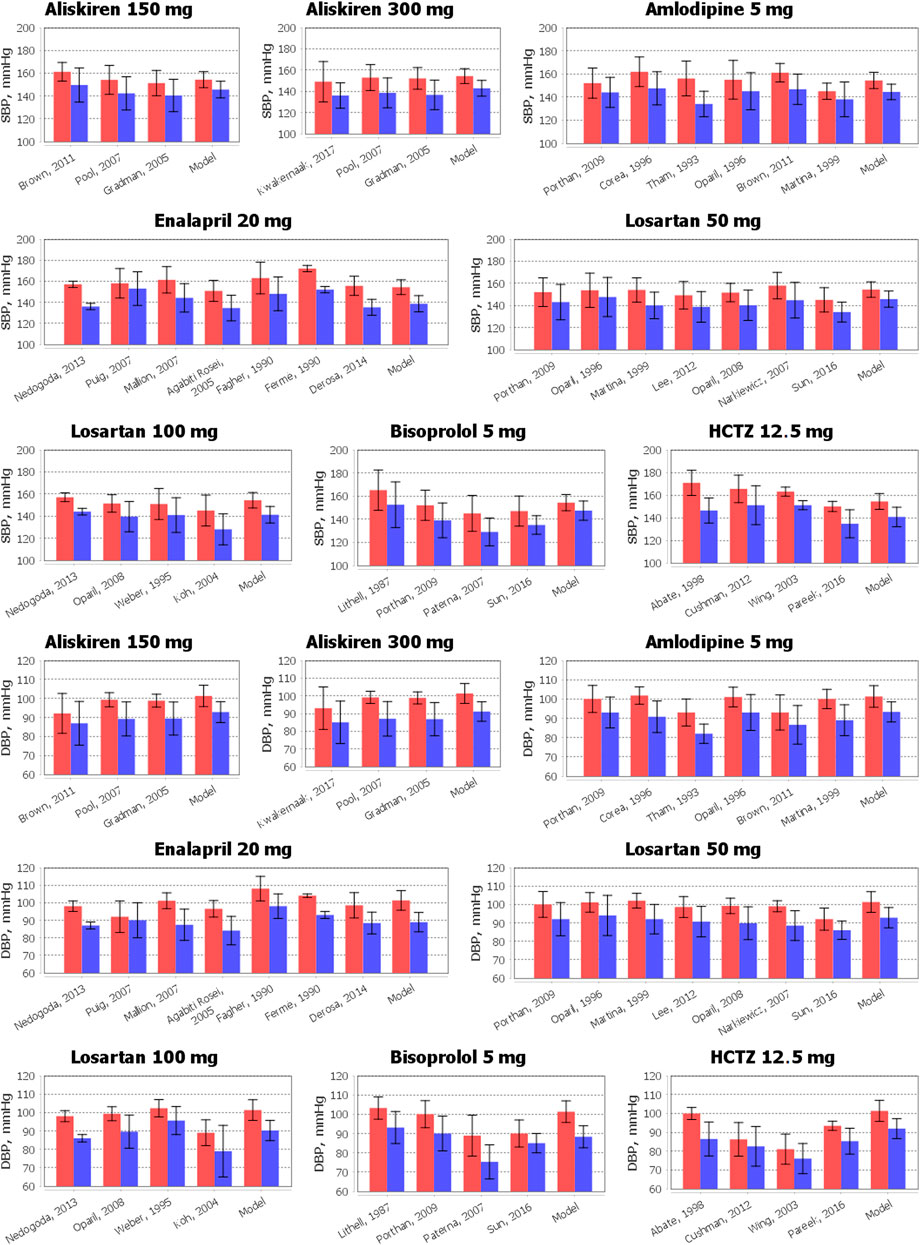
FIGURE 5. Comparison of simulated reduction in systolic blood pressure (SBP) and diastolic blood pressure (DBP) with clinical measurements obtained for aliskiren 150 or 300 mg, amlodipine 5 mg, bisoprolol 5 mg, enalapril 20 mg, HCTZ 12.5 mg, and losartan 50 or 100 mg. The data are presented as mean ± SD. The red bars denote the baseline data. The blue bars correspond to the values after therapy. To simplify the figure, we left in the references only the first author and the year of the relevant research.
3.4 Applications of the model
In our basic study (Kutumova et al., 2021), we showed the model’s ability to simulate both healthy subjects and patients with cardiovascular pathologies, including systemic arterial hypertension, heart failure, pulmonary hypertension, etc. In the current work, we introduce the algorithm for generating virtual populations. The integration of these capabilities allows the creation of virtual populations with various combinations of cardiovascular diseases and the design of in silico experiments depending on the purpose of the investigation. A common problem in drug research is comparing the effects of different medicines and doses in different categories of patients. Below we provide two examples of such a comparison for mono- and combination therapies performed in the virtual population described in the previous section. All graphs given in the examples were implemented as Jupyter documents in BioUML (see the Availability section for details).
3.4.1 Analysis of simulation results for antihypertensive monotherapy
Different mechanisms of action and pharmacological properties of drugs lead to different responses of physiological quantities to treatment. Generally, clinical studies evaluate the effect of antihypertensive medications on renal hemodynamics and RAAS activity. Therefore, we analysed the model-predicted change in the corresponding parameters in the population of virtual patients (n = 186). Figures 6, 7, as well as Supplementary Table S5, summarize the data simulated for the virtual population at baseline and after 4 weeks of treatment with aliskiren, amlodipine, bisoprolol, enalapril, HCTZ, and losartan. Below we provide a brief description of the experimental facts, which are consistent with the obtained simulation results.
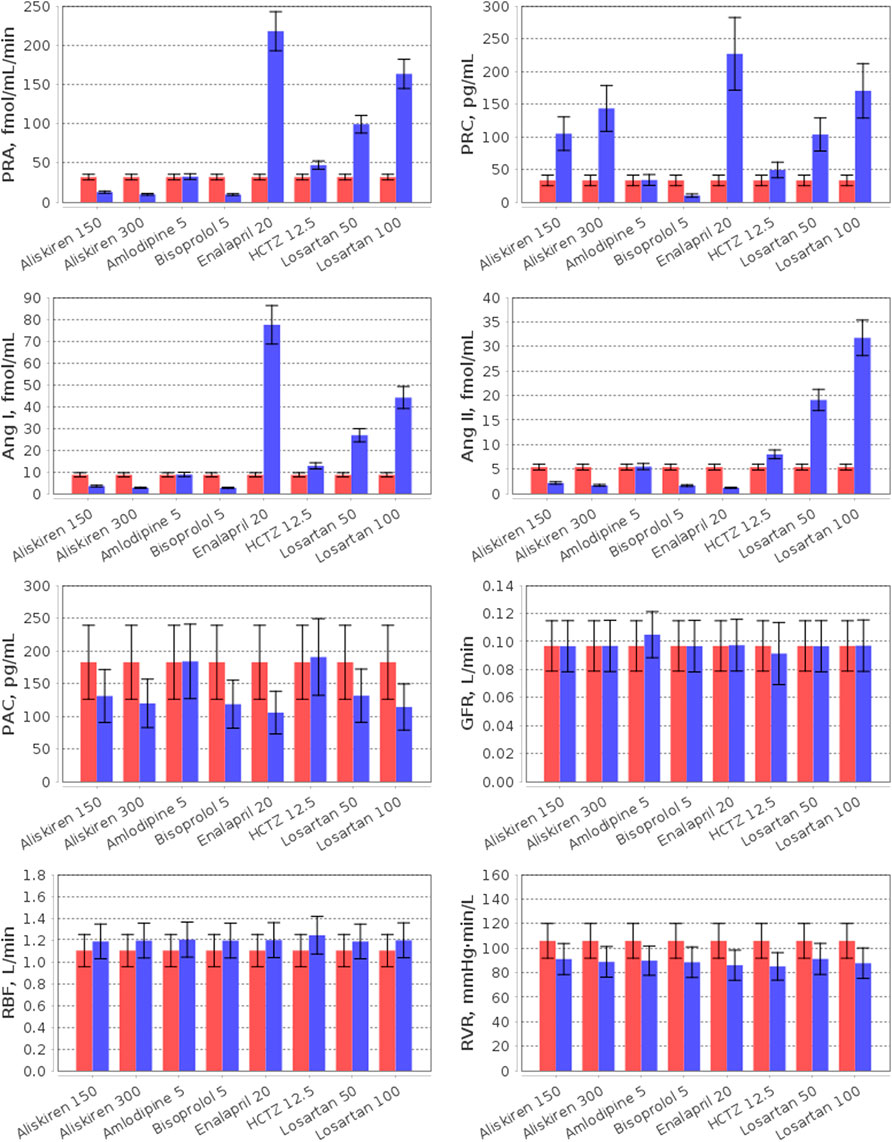
FIGURE 6. Simulation of plasma RAAS parameters (PRA, plasma renin activity; PRC, plasma renin concentration; Ang I, angiotensin I; Ang II, angiotensin II; PAC, plasma aldosterone concentration) and renal hemodynamic parameters (GFR, glomerular filtration rate; RBF, renal blood flow; RVR, renal vascular resistance) in the virtual hypertensive population at baseline (red) and after 4 weeks of treatment (blue) with aliskiren (150 or 300 mg), amlodipine (5 mg), bisoprolol (5 mg), enalapril (20 mg), HCTZ (12.5 mg), and losartan (50 or 100 mg). The data are given as mean ± SD.
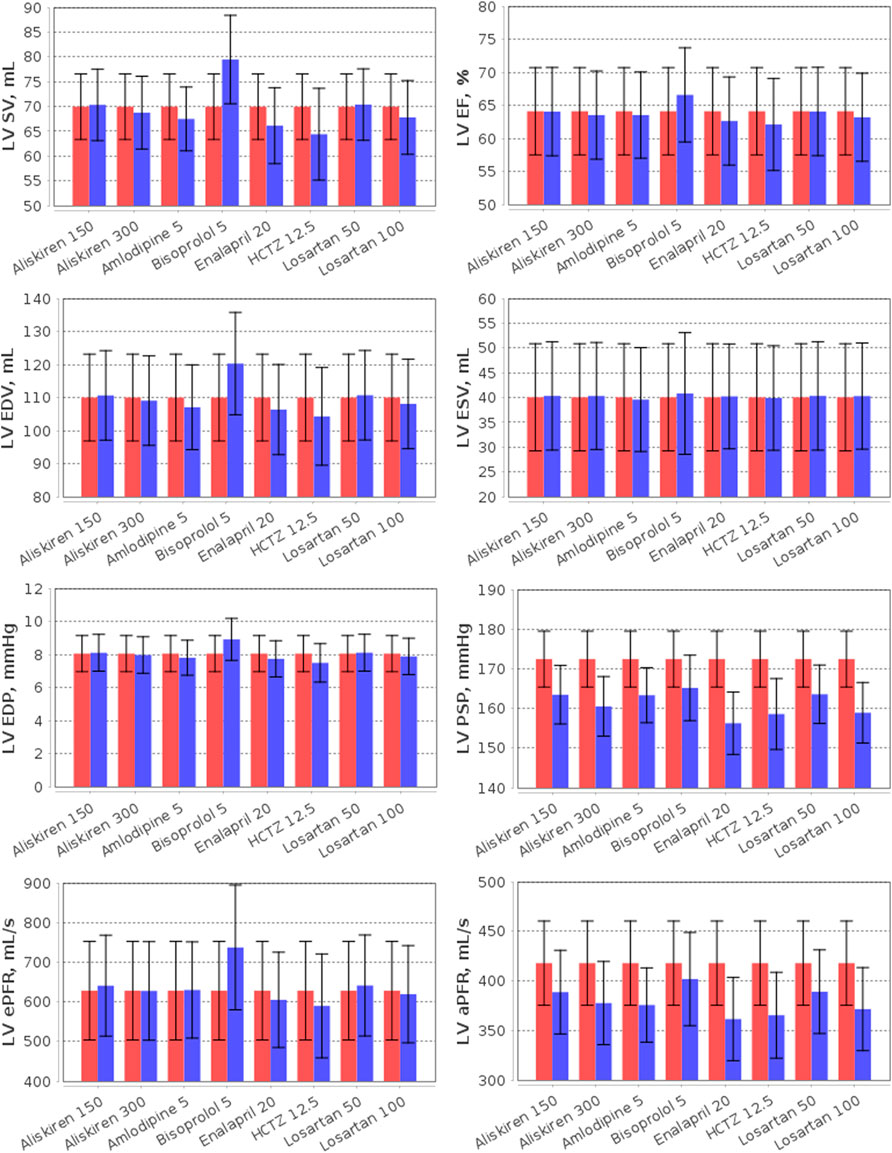
FIGURE 7. Simulation of the left ventricular (LV) parameters (LV SV, LV stroke volume; LV EF, LV ejection fraction; LV EDP, LV end-diastolic pressure; LV PSP, LV peak systolic pressure; LV EDV, LV end-diastolic volume; LV ESV, LV end-systolic volume; LV ePFR, LV early peak filling rate; LV aPFR, LV active peak filling rate) in the virtual hypertensive population at baseline (red) and after 4 weeks of treatment (blue) with aliskiren (150 or 300 mg), amlodipine (5 mg), bisoprolol (5 mg), enalapril (20 mg), HCTZ (12.5 mg), and losartan (50 or 100 mg). The data are given as mean ± SD.
The effect of RAAS inhibitors on the particular components of the system is determined by the target points of each specific drug. Aliskiren is a highly potent and selective inhibitor of human renin (Wood et al., 2003). Unlike angiotensin-converting enzyme inhibitors (such as enalapril) and angiotensin receptor blockers (such as losartan), it provides suppression of the renin system without inducing a reactive rise in plasma renin activity (PRA) (Villamil et al., 2007). Instead, aliskiren monotherapy leads to a dose-dependent decrease in PRA and an increase in plasma renin concentration (PRC) (Stanton et al., 2003; Villamil et al., 2007; Kwakernaak et al., 2017; Persson et al., 2009; Bokuda et al., 2018) with a significant reduction in the levels of angiotensin I and II (Persson et al., 2009; Cherney et al., 2012). In contrast to aliskiren, enalapril increases PRA and angiotensin I (Wiggins and Kelly, 2009), while angiotensin receptor blockers simultaneously raise PRA, PRC, angiotensin I and II (McInnes, 2007; Campbell, 2009). In our example, all RAAS inhibitors reduced plasma aldosterone concentration, as in the range of clinical studies (Bokuda et al., 2018; Nussberger et al., 2002; Fagher et al., 1990; González-Abraldes et al., 2001).
Consider the influence of other antihypertensive agents on the RAAS. The calcium antagonist amlodipine has no effect on the RAAS parameters (Licata et al., 1993; Higashi et al., 1998; Bokuda et al., 2018), whereas β-blockers (such as bisoprolol) suppress renal renin secretion (Laragh and Sealey, 2011) and reduce PRA, PRC, angiotensin I/II, and aldosterone concentrations (Savvatis, et al., 2010; Campbell, 2009; Chao et al., 2013). Thiazide diuretics (such as HCTZ) induce RAAS activation (Tamargo et al., 2014) and, as a result, increase PRA, PRC, and angiotensin I (Savvatis, et al., 2010). In addition, angiotensin II and aldosterone levels can rise (Lijnen et al., 1981; Savvatis, et al., 2010) or do not change significantly (Roman et al., 1998; Morales et al., 2015) with HCTZ.
In this example, all drugs reduced renal vascular resistance and slightly increased renal blood flow from baseline. The similar results were found in clinical trials of these medicines, where renal vascular resistance decreased, and renal blood flow raised or had no statistically significant changes (Kwakernaak et al., 2017; Licata et al., 1993; Higashi et al., 1998; Reams et al., 1987; Leeman et al., 1993; Bauer, 1984; Simon et al., 1983; Scaglione et al., 1992; Scaglione et al., 1995; van Brummelen et al., 1979; Paterna et al., 2000; Buter et al., 2001).
As shown in Figure 6, the normal value of the glomerular filtration rate did not change with aliskiren, bisoprolol, enalapril, HCTZ, and losartan, but slightly increased (within the normal range) with amlodipine, which is also consistent with the experimental data (Kwakernaak et al., 2017; Bokuda et al., 2018; Siddiqi et al., 2011; Cherney et al., 2012; Delles et al., 2003; Paterna et al., 2007; Leeman et al., 1993; Bauer, 1984; Scaglione et al., 1992; Scaglione et al., 1995; van Brummelen et al., 1979; Houlihan et al., 2002; Paterna et al., 2000; Buter et al., 2001).
Note that modelling the effect of antihypertensive drugs on renal hemodynamic parameters has already been considered in the works by (Hallow et al., 2014; Hallow and Gebremichael, 2017; Gebremichael et al., 2019; Hallow et al., 2020; Hallow et al., 2021). Therefore, our efforts in this area are not new. However, our model is an extension of the renal model by Hallow et al. (2014) and includes detailed modelling of cardiovascular hemodynamics (Proshin and Solodyannikov, 2006). In addition, we take a thorough approach to the process of generating virtual patients, imposing a large number of physiological constraints and checks on the model parameterization. All this allows us to accurately analyse the effect of antihypertensive drugs on cardiovascular parameters. For example, we consider here the effect of monotherapy on the LV parameters (Figure 7).
As can be seen from Figure 7, aliskiren did not affect LV SV, EDV and ESV, which is consistent with clinical trials (Solomon et al., 2011; Okada et al., 2017). In our case, EF also did not change in treatment with aliskiren, in accordance with a number of experimental studies (McMurray et al., 2008; Solomon et al., 2011; Pitt et al., 2011). However, Okada et al. (2017) reported that EF increased after aliskiren 150–300 mg (from 73.4 ± 5.1 to 74.7 ± 5.2 percent) in elderly hypertensive patients. Similarly, no significant changes in LV SV, EF, EDV and ESV were observed for losartan (Parrinello et al., 2009; Berezin, 2001; Yamamoto et al., 2011; Little et al., 2006), amlodipine (Picca et al., 1997; Yamamoto et al., 2011; Tham et al., 1993), and enalapril (Picca et al., 1997). Nevertheless, it should be noted that in hypertensive patients with LV hypertrophy, LV EDV and ESV may decrease significantly during long-term treatment with aliskiren 300 mg or losartan 100 mg (Solomon et al., 2009). The model predicts an increase in SV with bisoprolol, which is associated with an increase in LV EDV in accordance with the Frank-Starling law (see the Materials and methods section), while LV ESV does not change. Such dynamics is typical for normotensive (Palmieri et al., 2004) or hypertensive (the simulated case) (Serg et al., 2014; Suojanen et al., 2017) patients without heart disease. However, in patients with heart failure treated with bisoprolol, a decrease in LV EDV and ESV may be observed with an almost unchanged SV (which is also consistent with the Frank-Starling law, Figure 2A) (Dubach et al., 2002; Lee et al., 2016). Bisoprolol improves LV EF in patients with reduced values of the parameter (Dubach et al., 2002; Lee et al., 2016), and slightly increases (the simulated case) (van Campen et al., 2016) or does not change LV EF (Parrinello et al., 2009; Paterna et al., 2007) in patients with preserved LV EF. Figure 7 shows that HCTZ, on the contrary, reduced LV SV and EDV. The reason for this dynamic is that diuretics, by virtue of fluid loss, reduce preload and intravascular pressure, which decreases ventricular SV by the Frank-Starling mechanism (Oyama, 2015). Thus, van Brummelen et al. (1980) revealed a decrease in SV after 1 week of treatment with HCTZ 100 mg daily. According to clinical studies, HCTZ does not cause clinically significant changes in LV EF (Dey et al., 1996; Little et al., 2006).
In hypertensive patients, LV peak systolic pressure may differ significantly from SBP (e.g., Burak et al., (2019) reported 162 ± 30 vs. 135 ± 14 mmHg in patients receiving antihypertensive therapy). In the generated population of untreated hypertensives, we observed 172.4 ± 7.0 vs. 154.3 ± 7.0 mmHg for these parameters, respectively. All drugs in our test case (Figure 7) led to a decrease in LV peak systolic pressure, which is directly associated with SBP reduction during antihypertensive treatment (Stefanadis et al., 2001). At the same time, LV end-diastolic pressure had no significant changes, remaining in the normal range 3–12 mmHg (Pagani et al., 1988). Another important parameter that can be used to assess LV diastolic function is the filling rate, which is characterized by two peaks corresponding to E and A mitral inflow waves in Doppler echocardiography (Caudron et al., 2011; Zhang et al., 2019). In normal subjects, the LV inflow is greatest immediately after opening of the mitral valve (early peak velocity, E), while the left atrial contraction is responsible for smaller inflow (active peak velocity, A) (Caudron et al., 2011). In patients with arterial hypertension, the E/A ratio is lower than in healthy individuals due to a larger A peak or, in addition, a smaller E peak (Mureddu et al., 1997; de Simone et al., 2000; Tsai et al., 2012; Wu et al., 2022). The model predicts a decrease in the active peak filling rate for all drugs, whereas the early peak filling rate remains almost the same for all drugs, with the exception of bisoprolol, which increases this rate. This behaviour is consistent with the dynamics found for peak filling velocities in a number of experimental studies for amlodipine (Ogunyankin and Day, 2009), bisoprolol (de Teresa et al., 1994), HCTZ (Ogunyankin and Day, 2009; Little et al., 2006), and losartan (Little et al., 2006). However, it should be noted that other dynamics may be observed in patients with comorbidities. Thus, in patients with symptomatic heart failure, treatment with aliskiren led to a decrease in the E peak, while the A peak had no statistically significant changes (McMurray et al., 2008). In hypertensive patients with overweight and obesity, aliskiren, on the contrary, increased the E peak without changing the A peak (De Rosa et al., 2014). In elderly hypertensive patients, aliskiren did not change either the E peak or the A peak, while HCTZ decreased the E peak and did not change the A peak (Okada et al., 2017).
3.4.2 Analysis of simulation results for combination antihypertensive therapy
Calibration of the model using data for individual drugs provides the capability to estimate the response to combinations of these drugs (Hallow et al., 2014; Gebremichael et al., 2019). As an example, we considered dual combinations of RAAS blockers with non-RAAS agents. The reasonable changes in blood pressure and heart rate predicted by the model in such cases are given in Figure 8 and Table 4, the Jupyter implementation of which is provided in the web-version of BioUML (see the Availability section). As can be seen from these data, all drugs caused a statistically significant (p < 0.0001, Kolmogorov-Smirnov test) decrease in SBP and DBP and had different effects on HR. For example, a statistically significant decrease in HR was observed only with bisoprolol monotherapy, while the combination of this drug with RAAS blockers prevented it. In addition, there was a small but significant increase in HR (average of 4 beats per minute) with amlodipine monotherapy, which was maintained in combination with aliskiren 300 mg, enalapril 20 mg, or losartan 100 mg. HCTZ-based regimens also demonstrated a statistically significant increase in HR when co-administered with aliskiren 150–300 mg, enalapril 20 mg, or losartan 100 mg.
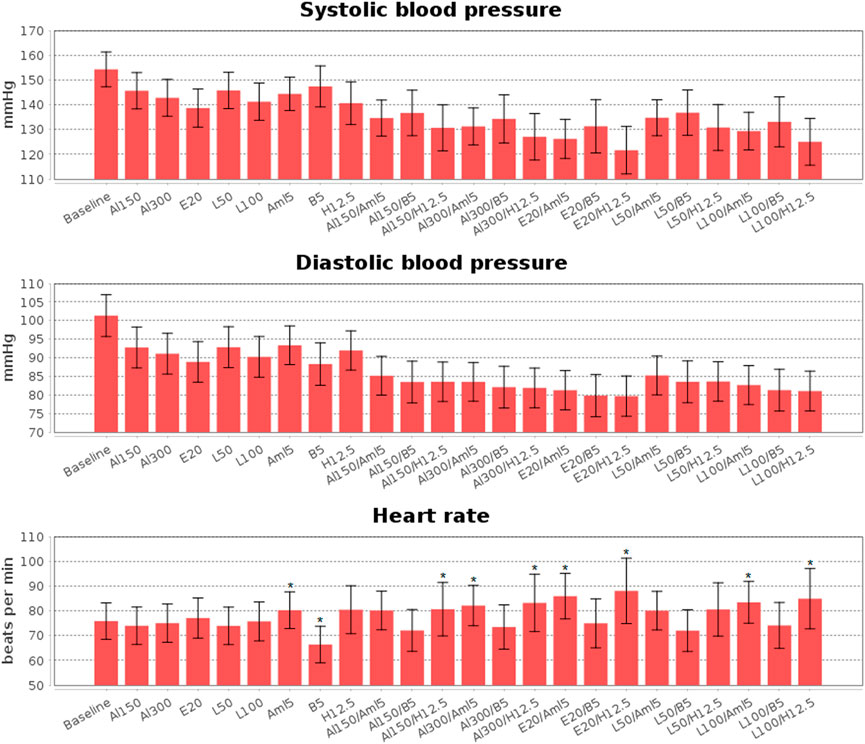
FIGURE 8. Simulated changes in systolic and diastolic blood pressure and heart rate obtained for aliskiren 150 mg (Al150), aliskiren 300 mg (Al300), enalapril 20 mg (E20), losartan 100 mg (L100), losartan 50 mg (L50), amlodipine 5 mg (Aml5), bisoprolol 5 mg (B5), hydrochlorothiazide 12.5 mg (H12.5), and combinations of one RAAS inhibitor with one drug from other antihypertensive classes. All drugs give a statistically significant (p < 0.0001, Kolmogorov-Smirnov test) decrease in blood pressure, while statistically significant changes in heart rate are marked with “*”. The data are presented as mean ± SD.
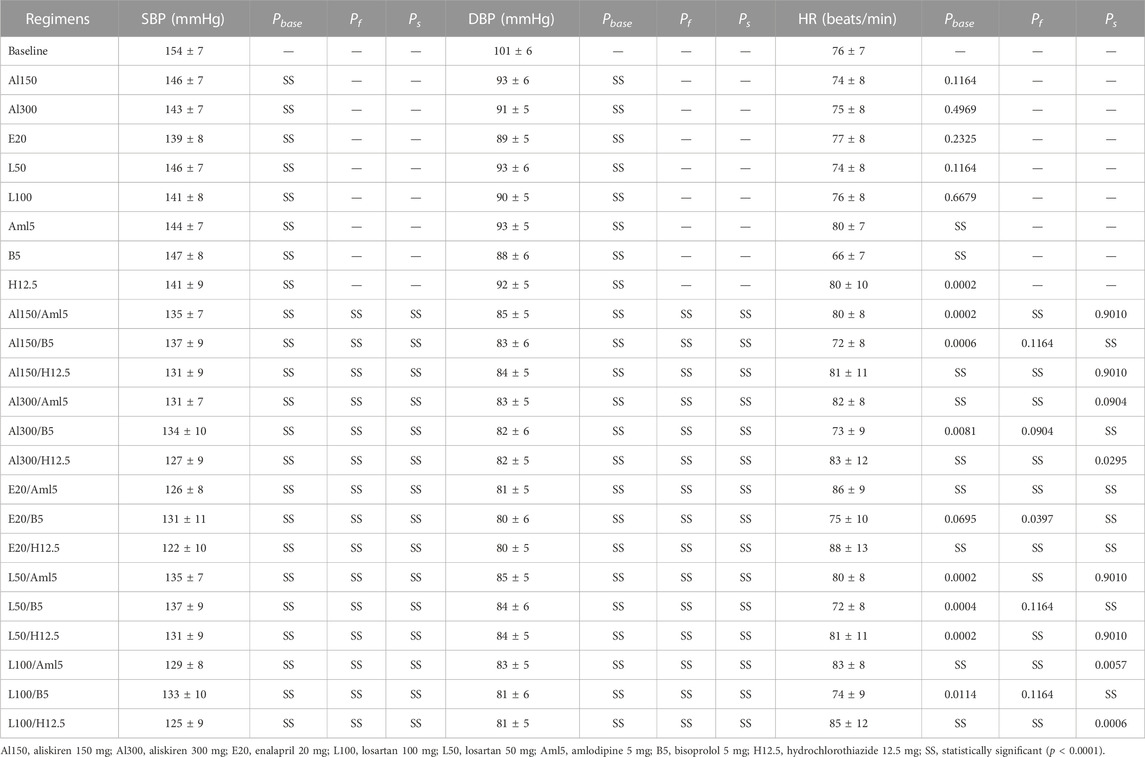
TABLE 4. Simulated changes (mean ± SD) in systolic blood pressure (SBP), diastolic blood pressure (DBP) and heart rate (HR) with estimated p-values (Kolmogorov-Smirnov test) for treatment effects vs. baseline (Pbase) and combined treatment effects vs. the first (Pf) and second (Ps) drugs in combinations.
Simulation results of 4-week treatment with aliskiren (150 and 300 mg), losartan (50 and 100 mg), enalapril (20 mg), and their dual combinations with amlodipine (5 mg), bisoprolol (5 mg), and HCTZ (12.5 mg) are given in Supplementary Tables S6–S8, respectively. In addition, Supplementary Tables S9, S10 include Pearson correlation coefficients between physiological parameters of the population and simulated reduction in SBP and DBP. We list several conclusions that can be drawn from these correlation tables.
Body mass index: RAAS agents, as well as their combinations with bisoprolol and amlodipine, demonstrate a weak negative correlation between a decrease in SBP/DBP and BMI. The correlation coefficient for DBP is in most cases lower in absolute value. In addition, with mono- or combination therapy with HCTZ, such a correlation disappears. Therefore, the model confirms that diuretic-based regimens seem to be a reasonable choice in obese patients (Weber et al., 2013). Note that the meta-analysis by Zhang et al. (2014) revealed a similar dependency for SBP: among three groups of patients taking antihypertensive therapy with the same baseline SBP, an overweight group showed a greater reduction in SBP than an obesity group, but a smaller reduction than a normal-weight group. However, both the overweight group and the obesity group had a larger DBP reduction than the normal group, while no significant difference was found between the overweight and obesity groups.
Sodium intake: HCTZ-based regimens give a weak positive correlation of SBP/DBP reduction with sodium intake. This result finds experimental confirmation. Thus, van Brummelen et al. (1978) found that sodium restriction led to a smaller decrease in blood pressure during HCTZ than a normal sodium diet. Similar results were obtained for the combination of losartan and HCTZ at low and high sodium intake (Vogt et al., 2008). These findings, in line with van Brummelen’s study (1978), call into question the therapeutic value of a low-sodium diet in hypertensive patients receiving thiazide diuretics.
Baseline SBP and DBP: The model predicts correlation between initial blood pressure and response to antihypertensive treatment. For example, the reduction in SBP and DBP after simulated treatment with amlodipine was positively correlated with baseline SBP and DBP, respectively. The same relationship was clinically observed for both amlodipine (Kario and Shimada, 1997) and another calcium antagonist, nifedipine (Hu et al., 2017). A number of experimental studies showed a similar trend towards a greater decrease in SBP and DBP among patients with higher baseline SBP and DBP levels when using other antihypertensive regimens, including therapy with losartan (Naritomi et al., 2008), enalapril or sacubitril/valsartan (Böhm et al., 2017), amlodipine/losartan (Unniachan et al., 2014), and aliskiren or aliskiren/HCTZ (Black et al., 2010). On the other hand, Zheng et al. (2011) found a negative correlation of DBP reduction with baseline DBP (while there was no correlation for SBP) in both candesartan and losartan treatment groups. In our case, we observed positive correlation coefficients in the range of 0.14–0.60 for DBP and all drug regimens, excluding bisoprolol monotherapy (with an insignificant coefficient of 0.05). At the same time, the corresponding coefficients for SBP were insignificant (less than 0.1 in absolute value) for almost all treatment schemes, whereas a negative correlation was found for bisoprolol.
Systemic arterial tone: Sustained increases in arterial tone are an essential component in the development of hypertension (Amberg et al., 2003). All drugs in our example demonstrated positive correlations of this parameter with the fall in SBP.
Systemic arterial elasticity: Strictly speaking, the term “Elasticity” is analogous to stiffness. The measures of arterial elasticity used regularly (i.e., incremental Young’s modulus, Peterson’s modulus, pulse wave velocity, and characteristic impedance) all increase with rise in stiffness and decrease with its fall. Arterial stiffening is the principal cause of increasing systolic pressure with advancing years and in patients with arterial hypertension (O’Rourke, 1990). The model showed positive correlations of arterial elasticity with SBP reduction for amlodipine- and enalapril-based regimens. This result is directly related to the fact that vasodilator agents (such as calcium antagonists and angiotensin converting enzyme inhibitors) can dilate medium-sized (brachial and carotid) arteries and at the same time reduce their stiffness (O’Rourke, 1990; Dudenbostel and Glasser, 2012; Nedogoda et al., 2017).
LV filling and ejection: As can be seen from Supplementary Table S9, RAAS agents and their combinations with bisoprolol demonstrated a negative correlation between LV active peak filling rate and SBP response. The addition of amlodipine or HCTZ to therapy reduced the absolute values of the correlation coefficients in this case. In addition, amlodipine-based regimens had a positive correlation between LV peak ejection rate (aortic valve peak flow) and decrease in SBP. We could not find confirmation of these facts in the literature. Thus, this prediction needs to be verified experimentally.
Renal hemodynamics: The response to treatment for all antihypertensive drugs showed a significant dependence on the parameters of the renal system. In particular, baseline GFR is positively correlated with reductions in SBP and DBP (with Pearson coefficients in the range of 0.19–0.47) for all regimens without HCTZ, for which correlation coefficients are negligible. The similar results were observed by Black et al. (2010) in the clinical trial of aliskiren and aliskiren/HCTZ: aliskiren produced a smaller reduction in SBP in the group of patients with reduced estimated GFR (<60 ml/min/1.73 m2) than in the group of patients with normal estimated GFR, and the difference between these reductions was significantly higher than provided by aliskiren/HCTZ (7.9 vs. 4.2 mmHg). All treatment regimens (excluding monotherapy with amlodipine and HCTZ) showed a high correlation (with coefficients of 0.42–0.66) between the afferent arteriole diameter and SBP response. For HCTZ alone, the correlation coefficient was lower (0.29), while for amlodipine alone it was insignificant (0.07). In addition, HCTZ-based regimens had a high negative correlation between fractional proximal sodium reabsorption and SBP/DBP reduction (with coefficients from −0.79 to −0.65 for SBP and coefficients from −0.67 to −0.45 for DBP). This result is due to the fact that less sodium is delivered to the distal tubules and, therefore, the thiazide diuretic effect is less pronounced.
RAAS parameters: The model predicted a high positive correlation between baseline PRA and DBP reduction for RAAS-acting medicines. At the same time, the use of amlodipine and HCTZ in combination with these drugs decreased the absolute values of the correlation coefficients. Interestingly, the correlation coefficients between PRA and SBP reduction with RAAS agents alone turned out to be insignificant. These results are consistent with the study by Ikeda et al. (1997), which showed a statistically significant correlation between PRA and reduction in peak and trough DBP in patients with essential hypertension treated with losartan, and the study by Nussberger et al. (2007), who found no significant correlations between PRA and SBP response in patients with mild-to-moderate hypertension receiving aliskiren or irbesartan. In addition, we found a number of studies demonstrating positive correlation between pre-treatment PRA and the fall in mean arterial pressure for different antihypertensive drugs, including enalapril (Fouad et al., 1984), captopril (Nakano et al., 1997), and olmesartan (Ono et al., 2012). Our model satisfies these data, since mean arterial pressure reduction shows similar correlations with PRA as for DBP (Supplementary Table S11).
3.5 Limitations of the study
The main limitation of the work is related to the generation of a virtual population. We consider a large number of constraints imposed on the parameters and variables of the model (Supplementary Tables S1, S2). But this is not enough to cut off all virtual patients with unrealistic dynamics. As a solution to the constraint optimization problem, we can obtain a parameterization of the model that demonstrates an excessive increase in systolic blood pressure (more than 25 mmHg) with an increase in sodium intake to a value of 0.243 mEq/min, or parameterization that leads to incorrect model dynamics when simulating antihypertensive therapy (for example, an increase in heart rate during treatment with bisoprolol). In the current work, we removed such parameterizations with additional checks. However, their isolation at the optimization stage could significantly speed up the process of generating virtual patients. One of the ways to solve this problem is to look for correlations between the domain (and/or range) of the model and the resulting dynamics of control variables in response to external stimuli (a sharp increase in sodium intake, activation of one of the antihypertensive treatment regimens, etc.). Adding appropriate constraints (determined from such correlations) to the optimization problem will result in valid virtual patients. However, the values of the correlation parameters must be close to unity, otherwise we risk losing some of the valid solutions. The second possible way to solve this problem is to introduce simulation experiments (test cases) into the optimization problem. In this case, each potential solution at all iterations of the optimization algorithm will be checked not only for the fulfillment of the established parametric constraints, but also for completion of test cases. This approach avoids the loss of solutions, as in the case of insufficiently high values of correlation parameters, but requires a change in the system implementation of optimization algorithms in BioUML.
Another limitation of the study is the complexity of the considered model, which is directly related to the cost of resources and time and is reflected in the speed of generation of virtual patients. However, the constrained optimization algorithm used to obtain a single patient is easily parallelized, as is the process of creating a large population. Therefore, with the development of computing technologies and the emergence of more powerful servers with multi-core processors, this problem will become less acute. Low-dimensional models certainly have a number of benefits besides saving time and enhancing productivity. In particular, they are easier to understand and interpret. And in some cases, they reproduce experimental data and make reasonable predictions just as well as more complex models (Kutumova et al., 2013). Therefore, simple mechanistic models are still useful and relevant for solving applied problems related to the study of pathological conditions of human physiology. However, the main disadvantage of simple models is the loss of biological information. Thence, we believe that over time, physiological models will continue to evolve towards greater complexity and closer to reality.
4 Conclusion
People differ in their genomes, environments, behaviours, and disease histories—all of these differences lead to variations in response to a particular medical treatment. Thus, true personalization of drug therapies should rely on “virtual patient” models implemented at the level of abstraction required for a specific pathology (Lehrach, 2016). Here we present a technology for constructing a virtual patient and an algorithm for generating a virtual population with varying values of the necessary parameters. This technology is based on the previously developed agent-based modular model of the cardiovascular and renal systems (Kutumova et al., 2021) and can be used to optimize the choice of drug therapy for cardiovascular diseases. As an example, we considered approaches to the treatment of arterial hypertension using different pharmacological effects of medicines, including angiotensin II receptor blockade (losartan), calcium channel blockade (amlodipine), angiotensin-converting enzyme inhibition (enalapril), direct renin inhibition (aliskiren), the action of thiazide diuretics (hydrochlorothiazide), and β-blockade (bisoprolol). For all of these drugs, we determined target points in the model and developed pharmacodynamic functions of their effects. To calibrate therapy parameters, we used data from clinical trials found in the scientific literature. We then tested the resulting model on a population of virtual patients with uncomplicated arterial hypertension and made sure that it reasonably reproduces the dynamics after treatment in accordance with clinical observations.
4.1 What is next?
We consider each parameterization of the model in an equilibrium state and within physiological ranges as a virtual patient. To relate this concept to a real patient, we can adjust the model parameters so that the equilibrium dynamics reproduces laboratory measurements of desired physiological characteristics (obtained from blood pressure monitoring, electrocardiography, echocardiography, blood tests, etc.). However, these data give only a small part of the model quantities. To control the unknown parameters and variables, we can move from a single virtual patient to a virtual population and take into account significant variation in model values. Treatment simulation of such a population allows it to be divided into groups with a similar response to drugs. Thus, we can find out which patient characteristics contribute to the effectiveness (or failure) of antihypertensive therapy. Linking the model to real patients is the main direction of our future work.
Data availability statement
The datasets presented in this study can be found in online repositories. The names of the repository/repositories and accession number(s) can be found below: https://gitlab.sirius-web.org/virtual-patient/antihypertensive-treatment-modeling.
Author contributions
Designed pharmacodynamic functions for the antihypertensive agents: EK and IK. Validated pharmacodynamic parameters based on clinical data from the scientific literature, performed all data analyses in the study: EK. Implemented the necessary tools in the BioUML software: IK (agent-based and modular modeling, simulation tools), EK (optimization tools). Consulted on physiological issues: RS. Consulted on issues of hypertension and antihypertensive therapy: GL. Coordinated the medical part of the study: GL. Coordinated the computational part of the study: FK. Wrote the paper: EK, IK, RS, GL, and FK.
Funding
This study was supported by the Sirius University, project CMB-RND-2123.
Conflict of interest
Authors EK, IK, RS, and FK were employed by Biosoft.Ru, Ltd.
The remaining author declares that the research was conducted in the absence of any commercial or financial relationships that could be construed as a potential conflict of interest.
Publisher’s note
All claims expressed in this article are solely those of the authors and do not necessarily represent those of their affiliated organizations, or those of the publisher, the editors and the reviewers. Any product that may be evaluated in this article, or claim that may be made by its manufacturer, is not guaranteed or endorsed by the publisher.
Supplementary material
The Supplementary Material for this article can be found online at: https://www.frontiersin.org/articles/10.3389/fphys.2022.1070115/full#supplementary-material
Footnotes
1https://www.ebi.ac.uk/biomodels/MODEL2202160001.
References
Abate G., Zito M., Carbonin P. U., Cocchi A., Cucinotta D., Manopulo R., et al. (1998). Pinacidil and hydrochlorothiazide alone or in combination in the treatment of hypertension in the elderly. Curr. Ther. Res. 59 (1), 62–71. doi:10.1016/s0011-393x(98)85025-x
Agabiti Rosei E., Morelli P., Rizzoni D. (2005). Effects of nifedipine GITS 20 mg or enalapril 20 mg on blood pressure and inflammatory markers in patients with mild-moderate hypertension. Blood Press. Suppl. 1, 14–22. doi:10.1080/08037050510034257
Allen A. M., Zhuo J., Mendelsohn F. A. (2000). Localization and function of angiotensin AT1 receptors. Am. J. Hypertens. 13 (1), 31S–38S. doi:10.1016/s0895-7061(99)00249-6
Allen R. J., Rieger T. R., Musante C. J. (2016). Efficient generation and selection of virtual populations in quantitative systems pharmacology models. CPT. Pharmacometrics Syst. Pharmacol. 5 (3), 140–146. doi:10.1002/psp4.12063
Alwi I. (2010). Diagnosis and management of cardiogenic pulmonary edema. Acta Med. Indones. 42 (3), 176–184.
Amberg G. C., Bonev A. D., Rossow C. F., Nelson M. T., Santana L. F. (2003). Modulation of the molecular composition of large conductance, Ca(2+) activated K(+) channels in vascular smooth muscle during hypertension. J. Clin. Invest. 112 (5), 717–724. doi:10.1172/JCI18684
An G., Mi Q., Dutta-Moscato J., Vodovotz Y. (2009). Agent-based models in translational systems biology. Wiley Interdiscip. Rev. Syst. Biol. Med. 1 (2), 159–171. doi:10.1002/wsbm.45
Bauer J. H. (1984). Role of angiotensin converting enzyme inhibitors in essential and renal hypertension. Effects of captopril and enalapril on renin-angiotensin-aldosterone, renal function and hemodynamics, salt and water excretion, and body fluid composition. Am. J. Med. 77 (2A), 43–51. doi:10.1016/s0002-9343(84)80057-1
Berezin A. E. (2001). Losartan in the therapy of heart failure patients. Asian cardiovasc. Thorac. Ann. 9 (4), 302–307. doi:10.1177/021849230100900412
Black H. R., Kribben A., Palacios F. A., Bijarnia M., Laflamme A. K., Baschiera F. (2010). Aliskiren alone or in combination with hydrochlorothiazide in patients with the lower ranges of stage 2 hypertension: The ACQUIRE randomized double-blind study. J. Clin. Hypertens. 12 (12), 917–926. doi:10.1111/j.1751-7176.2010.00378.x
Böhm M., Young R., Jhund P. S., Solomon S. D., Gong J., Lefkowitz M. P., et al. (2017). Systolic blood pressure, cardiovascular outcomes and efficacy and safety of sacubitril/valsartan (LCZ696) in patients with chronic heart failure and reduced ejection fraction: Results from PARADIGM-HF. Eur. Heart J. 38 (15), 1132–1143. doi:10.1093/eurheartj/ehw570
Bokuda K., Morimoto S., Seki Y., Yatabe M., Watanabe D., Yatabe J., et al. (2018). Greater reductions in plasma aldosterone with aliskiren in hypertensive patients with higher soluble (Pro)renin receptor level. Hypertens. Res. 41 (6), 435–443. doi:10.1038/s41440-018-0037-1
Bonanni L., Dalla Vestra M. (2012). Oral renin inhibitors in clinical practice: A perspective review. Ther. Adv. Chronic Dis. 3 (4), 173–181. doi:10.1177/2040622312446244
Braunwald E., Fauci A. S., Kasper D. L., Hauser S. L., Longo D. L., Jameson J. L. (2001). Harrison's principles of internal medicine. 15th edition. New York: McGraw-Hill, 2629.
Braunwald E., Ross J., Sonnenblick E. H. (1967). Mechanisms of contraction of the normal and failing heart. N. Engl. J. Med. 277 (19), 1012–1022. doi:10.1056/NEJM196711092771907
Brown M. J., McInnes G. T., Papst C. C., Zhang J., MacDonald T. M. (2011). Aliskiren and the calcium channel blocker amlodipine combination as an initial treatment strategy for hypertension control (ACCELERATE): A randomised, parallel-group trial. Lancet 377 (9762), 312–320. doi:10.1016/S0140-6736(10)62003-X
Bruynseels K., Santoni de Sio F., van den Hoven J. (2018). Digital twins in health care: Ethical implications of an emerging engineering paradigm. Front. Genet. 9, 31. doi:10.3389/fgene.2018.00031
Burak C., Çağdaş M., Rencüzoğulları I., Karabağ Y., Artaç I., Yesin M., et al. (2019). Association of P wave peak time with left ventricular end-diastolic pressure in patients with hypertension. J. Clin. Hypertens. 21 (5), 608–615. doi:10.1111/jch.13530
Burkhoff D., Tyberg J. V. (1993). Why does pulmonary venous pressure rise after onset of LV dysfunction: A theoretical analysis. Am. J. Physiol. 265 (2), H1819–H1828. doi:10.1152/ajpheart.1993.265.5.H1819
Buter H., Navis G., Dullaart R. P., de Zeeuw D., de Jong P. E. (2001). Time course of the antiproteinuric and renal haemodynamic responses to losartan in microalbuminuric IDDM. Nephrol. Dial. Transpl. 16 (4), 771–775. doi:10.1093/ndt/16.4.771
Campbell D. J. (2009). Experimental and clinical pharmacology: Renin inhibitors - mechanisms of action. Aust. Prescr. 32, 132–135. doi:10.18773/austprescr.2009.064
Campbell N. R., Lackland D. T., Niebylski M. L. (2014). High blood pressure: Why prevention and control are urgent and important: A 2014 fact sheet from the world hypertension league and the international society of hypertension. J. Clin. Hypertens. 16 (8), 551–553. doi:10.1111/jch.12372
Carter B. L., Ernst M. E., Cohen J. D. (2004). Hydrochlorothiazide versus chlorthalidone: Evidence supporting their interchangeability. Hypertension 43 (1), 4–9. doi:10.1161/01.HYP.0000103632.19915.0E
Caudron J., Fares J., Bauer F., Dacher J. N. (2011). Evaluation of left ventricular diastolic function with cardiac MR imaging. Radiographics 31 (1), 239–259. doi:10.1148/rg.311105049
Chaliki H. P., Hurrell D. G., Nishimura R. A., Reinke R. A., Appleton C. P. (2002). Pulmonary venous pressure: Relationship to pulmonary artery, pulmonary wedge, and left atrial pressure in normal, lightly sedated dogs. Catheter. Cardiovasc. Interv. 56 (3), 432–438. doi:10.1002/ccd.10203
Chao C. T., Wu V. C., Kuo C. C., Lin Y. H., Chang C. C., Chueh S. J., et al. (2013). Diagnosis and management of primary aldosteronism: An updated review. Ann. Med. 45 (4), 375–383. doi:10.3109/07853890.2013.785234
Cheng Y., Thalhauser C. J., Smithline S., Pagidala J., Miladinov M., Vezina H. E., et al. (2017). QSP toolbox: Computational implementation of integrated workflow components for deploying multi-scale mechanistic models. AAPS J. 19 (4), 1002–1016. doi:10.1208/s12248-017-0100-x
Cherney D. Z., Scholey J. W., Jiang S., Har R., Lai V., Sochett E. B., et al. (2012). The effect of direct renin inhibition alone and in combination with ACE inhibition on endothelial function, arterial stiffness, and renal function in type 1 diabetes. Diabetes Care 35 (11), 2324–2330. doi:10.2337/dc12-0773
Corea L., Cardoni O., Fogari R., Innocenti P., Porcellati C., Provvidenza M., et al. (1996). Valsartan, a new angiotensin II antagonist for the treatment of essential hypertension: A comparative study of the efficacy and safety against amlodipine. Clin. Pharmacol. Ther. 60 (3), 341–346. doi:10.1016/S0009-9236(96)90061-2
Cumming G. R. (1975). Cardiac stroke volume: Effects of athletic training. J. Sports Med. 3 (1), 18–24. doi:10.1177/036354657500300104
Cushman W. C., Duprez D. A., Weintraub H. S., Purkayastha D., Zappe D., Samuel R., et al. (2012). Home and clinic blood pressure responses in elderly individuals with systolic hypertension. J. Am. Soc. Hypertens. 6 (3), 210–218. doi:10.1016/j.jash.2012.03.001
De Rosa M. L., Musella F., Ilardi F., D'Amore C., Luciano R., Maresca F. (2014). Effects of antihypertensive therapy on glucose, insulin metabolism, left ventricular diastolic dysfunction and renin system in overweight and obese hypertensives. J. Renin. Angiotensin. Aldosterone. Syst. 15 (2), 196–204. doi:10.1177/1470320312474053
de Simone G., Greco R., Mureddu G., Romano C., Guida R., Celentano A., et al. (2000). Relation of left ventricular diastolic properties to systolic function in arterial hypertension. Circulation 101 (2), 152–157. doi:10.1161/01.cir.101.2.152
de Teresa E., González M., Camacho-Vázquez C., Tabuenca M. J. (1994). Effects of bisoprolol on left ventricular hypertrophy in essential hypertension. Cardiovasc. Drugs Ther. 8 (6), 837–843. doi:10.1007/BF00877402
Delles C., Klingbeil A. U., Schneider M. P., Handrock R., Weidinger G., Schmieder R. E. (2003). Direct comparison of the effects of valsartan and amlodipine on renal hemodynamics in human essential hypertension. Am. J. Hypertens. 16 (12), 1030–1035. doi:10.1016/j.amjhyper.2003.07.017
Derendorf H., Meibohm B. (1999). Modeling of pharmacokinetic/pharmacodynamic (PK/PD) relationships: Concepts and perspectives. Pharm. Res. 16 (2), 176–185. doi:10.1023/a:1011907920641
Derosa G., Bonaventura A., Romano D., Bianchi L., Fogari E., D'Angelo A., et al. (2014). Effects of enalapril/lercanidipine combination on some emerging biomarkers in cardiovascular risk stratification in hypertensive patients. J. Clin. Pharm. Ther. 39 (3), 277–285. doi:10.1111/jcpt.12139
Devineni D., Vaccaro N., Polidori D., Rusch S., Wajs E. (2014). Effects of hydrochlorothiazide on the pharmacokinetics, pharmacodynamics, and tolerability of canagliflozin, a sodium glucose co-transporter 2 inhibitor, in healthy participants. Clin. Ther. 36 (5), 698–710. doi:10.1016/j.clinthera.2014.02.022
Dey H. M., Soufer R., Hoffer P., Wackers F. J., Black H. R. (1996). Comparison of nifedipine GITS and hydrochlorothiazide in the management of elderly patients with stage I-III diastolic hypertension. Am. J. Hypertens. 9 (6), 598–606. doi:10.1016/0895-7061(96)00168-9
Dézsi C. A. (2014). Differences in the clinical effects of angiotensin-converting enzyme inhibitors and angiotensin receptor blockers: A critical review of the evidence. Am. J. Cardiovasc. Drugs 14 (3), 167–173. doi:10.1007/s40256-013-0058-8
Digne-Malcolm H., Frise M. C., Dorrington K. L. (2016). How do antihypertensive drugs work? Insights from studies of the renal regulation of arterial blood pressure. Front. Physiol. 7, 320. doi:10.3389/fphys.2016.00320
Duarte J. D., Cooper-DeHoff R. M. (2010). Mechanisms for blood pressure lowering and metabolic effects of thiazide and thiazide-like diuretics. Expert Rev. cardiovasc. Ther. 8 (6), 793–802. doi:10.1586/erc.10.27
Dubach P., Myers J., Bonetti P., Schertler T., Froelicher V., Wagner D., et al. (2002). Effects of bisoprolol fumarate on left ventricular size, function, and exercise capacity in patients with heart failure: Analysis with magnetic resonance myocardial tagging. Am. Heart J. 143 (4), 676–683. doi:10.1067/mhj.2002.121269
Dudenbostel T., Glasser S. P. (2012). Effects of antihypertensive drugs on arterial stiffness. Cardiol. Rev. 20 (5), 259–263. doi:10.1097/CRD.0b013e31825d0a44
Fagher B., Henningsen N., Hulthén L., Katzman P., Thulin T. (1990). Antihypertensive and renal effects of enalapril and slow-release verapamil in essential hypertension. A double-blind, randomized study. Eur. J. Clin. Pharmacol. 39 (1), S41–S43. doi:10.1007/BF01409207
Fajemiroye J. O., da Cunha L. C., Saavedra-Rodrıguez R., Rodrigues K. L., Naves L. M., Mourão A. A., et al. (2018). Aging-induced biological changes and cardiovascular diseases. Biomed. Res. Int. 2018, 7156435. doi:10.1155/2018/7156435
Fares H., DiNicolantonio J. J., O'Keefe J. H., Lavie C. J. (2016). Amlodipine in hypertension: A first-line agent with efficacy for improving blood pressure and patient outcomes. Open Heart 3 (2), e000473. doi:10.1136/openhrt-2016-000473
Ferguson R. K., Vlasses P. H., Swanson B. N., Mojaverian P., Hichens M., Irvin J. D., et al. (1982). Effects of enalapril, a new converting enzyme inhibitor, in hypertension. Clin. Pharmacol. Ther. 32 (1), 48–53. doi:10.1038/clpt.1982.125
Ferlinz J. (1980). Right ventricular performance in essential hypertension. Circulation 61 (1), 156–162. doi:10.1161/01.cir.61.1.156
Fermé I., Djian J., Tcherdakoff P. (1990). Comparative study on monotherapy with sustained-release diltiazem 300 mg and enalapril 20 mg in mild to moderate arterial hypertension. J. Cardiovasc. Pharmacol. 16 (1), S46–S50. doi:10.1097/00005344-199000161-00009
Fouad F. M., Tarazi R. C., Bravo E. L., Textor S. C. (1984). Hemodynamic and antihypertensive effects of the new oral angiotensin-converting-enzyme inhibitor MK-421 (enalapril). Hypertension 6 (1), 167–174. doi:10.1161/01.hyp.6.2_pt_1.167
Frishman W. H. (2003). Cardiology patient page. Beta-adrenergic blockers. Circulation 107 (18), e117–e119. A2. doi:10.1161/01.CIR.0000070983.15903.A2
Fujimoto N., Onishi K., Dohi K., Tanabe M., Kurita T., Takamura T., et al. (2008). Hemodynamic characteristics of patients with diastolic heart failure and hypertension. Hypertens. Res. 31 (9), 1727–1735. doi:10.1291/hypres.31.1727
Gebremichael Y., Lahu G., Vakilynejad M., Hallow K. M. (2019). Benchmarking renin suppression and blood pressure reduction of direct renin inhibitor imarikiren through quantitative systems pharmacology modeling. J. Pharmacokinet. Pharmacodyn. 46 (1), 15–25. doi:10.1007/s10928-018-9612-y
González-Abraldes J., Albillos A., Bañares R., Del Arbol L. R., Moitinho E., Rodríguez C., et al. (2001). Randomized comparison of long-term losartan versus propranolol in lowering portal pressure in cirrhosis. Gastroenterology 121, 382–388. doi:10.1053/gast.2001.26288
Gradman A. H., Basile J. N., Carter B. L., Bakris G. L. (2010). Combination therapy in hypertension. J. Am. Soc. Hypertens. 4 (1), 42–50. doi:10.1016/j.jash.2010.02.005
Gradman A. H., Schmieder R. E., Lins R. L., Nussberger J., Chiang Y., Bedigian M. P. (2005). Aliskiren, a novel orally effective renin inhibitor, provides dose-dependent antihypertensive efficacy and placebo-like tolerability in hypertensive patients. Circulation 111 (8), 1012–1018. doi:10.1161/01.CIR.0000156466.02908.ED
Grignola J. C. (2011). Hemodynamic assessment of pulmonary hypertension. World J. Cardiol. 3 (1), 10–17. doi:10.4330/wjc.v3.i1.10
Guyton A. C., Coleman T. G., Granger H. J. (1972). Circulation: Overall regulation. Annu. Rev. Physiol. 34, 13–46. doi:10.1146/annurev.ph.34.030172.000305
Hall J. E. (2011). Guyton and Hall textbook of medical physiology. 12th edition. Philadelphia: Saunders Elsevier, 1091.
Hallow K. M., Boulton D. W., Penland R. C., Helmlinger G., Nieves E. H., van Raalte D. H., et al. (2020). Renal effects of dapagliflozin in people with and without diabetes with moderate or severe renal dysfunction: Prospective modeling of an ongoing clinical trial. J. Pharmacol. Exp. Ther. 375 (1), 76–91. doi:10.1124/jpet.120.000040
Hallow K. M., Gebremichael Y. (2017). A quantitative systems physiology model of renal function and blood pressure regulation: Model description. CPT. Pharmacometrics Syst. Pharmacol. 6, 383–392. doi:10.1002/psp4.12178
Hallow K. M., Lo A., Beh J., Rodrigo M., Ermakov S., Friedman S., et al. (2014). A model-based approach to investigating the pathophysiological mechanisms of hypertension and response to antihypertensive therapies: Extending the Guyton model. Am. J. Physiol. Regul. Integr. Comp. Physiol. 306 (9), R647–R662. doi:10.1152/ajpregu.00039.2013
Hallow K. M., Van Brackle C. H., Anjum S., Ermakov S. (2021). Cardiorenal systems modeling: Left ventricular hypertrophy and differential effects of antihypertensive therapies on hypertrophy regression. Front. Physiol. 12, 679930. doi:10.3389/fphys.2021.679930
Handler C. E. (1985). Cardiogenic shock. Postgrad. Med. J. 61 (718), 705–712. doi:10.1136/pgmj.61.718.705
Hayashi K., Wakino S., Sugano N., Ozawa Y., Homma K., Saruta T. (2007). Ca2+ channel subtypes and pharmacology in the kidney. Circ. Res. 100 (3), 342–353. doi:10.1161/01.RES.0000256155.31133.49
He F. J., Markandu N. D., MacGregor G. A. (2001). Importance of the renin system for determining blood pressure fall with acute salt restriction in hypertensive and normotensive whites. Hypertension 38 (3), 321–325. doi:10.1161/01.hyp.38.3.321
Higashi Y., Oshima T., Sasaki S., Nakano Y., Kambe M., Matsuura H., et al. (1998). Angiotensin-converting enzyme inhibition, but not calcium antagonism, improves a response of the renal vasculature to L-arginine in patients with essential hypertension. Hypertension 32, 16–24. doi:10.1161/01.hyp.32.1.16
Hillegass E. (2011). Essentials of cardiopulmonary physical therapy. 3th edition. St. Louis: Elsevier Saunders, 763.
Hindmarsh A. C., Brown P. N., Grant K. E., Lee S. L., Serban R., Shumaker D. E., et al. (2005). Sundials: Suite of nonlinear and differential/algebraic equation solvers. ACM Trans. Math. Softw. 31 (3), 363–396. doi:10.1145/1089014.1089020
Hollenberg S. M., Kavinsky C. J., Parrillo J. E. (1999). Cardiogenic shock. Ann. Intern. Med. 131 (1), 47–59. doi:10.7326/0003-4819-131-1-199907060-00010
Hoops S., Sahle S., Gauges R., Lee C., Pahle J., Simus N., et al. (2006). Copasi — A COmplex PAthway SImulator. Bioinformatics 22, 3067–3074. doi:10.1093/bioinformatics/btl485
Houlihan C. A., Allen T. J., Baxter A. L., Panangiotopoulos S., Casley D. J., Cooper M. E., et al. (2002). A low-sodium diet potentiates the effects of losartan in type 2 diabetes. Diabetes Care 25 (4), 663–671. doi:10.2337/diacare.25.4.663
Hu H., Zhang J., Wang Y., Tian Z., Liu D., Zhang G., et al. (2017). Impact of baseline blood pressure on the magnitude of blood pressure lowering by nifedipine gastrointestinal therapeutic system: Refreshing the wilder's principle. Drug Des. devel. Ther. 11, 3179–3186. doi:10.2147/DDDT.S143551
Hucka M., Bergmann F. T., Chaouiya C., Dräger A., Hoops S., Keating S. M., et al. (2019). The systems biology markup language (SBML): Language specification for level 3 version 2 core release 2. J. Integr. Bioinform. 16 (2), 20190021. doi:10.1515/jib-2019-0021
Ikeda L. S., Harm S. C., Arcuri K. E., Goldberg A. I., Sweet C. S. (1997). Comparative antihypertensive effects of losartan 50 mg and losartan 50 mg titrated to 100 mg in patients with essential hypertension. Blood Press. 6 (1), 35–43. doi:10.3109/08037059709086444
Irazola V. E., Gutierrez L., Bloomfield G., Carrillo-Larco R. M., Dorairaj P., Gaziano T., et al. (2016). Hypertension prevalence, awareness, treatment, and control in selected LMIC communities: Results from the NHLBI/UHG network of centers of excellence for chronic diseases. Glob. Heart 11 (1), 47–59. doi:10.1016/j.gheart.2015.12.008
International Consortium for Blood Pressure Genome-Wide Association Studies Ehret G. B., Munroe P. B., Rice K. M., Bochud M., Johnson A. D., Chasman D. I., et al. (2011). Genetic variants in novel pathways influence blood pressure and cardiovascular disease risk. Nature 478 (7367), 103–109. doi:10.1038/nature10405
Israili Z. H., Velasco M., Bermúdez V. (2010). Direct renin inhibitors as antihypertensive agents. Am. J. Ther. 17 (3), 237–254. doi:10.1097/MJT.0b013e3181c08096
Julius S., Amery A., Whitlock L. S., Conway J. (1967). Influence of age on the hemodynamic response to exercise. Circulation 36 (2), 222–230. doi:10.1161/01.cir.36.2.222
Kamel Boulos M. N., Zhang P. (2021). Digital twins: From personalised medicine to precision public health. J. Pers. Med. 11 (8), 745. doi:10.3390/jpm11080745
Karaaslan F., Denizhan Y., Hester R. (2014). A mathematical model of long-term renal sympathetic nerve activity inhibition during an increase in sodium intake. Am. J. Physiol. Regul. Integr. Comp. Physiol. 306, R234–R247. doi:10.1152/ajpregu.00302.2012
Karaaslan F., Denizhan Y., Kayserilioglu A., Gulcur H. O. (2005). Long-term mathematical model involving renal sympathetic nerve activity, arterial pressure, and sodium excretion. Ann. Biomed. Eng. 33, 1607–1630. doi:10.1007/s10439-005-5976-4
Kario K., Shimada K. (1997). Differential effects of amlodipine on ambulatory blood pressure in elderly hypertensive patients with different nocturnal reductions in blood pressure. Am. J. Hypertens. 10 (3), 261–268. doi:10.1016/s0895-7061(96)00409-8
Kearney P. M., Whelton M., Reynolds K., Muntner P., Whelton P. K., He J. (2005). Global burden of hypertension: Analysis of worldwide data. Lancet 365 (9455), 217–223. doi:10.1016/S0140-6736(05)17741-1
Klingensmith M. E., Vemuri C., Fayanju O. M., Robertson J. O., Samson P. P., Sanford D. E. (2016). The Washington manual of surgery. Seventh edition. St. Louis, Missouri: Wolters Kluwer, 984.
Koh K. K., Quon M. J., Han S. H., Chung W. J., Ahn J. Y., Seo Y. H., et al. (2004). Additive beneficial effects of losartan combined with simvastatin in the treatment of hypercholesterolemic, hypertensive patients. Circulation 110 (24), 3687–3692. doi:10.1161/01.CIR.0000143085.86697.13
Kolpakov F., Akberdin I., Kiselev I., Kolmykov S., Kondrakhin Y., Kulyashov M., et al. (2022). BioUML-towards a universal research platform. Nucleic Acids Res. 50 (W1), W124–W131. doi:10.1093/nar/gkac286
Kutumova E., Kiselev I., Sharipov R., Lifshits G., Kolpakov F. (2021). Thoroughly calibrated modular agent-based model of the human cardiovascular and renal systems for blood pressure regulation in health and disease. Front. Physiol. 12, 746300. doi:10.3389/fphys.2021.746300
Kutumova E., Zinovyev A., Sharipov R., Kolpakov F. (2013). Model composition through model reduction: A combined model of CD95 and NF-κB signaling pathways. BMC Syst. Biol. 7, 13. doi:10.1186/1752-0509-7-13
Kwakernaak A. J., Roksnoer L. C., Lambers Heerspink H. J., van den Berg-Garrelds I., Lochorn G. A., van Embden Andres J. H., et al. (2017). Effects of direct renin blockade on renal & systemic hemodynamics and on RAAS activity, in weight excess and hypertension: A randomized clinical trial. PLoS One 12 (1), e0169258. doi:10.1371/journal.pone.0169258
Lancaster S. G., Sorkin E. M. (1988). Bisoprolol. A preliminary review of its pharmacodynamic and pharmacokinetic properties, and therapeutic efficacy in hypertension and angina pectoris. Drugs 36 (3), 256–285. doi:10.2165/00003495-198836030-00002
Laragh J. H., Sealey J. E. (2011). The plasma renin test reveals the contribution of body sodium-volume content (V) and renin–angiotensin (R) vasoconstriction to long-term blood pressure. Am. J. Hypertens. 24 (11), 1164–1180. doi:10.1038/ajh.2011.171
Laskey W. K., Parker H. G., Ferrari V. A., Kussmaul W. G., Noordergraaf A. (1990). Estimation of total systemic arterial compliance in humans. J. Appl. Physiol. 69 (1), 112–119. doi:10.1152/jappl.1990.69.1.112
Lee H. Y., Chung W. J., Jeon H. K., Seo H. S., Choi D. J., Jeon E. S., et al. (2016). Impact of the β-1 adrenergic receptor polymorphism on tolerability and efficacy of bisoprolol therapy in Korean heart failure patients: Association between β adrenergic receptor polymorphism and bisoprolol therapy in heart failure (ABBA) study. Korean J. Intern. Med. 31 (2), 277–287. doi:10.3904/kjim.2015.043
Lee S. E., Kim Y. J., Lee H. Y., Yang H. M., Park C. G., Kim J. J., et al. (2012). Efficacy and tolerability of fimasartan, a new angiotensin receptor blocker, compared with losartan (50/100 mg): A 12-week, phase III, multicenter, prospective, randomized, double-blind, parallel-group, dose escalation clinical trial with an optional 12-week extension phase in adult Korean patients with mild-to-moderate hypertension. Clin. Ther. 34 (3), 552–568. e1–e9. doi:10.1016/j.clinthera.2012.01.024
Leeman M., van de Borne P., Collart F., Vandenhoven G., Peeters L., Mélot C., et al. (1993). Bisoprolol and atenolol in essential hypertension: Effects on systemic and renal hemodynamics and on ambulatory blood pressure. J. Cardiovasc. Pharmacol. 22 (6), 785–791. doi:10.1097/00005344-199312000-00002
Lehrach H. (2016). Omics approaches to individual variation: Modeling networks and the virtual patient. Dialogues Clin. Neurosci. 18 (3), 253–265. doi:10.31887/DCNS.2016.18.3/hlehrach
Leth A. (1970). Changes in plasma and extracellular fluid volumes in patients with essential hypertension during long-term treatment with hydrochlorothiazide. Circulation 42, 479–485. doi:10.1161/01.cir.42.3.479
Licata G., Scaglione R., Ganguzza A., Parrinello G., Costa R., Merlino G., et al. (1993). Effects of amlodipine on renal haemodynamics in mild to moderate hypertensive patients. A randomized controlled study versus placebo. Eur. J. Clin. Pharmacol. 45, 307–311. doi:10.1007/BF00265946
Lijnen P., Fagard R., Staessen J., Amery A. (1981). Effect of chronic diuretic treatment on the plasma renin-angiotensin-aldosterone system in essential hypertension. Br. J. Clin. Pharmacol. 12 (3), 387–392. doi:10.1111/j.1365-2125.1981.tb01231.x
Lithell H., Selinus I., Hosie J., Frithz G., Weiner L. (1987). Efficacy and safety of bisoprolol and atenolol in patients with mild to moderate hypertension: A double-blind, parallel group international multicentre study. Eur. Heart J. 8 (1), 55–64. doi:10.1093/eurheartj/8.suppl_m.55-a
Little W. C., Zile M. R., Klein A., Appleton C. P., Kitzman D. W., Wesley-Farrington D. J. (2006). Effect of losartan and hydrochlorothiazide on exercise tolerance in exertional hypertension and left ventricular diastolic dysfunction. Am. J. Cardiol. 98 (3), 383–385. doi:10.1016/j.amjcard.2006.01.106
Luft F. C. (2001). Twins in cardiovascular genetic research. Hypertension 37, 350–356. doi:10.1161/01.hyp.37.2.350
Macal C. M., North M. J. (2010). Tutorial on agent-based modelling and simulation. J. Simul. 4, 151–162. doi:10.1057/jos.2010.3
MacKay J. H., Arcuri K. E., Goldberg A. I., Snapinn S. M., Sweet C. S. (1996). Losartan and low-dose hydrochlorothiazide in patients with essential hypertension. A double-blind, placebo-controlled trial of concomitant administration compared with individual components. Arch. Intern. Med. 156 (3), 278–285. doi:10.1001/archinte.1996.00440030072009
Malik-Sheriff R. S., Glont M., Nguyen T. V. N., Tiwari K., Roberts M. G., Xavier A., et al. (2020). BioModels-15 years of sharing computational models in life science. Nucleic Acids Res. 48 (D1), D407–D415. doi:10.1093/nar/gkz1055
Mallion J. M. (2007). An evaluation of the initial and long-term antihypertensive efficacy of zofenopril compared with enalapril in mild to moderate hypertension. Blood Press. Suppl. 2, 13–18. doi:10.1080/08038020701561703
Martina B., Dieterle T., Weinbacher M., Battegay E. (1999). Effects of losartan titrated to Losartan/Hydrochlorothiazide and amlodipine on left ventricular mass in patients with mild-to-moderate hypertension. A double-blind randomized controlled study. Cardiology 92 (2), 110–114. doi:10.1159/000006957
McInnes G. T. (2007). Renin inhibition: The holy grail of renin-angiotensin system blockade? J. Hum. Hypertens. 21 (10), 766–769. doi:10.1038/sj.jhh.1002221
McMurray J. J. V., Pitt B., Latini R., Maggioni A. P., Solomon S. D., Keefe D. L., et al. (2008). Effects of the oral direct renin inhibitor aliskiren in patients with symptomatic heart failure. Circ. Heart Fail. 1 (1), 17–24. doi:10.1161/CIRCHEARTFAILURE.107.740704
Melenovsky V., Borlaug B. A., Rosen B., Hay I., Ferruci L., Morell C. H., et al. (2007). Cardiovascular features of heart failure with preserved ejection fraction versus nonfailing hypertensive left ventricular hypertrophy in the urban baltimore community: The role of atrial remodeling/dysfunction. J. Am. Coll. Cardiol. 49 (2), 198–207. doi:10.1016/j.jacc.2006.08.050
Morales E., Caro J., Gutierrez E., Sevillano A., Auñón P., Fernandez C., et al. (2015). Diverse diuretics regimens differentially enhance the antialbuminuric effect of renin-angiotensin blockers in patients with chronic kidney disease. Kidney Int. 88 (6), 1434–1441. doi:10.1038/ki.2015.249
Mureddu G. F., de Simone G., Greco R., Rosato G. F., Contaldo F. (1997). Left ventricular filling in arterial hypertension. Influence of obesity and hemodynamic and structural confounders. Hypertension 29 (2), 544–550. doi:10.1161/01.hyp.29.2.544
Nadler S. B., Hidalgo J. U., Bloch T. (1962). Prediction of blood volume in normal human adults. Surgery 51, 224–232.
Nakano Y., Oshima T., Watanabe M., Matsuura H., Kajiyama G., Kambe M. (1997). Angiotensin I-converting enzyme gene polymorphism and acute response to captopril in essential hypertension. Am. J. Hypertens. 10 (1), 1064–1068. doi:10.1016/s0895-7061(97)00279-3
Naritomi H., Fujita T., Ito S., Ogihara T., Shimada K., Shimamoto K., et al. (2008). Efficacy and safety of long-term losartan therapy demonstrated by a prospective observational study in Japanese patients with hypertension: The Japan hypertension evaluation with angiotensin II antagonist losartan therapy (J-HEALTH) study. Hypertens. Res. 31 (2), 295–304. doi:10.1291/hypres.31.295
Narkiewicz K. (2007). Comparison of home and office blood pressure in hypertensive patients treated with zofenopril or losartan. Blood Press. Suppl. 1, 7–12. doi:10.1080/08038020701561687
Nathan A. T., Singer M. (1999). The oxygen trail: Tissue oxygenation. Br. Med. Bull. 55 (1), 96–108. doi:10.1258/0007142991902312
Nedogoda S. V., Konradi A. O., Zvartau N. E., Chumachek E. V., Ledyaeva A. A., Tsoma V. V., et al. (2017). Optimization of BP control and arterial elasticity with fixed combination therapy perindopril and amlodipine in patients with arterial hypertension and increased pulse wave velocity. Kardiologiia 57 (3), 31–38.
Nedogoda S. V., Ledyaeva A. A., Chumachok E. V., Tsoma V. V., Mazina G., Salasyuk A. S., et al. (2013). Randomized trial of perindopril, enalapril, losartan and telmisartan in overweight or obese patients with hypertension. Clin. Drug Investig. 33 (8), 553–561. doi:10.1007/s40261-013-0094-9
Nussberger J., Gradman A. H., Schmieder R. E., Lins R. L., Chiang Y., Prescott M. F. (2007). Plasma renin and the antihypertensive effect of the orally active renin inhibitor aliskiren in clinical hypertension. Int. J. Clin. Pract. 61 (9), 1461–1468. doi:10.1111/j.1742-1241.2007.01473.x
Nussberger J., Wuerzner G., Jensen C., Brunner H. R. (2002). Angiotensin II suppression in humans by the orally active renin inhibitor aliskiren (SPP100): Comparison with enalapril. Hypertension 39 (1), E1–E8. doi:10.1161/hy0102.102293
O'Rourke M. (1990). Arterial stiffness, systolic blood pressure, and logical treatment of arterial hypertension. Hypertension 15 (4), 339–347. doi:10.1161/01.hyp.15.4.339
Ogunyankin K. O., Day A. G. (2009). Successful treatment of hypertension accounts for improvements in markers of diastolic function – A pilot study comparing hydrochlorothiazide-based and amlodipine-based treatment strategies. Can. J. Cardiol. 25 (12), e406–e412. doi:10.1016/s0828-282x(09)70534-3
Okada Y., Shibata S., Fujimoto N., Best S. A., Levine B. D., Fu Q. (2017). Long-term effects of a renin inhibitor versus a thiazide diuretic on arterial stiffness and left ventricular diastolic function in elderly hypertensive patients. Am. J. Physiol. Regul. Integr. Comp. Physiol. 313 (4), R400–R409. doi:10.1152/ajpregu.00125.2017
Ono M., Fukuda M., Miura T., Mizuno M., Kato Y., Sato R., et al. (2012). Predictors of proteinuria reduction by monotherapy with an angiotensin receptor blocker, olmesartan. J. Renin. Angiotensin. Aldosterone. Syst. 13 (2), 239–243. doi:10.1177/1470320311434817
Oparil S., Abate N., Chen E., Creager M. A., Galet V., Jia G., et al. (2008). A double-blind, randomized study evaluating losartan potassium monotherapy or in combination with hydrochlorothiazide versus placebo in obese patients with hypertension. Curr. Med. Res. Opin. 24 (4), 1101–1114. doi:10.1185/030079908x280716
Oparil S., Acelajado M. C., Bakris G. L., Berlowitz D. R., Cífková R., Dominiczak A. F., et al. (2018). Hypertension. Nat. Rev. Dis. Prim. 4, 18014. doi:10.1038/nrdp.2018.14
Oparil S., Barr E., Elkins M., Liss C., Vrecenak A., Edelman J. (1996). Efficacy, tolerability, and effects on quality of life of losartan, alone or with hydrochlorothiazide, versus amlodipine, alone or with hydrochlorothiazide, in patients with essential hypertension. Clin. Ther. 18 (4), 608–625. doi:10.1016/s0149-2918(96)80212-8
Ottesen J. T., Olufsen M. S., Larsen J. K. (2004). Applied mathematical models in human physiology. Philadelphia: SIAM, 234.
Oyama M. A. (2015). “Chapter 38 - mechanisms of heart failure,” in Small animal critical care medicine. Editors D. C. Silverstein, and K. Hopper. Second edition (Elsevier Saunders), 205–209. doi:10.1016/B978-1-4557-0306-7.00038-6
Paeme S., Moorhead K. T., Chase J. G., Lambermont B., Kolh P., D'orio V., et al. (2011). Mathematical multi-scale model of the cardiovascular system including mitral valve dynamics. Application to ischemic mitral insufficiency. Biomed. Eng. Online 10, 86. doi:10.1186/1475-925X-10-86
Pagani E. D., Alousi A. A., Grant A. M., Older T. M., Dziuban S. W., Allen P. D. (1988). Changes in myofibrillar content and Mg-ATPase activity in ventricular tissues from patients with heart failure caused by coronary artery disease, cardiomyopathy, or mitral valve insufficiency. Circ. Res. 63 (2), 380–385. doi:10.1161/01.res.63.2.380
Palmieri E. A., Fazio S., Palmieri V., Lombardi G., Biondi B. (2004). Myocardial contractility and total arterial stiffness in patients with overt hyperthyroidism: Acute effects of beta1-adrenergic blockade. Eur. J. Endocrinol. 150 (6), 757–762. doi:10.1530/eje.0.1500757
Pappalardo F., Russo G., Tshinanu F. M., Viceconti M. (2019). In silico clinical trials: Concepts and early adoptions. Brief. Bioinform. 20 (5), 1699–1708. doi:10.1093/bib/bby043
Pareek A. K., Messerli F. H., Chandurkar N. B., Dharmadhikari S. K., Godbole A. V., Kshirsagar P. P., et al. (2016). Efficacy of low-dose chlorthalidone and hydrochlorothiazide as assessed by 24-h ambulatory blood pressure monitoring. J. Am. Coll. Cardiol. 67 (4), 379–389. doi:10.1016/j.jacc.2015.10.083
Parrinello G., Paterna S., Torres D., Di Pasquale P., Mezzero M., La Rocca G., et al. (2009). One-year renal and cardiac effects of bisoprolol versus losartan in recently diagnosed hypertensive patients: A randomized, double-blind study. Clin. Drug Investig. 29 (9), 591–600. doi:10.2165/11315250-000000000-00000
Patel R. S., Masi S., Taddei S. (2017). Understanding the role of genetics in hypertension. Eur. Heart J. 38 (29), 2309–2312. doi:10.1093/eurheartj/ehx273
Paterna S., Parrinello G., Di Pasquale P., Torres D., La Rocca G., Antona R., et al. (2007). Medium-term effects of bisoprolol administration on renal hemodynamics and function in mild to moderate essential hypertension. Adv. Ther. 24 (6), 1260–1270. doi:10.1007/BF02877772
Paterna S., Parrinello G., Scaglione R., Costa R., Bova A., Palumbo V. A., et al. (2000). Effect of long-term losartan administration on renal haemodynamics and function in hypertensive patients. Cardiovasc. Drugs Ther. 14 (5), 529–532. doi:10.1023/a:1007845324117
Persson F., Rossing P., Reinhard H., Juhl T., Stehouwer C. D. A., Schalkwijk C., et al. (2009). Renal effects of aliskiren compared with and in combination with irbesartan in patients with type 2 diabetes, hypertension, and albuminuria. Diabetes Care 32 (10), 1873–1879. doi:10.2337/dc09-0168
Picca M., Bisceglia J., Zocca A., Pelosi G. (1997). Effects of enalapril and amlodipine on left ventricular hypertrophy and function in essential hypertension. Clin. Drug Investig. 13 (1), 29–35. doi:10.2165/00044011-199700131-00007
Pitt B., Latini R., Maggioni A. P., Solomon S. D., Smith B. A., Wright M., et al. (2011). Neurohumoral effects of aliskiren in patients with symptomatic heart failure receiving a mineralocorticoid receptor antagonist: The aliskiren observation of heart failure treatment study. Eur. J. Heart Fail. 13 (7), 755–764. doi:10.1093/eurjhf/hfr034
Pool J. L., Schmieder R. E., Azizi M., Aldigier J. C., Januszewicz A., Zidek W., et al. (2007). Aliskiren, an orally effective renin inhibitor, provides antihypertensive efficacy alone and in combination with valsartan. Am. J. Hypertens. 20 (1), 11–20. doi:10.1016/j.amjhyper.2006.06.003
Porthan K., Viitasalo M., Hiltunen T. P., Vaananen H., Dabek J., Suonsyrja T., et al. (2009). Short-term electrophysiological effects of losartan, bisoprolol, amlodipine, and hydrochlorothiazide in hypertensive men. Ann. Med. 41 (1), 29–37. doi:10.1080/07853890802195211
Proshin A. P., Solodyannikov Y. V. (2006). Mathematical modeling of blood circulation system and its practical application. Autom. Remote Control 67, 329–341. doi:10.1134/S000511790602010X
Puig J. G., Calvo C., Luurila O., Luurila H., Sulosaari S., Strandberg A., et al. (2007). Lercanidipine, enalapril and their combination in the treatment of elderly hypertensive patients: Placebo-controlled, randomized, crossover study with four ABPM. J. Hum. Hypertens. 21 (12), 917–924. doi:10.1038/sj.jhh.1002248
Rapoport R. M., Soleimani M. (2019). Mechanism of thiazide diuretic arterial pressure reduction: The search continues. Front. Pharmacol. 10, 815. doi:10.3389/fphar.2019.00815
Reams G. P., Lau A., Hamory A., Bauer J. H. (1987). Amlodipine therapy corrects renal abnormalities encountered in the hypertensive state. Am. J. Kidney Dis. 10 (6), 446–451. doi:10.1016/s0272-6386(87)80191-9
Roman M. J., Alderman M. H., Pickering T. G., Pini R., Keating J. O., Sealey J. E., et al. (1998). Differential effects of angiotensin converting enzyme inhibition and diuretic therapy on reductions in ambulatory blood pressure, left ventricular mass, and vascular hypertrophy. Am. J. Hypertens. 11 (1), 387–396. doi:10.1016/s0895-7061(97)00492-5
Rosalina T. T., Bouwman R. A., van Sambeek M. R. H. M., van de Vosse F. N., Bovendeerd P. H. M. (2019). A mathematical model to investigate the effects of intravenous fluid administration and fluid loss. J. Biomech. 88, 4–11. doi:10.1016/j.jbiomech.2019.03.002
Runarsson T. P., Yao X. (2000). Stochastic ranking for constrained evolutionary optimization. IEEE Trans. Evol. Comput. 4, 284–294. doi:10.1109/4235.873238
Saltin B. (1969). Physiological effects of physical conditioning. Med. Sci. Sports Exerc. 1 (1), 50–56. doi:10.1249/00005768-196903000-00011
Sarafidis P. A., Georgianos P., Bakris G. L. (2013). Resistant hypertension – its identification and epidemiology. Nat. Rev. Nephrol. 9 (1), 51–58. doi:10.1038/nrneph.2012.260
Savvatis K., Westermann D., Schultheiss H. P., Tschöpe C. (2010). First-line treatment of hypertension: Critical appraisal of potential role of aliskiren and hydrochlorothiazide in a fixed combination. Integr. Blood Press. Control 3, 163–170. doi:10.2147/IBPC.S13448
Scaglione R., Ganguzza A., Corrao S., Costa R., Paternà S., Cannavo M. G., et al. (1995). Effects of cilazapril on renal haemodynamics and function in hypertensive patients: A randomised controlled study versus hydrochlorothiazide. Blood Press. 4, 363–368. doi:10.3109/08037059509077622
Scaglione R., Indovina A., Parrinello G., Lipari R., Mulè L. G., Ganguzza A., et al. (1992). Antihypertensive efficacy and effects of nitrendipine on cardiac and renal hemodynamics in mild to moderate hypertensive patients: Randomized controlled trial versus hydrochlorothiazide. Cardiovasc. Drugs Ther. 6, 141–146. doi:10.1007/BF00054562
Schattke S., Xing Y., Lock J., Brechtel L., Schroeckh S., Spethmann S., et al. (2014). Increased longitudinal contractility and diastolic function at rest in well-trained amateur marathon runners: A speckle tracking echocardiography study. Cardiovasc. Ultrasound 12, 11. doi:10.1186/1476-7120-12-11
Serg M., Graggaber J., Kampus P., Zagura M., Kals J., Mäki-Petäjä K., et al. (2014). Value of haemodynamic profiling to the response of antihypertensive therapy. Artery Res. 8 (4), 189–196. doi:10.1016/j.artres.2014.07.004
Shah S., Khatri I., Freis E. D. (1978). Mechanism of antihypertensive effect of thiazide diuretics. Am. Heart J. 95 (5), 611–618. doi:10.1016/0002-8703(78)90303-4
Sica D. A., Gehr T. W., Ghosh S. (2005). Clinical pharmacokinetics of losartan. Clin. Pharmacokinet. 44 (8), 797–814. doi:10.2165/00003088-200544080-00003
Siddiqi L., Oey P. L., Blankestijn P. J. (2011). Aliskiren reduces sympathetic nerve activity and blood pressure in chronic kidney disease patients. Nephrol. Dial. Transpl. 26, 2930–2934. doi:10.1093/ndt/gfq857
Simon G., Morioka S., Snyder D. K., Cohn J. N. (1983). Increased renal plasma flow in long-term enalapril treatment of hypertension. Clin. Pharmacol. Ther. 34 (4), 459–465. doi:10.1038/clpt.1983.198
Soheilypour M., Mofrad M. R. K. (2018). Agent-based modeling in molecular systems biology. Bioessays 40 (7), e1800020. doi:10.1002/bies.201800020
Solomon S. D., Appelbaum E., Manning W. J., Verma A., Berglund T., Lukashevich V., et al. (2009). Effect of the direct Renin inhibitor aliskiren, the Angiotensin receptor blocker losartan, or both on left ventricular mass in patients with hypertension and left ventricular hypertrophy. Circulation 119 (4), 530–537. doi:10.1161/CIRCULATIONAHA.108.826214
Solomon S. D., Shin S. H., Shah A., Skali H., Desai A., Kober L., et al. (2011). Effect of the direct renin inhibitor aliskiren on left ventricular remodelling following myocardial infarction with systolic dysfunction. Eur. Heart J. 32 (10), 1227–1234. doi:10.1093/eurheartj/ehq522
Stanton A., Jensen C., Nussberger J., O'Brien E. (2003). Blood pressure lowering in essential hypertension with an oral renin inhibitor, aliskiren. Hypertension 42, 1137–1143. doi:10.1161/01.HYP.0000101688.17370.87
Stefanadis C., Manolis A., Dernellis J., Tsioufis C., Tsiamis E., Gavras I., et al. (2001). Acute effect of clonidine on left ventricular pressure-volume relation in hypertensive patients with diastolic heart dysfunction. J. Hum. Hypertens. 15 (9), 635–642. doi:10.1038/sj.jhh.1001243
Sun F., Song Y., Liu J., Ma L. J., Shen Y., Huang J., et al. (2016). Efficacy of losartan for improving insulin resistance and vascular remodeling in hemodialysis patients. Hemodial. Int. 20 (1), 22–30. doi:10.1111/hdi.12327
Suojanen L., Haring A., Tikkakoski A., Koskela J. K., Tahvanainen A. M., Huhtala H., et al. (2017). Haemodynamic influences of bisoprolol in hypertensive middle-aged men: A double-blind, randomized, placebo-controlled cross-over study. Basic Clin. Pharmacol. Toxicol. 121, 130–137. doi:10.1111/bcpt.12771
Tamargo J., Segura J., Ruilope L. M. (2014). Diuretics in the treatment of hypertension. Part 1: Thiazide and thiazide-like diuretics. Expert Opin. Pharmacother. 15 (4), 527–547. doi:10.1517/14656566.2014.879118
Tanaka K., Yoshimura T., Sumida S., Mitsuzono R., Tanaka S., Konishi Y., et al. (1986). Transient responses in cardiac function below, at, and above anaerobic threshold. Eur. J. Appl. Physiol. Occup. Physiol. 55 (4), 356–361. doi:10.1007/BF00422733
Tejada T., Fornoni A., Lenz O., Materson B. J. (2006). Nonpharmacologic therapy for hypertension: Does it really work? Curr. Cardiol. Rep. 8 (6), 418–424. doi:10.1007/s11886-006-0099-6
Tham T. C., Herity N., Guy S., Silke B. (1993). Haemodynamic comparison of amlodipine and atenolol in essential hypertension using the quantascope. Br. J. Clin. Pharmacol. 36 (6), 555–560. doi:10.1111/j.1365–2125.1993.tb00414.x
Thomson D. A. (1971). Cardiac output during positive and negative work. Scand. J. Clin. Lab. Invest. 27 (3), 193–200. doi:10.3109/00365517109080207
Tsai W. C., Huang Y. Y., Liu Y. W., Shih J. Y., Lin C. C., Tsai L. M. (2012). Changes of left atrial phasic function assessed by speckle tracking echocardiography in untreated hypertension. J. Med. Ultrasound 20 (4), 220–227. doi:10.1016/j.jmu.2012.10.010
Unniachan S., Wu D., Rajagopalan S., Hanson M. E., Fujita K. P. (2014). Evaluation of blood pressure reduction response and responder characteristics to fixed-dose combination treatment of amlodipine and losartan: A post hoc analysis of pooled clinical trials. J. Clin. Hypertens. 16 (9), 671–677. doi:10.1111/jch.12390
Uttamsingh R. J., Leaning M. S., Bushman J. A., Carson E. R., Finkelstein L. (1985). Mathematical model of the human renal system. Med. Biol. Eng. Comput. 23, 525–535. doi:10.1007/BF02455306
van Brummelen P., Schalekamp M. A. (1980). Hemodynamic changes during long-term thiazide treatment of essential hypertension in responders and nonresponders. Clin. Pharmacol. Ther. 27 (3), 328–336. doi:10.1038/clpt.1980.44
van Brummelen P., Schalekamp M., de Graeff J. (1978). Influence of sodium intake on hydrochlorothiazide-induced changes in blood pressure, serum electrolytes, renin and aldosterone in essential hypertension. Acta Med. Scand. 204 (3), 151–157. doi:10.1111/j.0954-6820.1978.tb08417.x
van Brummelen P., Woerlee M., Schalekamp M. A. (1979). Long-term versus short-term effects of hydrochlorothiazide on renal haemodynamics in essential hypertension. Clin. Sci. 56 (5), 463–469. doi:10.1042/cs0560463
van Campen J. S. J. A., de Boer K., van de Veerdonk M. C., van der Bruggen C. E. E., Allaart C. P., Raijmakers P. G., et al. (2016). Bisoprolol in idiopathic pulmonary arterial hypertension: An explorative study. Eur. Respir. J. 48 (3), 787–796. doi:10.1183/13993003.00090-2016
Varounis C., Katsi V., Nihoyannopoulos P., Lekakis J., Tousoulis D. (2017). Cardiovascular hypertensive crisis: Recent evidence and review of the literature. Front. Cardiovasc. Med. 3, 51. doi:10.3389/fcvm.2016.00051
Vieira S. S., Lemes B., de T C de Carvalho P., N de Lima R., Bocalini D. S., Junior J. A. S., et al. (2016). Does stroke volume increase during an incremental exercise? A systematic review. Open cardiovasc. Med. J. 10, 57–63. doi:10.2174/1874192401610010057
Villamil A., Chrysant S. G., Calhoun D., Schober B., Hsu H., Matrisciano-Dimichino L., et al. (2007). Renin inhibition with aliskiren provides additive antihypertensive efficacy when used in combination with hydrochlorothiazide. J. Hypertens. 25, 217–226. doi:10.1097/HJH.0b013e3280103a6b
Vogt L., Waanders F., Boomsma F., de Zeeuw D., Navis G. (2008). Effects of dietary sodium and hydrochlorothiazide on the antiproteinuric efficacy of losartan. J. Am. Soc. Nephrol. 19 (5), 999–1007. doi:10.1681/ASN.2007060693
Warburton D. E. R., Haykowsky M. J., Quinney H. A., Blackmore D., Teo K. K., Humen D. P. (2002). Myocardial response to incremental exercise in endurance-trained athletes: Influence of heart rate, contractility and the frank-starling effect. Exp. Physiol. 87 (5), 613–622. doi:10.1113/eph8702372
Weber M. A., Byyny R. L., Pratt J. H., Faison E. P., Snavely D. B., Goldberg A. I., et al. (1995). Blood pressure effects of the angiotensin II receptor blocker, losartan. Arch. Intern. Med. 155 (4), 405–411. doi:10.1001/archinte.1995.00430040081010
Weber M. A., Jamerson K., Bakris G. L., Weir M. R., Zappe D., Zhang Y., et al. (2013). Effects of body size and hypertension treatments on cardiovascular event rates: Subanalysis of the ACCOMPLISH randomised controlled trial. Lancet 381 (9866), 537–545. doi:10.1016/S0140-6736(12)61343-9
Wiggins K. J., Kelly D. J. (2009). Aliskiren: A novel renoprotective agent or simply an alternative to ACE inhibitors? Kidney Int. 76 (1), 23–31. doi:10.1038/ki.2009.105
Williams B., Mancia G., Spiering W., Agabiti Rosei E., Azizi M., Burnier M., et al. (2018). 2018 ESC/ESH Guidelines for the management of arterial hypertension. Eur. Heart J. 39 (33), 3021–3104. doi:10.1093/eurheartj/ehy339
Wing L. M. H., Arnolda L. F., Upton J., Molloy D. (2003). Candesartan and hydrochlorothiazide in isolated systolic hypertension. Blood Press. 12 (4), 246–254. doi:10.1080/08037050310014954
Wood J. M., Maibaum J., Rahuel J., Grütter M. G., Cohen N. C., Rasetti V., et al. (2003). Structure-based design of aliskiren, a novel orally effective renin inhibitor. Biochem. Biophys. Res. Commun. 308 (4), 698–705. doi:10.1016/s0006-291x(03)01451-7
Wright S. P., Moayedi Y., Foroutan F., Agarwal S., Paradero G., Alba A. C., et al. (2017). Diastolic pressure difference to classify pulmonary hypertension in the assessment of heart transplant candidates. Circ. Heart Fail. 10, e004077. doi:10.1161/CIRCHEARTFAILURE.117.004077
Wu T., Zheng L., Zhang S., Duan L., Ma J., Zha L., et al. (2022). Left ventricular long-axis ultrasound strain (GLS) is an ideal indicator for patients with anti-hypertension treatment. Clin. Exp. Hypertens. 44 (1), 20–25. doi:10.1080/10641963.2021.1969663
Yamamoto K., Ozaki H., Takayasu K., Akehi N., Fukui S., Sakai A., et al. (2011). The effect of losartan and amlodipine on left ventricular diastolic function and atherosclerosis in Japanese patients with mild-to-moderate hypertension (J-ELAN) study. Hypertens. Res. 34 (3), 325–330. doi:10.1038/hr.2010.237
Zhang J., Chen J., Cheong B., Pednekar A., Muthupillai R. (2019). High frame rate cardiac cine MRI for the evaluation of diastolic function and its direct correlation with echocardiography. J. Magn. Reson. Imaging 50 (5), 1571–1582. doi:10.1002/jmri.26791
Zhang K., Huang F., Chen J., Cai Q., Wang T., Zou R., et al. (2014). Independent influence of overweight and obesity on the regression of left ventricular hypertrophy in hypertensive patients: A meta-analysis. Med. Baltim. 93 (25), e130. doi:10.1097/MD.0000000000000130
Keywords: mathematical modeling, agent-based modular model, antihypertensive therapy, cardiovascular system, renal system, blood pressure regulation
Citation: Kutumova E, Kiselev I, Sharipov R, Lifshits G and Kolpakov F (2022) Mathematical modeling of antihypertensive therapy. Front. Physiol. 13:1070115. doi: 10.3389/fphys.2022.1070115
Received: 14 October 2022; Accepted: 29 November 2022;
Published: 14 December 2022.
Edited by:
Ahsan H. Khandoker, Khalifa University, United Arab EmiratesReviewed by:
Luis Miguel Ruilope, University Hospital October 12, SpainBradley John Roth, Oakland University, United States
Copyright © 2022 Kutumova, Kiselev, Sharipov, Lifshits and Kolpakov. This is an open-access article distributed under the terms of the Creative Commons Attribution License (CC BY). The use, distribution or reproduction in other forums is permitted, provided the original author(s) and the copyright owner(s) are credited and that the original publication in this journal is cited, in accordance with accepted academic practice. No use, distribution or reproduction is permitted which does not comply with these terms.
*Correspondence: Elena Kutumova, ZWxlbmEua3V0dW1vdmFAYmlvdW1sLm9yZw==